1. Introduction
Coffee is one of the largest globally traded commodities and basic products exported by developing countries [
1]. Because of its sensorial attributes, including aroma, body, and reputation, Colombian coffee has become a highly differentiated product worldwide [
2,
3]. The market for this type of product is constantly growing, driven by changes in consumer preferences [
4].
The recent report by the International Coffee Organization (ICO) indicates that coffee production in Colombia in 2018–2019 was 13,858,000 60 kg bags, with internal consumption of 1,297,000 60 kg bags [
5]. With regard to this, Euromonitor’s projections indicate that the coffee business in Colombia will grow to
$1.93 billion in 2023, that is, 26% more than the 2018 figures, which reached
$1.52 billion [
6]. In the Tolima department in Colombia, agriculture is one of the main economic activities, with the coffee sector contributing about 3.9% of the departmental GDP [
7].
Specialty coffees are characterized as being products with outstanding quality attributes and are generally destined for specialized markets where their prices can reach up to six times those of traditional coffees [
8]. In this exclusive market, the coffee’s sensory qualities are significant and valuable; once the coffee beans are harvested, the quality is dependent on post-harvest conditions [
9], normally provided by both the farm’s infrastructure and the farmer’s practices.
It is important to understand whether the mixed profile of an agricultural productive unit given by the farm’s infrastructure and the farmer’s practices in the post-harvest stage is related to coffee quality. The aims of this work were as follows: (a) define a method to categorize special coffee farmers in accordance with the matrix farmer–farm profile; (b) explore and identify the unique characteristics of special coffees in the Tolima region of Colombia; and (c) determine the relation between a farmer’s category and coffee quality.
Because there are complex interactions among the factors that influence coffee cup quality, many investigations are currently focused on determining the manner in which these factors affect each producing region, exploring beyond the productivity of the crop. One of the factors that has been shown to influence the quality of coffee is the variety as it determines the chemical composition of the beans, and this, in turn, is affected by the environmental conditions where the crop is established [
9,
10,
11,
12,
13,
14,
15]. Regarding the environment, there is consensus in the studies that explain that altitude and climate are factors that affect cup quality [
11,
16,
17]. Other studies have emphasized that the type of processing process also influences the quality of the coffee [
18,
19,
20].
The literature regarding the sensorial quality of coffee as a characterization or classification criterion focused on the study of the interactions of environment, variety, and processing [
11,
19,
21] that aim at streamlining processes, techniques, and consequently the decision-making process regarding the type of infrastructure required to produce quality coffee. Moreover, the works of research on sustainable coffee-growing practices adopted an environmental approach, such as the implementation of good agricultural practices, certifications, and studies on the socioeconomic features of coffee growers [
22,
23,
24,
25]. However, the efficiency of modern technology transfer processes that, due to private or sectorial policy initiatives, are oriented toward the sustainability and competitiveness of this productive sector needs to be boosted. In light of this and in order to seize the opportunities offered by specialized international markets, we should consider the studies that address the sensorial quality and working conditions of agricultural productive units to generate profiles of the beneficiaries that favor differentiated intervention actions in the area.
In the present study, a classification model for specialty coffee producers was defined on the basis of the characteristics of their on-farm installation and the producer by employing a multi-criteria decision tool (analysis hierarchical process—AHP) in combination with the statistical analysis of the results of the sensory characterization of their produced coffees.
2. Materials and Methods
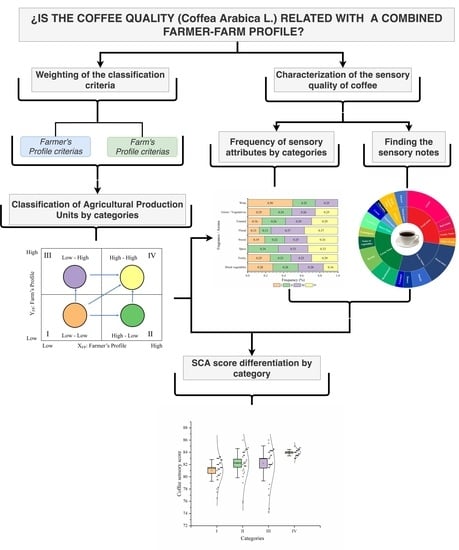
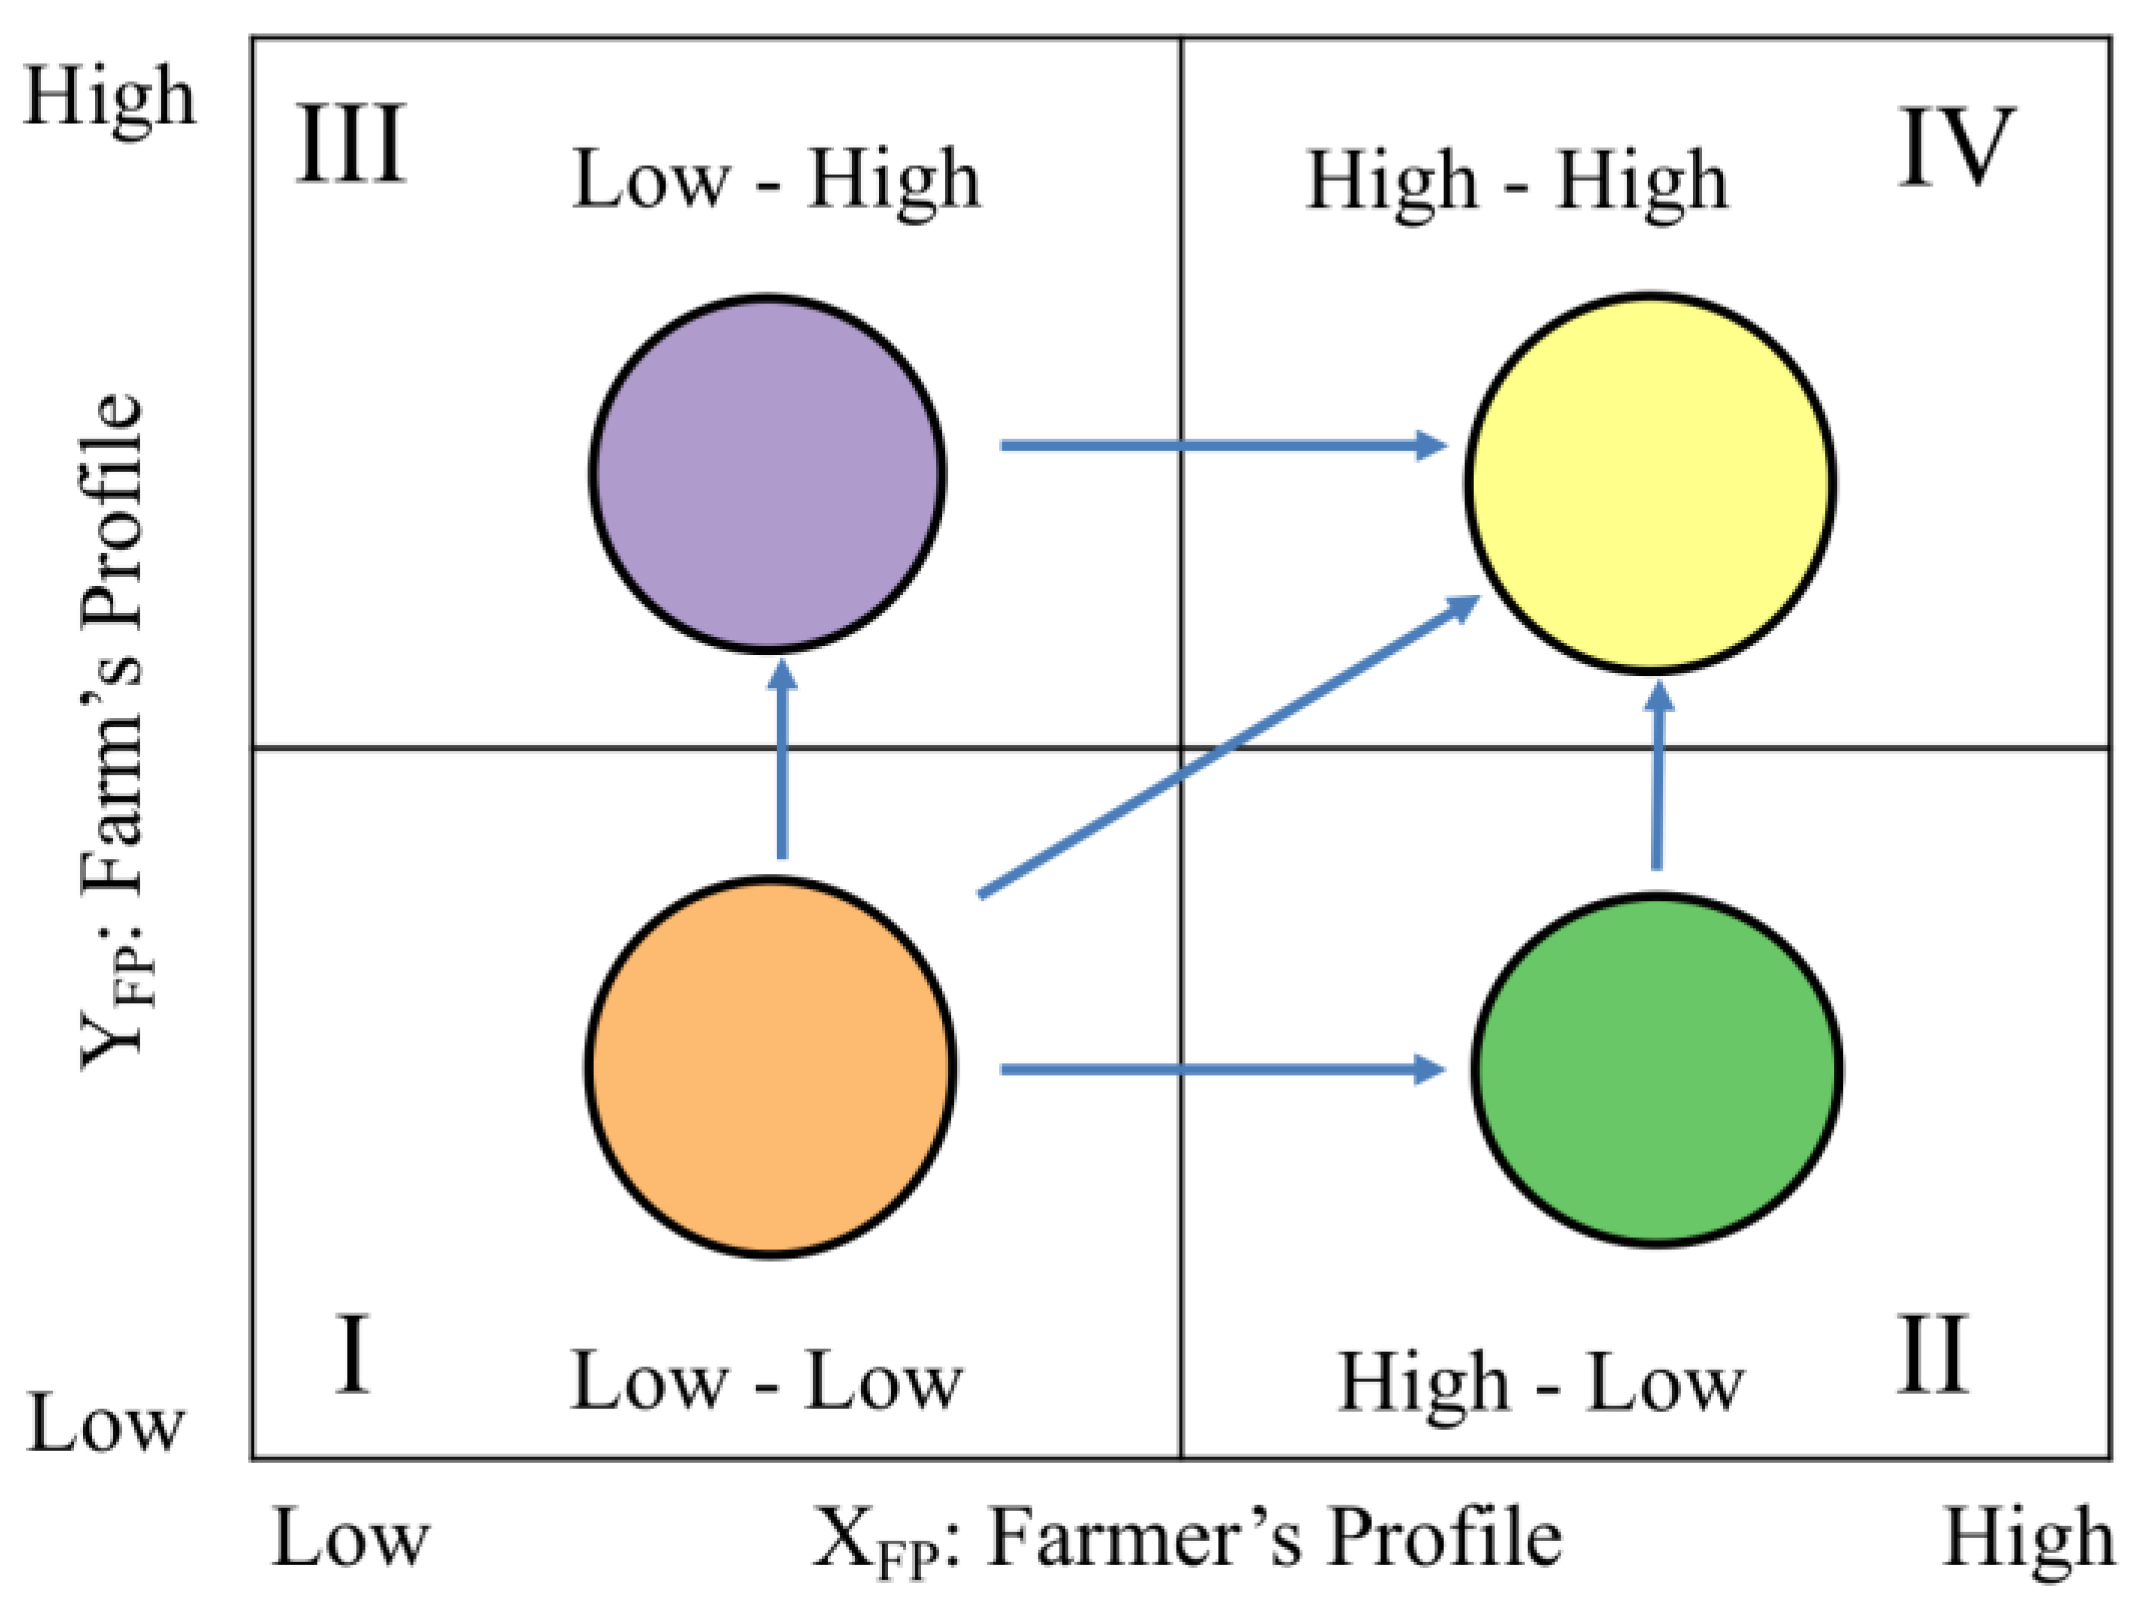
This study was supported by the analysis of 125 agricultural productive units (APUs), located in the Tolima region, one of the main Colombian coffee-growing regions. The APUs were located between parallels 3°11′1″ and 5°3′41″ north latitude and between meridians 74°51′ and 75°8′1″ west longitude in an altitude range of 1270 to 2150 m. From the methodological perspective, this analysis was advanced in the following three steps: (a) categorization of the APUs by both farmer and farm profiles; (b) characterization of the quality of the coffee originating from the APUs; and (c) determination of whether there was a relationship between the quality of the coffee and the resulting quadrant of the APU’s profile.
2.1. Farmer–Farm Categorization Model
A model was developed to classify the APUs under two dimensions: farmer profile (
XFP axis) and farm profile (
YFP axis) (
Table 1 and
Table 2). As the name suggests, each matrix quadrant (
XFP,
YFP) proposes a category that is distinguished by the attitudinal level of the producer as well as by the infrastructure available for the production of specialty coffees (
Figure 1).
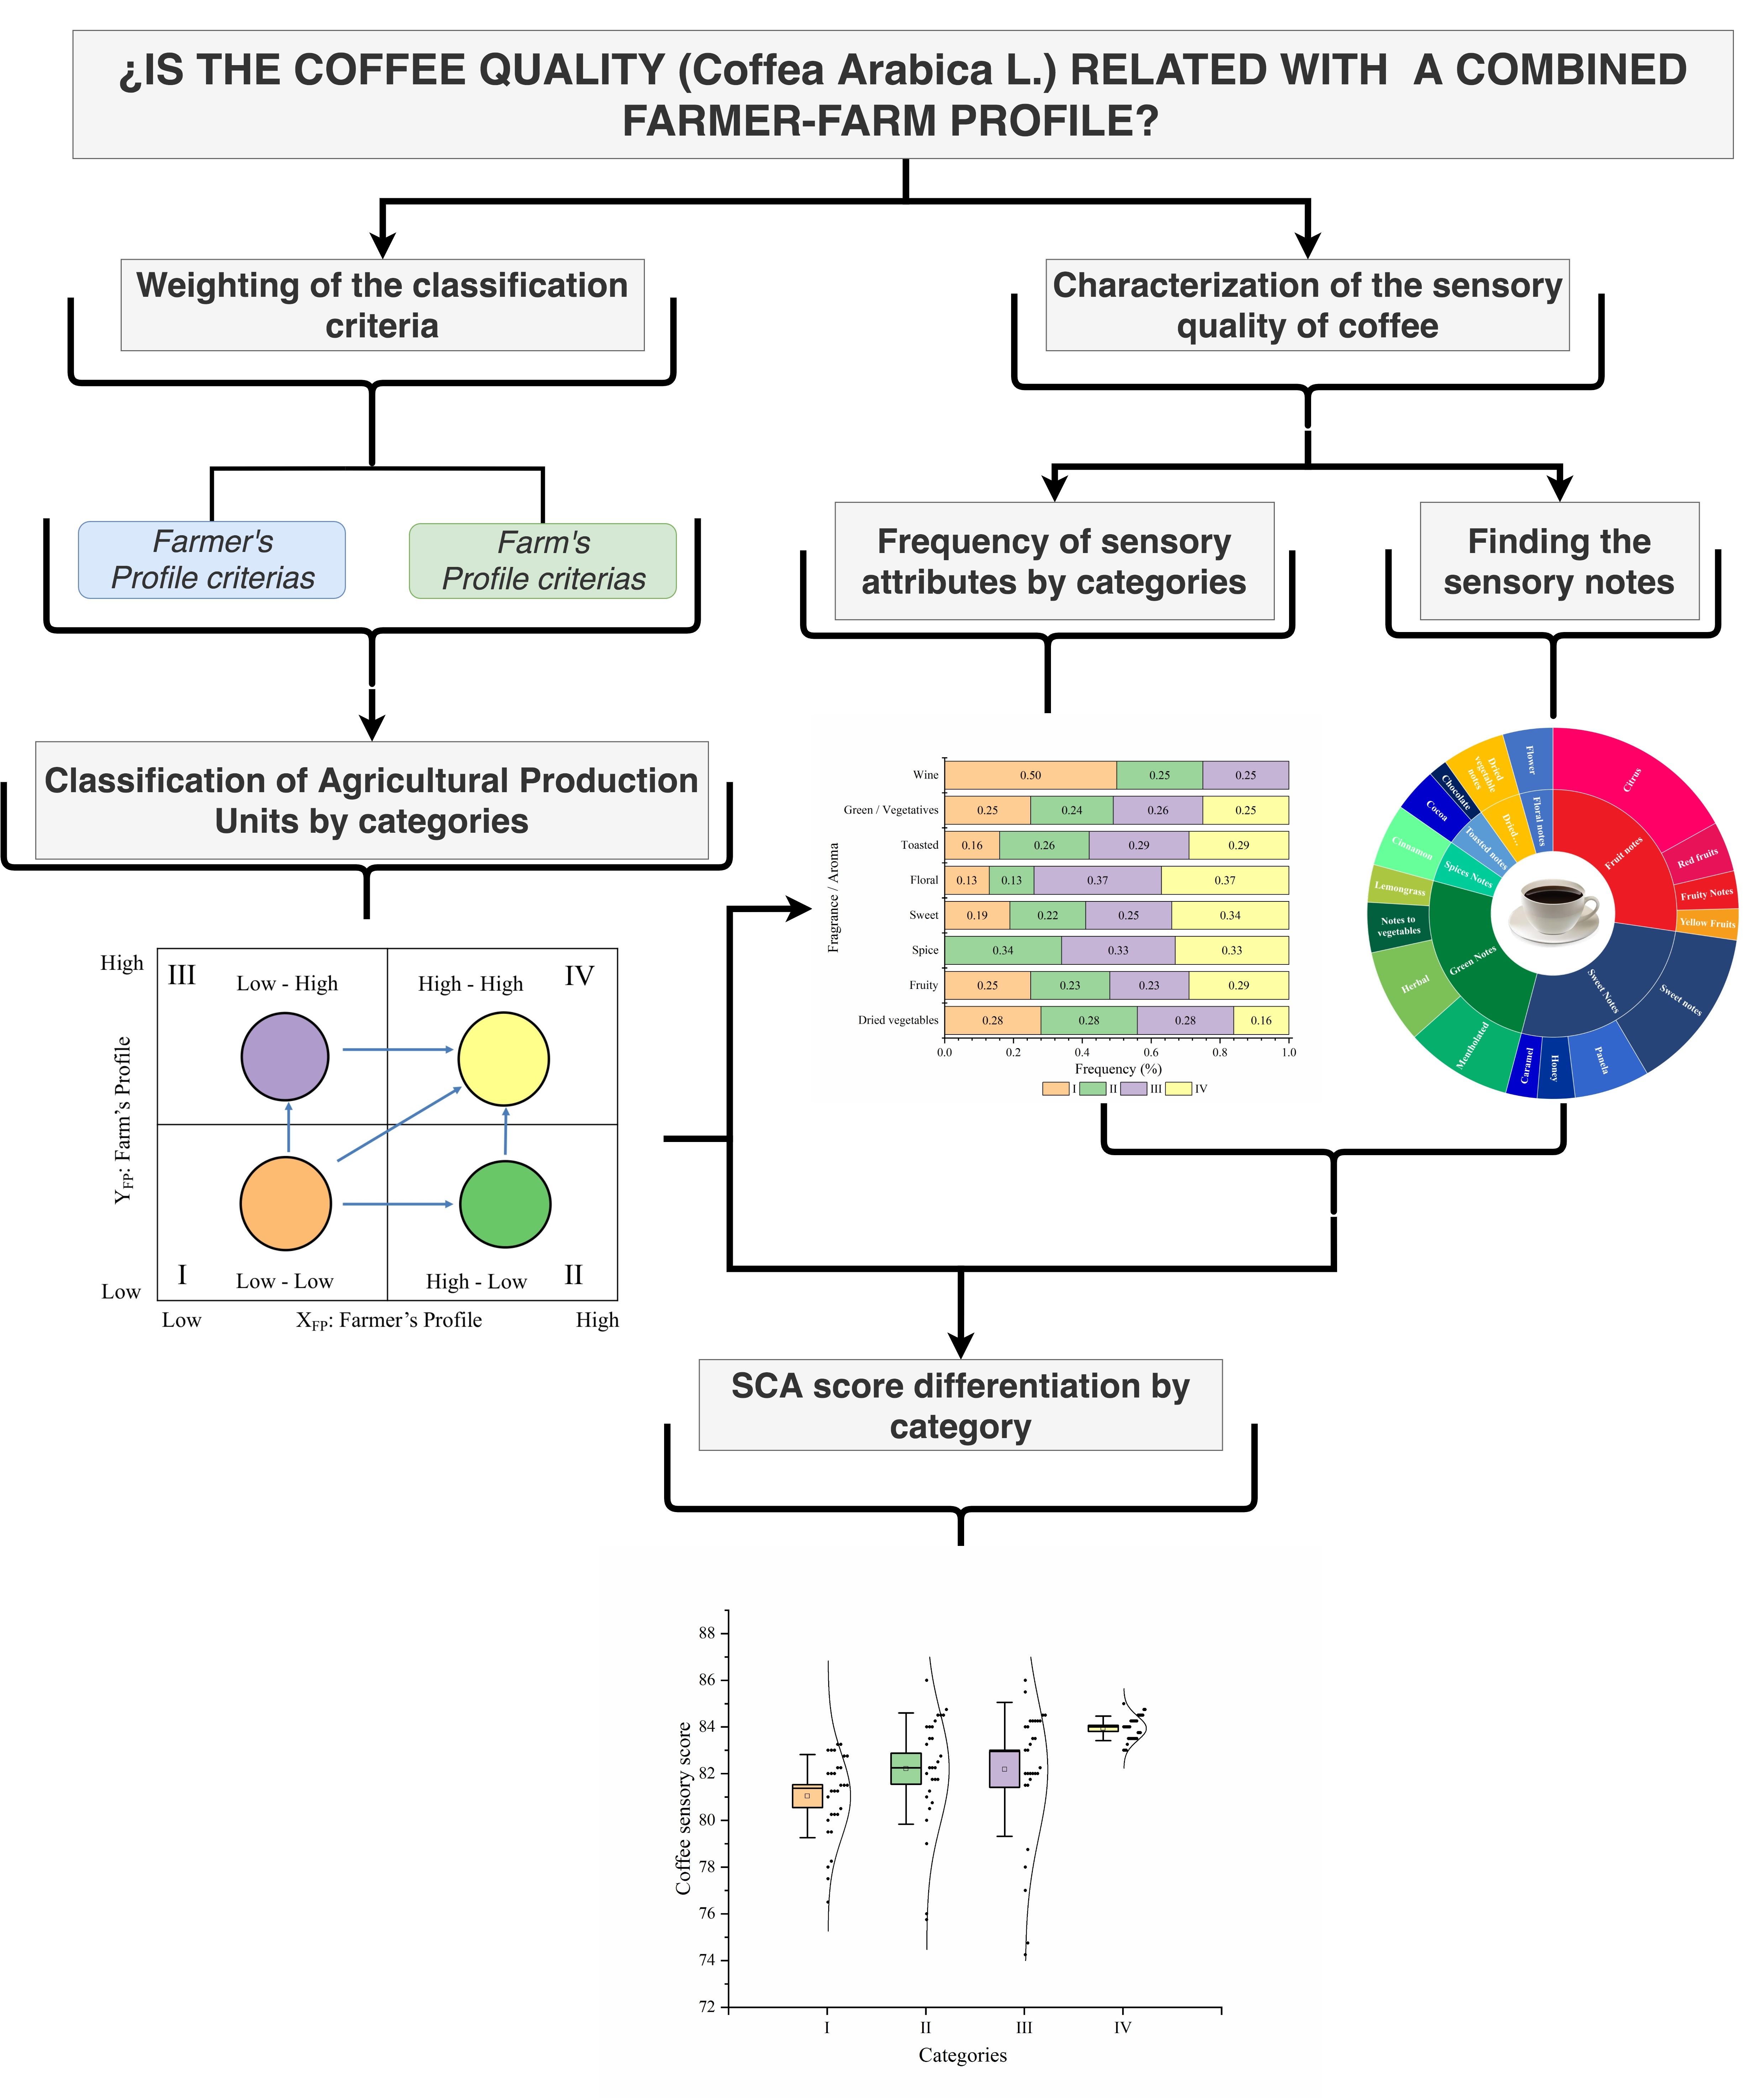
The four possible groups or quadrants of farm classification were characterized as follows:
Category I: Low-Low. The APU requires improvement in both dimensions; skills and attitude of the producer toward technical solutions to coffee-growing issues; and significant investments and adjustments in infrastructure to produce specialty coffees.
Category II: High-Low. The APU can take advantage of the skills and attitude of the producer toward the technified coffee industry while making notable efforts to modernize and adapt the farm infrastructure to produce specialty coffees.
Category III: Low-High. The APU requires, in particular, to improve the skills and attitudes of the farmers in order for them to participate in the technified coffee industry while maintaining and incrementally improving the infrastructure to produce specialty coffees.
Category IV: High-High. The APU has the desirable conditions for the production of high-quality coffees and has good farm infrastructure to produce specialty coffees.
2.2. Sensory Analysis of Coffee Samples
One hundred and twenty-five specialty coffee samples of the Colombia, Caturra, and Castillo varieties (
Coffea arabica L.) from different farmers from the Tolima region of Colombia were wet processed and subjected to sensory analysis according to the Specialty Coffee Association (SCA) methodology [
26] by five expert panelists at the South Colombian Coffee Research Center (CESURCAFÉ-USCO). Through the methodology, samples were analyzed on the basis of 10 cup attributes: fragrance/aroma, flavor, aftertaste, acidity, body, uniformity, balance, clean-cup, sweetness, and overall.
2.3. Variable Prioritization Using AHP
A group of 14 experts on coffee issues was formed. The group included professionals in engineering, agricultural sciences, administrative, human, and/or related sciences, with knowledge and extensive certified experience (>5 years) in the Colombian coffee agrochain. They were invited to prioritize each of the selected variables in order to define farmer profile and farm profile. For the comparison of the variables (criteria) in each profile, the frame of the analysis hierarchical process (AHP) tool up to the third level was used [
27], following the methodology proposed by Mendoza [
28] and supported by a computer tool that allowed real-time knowledge of the weights assigned to each variable by performing paired comparison between variables. The convergence among experts was analyzed using the relative interquartile range (RIR) index to assure an acceptability level (RIR < 10%).
2.4. Statistical Analyses
SPSS
® statistical software and Stat-Graphics
® were used at the end of the research analysis (see
Figure 2) to estimate significant differences in sensory attributes by means of one-way ANOVA, while the Bonferroni test was applied for category comparisons; both tests were evaluated with a significance level α = 0.05 [
29,
30]. Previously, the Kolmogorov-Smirnov test was used to determine the goodness of fit of the variables to the normal distribution.
3. Results and Discussion
The results are shown below with an initial description of the profiles of farmer and farm, followed by the characterization of the 125 APUs incorporated in the analysis. The results of the cupping sensory analysis are also shown to finally determine whether there exists a relationship between them and the APU category identified.
3.1. Farm and Farmer Profiles Identified
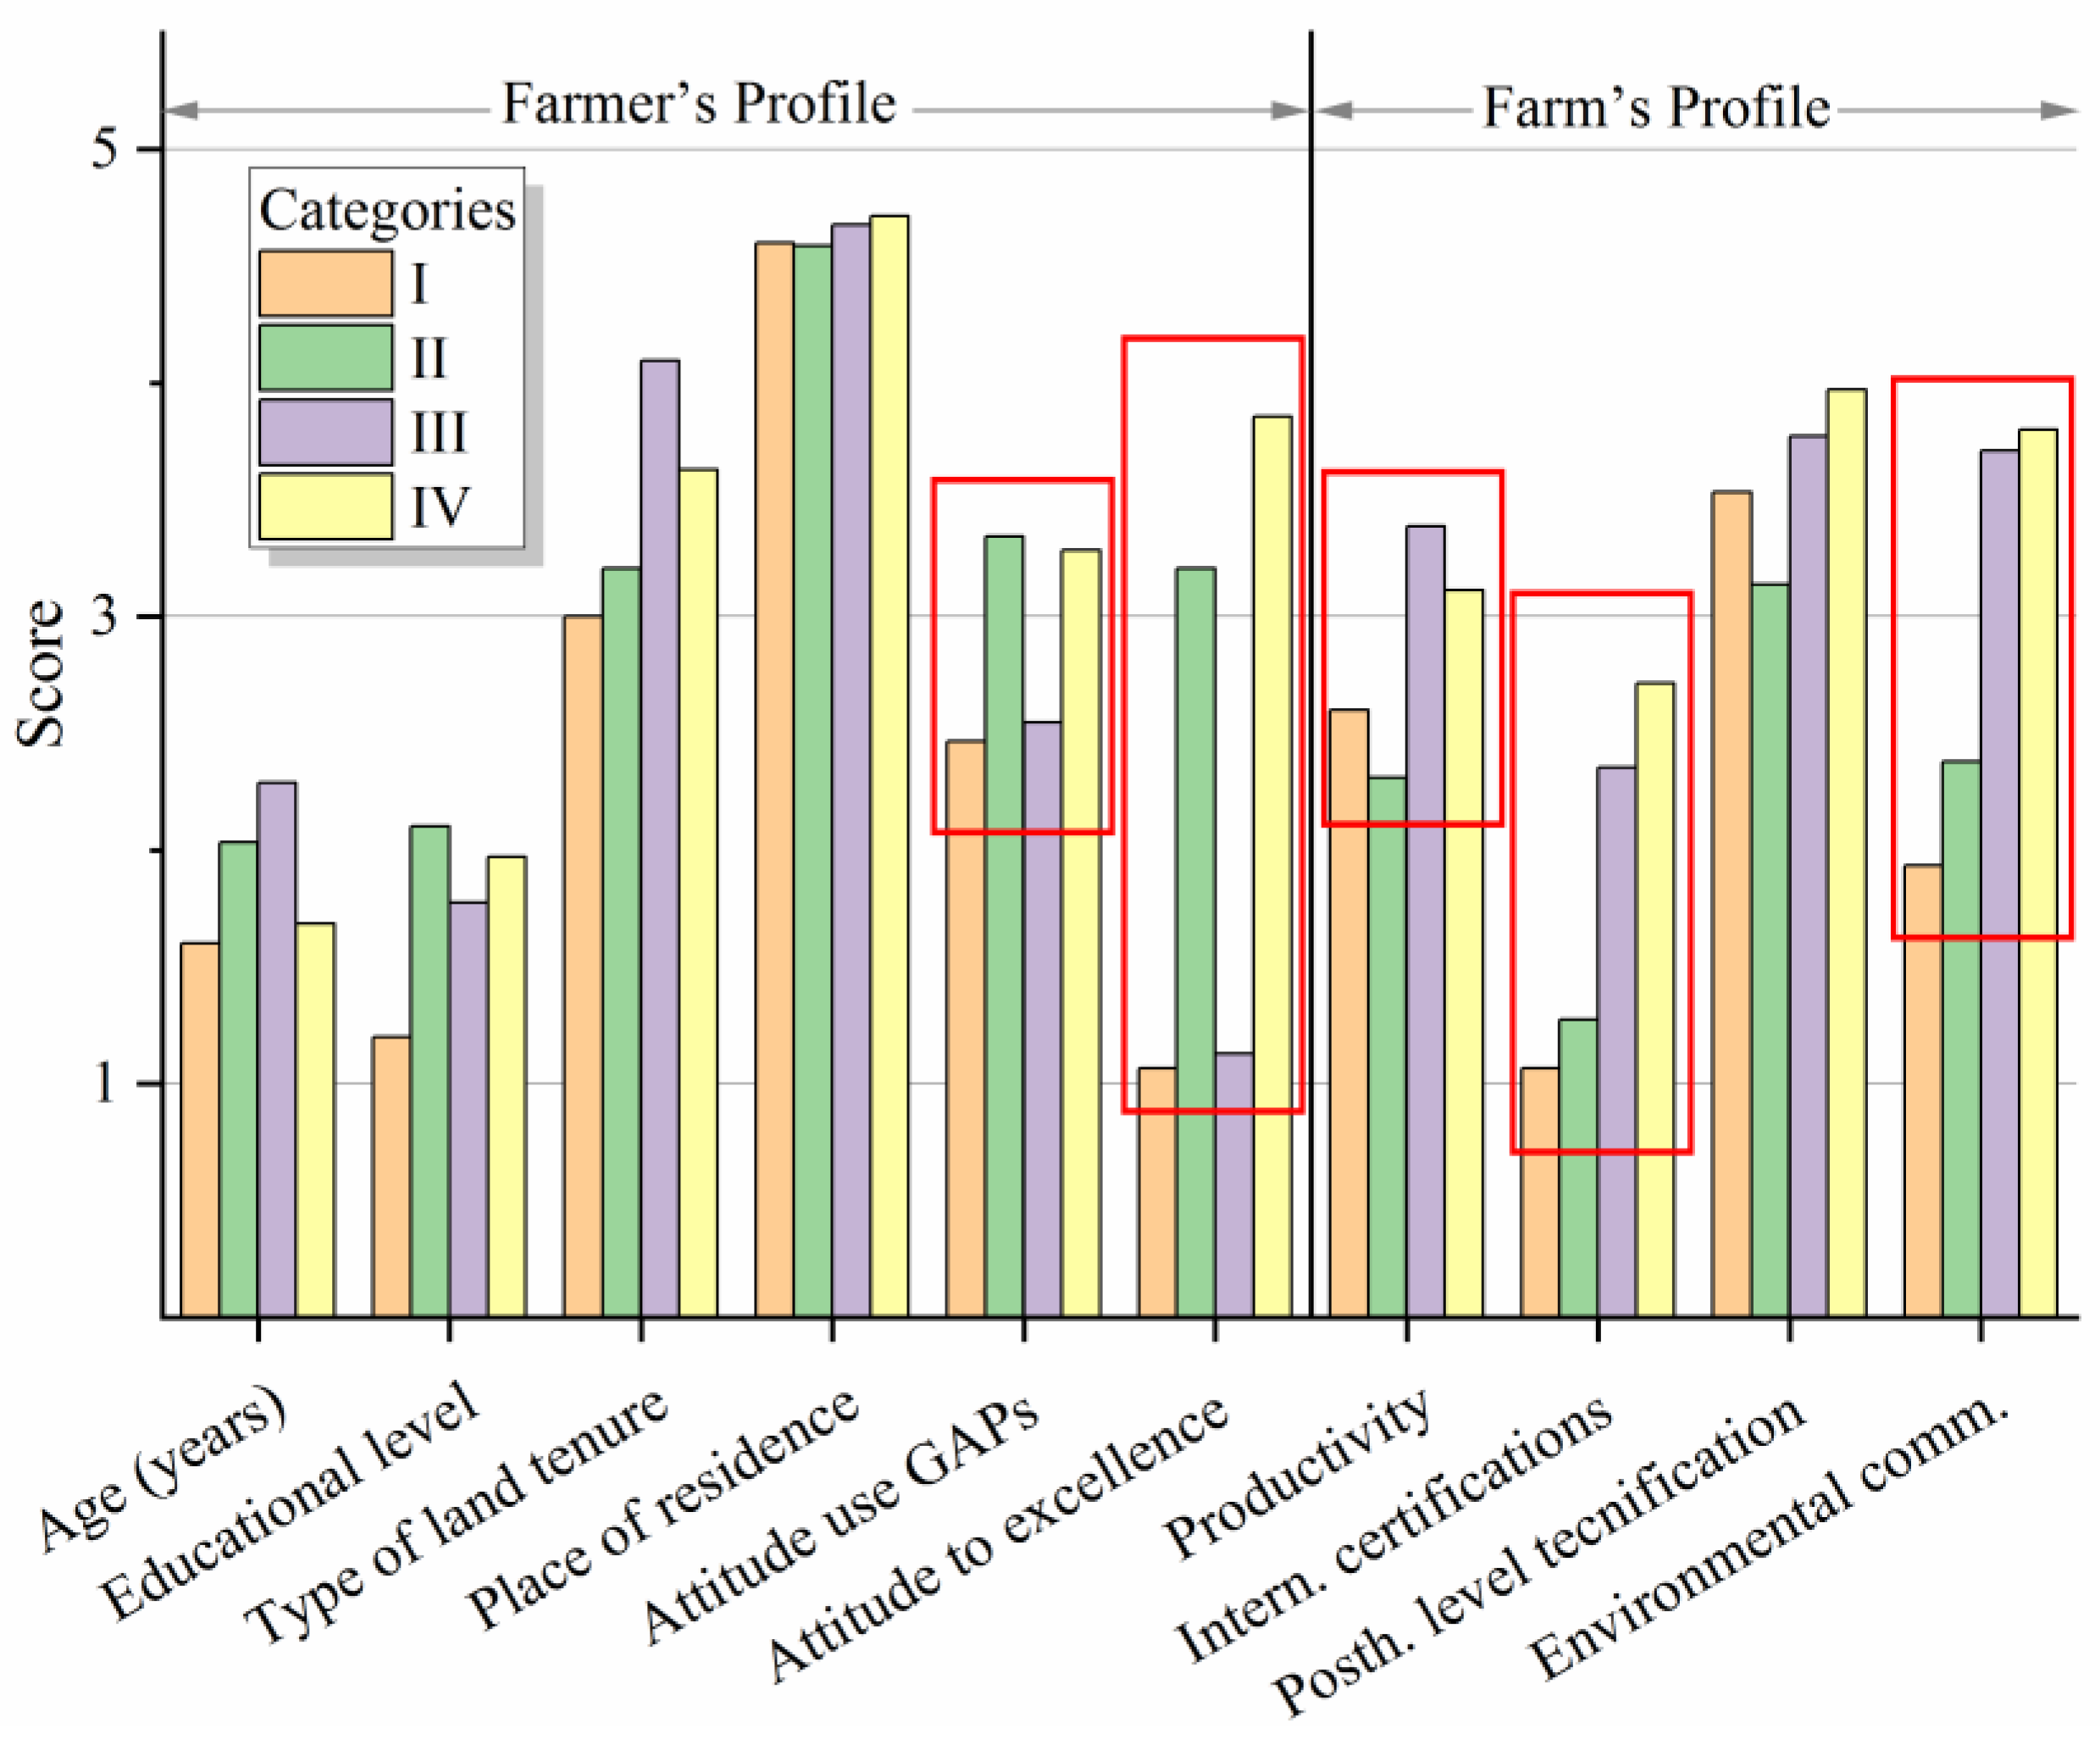
The average scores for each of the variables that characterize farm and farmer profiles are shown in
Figure 3. The age of coffee growers in the sample analyzed is approximately 50 years for all categories. This value is near the national average in Colombia (52 years) [
31] as well as the average age of coffee growers in other producing countries, such as Mexico (52 years), Guatemala (42 years), Honduras (46 years), Jamaica (53.0 years), Ethiopia (34.4 years), and Vietnam (44.6 years) [
32,
33,
34,
35]. However, studies carried out in Kenya (Africa) found that there were no significant statistical differences in coffee grower age with, or without, the Global-GAP certification [
36].
In relation to education level, Category I’s level is predominantly basic, while in Categories III and IV, it tends to be of a medium level and even higher at a technical and professional level. This is important because a study carried out in Ivory Coast concluded that younger farmers had some formal education and therefore may be more successful in coffee agribusinesses and easily adopt new crop-management practices to adapt to changing international markets [
32]. Coffee growers in the department of Tolima went to primary school (<5 years), but some had not finished their secondary school (<11 years) education because of different factors, which possibly include cultural, political, and social reasons or are of the nature of a public order.
Among studies carried out in the coffee region of Manizales (Colombia), Muñoz-Rios et al. [
37] analyzed coffee growers’ perceptions, finding that education is a critical factor in many rural problems as there is an overall perception that formal education can improve the standard of living (better salary, home, healthcare, etc.). This is, among other factors, the result of abandonment by the State, the lack of recognition for agricultural work, and deficiencies in the harvesting and distribution of coffee.
With respect to land ownership, the majority of the coffee growers in Tolima are found to live on the farms they own (
Figure 3). The majority of the coffee growers have homes near the coffee plantations, which facilitates work and the monitoring of crops during different production stages.
Other variables of the producer’s profile shown in
Figure 3 include their stance on using good agricultural practices (GAPs) and their attitude toward excellence, highlighting differences between Categories I and III with respect to Categories II and IV. This indicates that agricultural practices and the farmers’ evincing their stance toward improving their processes by introducing themselves at events, fairs, and conferences on coffee quality help motivate coffee growers to improve their productive process and at the same time motivate them to connect with other coffee growers to exchange ideas and good practices.
3.2. Categorization of the Farms
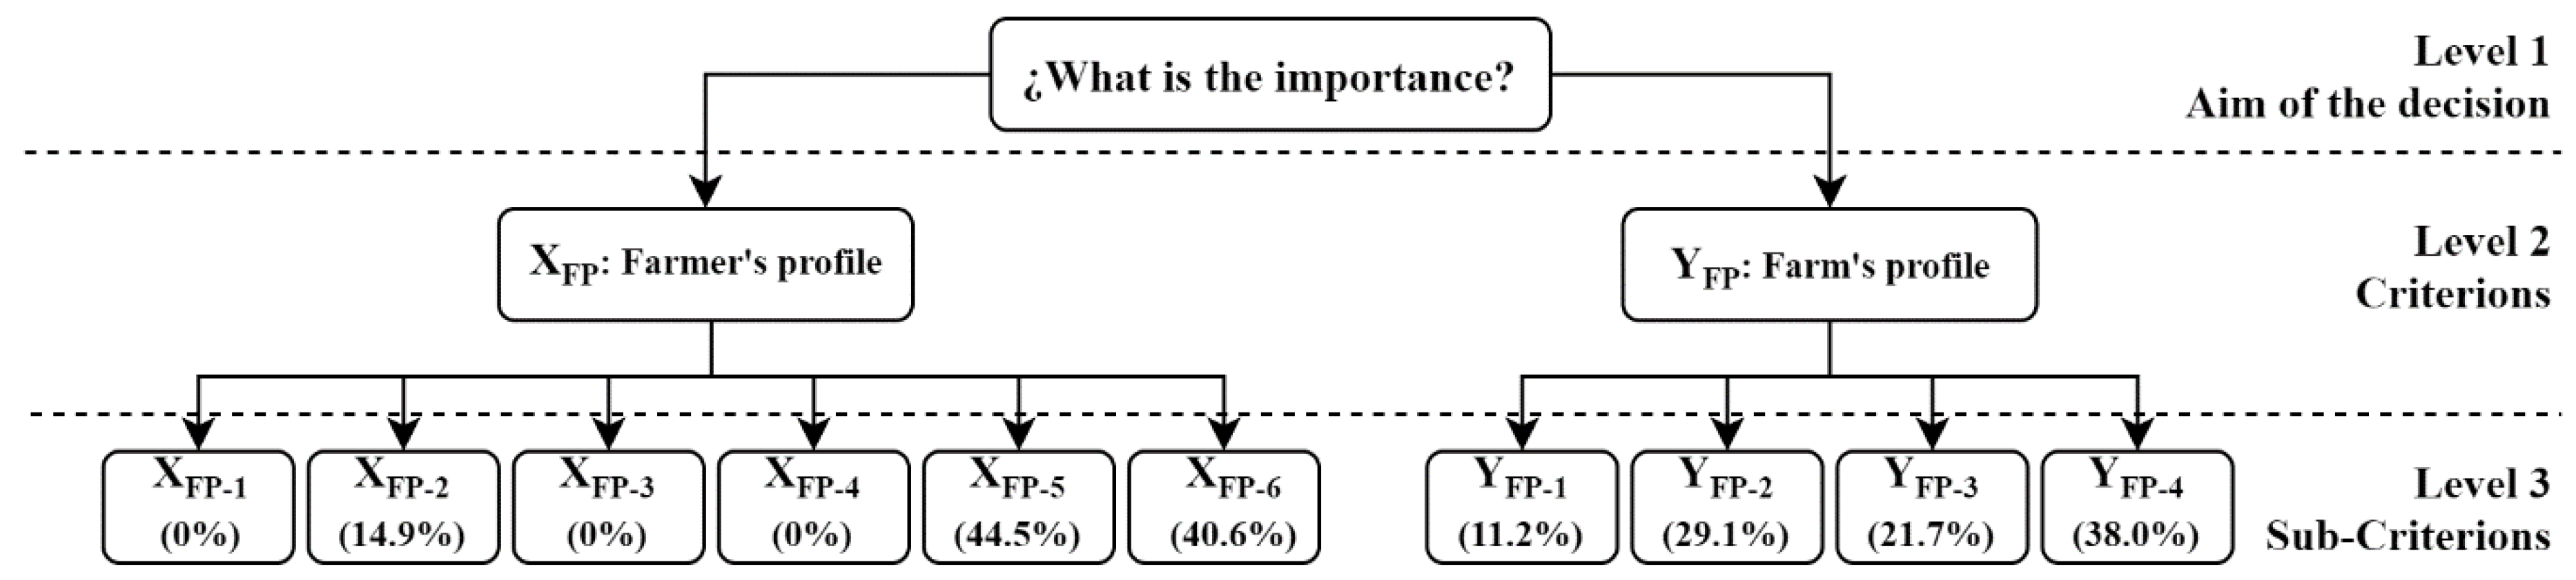
In the results obtained from expert consultation (
Figure 4), once the acceptability level for reaching a consensus was exceeded (RIR < 10%), it was possible to establish the importance of each variable in determining the profiles of the farmer and the farm, as shown in
Table 1 and
Table 2, respectively. Based on these relative weights, the following equations were created to calculate the
XFP axis score (Equation (1)) and
YFP axis score (Equation (2)):
According
Figure 4, the variables with the greatest relative weight within the AHP model were the use of good agricultural practices (44.5%) and farmer attitude toward excellence (40.6%), both relevant to the farmer’s profile; on the other hand, the environmental commitment level (38.0%) and application to international certifications (29.1%) were the most relevant to the farm’s profile. The variables without relative weight not were considered when calculating the
XFP score (Equation (1)) and
YFP score (Equation (2)).
The AHP technique has demonstrated satisfactory results in structuring problems for the simultaneous evaluation of coffee samples as discussed by Oyola et al. [
8]. The benefits of AHP were seen when applying this technique for decision-making in a multivariate classification analysis while jointly considering the coffee’s attributes and the partial evaluations of tasters of specialty coffees.
Once the profiles for the farmer (
XFP) and farm (
YFP) were calculated for each of the 125 APUs, they were standardized in the range (0.l) to then determine the category based on the resulting coordinate (
XFP,
YFP), as shown in
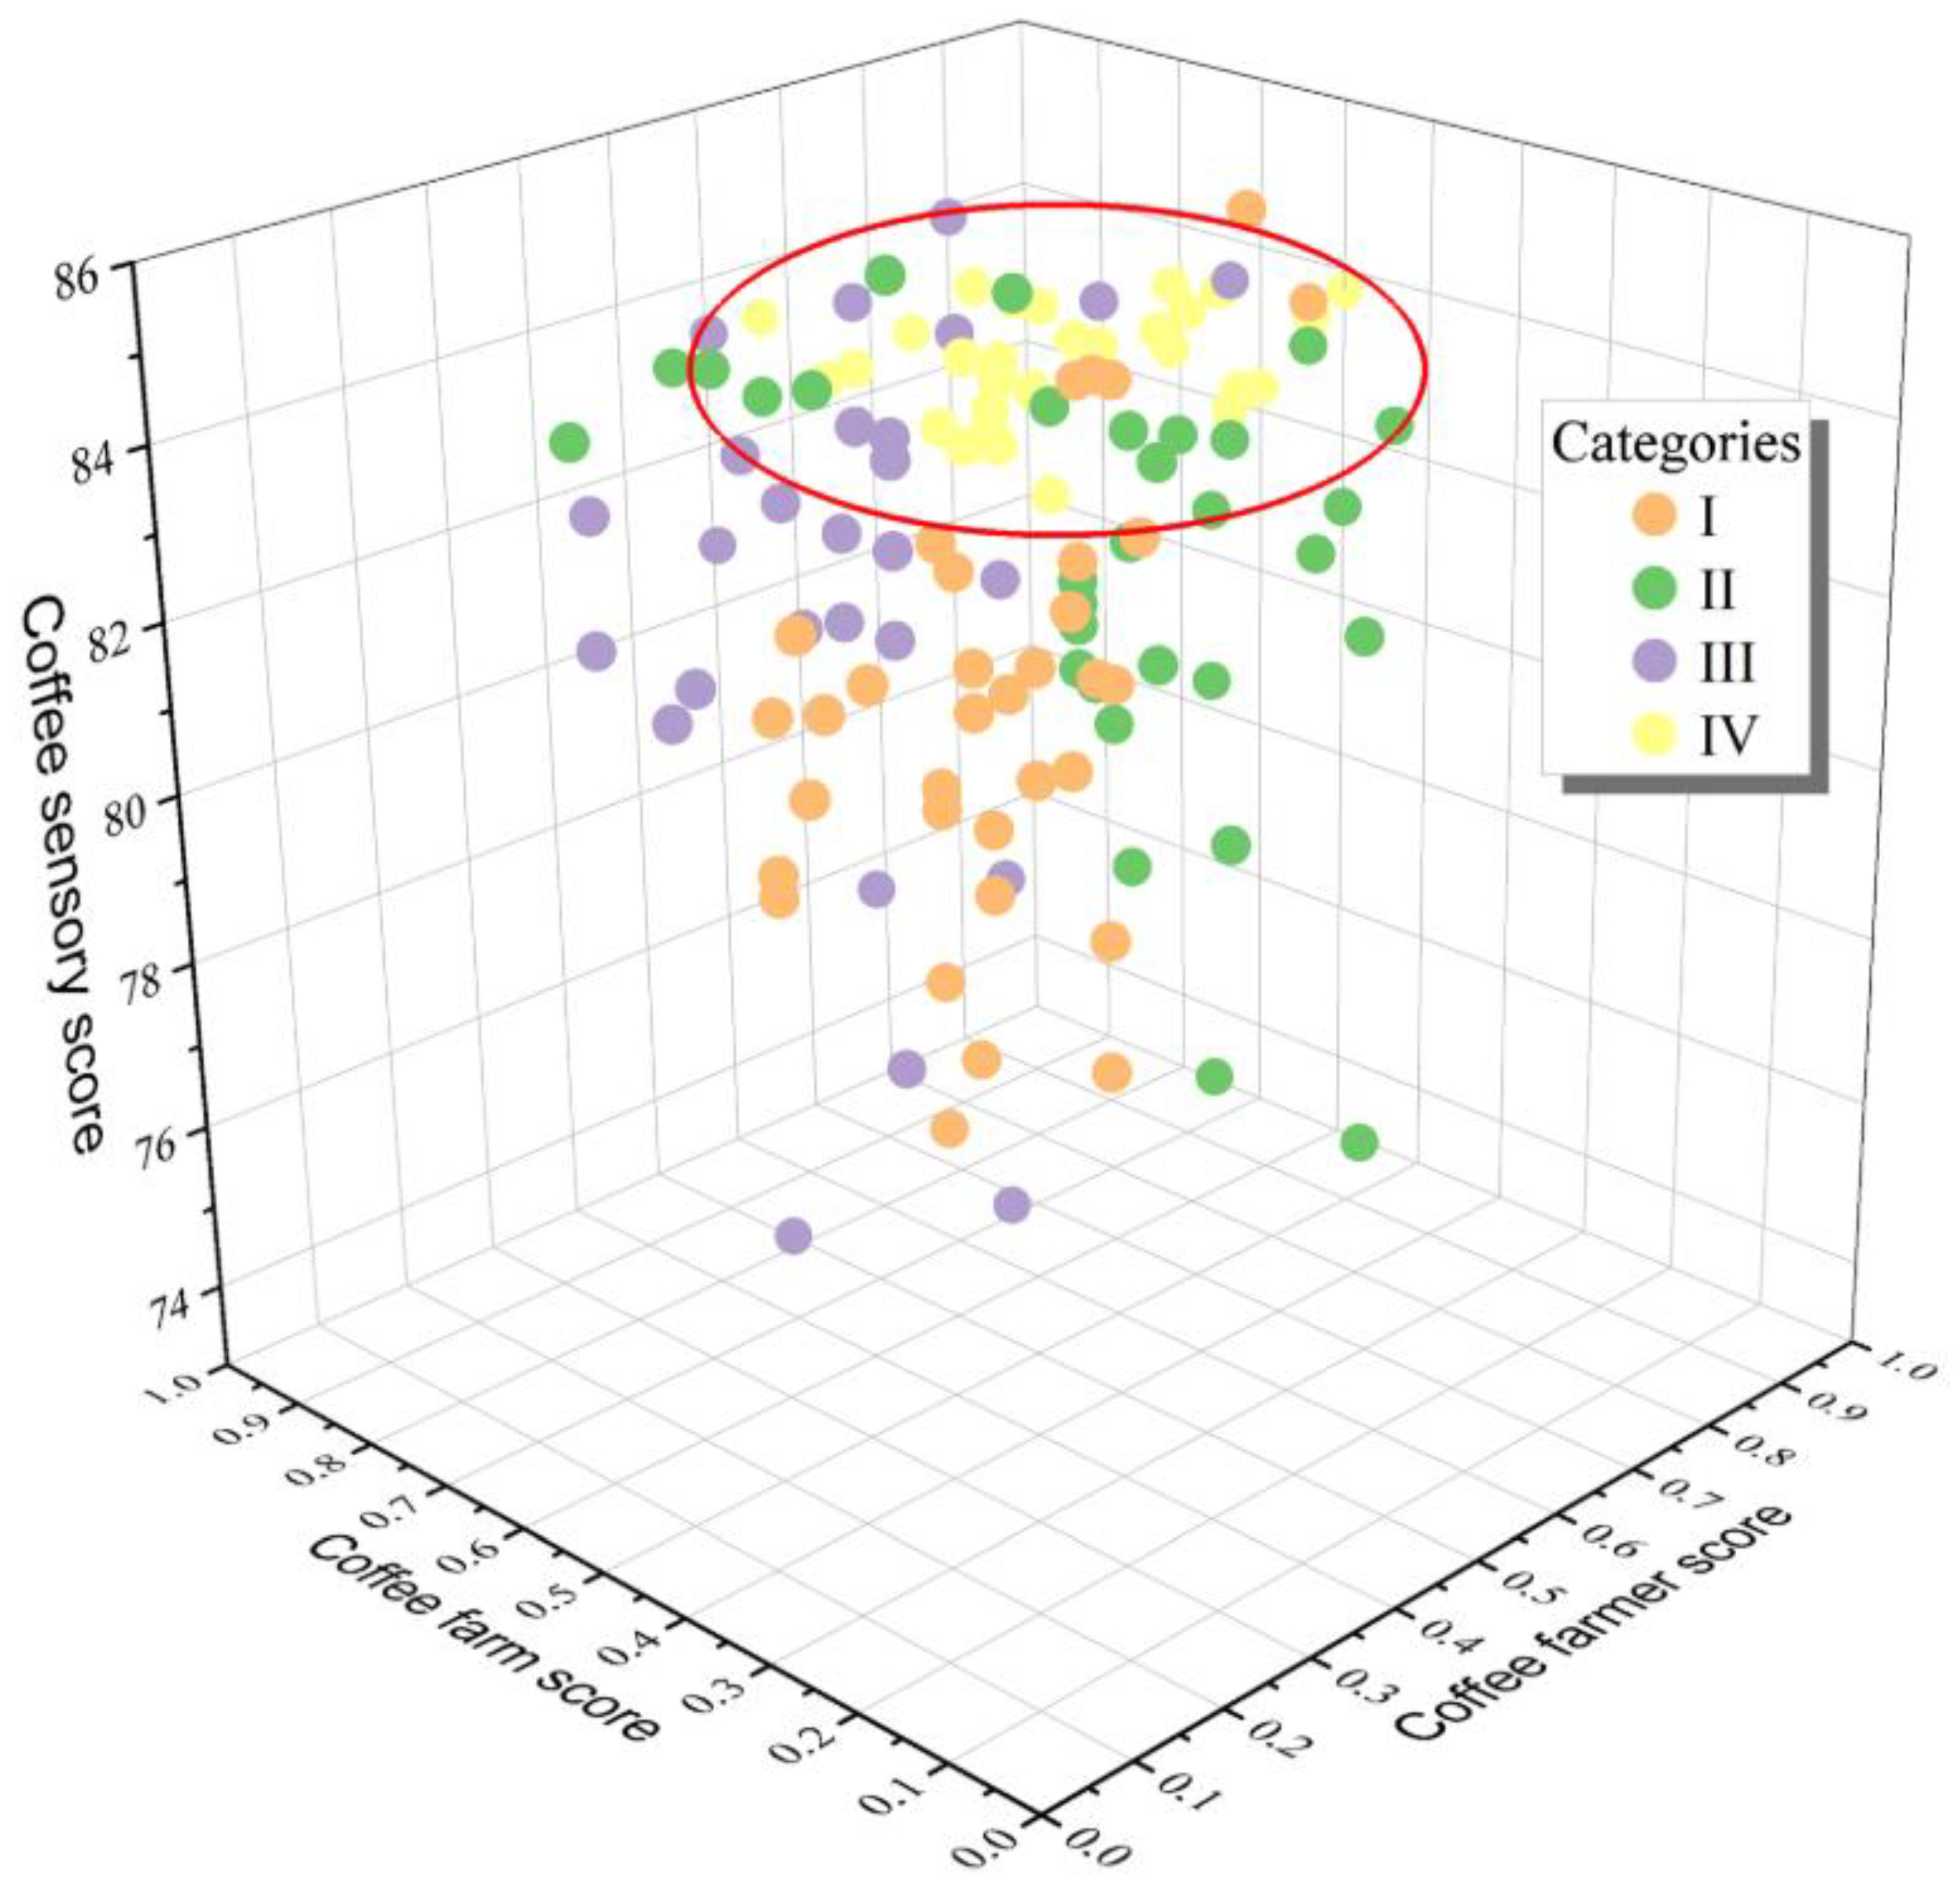
Figure 1. The distribution of the categories is shown in
Figure 5. The number of APUs by category corresponded to 30 for I, 29 for II, 31 for III, and 35 for IV. Coffee varieties from the APUs in Category IV (High-High) had the highest scores based on the SCA protocol, scoring above 80 points, with a higher level of homogeneity in the scores obtained. The scores obtained for Categories I, II, and III are heterogeneous, with the lowest values found in Category I.
Studies carried out by Wairegi et al. [
38] have demonstrated that adopting new practices and ways to cultivate and process coffee on farms, which, in this study, is called the farmer’s profile, can improve the production of specialty coffees. This characteristic was noted in Category IV. However, when a producer is in Category I or III, it means that their behavior toward the crop is strongly influenced by practices inherited from ancestors and that they have little motivation to change and improve their on-farm process.
The method used for APU classification enables the definition of the areas of focus upon designing sectorial policies involving intervention strategies to enhance the quality and competitiveness of the production of high-quality coffee. Therefore, any intervention in coffee plantations should ensure the implementation of good agricultural practices (X
FP-5) and the improvement of post-harvest infrastructure (Y
FP-4) to engage in sustainable coffee production and to raise the sensorial quality of coffee (according to SCA scores), as evidenced in Category IV (
Figure 5).
3.3. Characterization of the Sensory Quality of Coffee
Once one-way ANOVA determined that there were no significant quality differences in the coffee on the basis of variety sown, an analysis was conducted to ascertain whether there were differences based on the identified categories.
Table 3 lists the results of the multiple comparison procedure (ANOVA test) to determine the measures that are significantly different from others, between categories, and for the 10 attributes assessed by the SCA “cupping” protocol [
39]. The superscripts show whether there are statistically significant differences by attribute for the categories evaluated with a 95.0% confidence level. The method used in this study to discriminate between measures is Bonferroni’s method for multiple comparisons as the number of samples per category is not similar, with a risk of 5.0%.
The sensory quality of coffee is influenced by multivariate parameters, such as variety, species, post-harvest process (dry, semi-dry, or wet), weather factors, and agro-ecological supply (altitude, soil, rainfall, and sunshine) [
40,
41]. It is also influenced by roasting and preparation processes [
42]. This highlights that there are statistically significant differences for the attributes of flavor, aftertaste, and balance, among others, with respect to Category I. In particular, Category IV had higher acidity and body scores than the others did (
Table 3). The sensory quality is very important for international markets, where there is increasing demand for differentiated coffee varieties with better characteristics than those of commonly consumed varieties, such as Usually Good Quality (UGQ) [
43]. Colombian UGQ coffee is affected by the prices of the New York Stock Exchange (USA) [
44,
45], which is where the market for specialty coffee achieves higher sales prices [
40].
The sensory profile by category is shown in
Figure 6, in which Category IV stands out as having the maximum value for each of the parameters evaluated by the SCA protocol. This suggests that the characteristics of the coffee grower (farmer profile) and the farm (farm profile) have influence over when a grower determines that conditions are optimum to produce specialty coffee.
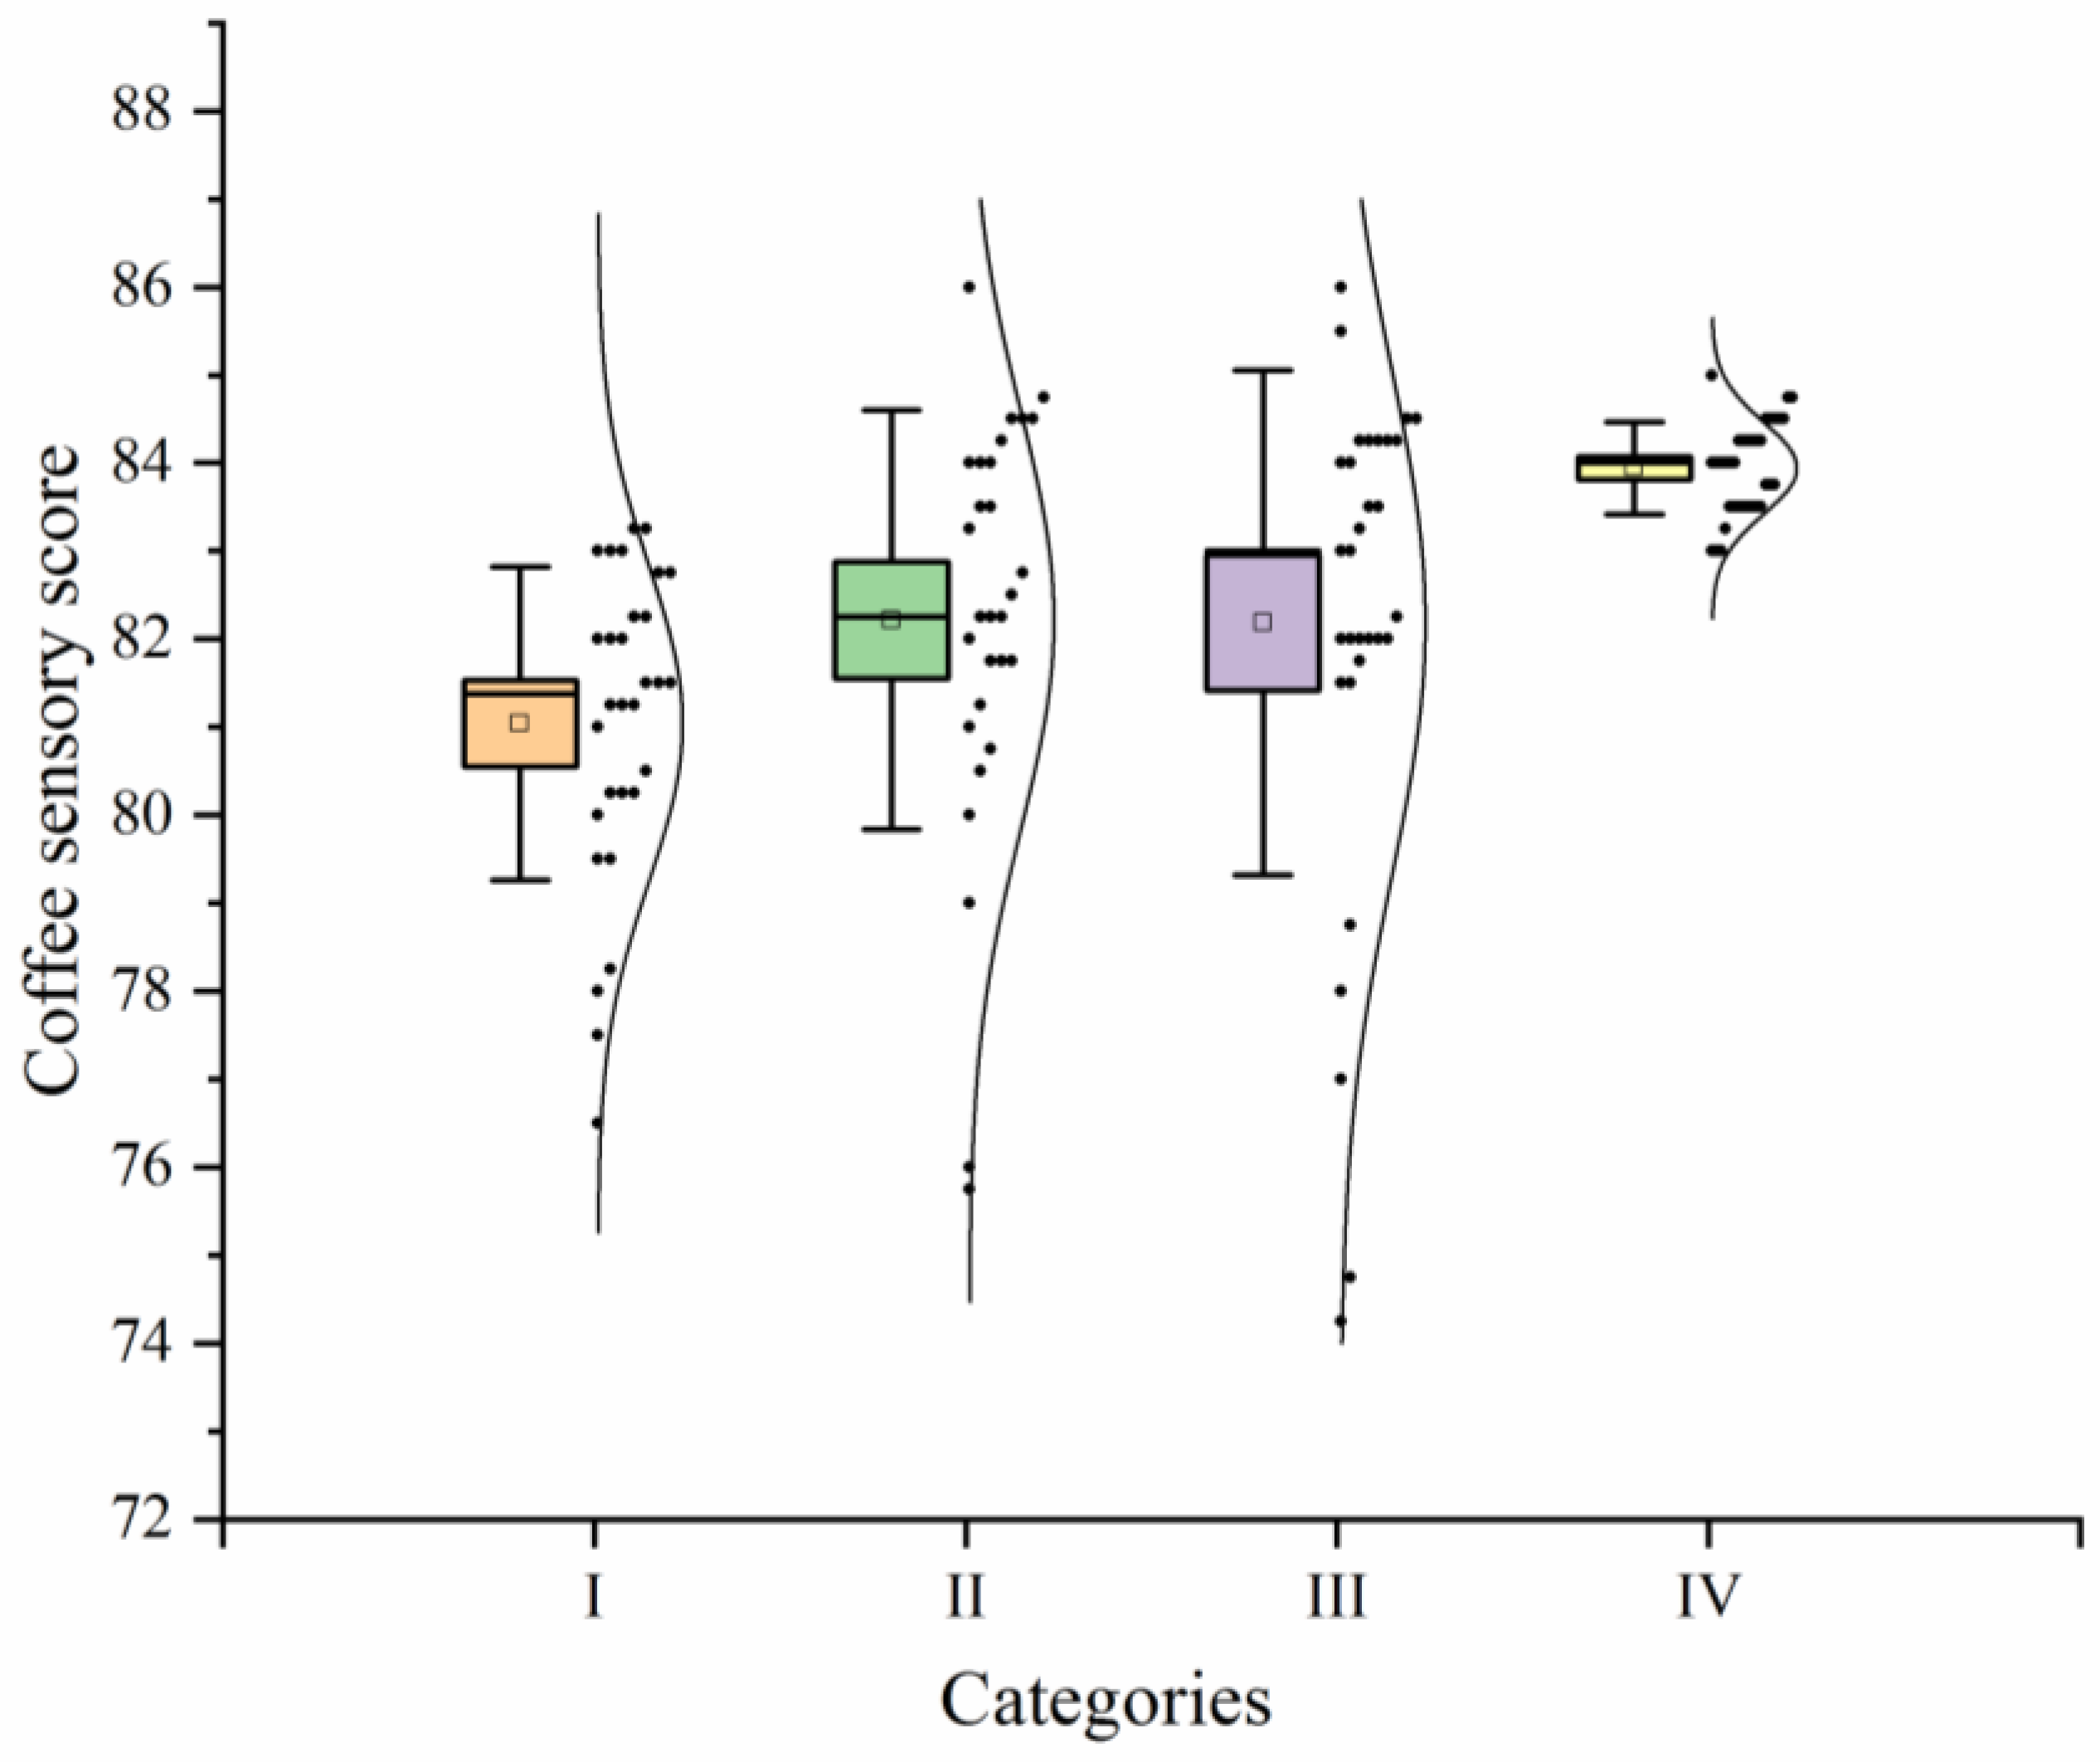
The behavior of the results found in the total SCA score for the categories shows the dispersions for Categories I, II, and III, with SCA scores of 81.04 ± 1.77, 82.21 ± 2.38, and 82.18 ± 2.86, respectively (
Figure 7). Moreover, the homogeneity of the results for Category IV is evident, with 83.94 ± 0.52 points; i.e., the characteristic parameters of the coffee grower (farmer’s profile) and the farm’s conditions (farm’s profile) have an impact on producing varieties of coffee with higher sensory quality (
Figure 4).
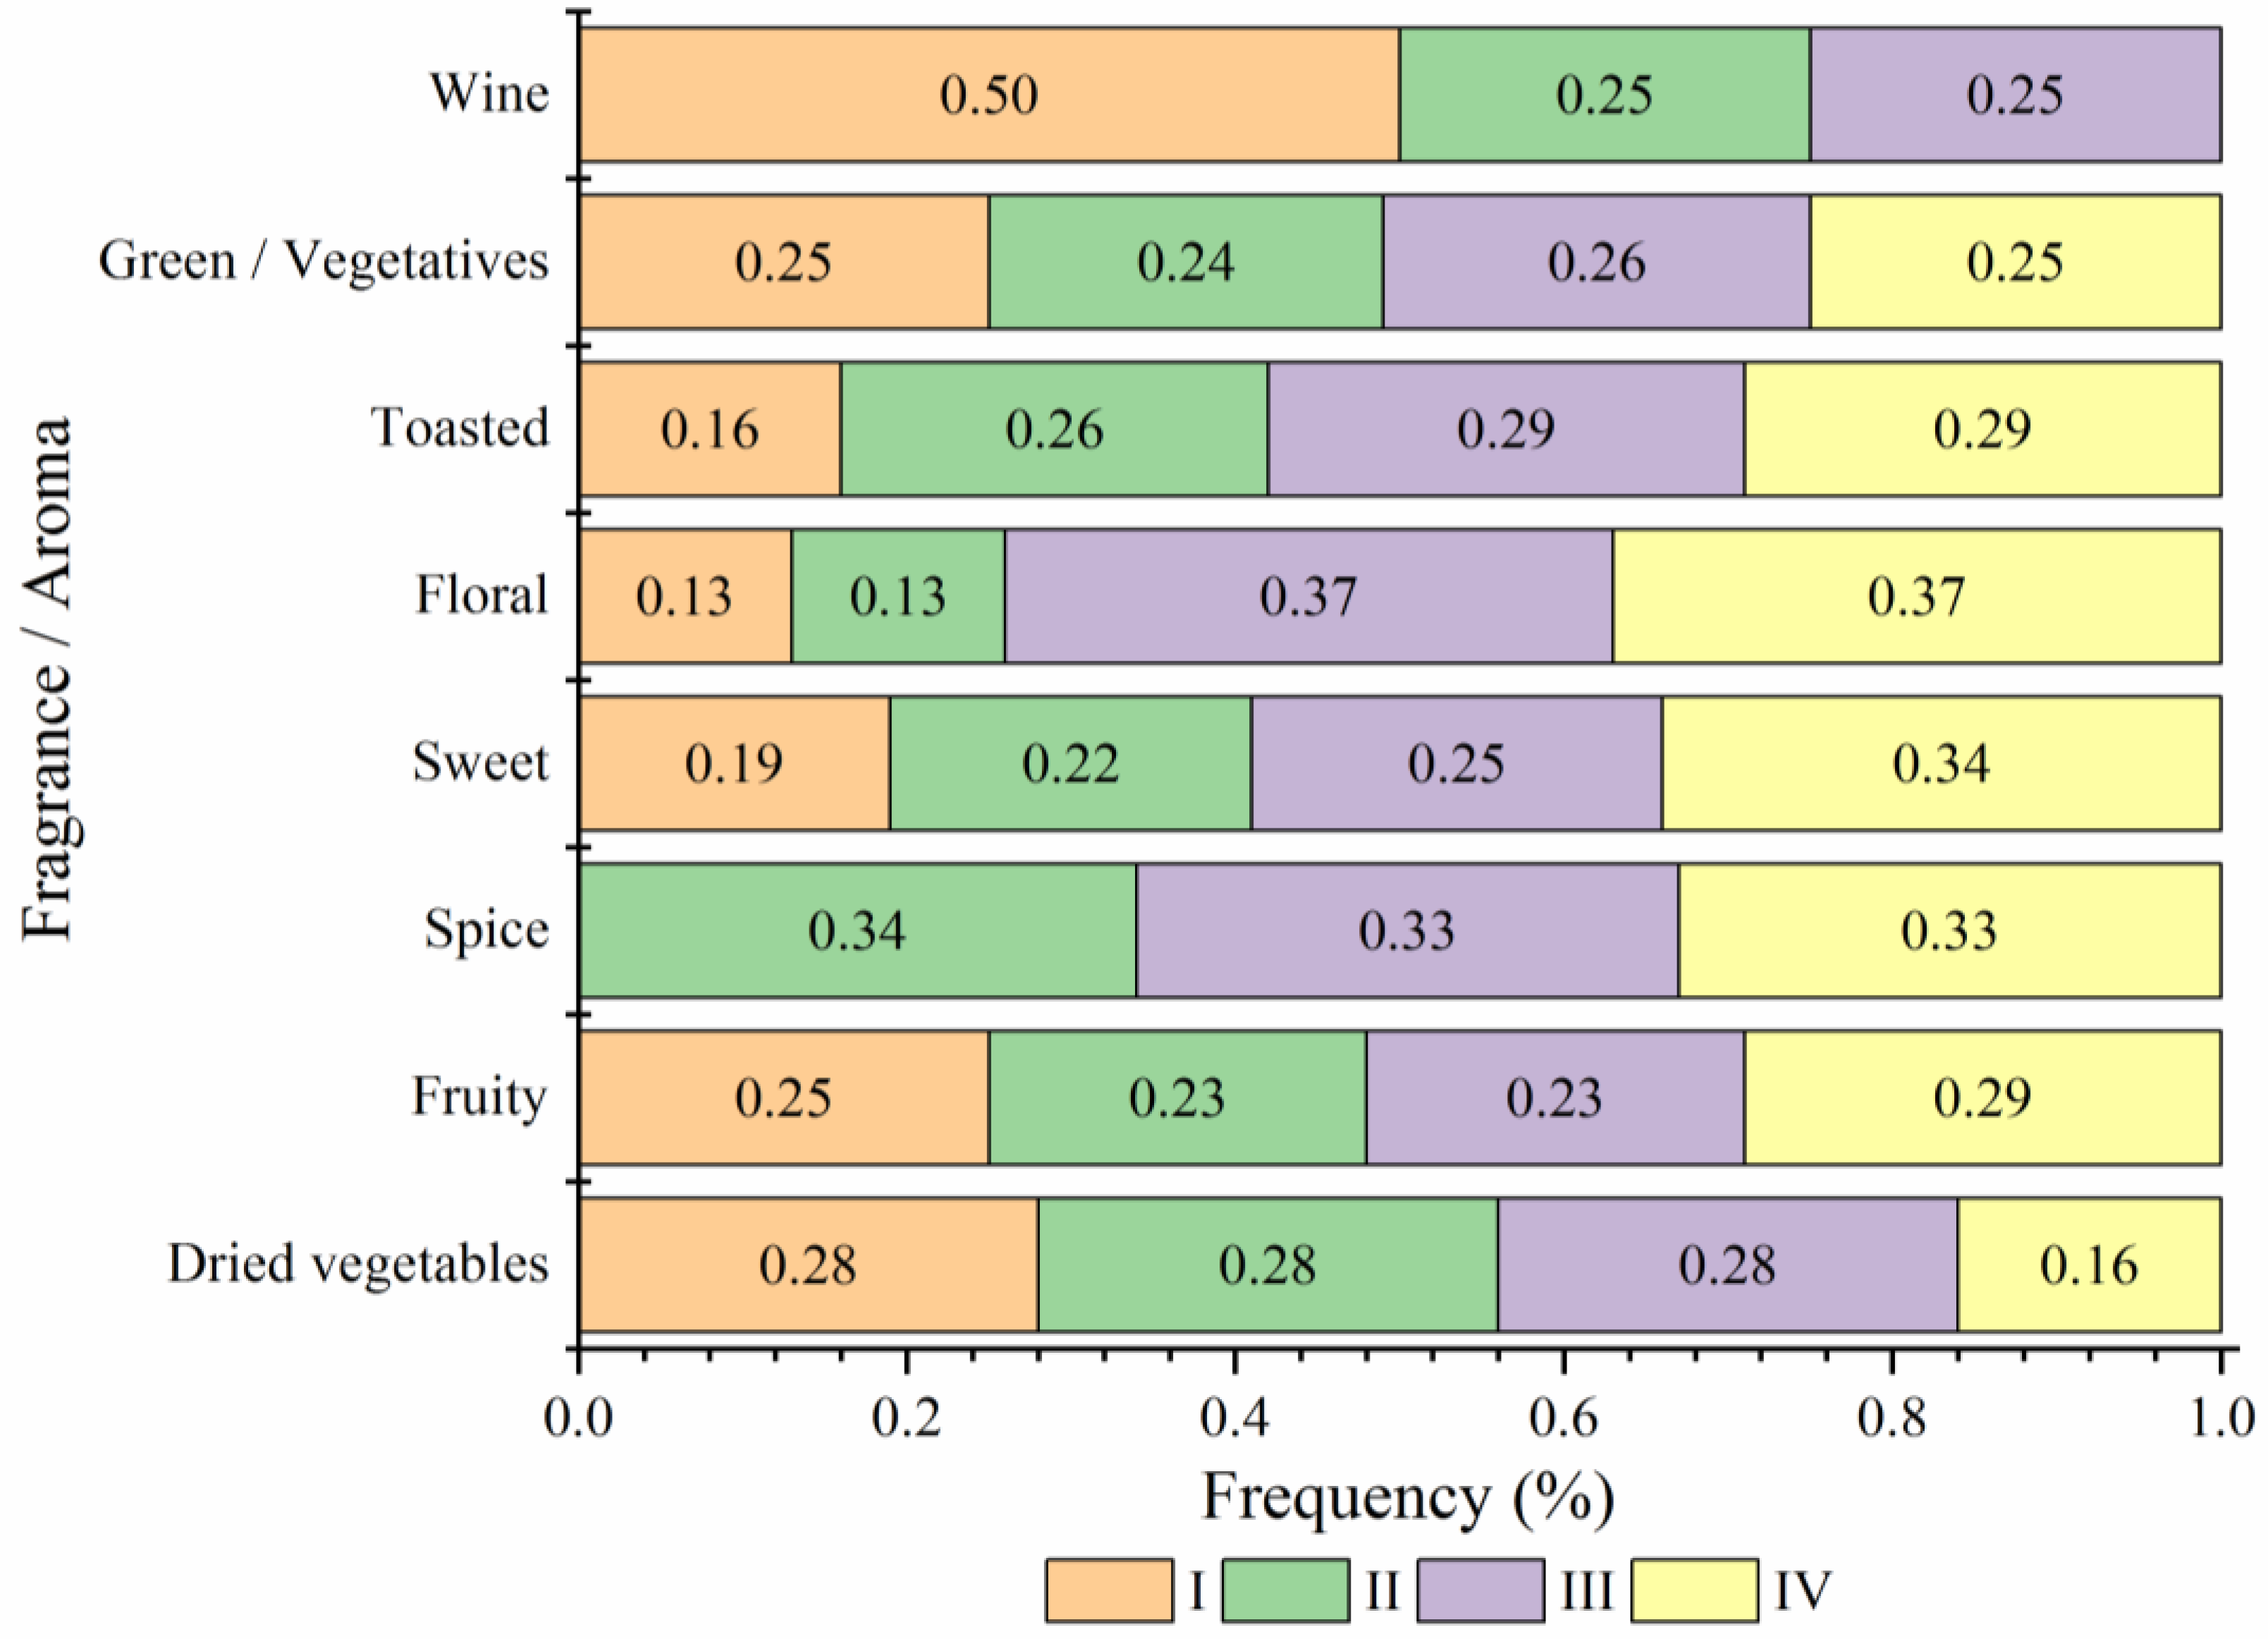
3.4. Sensory Profile by Specific Note with Regard to APU Category
The descriptors or sensory notes found by the tasting panel (
Figure 8) were taken and separated into categories. The fragrance/aroma notes were grouped into eight categories (wine, green/vegetative, toasted, floral, sweet, spice, fruity, and dried vegetables) with assistance from experts in sensory food analysis (Q-graders, researchers, and sensory analysts).
Because of the grouping exercise (
Figure 8), it was found that Category IV had no vinous note, which refers to notes related to slightly fermented, overripe, or vinous fruits, expressed by tasters as unpleasant for some commercial markets; Category I had 50% of the total vinous notes among the samples. The green/vegetative notes were described as herbal, menthol, vegetable, or were classified with lemongrass, aromatic herbs, and spice notes, which had the same proportions over all the categories. Hazelnut, peanut, nuts, caramel, cocoa, and chocolate notes were found in the toasted notes, of which Category I had the lowest number. Flowers, such as jasmine and blossoms, were found in floral notes, with Categories III and IV having the highest percentage, 37% each. For the sweet notes, sugarcane, honey, and caramel were found to have the highest proportions every time the tasters mentioned this descriptor, with 34% in Category IV. Cinnamon, cardamom, and coriander seeds are found in the spice notes; Category I does not have this descriptor. Fruity notes, such as blackberry, cherries, grapes, red fruits, cantaloupe, orange, grapefruit, and yellow fruits and even some citric notes, characteristic of Colombian coffees, were found in equal proportions in all categories. Dry vegetable notes refer to straw, grains, and dry wood, which, the tasters indicated, was a defect in sensory analysis; Category IV had the lowest proportion of these notes.
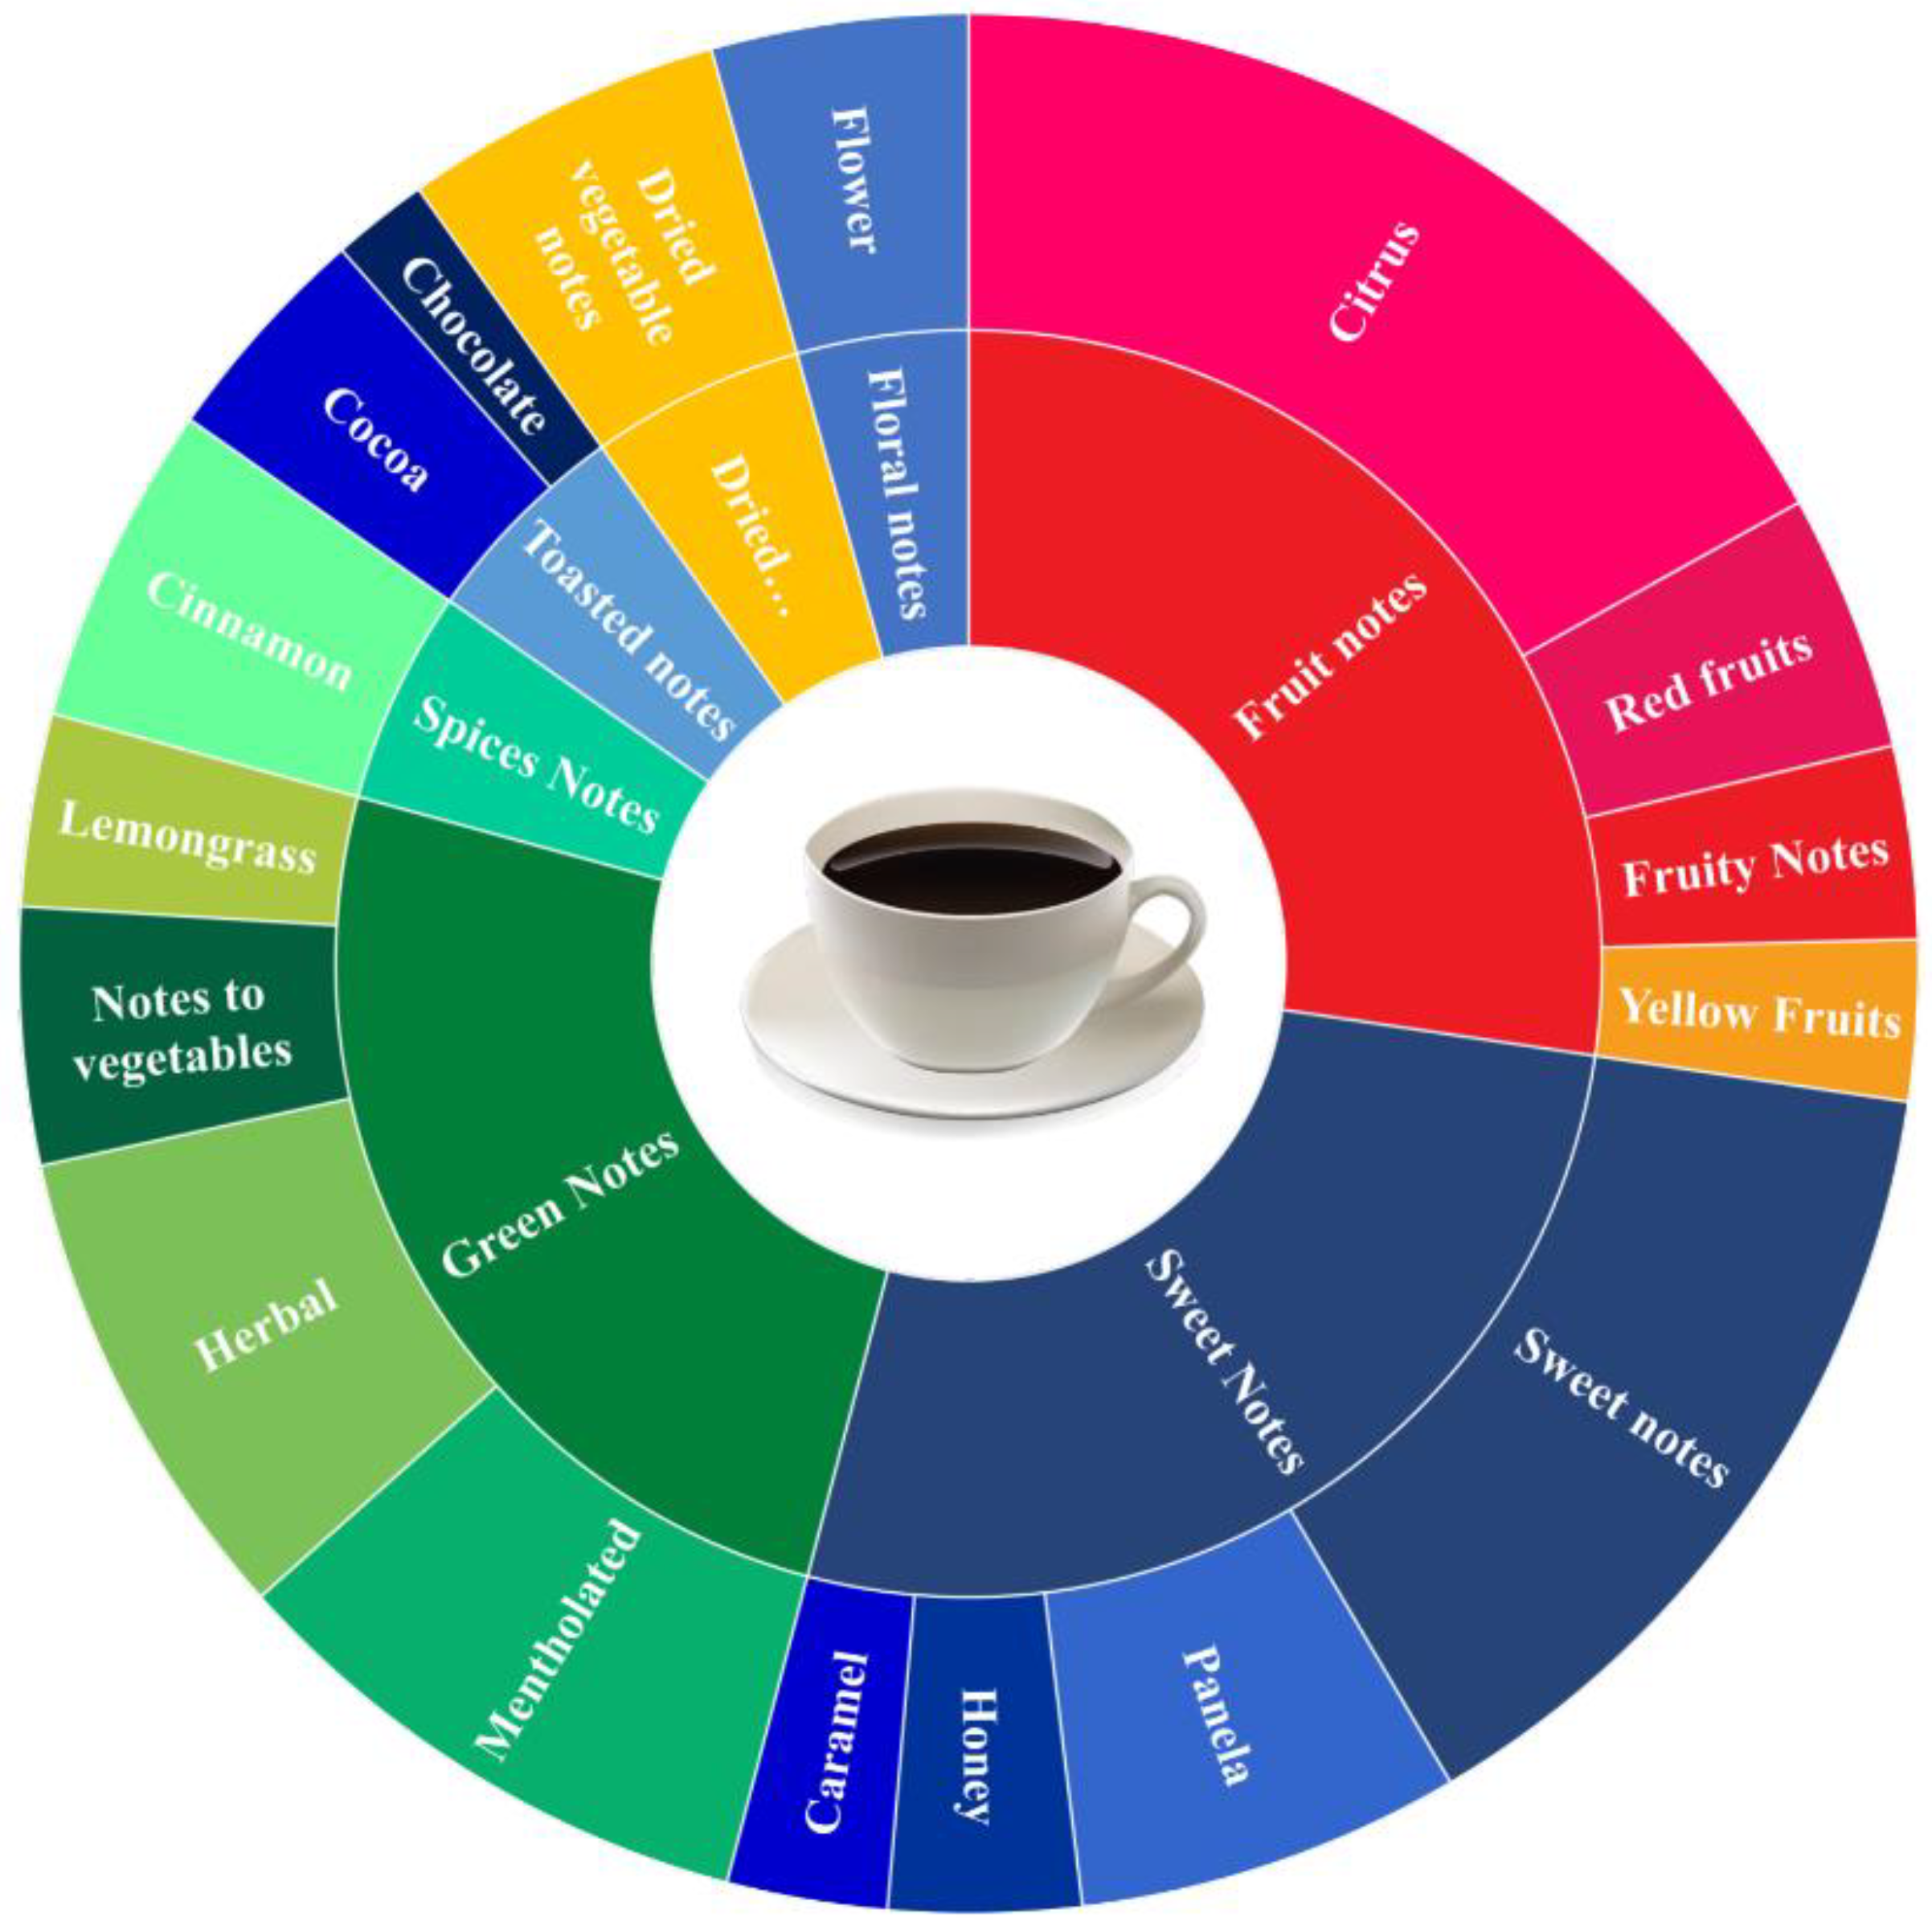
Figure 9 is the fragrance and aroma wheel for Category IV, with the intensities for each note or sensory descriptor. The coffee varieties in this category predominantly had fruity notes, those of sweets and greens. Specifically, and to a smaller extent, the coffee varieties in this category were characterized by notes of spices, cinnamon, toasted cocoa, chocolate, dried vegetables, and floral ones, specifically flowers. In a study carried out in Colombia, in the department of Huila [
46], in farms situated at altitudes ranging from less than 1300 to higher than 1700 m, sweet notes were found to be the main descriptor of the coffee evaluated, followed in proportion by citrus, fruit, caramel, floral, herbal, honey, and hazelnut notes. Identifying sensory notes or descriptors facilitates the characterization of the sensory quality of coffee in a particular region. In doing so, the different factors that influence the complexity of the beverage, including, among other factors, variety, environmental conditions, altitude, latitude, processing type, and the degree of roasting, are considered. Moreover, sensory notes can be potentially linked to certain compounds present in both dry and roasted beans [
11,
47,
48,
49].
4. Conclusions
The classification model for the APUs helped group them into the four categories proposed (Low-Low, High-Low, Low-High, and High-High) as it was possible to separate the farmers whose coffees achieved the highest cup quality.
The variables with the greatest relative weight in the APUs classification model were the stance on using GAPs (44.5%) and attitude toward excellence (40.6%) as part of the farmer’s profile and environmental commitment level (38.0%) and application to international certifications (29.1%) as part of the farm’s profile. The coffee varieties in the APU High-High category were characterized by a sensory profile of cinnamon, cocoa, chocolate, and dried vegetables.
These results can be helpful and used as a reference for researchers interested in the study of other coffee producing regions as they classify the profiles of farms and farmers and analyze their relationship with the cup profile obtained from the production process. The results suggest that the quality of specialty coffee results from multiple factors, which are not only present in the harvest and post-harvest conditions on farms but also in the practices that farmers adopt and their attitude toward their integration into the international supply chain of high-value-added specialty coffees.
The classification methodology proposed could be useful in implementing the technology transfer processes undertaken to improve coffee post-harvest while helping create differentiated intervention strategies according to the category of the combined farm–farmer profile. The results of farmer group analysis demonstrated a distinct difference between the scores obtained in the sensory evaluation and the notes of the samples examined on the basis of the classification of the coffee plantations (APUs) studied. The plantations included in Category IV (those with conditions desirable for the production of high-quality coffee) clearly achieved the highest scores. This suggests that the design of conditioning strategies, particularly on infrastructure and training in GAPs and processing to produce specialty coffees for the APUs falling in Categories I, II, and III, should focus on attaining the conditions common to the APUs contained in Category IV.
In addition, the results also serve as reference for comparing descriptors with respect to sensory notes to the extent that these are potentially linked to certain marker compounds that may be present in the bean. Thus, they could be useful in differentiating coffee varieties with comparable qualities.
Author Contributions
Conceptualization, H.B.-A., A.F.B.-M. and N.G.-G.; methodology, H.B.-A., A.F.B.-M. and N.G.-G.; software, H.B.-A. and A.F.B.-M.; formal analysis, H.B.-A., A.F.B.-M. and N.G.-G.; investigation, H.B.-A. and N.G.-G.; resources, Y.B.-V.; data curation, Y.B.-V. and A.F.B.-M.; writing—original draft preparation, H.B.-A., A.F.B.-M. and R.A.-C.; writing—review and editing, N.G.-G.; visualization, H.B.-A. and A.F.B.-M.; supervision, H.B.-A.; project administration, Y.B.-V.; funding acquisition, Y.B.-V., H.B.-A. and N.G.-G. All authors have read and agreed to the published version of the manuscript.
Funding
This research was financed by the general royalty system of the Science, Technology and Innovation fund of the Colombian Ministry of Science, Technology and Innovation (Minciencias) of the project entitled “Implementación de innovación de procesos a nivel de poscosecha para la incorporación de valor agregado en la diferenciación de cafés especiales del Tolima. BPIN 2016000100049 – Convenio Especial de Cooperación No. 1874-2018. This work was supported by the Government of the Tolima region, the National Planning Department (DNP) of Colombia, researchers at the Universidad de Ibagué and CESURCAFÉ from Universidad Surcolombiana.
Conflicts of Interest
The authors declare no conflict of interest.
References
- ICO. World Coffee Production. 2017. Available online: http://www.ico.org/prices/po-production.pdf (accessed on 21 April 2020).
- Özdestan, Ö.; van Ruth, S.M.; Alewijn, M.; Koot, A.; Romano, A.; Cappellin, L.; Biasioli, F. Differentiation of specialty coffees by proton transfer reaction-mass spectrometry. Food Res. Int. 2013, 53, 433–439. [Google Scholar] [CrossRef]
- FNC. Informe del Gerente General 2017. 2017. Available online: https://federaciondecafeteros.org/static/files/IGG_2017.pdf (accessed on 21 April 2020).
- Tolessa, K.; Rademaker, M.; de Baets, B.; Boeckx, P. Prediction of specialty coffee cup quality based on near infrared spectra of green coffee beans. Talanta 2016, 150, 367–374. [Google Scholar] [CrossRef] [PubMed]
- ICO. Monthly Coffee Market Report—March. London, 2020. Available online: http://www.ico.org/documents/cy2019-20/cmr-0320-e.pdf (accessed on 25 April 2020).
- Vargas, P. El consumo local de esta bebida creció 4% en 2018. La Republica, 23 April 2019. [Google Scholar]
- DNP, Informe de Coyuntura Económica Regional: Departamento del Tolima. 2015. Available online: https://www.dane.gov.co/files/icer/2015/ICER_Tolima2015.pdf (accessed on 25 April 2020).
- Oyola, S.; Trujillo, D.; Gutierrez, N. Aplicación del proceso analítico jerárquico AHP para definir la mejor taza en evaluación de cafés especiales. Coffee Sci. 2017, 12, 374. [Google Scholar] [CrossRef]
- Figueiredo, L.; Borém, F.; Cirillo, M.; Ribeiro, F.; Giomo, G.; Salva, T.D.J.G. The Potential for High Quality Bourbon Coffees From Different Environments. J. Agric. Sci. 2013, 5, 87–98. [Google Scholar] [CrossRef] [Green Version]
- Taveira, J.H.S.; Borém, F.M.; Figueiredo, L.P.; Reis, N.; Franca, A.S.; Harding, S.A.; Tsai, C.J. Potential markers of coffee genotypes grown in different Brazilian regions: A metabolomics approach. Food Res. Int. 2014, 61, 75–82. [Google Scholar] [CrossRef]
- Borém, F.M.; Cirillo, M.Â.; Alves, A.P.D.; Santos, C.M.D.; Liska, G.R.; Ramos, M.F.; de Lima, R.R. Coffee sensory quality study based on spatial distribution in the Mantiqueira mountain region of Brazil. J. Sens. Stud. 2019, 15. [Google Scholar] [CrossRef]
- Villarreal, D.; Laffargue, A.; Posada, H.; Bertrand, B.; Lashermes, P.; Dussert, S. Genotypic and environmental effects on coffee (Coffea Arabica L.) bean fatty acid profile: Impact on variety and origin chemometric determination. J. Agric. Food Chem. 2009, 57, 11321–11327. [Google Scholar] [CrossRef]
- Figueiredo, L.; Borem, F.; Ribeiro, F.; Giomo, G.; Taveira, J.; Malta, M.R. Fatty acid profiles and parameters of quality of specialty coffees produced in different Brazilian regions. Afr. J. Agric. Res. 2015, 10, 3484–3493. [Google Scholar] [CrossRef]
- Cheng, B.; Furtado, A.; Smyth, H.E.; Henry, R.J. Influence of genotype and environment on coffee quality. Trends Food Sci. Technol. 2016, 57, 20–30. [Google Scholar] [CrossRef] [Green Version]
- Bertrand, B.; Vaast, P.; Alpizar, E.; Etienne, H.; Davrieux, F.; Charmetant, P. Comparison of bean biochemical composition and beverage quality of Arabica hybrids involving Sudanese-Ethiopian origins with traditional varieties at various elevations in Central America. Tree Physiol. 2006, 26, 1239–1248. [Google Scholar] [CrossRef] [Green Version]
- Bertrand, B.; Boulanger, R.; Dussert, S.; Ribeyre, F.; Berthiot, L.; Descroix, F.; Joët, T. Climatic factors directly impact the volatile organic compound fingerprint in green Arabica coffee bean as well as coffee beverage quality. Food Chem. 2012, 135, 2575–2583. [Google Scholar] [CrossRef] [PubMed]
- Worku, M.; de Meulenaer, B.; Duchateau, L.; Boeckx, P. Effect of altitude on biochemical composition and quality of green arabica coffee beans can be affected by shade and postharvest processing method. Food Res. Int. 2018, 105, 278–285. [Google Scholar] [CrossRef] [PubMed]
- Martins, P.M.M.; Batista, N.N.; Miguel, M.G.D.P.; Simão, J.B.P.; Soares, J.R.; Schwan, R.F. Coffee growing altitude influences the microbiota, chemical compounds and the quality of fermented coffees. Food Res. Int. 2020, 129, 108872. [Google Scholar] [CrossRef] [PubMed]
- Ribeiro, D.E.; Borem, F.M.; Cirillo, M.A.; Prado, M.V.B.; Ferraz, V.P.; Alves, H.M.R.; Taveira, J.H.D. Interaction of genotype, environment and processing in the chemical composition expression and sensorial quality of Arabica coffee. Afr. J. Agric. Res. 2016, 11, 2412–2422. [Google Scholar] [CrossRef] [Green Version]
- Amin, A.M. Influence of harvesting and postharvest processing methods on the quality of Arabica coffee (Coffea arabica L.) in Eastern Ethiopia. ISABB J. Food Agric. Sci. 2017, 7, 1–9. [Google Scholar] [CrossRef] [Green Version]
- Pereira, L.L.; Guarçoni, R.C.; Pinheiro, P.F.; Osório, V.M.; Pinheiro, C.A.; Moreira, T.R.; Caten, C.S.T. New propositions about coffee wet processing: Chemical and sensory perspectives. Food Chem. 2020, 310, 10. [Google Scholar] [CrossRef]
- Vellema, W.; Casanova, A.B.; Gonzalez, C.; D’Haese, M. The effect of specialty coffee certification on household livelihood strategies and specialisation. Food Policy 2015, 57, 13–25. [Google Scholar] [CrossRef]
- Chiputwa, B.; Spielman, D.J.; Qaim, M. Food standards, certification, and poverty among coffee farmers in Uganda. World Dev. 2015, 66, 400–412. [Google Scholar] [CrossRef] [Green Version]
- Bravo-Monroy, L.; Potts, S.G.; Tzanopoulos, J. Drivers influencing farmer decisions for adopting organic or conventional coffee management practices. Food Policy 2016, 58, 49–61. [Google Scholar] [CrossRef] [Green Version]
- Giuliani, E.; Ciravegna, L.; Vezzulli, A.; Kilian, B. Decoupling Standards from Practice: The Impact of In-House Certifications on Coffee Farms’ Environmental and Social Conduct. World Dev. 2017, 96, 294–314. [Google Scholar] [CrossRef] [Green Version]
- Lingle, T. The Coffee Cupper’s Handbook, 4th ed.; Specialty Coffee Association of America: Long Beach, CA, USA, 2011. [Google Scholar]
- Wątróbski, J.; Ziemba, P.; Jankowski, J.; Zioło, M. Green Energy for a Green City—A Multi-Perspective Model Approach. Sustainability 2016, 8, 702. [Google Scholar] [CrossRef] [Green Version]
- Mendoza, A.; Solano, C.; Palencia, D.; Garcia, D. Aplicación del proceso de jerarquía analítica (AHP) para la toma de decisión con juicios de expertos. Ingeniare. Rev. Chil. Ing. 2019, 27, 348–360. [Google Scholar] [CrossRef] [Green Version]
- Hair, J.F.; Black, W.C.; Babin, B.; Anderson, R. Multivariate Data Analysis, 7th ed.; Pearson: Upper Saddle River, NJ, USA, 2010. [Google Scholar]
- Pérez, C. Técnicas de Análisis de Datos con SPSS 15; Pearson: Madrid, España, 2009. [Google Scholar]
- El nuevo día. En la Región Centro la Edad Promedio de los Productores Cafeteros es de 54,5 años. 2019. Available online: http://m.elnuevodia.com.co/nuevodia/actualidad/economica/440623-en-la-region-centro-la-edad-promedio-de-los-productores-cafeteros-es-de- (accessed on 24 July 2020).
- Binam, J.N.; Sylla, K.; Diarra, I.; Nyambi, G. Factors Affecting Technical Efficiency among Coffee Farmers in Cote d’Ivoire: Evidence from the Centre West Region. Afr. Dev. Rev. 2003, 15, 66–76. [Google Scholar] [CrossRef]
- Guido, Z.; Knudson, C.; Finan, T.; Madajewicz, M.; Rhiney, K. Shocks and cherries: The production of vulnerability among smallholder coffee farmers in Jamaica. World Dev. 2020, 132, 104979. [Google Scholar] [CrossRef]
- Abate, K.H.; Belachew, T. Women’s autonomy and men’s involvement in child care and feeding as predictors of infant and young child anthropometric indices in coffee farming households of Jimma Zone, South West of Ethiopia. PLoS ONE 2017, 12, e0172885. [Google Scholar] [CrossRef] [Green Version]
- Anh, N.H.; Bokelmann, W. Determinants of Smallholders’ Market Preferences: The Case of Sustainable Certified Coffee Farmers in Vietnam. Sustainability 2019, 11, 2897. [Google Scholar] [CrossRef] [Green Version]
- Kibet, N.; Obare, G.A.; Lagat, J.K. Risk attitude effects on Global-GAP certification decisions by smallholder French bean farmers in Kenya. J. Behav. Exp. Financ. 2018, 18, 18–29. [Google Scholar] [CrossRef]
- Muñoz-Rios, L.A.; Vargas-Villegas, J.; Suarez, A. Local perceptions about rural abandonment drivers in the Colombian coffee region: Insights from the city of Manizales. Land Use Policy 2020, 91, 104361. [Google Scholar] [CrossRef]
- Wairegi, L.W.I.; Bennett, M.; Nziguheba, G.; Mawanda, A.; de los Rios, C.; Ampaire, E.; Jassogne, L.; Pali, P.; Mukasa, D.; van Asten, P.J.A. Sustainably improving Kenya’s coffee production needs more participation of younger farmers with diversified income. J. Rural Stud. 2018, 63, 190–199. [Google Scholar] [CrossRef]
- Di Donfrancesco, B.; Guzman, N.G.; Chambers, E. Comparison of results from cupping and descriptive sensory analysis of colombian brewed coffee. J. Sens. Stud. 2014, 29, 301–311. [Google Scholar] [CrossRef] [Green Version]
- Perez, J.; Kilian, B.; Pratt, L.; Ardila, J.C.; Lamb, H.; Byers, L.; Sanders, D. Economic Sustainability-Price, Cost, and Value. In The Craft and Science of Coffee; Academic Press: London, UK, 2017; pp. 133–160. [Google Scholar]
- Di Donfrancesco, B.; Guzmanb, N.G.; Chambers, E., IV. Similarities and differences in sensory properties of high quality Arabica coffee in a small region of Colombia. Food Res. Int. 2019, 116, 645–651. [Google Scholar] [CrossRef] [PubMed]
- Seninde, D.R.; Chambers, E., IV. Coffee Flavor: A Review. Beverages 2020, 6, 44. [Google Scholar] [CrossRef]
- Van der Vossen, H.A.M. The cup quality of disease-resistant cultivars of arabica coffee (coffea arabica). Exp. Agric. 2009, 45, 323–332. [Google Scholar] [CrossRef]
- Marquez, N.A.C.; Ocampo, P.A. Variables Determinantes del Precio del Café Arábica en Colombia (2003–2018); Universidad Autónoma de Manizales: Manizales, Colombia, 2019. [Google Scholar]
- Niederhauser, N.; Oberthür, T.; Kattnig, S.; Cock, J. Information and its management for differentiation of agricultural products: The example of specialty coffee. Comput. Electron. Agric. 2008, 61, 241–253. [Google Scholar] [CrossRef]
- CENICAFÉ. Aplicación de Ciencia, Tecnología e Innovación en el Cultivo del Café Ajustado a las Condiciones Particulares del Huila; Comité Edi. Huila; CENICAFÉ: Neiva, Colombia, 2019. [Google Scholar]
- Gonzalez-Rios, O.; Suarez-Quiroz, M.L.; Boulanger, R.; Barel, M.; Guyot, B.; Guiraud, J.; Schorr-Galindo, S. Impact of ‘ecological’ post-harvest processing on the volatile fraction of coffee beans: I. Green coffee. J. Food Compos. Anal. 2007, 20, 289–296. [Google Scholar] [CrossRef]
- Gonzalez-Rios, O.; Suarez-Quiroz, M.L.; Boulanger, R.; Barel, M.; Guyot, B.; Guiraud, J.; Schorr-Galindo, S. Impact of ‘ecological’ post-harvest processing on coffee aroma: II. Roasted coffee. J. Food Compos. Anal. 2007, 20, 297–307. [Google Scholar] [CrossRef]
- Cheong, M.W.; Tong, K.H.; Ong, J.J.M.; Liu, S.Q.; Curran, P.; Yu, B. Volatile composition and antioxidant capacity of Arabica coffee. Food Res. Int. 2013, 51, 388–396. [Google Scholar] [CrossRef]
| Publisher’s Note: MDPI stays neutral with regard to jurisdictional claims in published maps and institutional affiliations. |
© 2020 by the authors. Licensee MDPI, Basel, Switzerland. This article is an open access article distributed under the terms and conditions of the Creative Commons Attribution (CC BY) license (http://creativecommons.org/licenses/by/4.0/).

 ,
, 


