Index of Satisfaction with Public Transport: A Fuzzy Clustering Approach

1
Business Research Unit (BRU-IUL), Department of Quantitative Methods for Management and Economics, Instituto Universitário de Lisboa (ISCTE-IUL), 1649-026 Lisboa, Portugal
2
Business Research Unit (BRU-IUL), Department of Mathematics, Instituto Universitário de Lisboa (ISCTE-IUL), 1649-026 Lisboa, Portugal
*
Author to whom correspondence should be addressed.
Sustainability 2020, 12(22), 9759; https://0-doi-org.brum.beds.ac.uk/10.3390/su12229759
Submission received: 2 October 2020
/
Revised: 13 November 2020
/
Accepted: 16 November 2020
/
Published: 23 November 2020
(This article belongs to the Section Sustainable Transportation)
Abstract
:Increasing public transport use is recognized by many countries as crucial to the pursuit of a global strategy for environmental sustainability and improving urban mobility. Understanding what users value in a public transport service is essential to carry out this strategy. Using fuzzy clustering, we developed an index that measures individual user satisfaction with the public transport service in the metropolitan area of Lisbon and subsequently identified the possible determinants of satisfaction by means of a regression tree model. The results achieved unveil a hierarchical partition of the data, highlighting the diversified level of satisfaction among public transport users that is reflected in the distribution of the index. The managerial implications of the findings for the public transport service are addressed.
1. Introduction
It is widely accepted that cities of the future must become more sustainable—economically, socially, and environmentally—and that public transport has a major role to play in this regard [1]. The relevance of public transportation to this aim was clearly recognized in the UN Climate Summit in 2014 when it was stated that “public transport benefits everyone and ensures that all cities and regions can work, grow and prosper,” and “the public transport sector is working consciously and innovatively to improve its already excellent carbon performance and enhance urban transport networks” ([2], p. 6). Buses, trains, trams, and subways can transport many people at the same time, with fewer carbon emissions than cars, and consequently cause less traffic pressure. These claims have echoed in many countries and concrete actions are already visible. For example, the concern for a sustainable environment has been a driving force for relevant investments towards more eco-friendly public transport systems, such as expansions of metro, train, and tram networks [3]; installing bike parking facilities near train or metro stations; widening of the cycle path network [4]; and switching to electric or hybrid buses [5]. Moreover, the concern for improved mobility has led to enhancements in the quality of the transport service offered to transit users (e.g., low-floor buses for increased accessibility, and improving the quality and quantity of transport information available at stops) [6]. Despite the efforts of government authorities and transport operators in several countries, the effective contributions of the public transport sector to more sustainable societies can only be fully achieved with strong adherence from the populations. Unfortunately, there is a long way to go in this matter. For example, in Lithuania and Romania the percentage of non-users of public transport is below , whereas in Cyprus and Malta the figure exceeds . In Portugal, estimates for the percentage of the population that does not use public transport or that does so less than once a year are around vis a vis the EU28 average of [7]. Clearly, there is room to improve the percentage of users of public transport. However, we cannot expect it to be an easy task, since most people in EU member states acknowledge the car as the main mode of transport for everyday journeys [8].
It is known that a satisfied customer tends to continue to use a service and subsequently to recommend it to others [9,10,11]. Therefore, a strategy aimed at encouraging the use of public transport must start by diagnosing the level of satisfaction (or dissatisfaction) with the service perceived by users and the determinants of satisfaction. With this knowledge, operators can introduce changes in the service provided in order to better fulfill users’ needs and desires. Since it is the users who suffer the consequences of poor service, it is wise to use customer satisfaction surveys to collect and process passengers’ opinions for the design of adequate interventions and strategies. One difficulty that arises in the measurement of users’ satisfaction with public transport service is its underlying multidimensional nature. The quality of the public transport service is influenced by several characteristics, including accessibility, safety, comfort, information, and price (see, e.g., [12]). Therefore, it might be important to evaluate how users globally perceive them. The available data reduction tools (e.g., principal components analysis (PCA) and confirmatory factor analysis) can be used to capture the heterogeneity and reveal the multi-dimensionality of the underlying construct by mapping the original data set from a J-dimensional space into a d-dimensional space, where ; however, in almost every case. From empirical research, varying dimensions () for service quality in public transport are found but there is no consensus about its dimensionality (number and type) (see, for example, [13] which suggests eight dimensions, whereas only two dimensions are suggested in [14]). Fuzzy clustering is a multidimensional approach to data analysis that allows us to achieve the goal , if certain conditions are met. In the case of the public transport sector this means that starting from a set of characteristics to describe the service quality, fuzzy clustering will potentially provide a single dimension to measure users’ satisfaction with the service. In particular, the grade of membership (GoM) model devised Woodbury and Clive [15], which can be regarded as a discrete version of PCA [16], potentially gives rise to a hierarchical fuzzy partition of the data, provided the data hide such a hierarchy (see, e.g., [17]). The idea of using the fuzzy sets theory to build an index of satisfaction is not new (see [18]), but the way this task is accomplished here is very different. Zhou et al. [18], for example, divide passengers into groups according to different attributes and end with a fuzzy inference system to account for an overall satisfaction score in each group of users. It should be noted that fuzzy analysis has been broadly used in different research areas, as can be attested by recent papers [19], in the context of content-based image retrieval, or [20], to evaluate the air quality.
In this study we explore the potential of the GoM model to provide a quantitative measure of fuzzy clusters and eventually use the concept of partial membership to account for the individual score that represents his/her index of satisfaction with the public transport. Starting from these considerations, the aim of this study was to investigate the attributes that most influence public transport users when doing an evaluation about the public transport system, using a fuzzy approach and subsequently regression analysis. In this paper, we (i) apply the GoM model to summarize in one single variable the multidimensional construct of satisfaction with public transport service; and (ii) apply regression analysis to disclose the factors influencing public transport users’ satisfaction. The next section is a literature review of works concerning the analysis of the quality of the public transport service and its relationship with users’ satisfaction; the review aims to explore which methodologies were used and which factors were investigated. The methodologies used for developing an index of satisfaction with public transport service and for evaluating the determinants of satisfaction are addressed in the following section. Next, the context and data used for the analysis are described, followed by a brief description of how regression tree analysis works. The outcomes obtained through fuzzy clustering analysis and regression trees are then detailed. A final section highlights the main findings and conclusions of the research.
2. Literature Review
Quality of service reflects the customer’s perception of service performance. Among the several approaches and techniques used to define and assess quality of service [21], customer satisfaction is the most consensual. In the public transport sector, customer satisfaction is associated with a post-consumer evaluative judgment of the service and is described as a feeling of pleasure or disappointment resulting from the comparison between the perceived performance of the service and the customer’s expectations. In other words, when the performance is perceived as meeting or exceeding expectations, the customer is satisfied, which means that the service provider delivered a high quality service; but when the opposite is true, the customer is not fully satisfied and reacts negatively to the experience [22]. The EN 13816 Standard, constituted by the European Committee for Standardization (CEN) in 2002, is guidance to define, target, and measure the quality of the service in public passenger transport. The overall quality encompasses several criteria that represent the passenger’s view of the service provided, and for this standard, they are divided into eight categories: availability (extent of the service offered in terms of geography, time, frequency, and transport mode); accessibility (access to public transport system including interface with other transport modes); information (systematic provision of knowledge about the public transport system to assist the planning and execution of journeys); time (aspects of time relevant to the planning and execution of journeys); customer care (service elements introduced to effect the closest practical match between the standard service and the requirements of any individual passenger); comfort (service elements introduced for the purpose of making public transport journeys relaxing and pleasurable); security (sense of personal protection experienced by passengers); and environmental impact (effect on the environment resulting from the provision of the public transport service) [23]. The quality of public transport service has been investigated by many researchers. In the following literature review we report several studies conducted to evaluate the quality of public transport—either in general or focused on a specific mode of transport—and to identify the characteristics that most influence overall service quality.
Wen et al. [11] used both exploratory and confirmatory factor analysis to extract the latent factors underlying bus service quality from a large number of service quality indicators. Four dimensions were found, namely, on-board amenity, crew’s attitude, station performance, and operational performance. Using structural equation modeling, the positive effect of service quality on satisfaction was confirmed, among other significant relationships between factors. By means of the exploratory factor analysis, Eboli and Mazzula found in [9] four variables to describe service quality in bus transport on a university campus: service planning and reliability; comfort and other factors; safety and cleanliness; and network design. A structural equation model was then formulated to explore the impact of the relationship between global customer satisfaction and service quality attributes. Perez et al. [24] used the well-known SERVPERF scale [25] to study service quality in the public transport industry. They used an ordered logit regression to explore the impacts of the five SERVPERF dimensions–tangibility, reliability, receptivity, assurance, and empathy—on the intention to use public transport. The study conducted by Tyrinopoulos and Antoniou [21] focused on passengers’ perceptions of transit performance and used factor analysis and ordered logit modeling to explore relationships between satisfaction with public transit users and service quality. From factor analysis, four underlying unobserved factors describing customer satisfaction/dissatisfaction with the public transit service were found: quality of the service, transfer quality, service production, and information/courtesy. Market segmentation analysis was conducted at a posterior stage to identify distinct segments in terms of satisfaction with the service. Prasad and Shekhar [13] proposed an extension of the 5-dimension SERVQUAL instrument [26] to evaluate the passenger rail service quality of Indian railways by adding three new transport dimensions: service product, social responsibility, and service delivery. By means of Cronbach’s alpha coefficients, the internal consistency of model’s attributes was assessed. This research also identified the order of importance for the eight factors, for example service delivery, reliability, and empathy were identified as the most negatively assessed dimensions among passengers. In a first phase, the study of Del Castillo et al. [27] groups a set of 35 attributes into eight categories to describe the bus service, namely, frequency, travel time, punctuality, prices, information, cleanliness, staff performance, comfort, and safety. The authors subsequently resorted to models based on averages, a model based on a multivariate discrete distribution, and a generalized linear model to identify and quantify the relationship between overall satisfaction with the service and satisfaction with specific aspects of the service—line reliability, adequacy of the bus stop, bus punctuality, connection to lines of other operators, and service frequency were clearly the most important factors accounting for overall satisfaction with bus service. D’Ovidio et al. [28] used a categorical principal component analysis to disclose six latent variables describing the quality of public transport services in a local context: comfort and cleanliness, service accessibility, service organization, behavior of ticket inspectors, behavior of the staff, and service costs. The final result of this study was a structural equation model, representative of the passengers’ perceptions towards quality in public transport. De Oña et al. [12] used a classification and regression tree approach to assess the characteristics that most influence overall passenger railway service quality. The service aspects evaluated covered safety, cleanliness, comfort, service, information, personnel, and other factors, and the analysis revealed that attributes related to service are the most determinant of the overall satisfaction. Considering the studies mentioned above, we can conclude that public transport service quality has been measured by different approaches based on transit users’ opinions, collected in most cases by means of customer satisfaction surveys. Moreover, the methods underlying the analyses have their own assumptions and predefined relationships between dependent and independent variables which inevitably affect the assessment of overall satisfaction with public transport service. In this context, an approach based on fuzzy clustering can bring efficiency to the analysis by providing one single indicator capable of measuring overall satisfaction with the public transport service without disregarding the myriad of attributes describing the service.
3. Fuzzy Clustering
3.1. Grade of Membership Model
The GoM model was introduced in [15] and further developed in [29]. This statistical tool is devoted to categorical data and aims to estimate fuzzy partitions that, by assumption, underlie the discrete universe of discourse or population . A fuzzy partition is a set of fuzzy sets or clusters, say, , , …, , where the element or individual i belonging to is represented by the grade of membership vector
such that , , and . The generic coordinate accounts for the degree of belongingness of individual i to fuzzy cluster . We assume that the sets , , …, form a normal fuzzy partition of , which entails each set having at least one full member or prototype. For example, the GoM representation of prototype would be . The prototypes represent fuzzy clusters and are therefore used to compile them based on a sample of , as follows.
Let be a vector of polytomous observed variables where , , 2, …, J, where is the number of possible categories of jth variable. The observation corresponding to individual i is represented by , , 2, …, I, where I is the sample size. The GoM model is based on I realizations of . There are two sets of parameters, and , which are latent to the data space. Reference has already been made to the former in (1); is the probability of a prototype of fuzzy set having the outcome l in jth variable. Formally,
; ; . Clearly,
We can anticipate that high values of are used to characterize the fuzzy cluster . However, “high” is itself a fuzzy concept and therefore it must be made clear. In any case, the conjunction of all different conditions inherent to defines the typology associated with this set, and hopefully helps label it with a scientifically acceptable meaning.
The GoM model links the observed data to the latent space, (1) and (2), in probabilistic terms by postulating that the probability of individual i having the outcome l in variable is given by
Thus, the individual’s position in the fuzzy partition is accounted for by the way he/she projects into prototypes. So the GoM model addresses clustering and discriminant analysis simultaneously.
For a fixed value of , and given I realizations of , the likelihood of GoM model can be written as [29]:
where is a binary variable such that
The model parameters and are estimated by maximizing the likelihood function (4). We carried out this step using DsiGoM Software [30], and will refer to the corresponding estimates as and .
The goodness-of-fit of the model is assessed by a likelihood ratio test [31] based on the statistic
where is the likelihood associated with a cluster-free solution and is given in (4). Under the null hypothesis, i.e., when is the true model, the probability distribution of (5) can be approximated to a chi-square distribution with the degrees of freedom equal to the number of estimated parameters.
3.2. Fuzzy Cluster Labeling
Having obtained the estimates , which measure how different variable categories prevail in prototypes and inherently in fuzzy clusters, it is desirable to label those clusters so as to better interpret the (estimated) underlying structure of the universe . For this purpose, we closely followed the criteria established in [32] which use the sample frequency as a baseline to judge the importance of the pair variable-category in fuzzy cluster . The quantity is then regarded as a trend in the population as a whole. If is much higher than it signals the category l as a prevailing value of variable in , meaning that it occurs here more frequently than expected in . Thus, if
the pair is considered a distinctive condition of . In our study, we subjectively set . However, this criterion does not work well when is high (e.g., ). Therefore, for high frequencies we opted to tag as distinctive whenever
The conjunction of all distinctive conditions is used to define the typology associated with the estimated fuzzy clusters.
3.3. Post Hoc Analysis
One of the key features of the GoM model is the possibility of establishing a quantitative measure of fuzzy clusters , , …, , based on the respective prototype outcome probabilities . Since are latent (non-observable), in practice we instead use their estimates . We recall that is the probability of a prototype having the outcome l in variable . Therefore, the quantity
can be taken as an estimate for the expected value of the outcome of prototype for (see [33] for details). Summing (8) and averaging out by the total number of variables J,
we obtain an overall “outcome” of fuzzy cluster . So we consider in (9) as a quantitative measure for this cluster. Now we recall the formula (3) where the individual position in a fuzzy partition is accounted for by his/her projection on prototypes. Following the same reasoning, the functional
provides a quantitative measure for the individual i positioning in fuzzy partition. Under certain conditions, the analytical tool (10) can be used as a potential individual satisfaction index for public transport users. We will see that our data set hides a hierarchical fuzzy partition, allowing us to eventually explore (10) to estimate a regression model to assess the factors that might be influencing public transport users’ satisfaction with the service.
4. Regression Trees
A decision tree is a non-parametric supervised learning algorithm that can be applied to both regression and classification problems. In keeping with the tree analogy, decision trees implement a sequential decision process following a top-down strategy. Starting from the root node and using specific division criteria based on the discriminating or predictor variables with significant effect on a predefined target variable, the initial set of individuals is split into two or more sub-nodes. The splitting process continues until a leaf or terminal node is met, a node that cannot be split any further. It is a top-down and greedy approach called recursive binary splitting. Top-down since it begins at the top of the tree (all observations in node 0) and then successively splits the predictor space. Each split is indicated via two or more new branches further down the tree. The selection of the predictor variable and the specific split or cut-point is chosen using a greedy algorithm to minimize a cost function. It is greedy since at each step of the tree building process, the best split is a local optimum based solely on information for that particular split, rather than looking ahead and picking a split that will lead to a better tree in a future split or a global optimum.
Each subset is subdivided recursively until all are “pure” (that is, when the cases in each subset are homogeneous) or until that “purity” cannot be increased. Thus, the terminal nodes of the tree are obtained according to the values of the target variable [34]. A node which is divided into sub-nodes is called the parent node of sub-nodes, whereas a sub-node is the child of the parent node. The complexity of a decision tree is defined as the number of splits in the tree. Simpler trees are preferred; they are easy to understand and are less likely to overfit the data.
The tree growing method attempts to maximize within-node homogeneity. The extent to which a node does not represent a homogenous subset of cases is an indication of impurity. All predictor variables and all possible split points are evaluated and chosen in a greedy manner (e.g., the very best split point is chosen each time).
To split the nodes at the most informative features using the decision algorithm, we start at the tree root and split the data on the predictor variable that results in the largest information gain (). The objective is to maximize the function at each split; it is defined as follows:
where and are, respectively, the data sets of the parent and the child node ; f is the feature to perform the split; is a measure of impurity; is the total number of cases at the parent node; and is the number of cases in the child node. The information gain is simply the difference between the impurity of the parent node and the sum of the child nodes’ impurities. The lower the impurity of the child nodes, the larger the information gain.
Depending on the nature of the target variable, whether categorical or metric, classification trees or regression trees are developed, respectively. The three impurity measures or splitting criteria commonly used in decision trees are Gini impurity, entropy, and misclassification error.
To use a decision tree for regression, however, we need an impurity metric that is suitable for continuous variables. Two common impurity measures are:
- -
- Least squares (similar to minimizing least squares in a linear model) where splits are chosen to minimize the residual sum of squares between the observations and the mean in each node. It is computed as the within-node variance, adjusted for any frequency weights or influence values.
- -
- Least absolute deviations that minimize the mean absolute deviation from the median within a node. The advantage of this over least squares is that it is not as sensitive to outliers and provides a more robust model. The disadvantage is its insensitivity when dealing with data sets containing large proportions of zeros.
There are several advantages associated with regression trees over other traditional segmentation methods: they are very easy to explain; results are easy to interpret even by a non-expert since they more closely mirror human decision-making than the regression and classification approaches; they can be displayed graphically; but above all, the general regression tree methodology can easily handle a mixture of quantitative and categorical predictors without the need to create dummy variables. Unfortunately, disadvantages are also found: they do not have the same level of predictive accuracy as some of the other regression and classification approaches; and if the tree is too big, interpretation is more difficult. It is possible to prune the tree to reduce complexity, improve predictive accuracy, and avoid overfitting. Pruning is a technique to reduce the size of the decision tree by removing some sub-nodes from the decision tree: the tree is grown until stopping criteria are met, and then it is trimmed automatically to the smallest subtree based on the specified maximum difference in risk. For metric dependent variables, the risk estimate is the within-node variance.
Partitioning stops when there are no cases left, when all cases for a given node are homogeneous or when there are no remaining predictor variables for further partitioning. Alternatively, the process can end using a predefined stopping criterion: (i) performing a new split only if the decrease in impurity due to each split exceeds a predetermined threshold; or (ii) stopping the splitting process only when some minimum leaf node size is found. With this criterion, increasing the minimum node size tends to produce trees with fewer nodes and vice versa. One-hundred cases for parent nodes and fifty cases for child nodes are values usually accepted but, when the total sample dimension is small, it may result in trees with no nodes below the root node; in this case, lowering the minimum values may produce more useful results.
In some situations, regression models and clustering methods could be considered viable alternatives to regression trees. Regression trees, like regression models, make it possible to find the independent variables that best explain the variation of the dependent variable. However, unlike regression models, they allow the segmentation of observations and groups of individuals to be found that minimize the dependent variable within group dispersion. Unlike linear regression, regression trees do not develop a prediction equation. Instead, data are partitioned along the predictor axes into subsets with homogeneous values of the dependent variable.
Like clustering methods, regression trees allow the segmentation and grouping of individuals who are likely to be members of a particular group. However, as traditional clustering methods are unsupervised, they do not allow clusters to minimize dispersion within groups with respect to a dependent variable. A regression tree analysis fits our study well since it aims to explore the predictor variables that best explain the level of satisfaction with public transport (the target variable), as measured by the index created following a fuzzy cluster analysis. We used IBM SPSS Statistics software (version 26) with the regression tree CHAID method to estimate the trees and the least squares deviation impurity measure.
5. Study Context
The public transportation system in the Metropolitan Area of Lisbon (MAL) (Portugal) includes road, rail (train, tram, and subway), and boat transport. The bus is the most used mode of travel—more than of commuting trips are made by bus—followed by the train () [35]. Under the Portuguese Strategic Plan for Transport and Infrastructures “Portugal 2020,” private and public operators have made investments to renew their fleets both quantitatively—an increase of in the number of buses is expected to be complete by mid 2021—and qualitatively—a large part of the new fleet will be environmentally friendly vehicles, easily accessible to passengers with reduced mobility and wheelchair users [36]. Moreover, in recent decades important infrastructural investments have been made, namely, the extension of the subway network and the railway connection of the two margins of the River Tagus. With the Lisbon municipality at its center, MAL is the biggest metropolitan area in Portugal encompassing 18 municipalities spread over nearly 3000 km to the north and south of the River Tagus estuary. In 2018, the estimated population in this area was approximately 2.8 million people [37].
The data used in this study were obtained from a survey conducted in 2014 at the request of the Metropolitan Transport Authority of Lisbon with the aim of describing the travel behavior of public transport users and evaluating their satisfaction with the public transport service. The survey covered the adult population of public transport users living in the MAL. The sample was allocated proportionally to the 18 municipalities of the MAL. In each municipality, quotas of sex and age were set in accordance with the most recent census data [38] to improve sample representativeness. Within each municipality, sampling areas were chosen to guarantee adequate geographical coverage of the municipality. Interviewers were assigned to sampling areas to look for respondents and administer the questionnaire. Respondents were selected on the street, and interviewed in person after confirming municipality, sex, and age quotas. A total of 1166 valid questionnaires were obtained from public transports users.
The survey questionnaire comprised two main sections. The first section provided general information about travel habits (e.g., travel reason, use frequency, private car available) and socio-economic characteristics of passengers (gender, age, and income). The second section of the survey specifically addressed users’ perceptions about service characteristics. The interviewers asked the participants to rate 26 service attributes using a ten-point Likert-type scale ( totally dissatisfied to totally satisfied): (1) “punctuality/waiting time”; (2) “speed on route”; (3) “adequacy of routes offered”; (4) “timetables”; (5) “frequency of vehicles on weekdays”; (6) “frequency of vehicles on weekends”; (7) “comfort of vehicles”; (8) “number of seats”; (9) “safety of persons and property”; (10) “ease of entering/exiting the vehicles/stations”; (11) “distance to the stop/station/terminal”; (12) “frequency of strikes”; (13) “alternative transport in strike period”; (14) “rules of purchase and use of tickets and passes”; (15) “inspection of transport tickets”; (16) “price compared to alternative transport”; (17) “intermodal coordination”; (18) “staff behavior”; (19) “single ticket price”; (20) “availability and clarity of information about lines, schedules and tariffs”; (21) “behavior of other passengers”; (22) “monthly pass price”; (23) “service for complaints and suggestions”; (24) “complaints resolution capacity”; (25) “quality/price ratio”; (26) “comfort of stops and stations.” The questionnaire items were constructed using: (i) the outcomes of 6 focus groups, conducted in advance to assist questionnaire design [39], (ii) the European Customer Satisfaction Index [40], and (iii) the literature review on transit ridership [9,27,41,42,43,44,45,46].
The sample characteristics are represented in Table 1. There were more females than males (). Most of the respondents were 45 years or older (), nearly half of the respondents had household monthly incomes equal or below €800 (), and only a small proportion had a monthly income above €2400 (in 2018, the average monthly income in MAL was approximately €1400 [47]). Car ownership was positively reported by most of the respondents (). The results showed that most passengers traveled every day () or frequently (5 days a week) (). The main reasons cited for using public transport were commuting () and personal affairs (). The bus is the transport mode used by most respondents () and the boat the least used ().
We began by decomposing this sample in fuzzy clusters using the GoM model and noticed a hierarchical structure of the underlying fuzzy partition. This made it possible to use the results in [33] to create a public transport user index of satisfaction. In a subsequent analysis, we used this index to estimate a regression tree model to understand how the satisfaction can be predicted by socio-demographic characteristics and public transport use patterns. For the regression tree analysis some variables were grouped into a smaller number of categories to achieve a better representation of these classes. This grouping is represented in Table S1, in the Supplementary File. The variable “reason for public transport use” was reduced to the three most important categories (travel home-work-home, personal affairs, and other). Frequency of public transport use was reduced to three categories (frequent, less frequent, and sporadic). Passengers traveling every day or 5 days a week were labeled as frequent users, passengers traveling 1 to 4 days/week were labeled as less frequent users, and those using public transport 1 to 3 days/month or less were labeled as sporadic. The categories “always” and “often” of the variable “how often it arrives late at the destination” were merged into a single category.
6. Results
6.1. Index of Satisfaction
The GoM model was applied to the sample of public transport users who rated their satisfaction level in service attributes. Based on the likelihood ratio test (5), the model with fuzzy clusters fits the data better than any other attempted with several different values of K. Table S2 in Supplementary File displays the estimates highlighting the distinctive conditions in red. We noticed an upward trend in the level of satisfaction from fuzzy cluster to fuzzy cluster , which results in a hierarchical fuzzy partition: from less satisfied to very satisfied. To confirm this trend in quantitative terms we calculated the estimated average value (9) for each fuzzy cluster for every variable in the analysis. Table 2 shows that the expected value of consistently increases from one fuzzy cluster to the successive fuzzy cluster, making it possible to infer the hierarchical nature of the underlying fuzzy partition. Even though the fuzzy cluster represents the least satisfied public transport users , we see that some attributes of service are more critical than others: e.g., (“distance to the stop/station/terminal”), (“inspection of transport tickets”), and (“intermodal coordination”), where passengers give a very low rate. On the other hand, they take a more favorable view on “ease of entering/exiting the vehicles/stations” ().
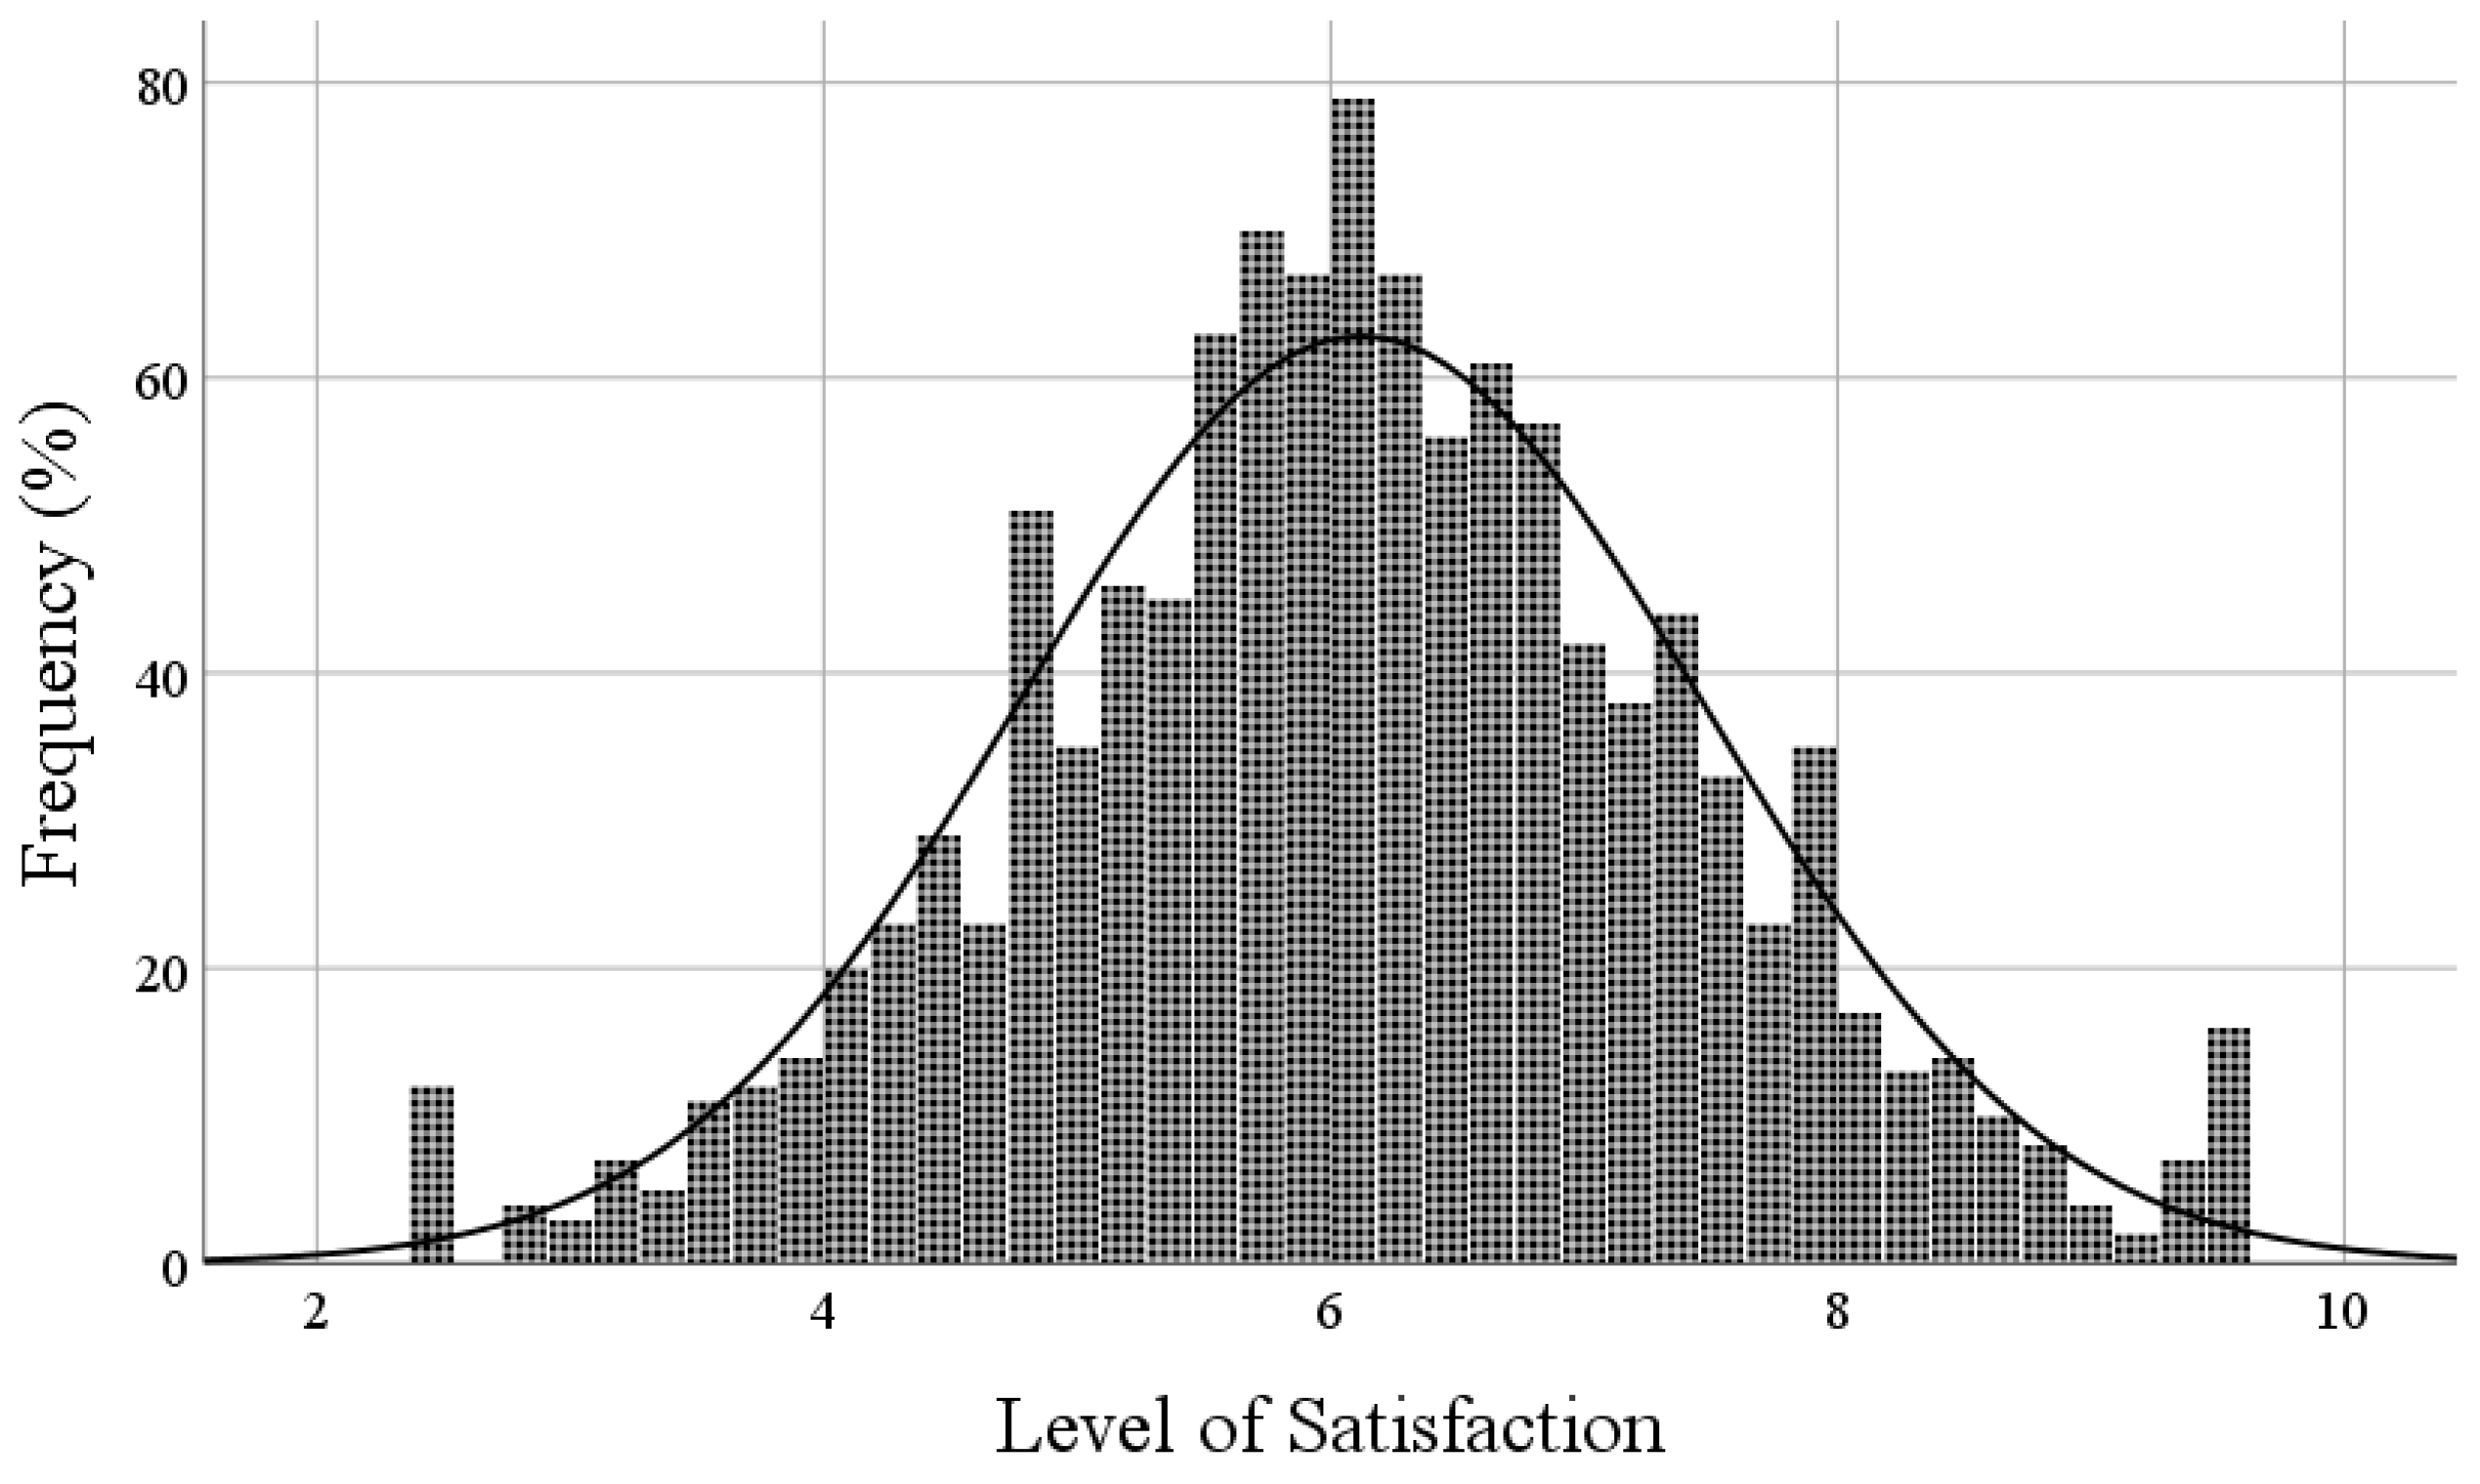
Following the data analysis, we used the functional (10) to estimate the level of satisfaction for every public transport user in the sample since the vector , as in (1), highlighting the user i’s position in this hierarchical context. In other words, the functional (10) is used as an index for the satisfaction of the public transport user i, and its distribution is displayed in Figure 1, which can be fairly approximated to a normal distribution with average and standard deviation . The satisfaction index reveals that, on average, public transport users of MAL are not convincingly satisfied with the service. However, the five hierarchical fuzzy clusters reveal that the perception of satisfaction is not uniform among different users. These differences can be explored to disclosure specific profiles of satisfaction that public transport authorities can eventually work on in order to improve (even more) the service, and consequently, attract more users.
The estimates further provide an idea of how individuals are distributed among fuzzy clusters. The statistic
gives an estimate of the relative cardinality of fuzzy cluster . The calculations yield the following results: ; ; ; ; and . We realize that the two extreme clusters, standing for lowest and highest satisfaction, are the least populated. This is quite consistent with the likely overall normality of public transport users’ satisfaction since it entails less weight on the distribution tails (see Figure 1).
6.2. Overall Satisfaction with Public Transport
As stated previously, the MAL spreads over to the north and south of the River Tagus estuary. Not only are the two areas “naturally” stratified between the north and the south of this river, but they also have important differences in the pattern of commuting trips. Governmental and central administration services are concentrated in the northern area; most universities and science and technology activities are in the MAL-north; and there is a concentration of services in this area. This implies that most of the commuting trips of southern residents, be they for work, study, or leisure/entertainment motives, are “into the MAL-north,” while the commuting trips of northern residents are mostly “within the MAL-north.” As a result, the two areas differ in the public transport network available: the southern area has a limited subway network, spread across the two municipalities closest to the margin of the River Tagus, while in the north area the subway network is approximately 40 km long, serving five municipalities; the boat is mainly used by southern residents to cross the river to the northern area, and is scarcely used by northern residents [48].
These differences cause specific needs and different preferences regarding the public transport service in the north and south areas of MAL and are likely to contribute to a heterogeneity in the assessment public transport users make of the quality of service provided. This dispersion may reduce the reliability of the assessment of users’ satisfaction with the service both in terms of the influence that each attribute has on the perception of the overall satisfaction and the recognized level of quality of each service attribute. In such situations, it is wise to stratify the sample into segments with greater homogeneity of opinions [12,49,50]. Table 3 presents descriptive statistics of the satisfaction index for the overall sample, for the north, and for the south area of MAL. The two-sample t-test for difference of means revealed significant differences (, p-value ) between MAL-north (less satisfied) and MAL-south in the average satisfaction index; this led to the decision to stratify the sample in MAL-north and MAL-south and to develop a satisfaction regression model in each sub-area independently.
6.3. Decision Trees: Influential Factors
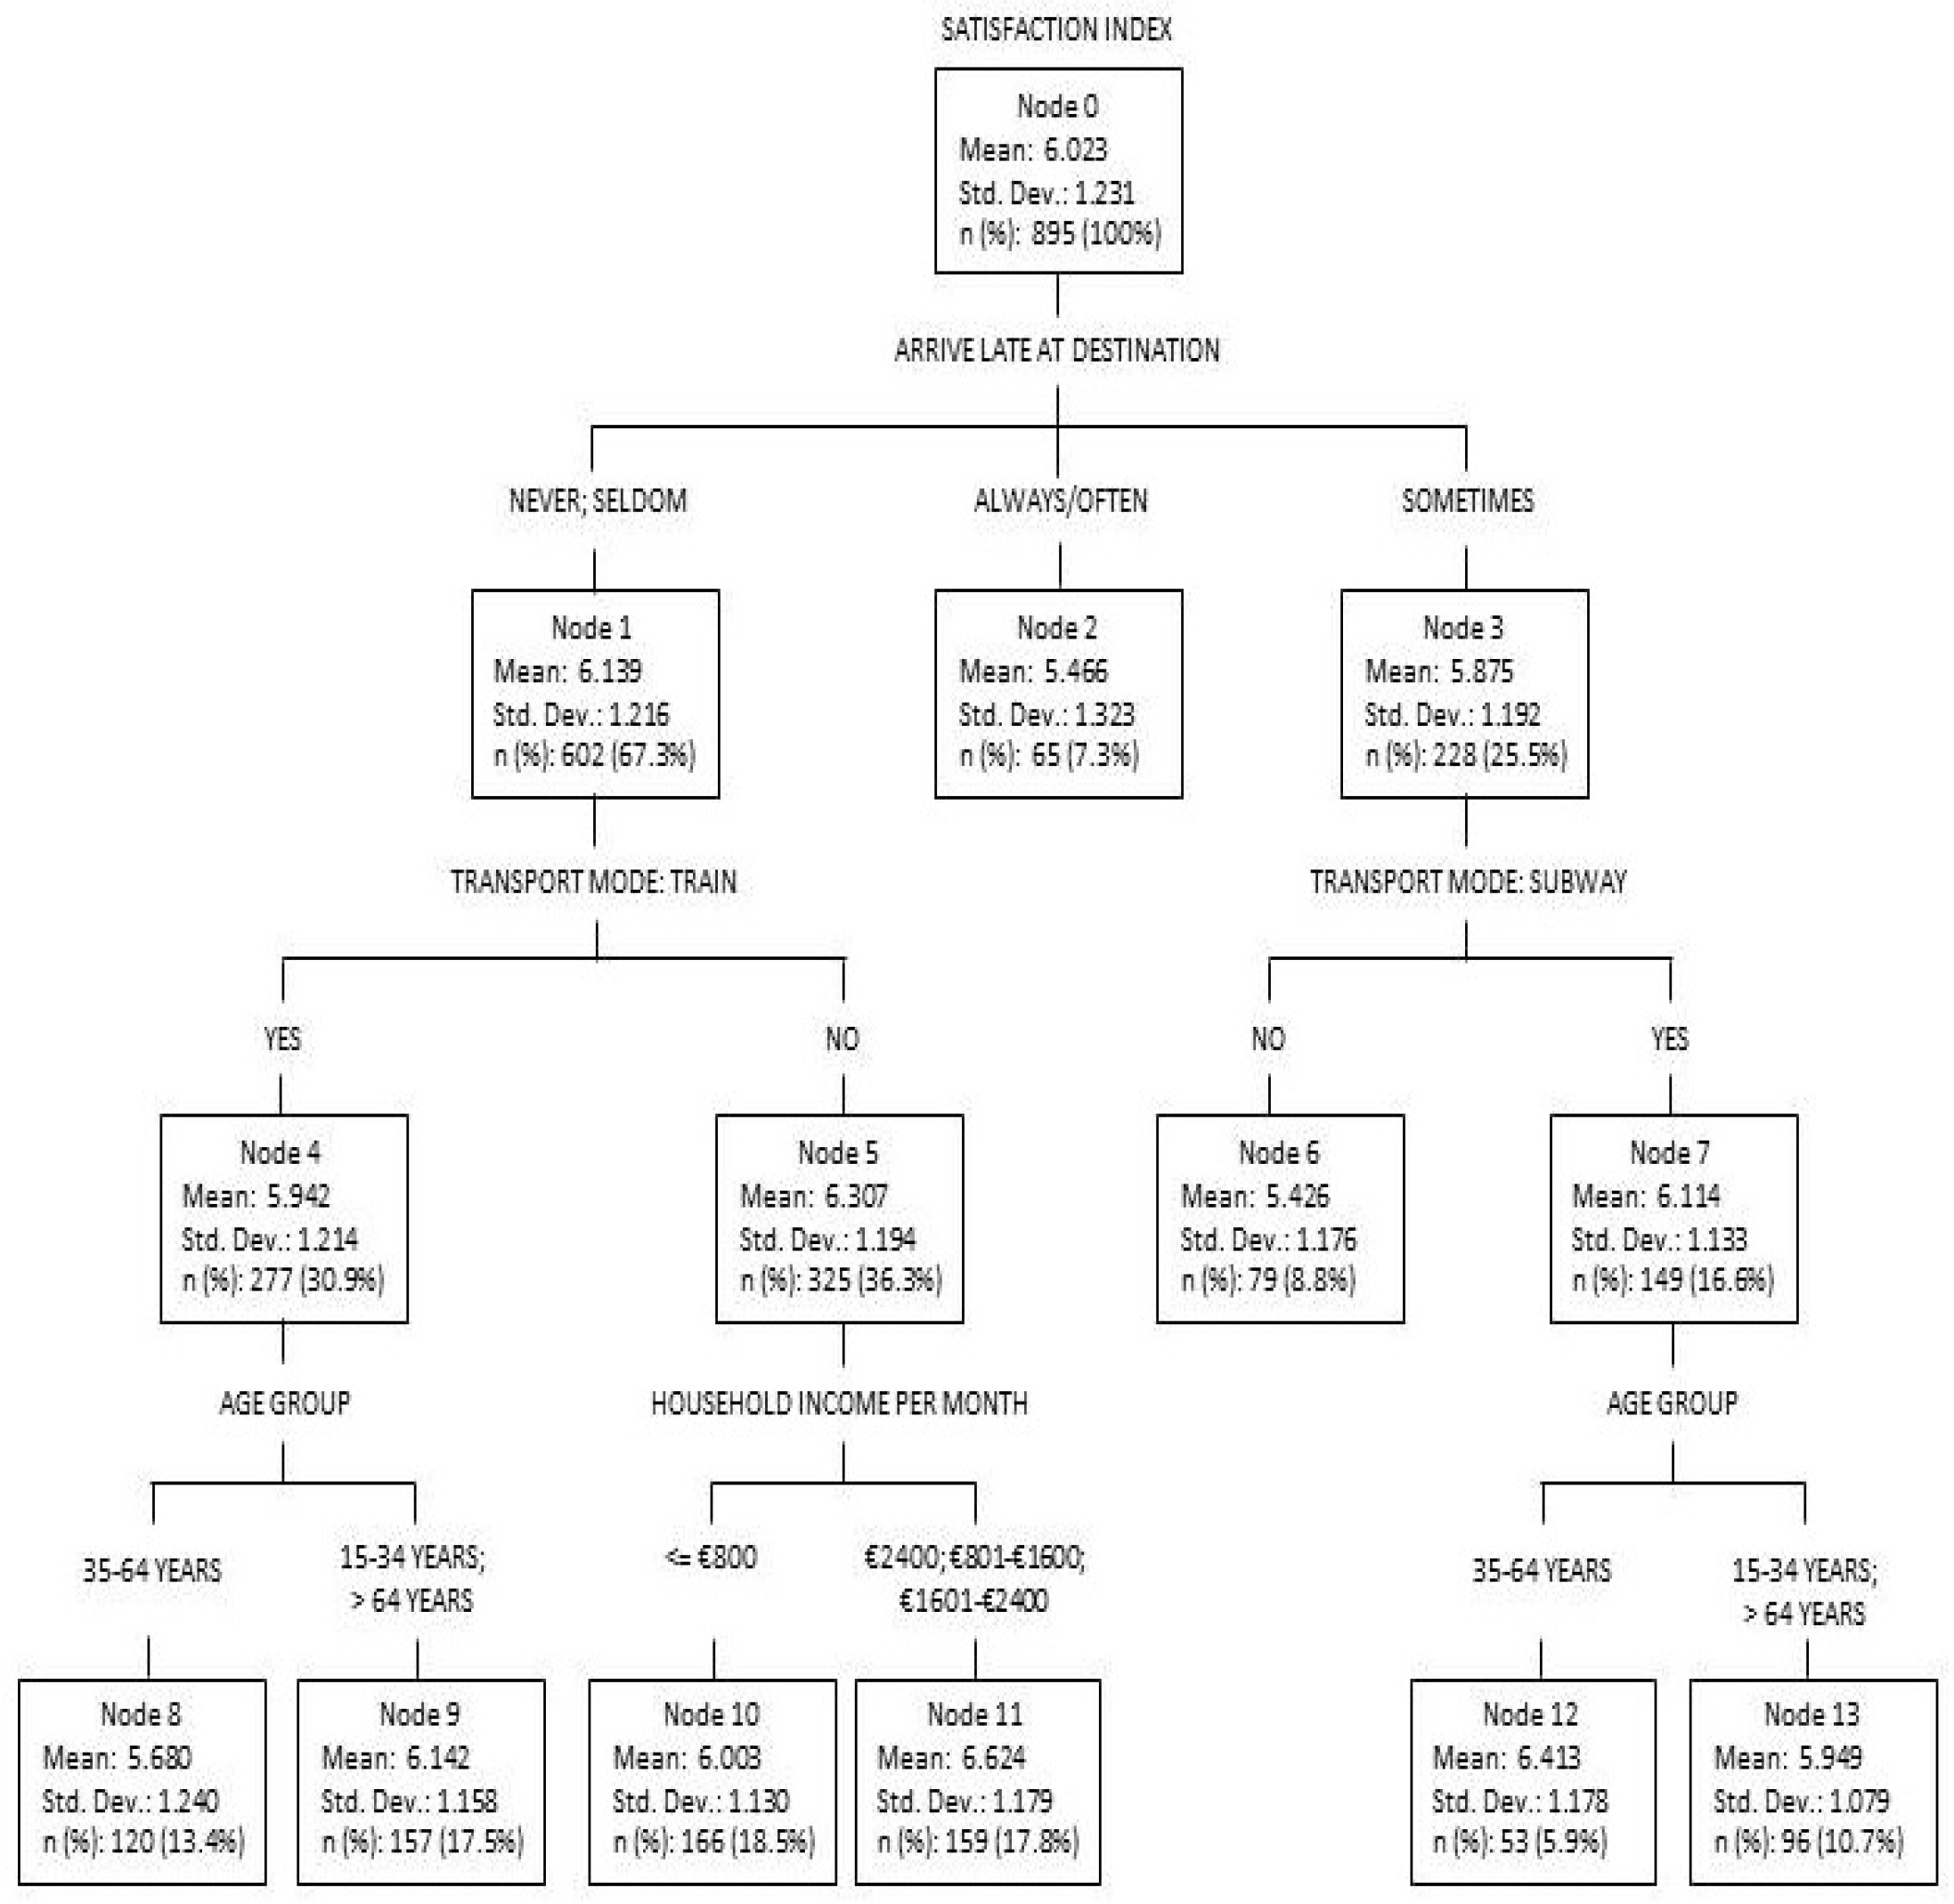
Since several factors influence satisfaction (e.g., [51]), it is necessary to set the factors that may influence public transport users’ satisfaction with the public transport service; these mainly include service factors, such as the transport modes used and frequency of no delays in arriving at destination; travel attributes, such as travel purposes and frequency of public transport use; and individual attribute factors such as gender, age, income, and car ownership. Two different regression tree models were estimated: one corresponding to MAL-north (Figure 2) and the other to MAL-south (Figure 3). For the MAL-south model, 13 variables were used as independent variables; for the MAL-north model, 12 variables were used as independent variables—the variable “mode of public transport used: boat” was excluded because the northern residents scarcely use this transport mode.
The tree built for the MAL-north sample was the most complex, with the largest structure. It produced 13 nodes, eight of which were terminal nodes. The predictors of this regression tree were the variables “how frequently it arrives late at destination”, age, income, mode of public transport used: train, and mode of public transport used: subway. The risk estimate (a measurement of within-node variance) was (standard error ).
The primary split for this sample was “how frequently it arrives late at destination.” It keeps those users that never or seldom arrive late at their destination toward the left branch of the tree, away from those who always/often arrive late (central branch of the tree) and those who report that sometimes they arrive late (right branch of the tree). The perception of overall satisfaction decreases significantly from the root node to node 2. This node is constituted by users that rate overall satisfaction as and represents of the sample of this tree. Additionally, the regression tree reveals that most of the sample in this tree () reported that they never or seldom arrive late at their destination (node 1) which is a very positive sign of good functioning of the public transport system.
Following the paths created between the root node and each terminal node in the model built, interesting relationships of variables could be identified to elucidate passenger reflections regarding satisfaction with the service [49]. When passengers reported never/seldom arriving late at their destinations, and when they did not use the train and when their household income was above €800, the satisfaction index mean had its highest value, (node 11)—these are the passengers most satisfied with the service. On the other hand, when passengers reported sometimes arriving late at their destinations, and when they did not use the subway, the satisfaction index mean had its lowest value, (node 6)—these are the passengers least satisfied with the service. Other associations with potential interest for transport planners and providers are as follows: (i) train users aged between 35 and 64 years tend to be less satisfied with the transport service than the overall sample of this tree (node 8; satisfaction index mean = ), despite reporting that they never or seldom arrive late at their destinations; and (ii) subway users aged between 35 and 64 years tend to be more satisfied with the transport service than the overall sample of this tree, although they sometimes arrive late at their destinations (node 12; satisfaction index mean ).
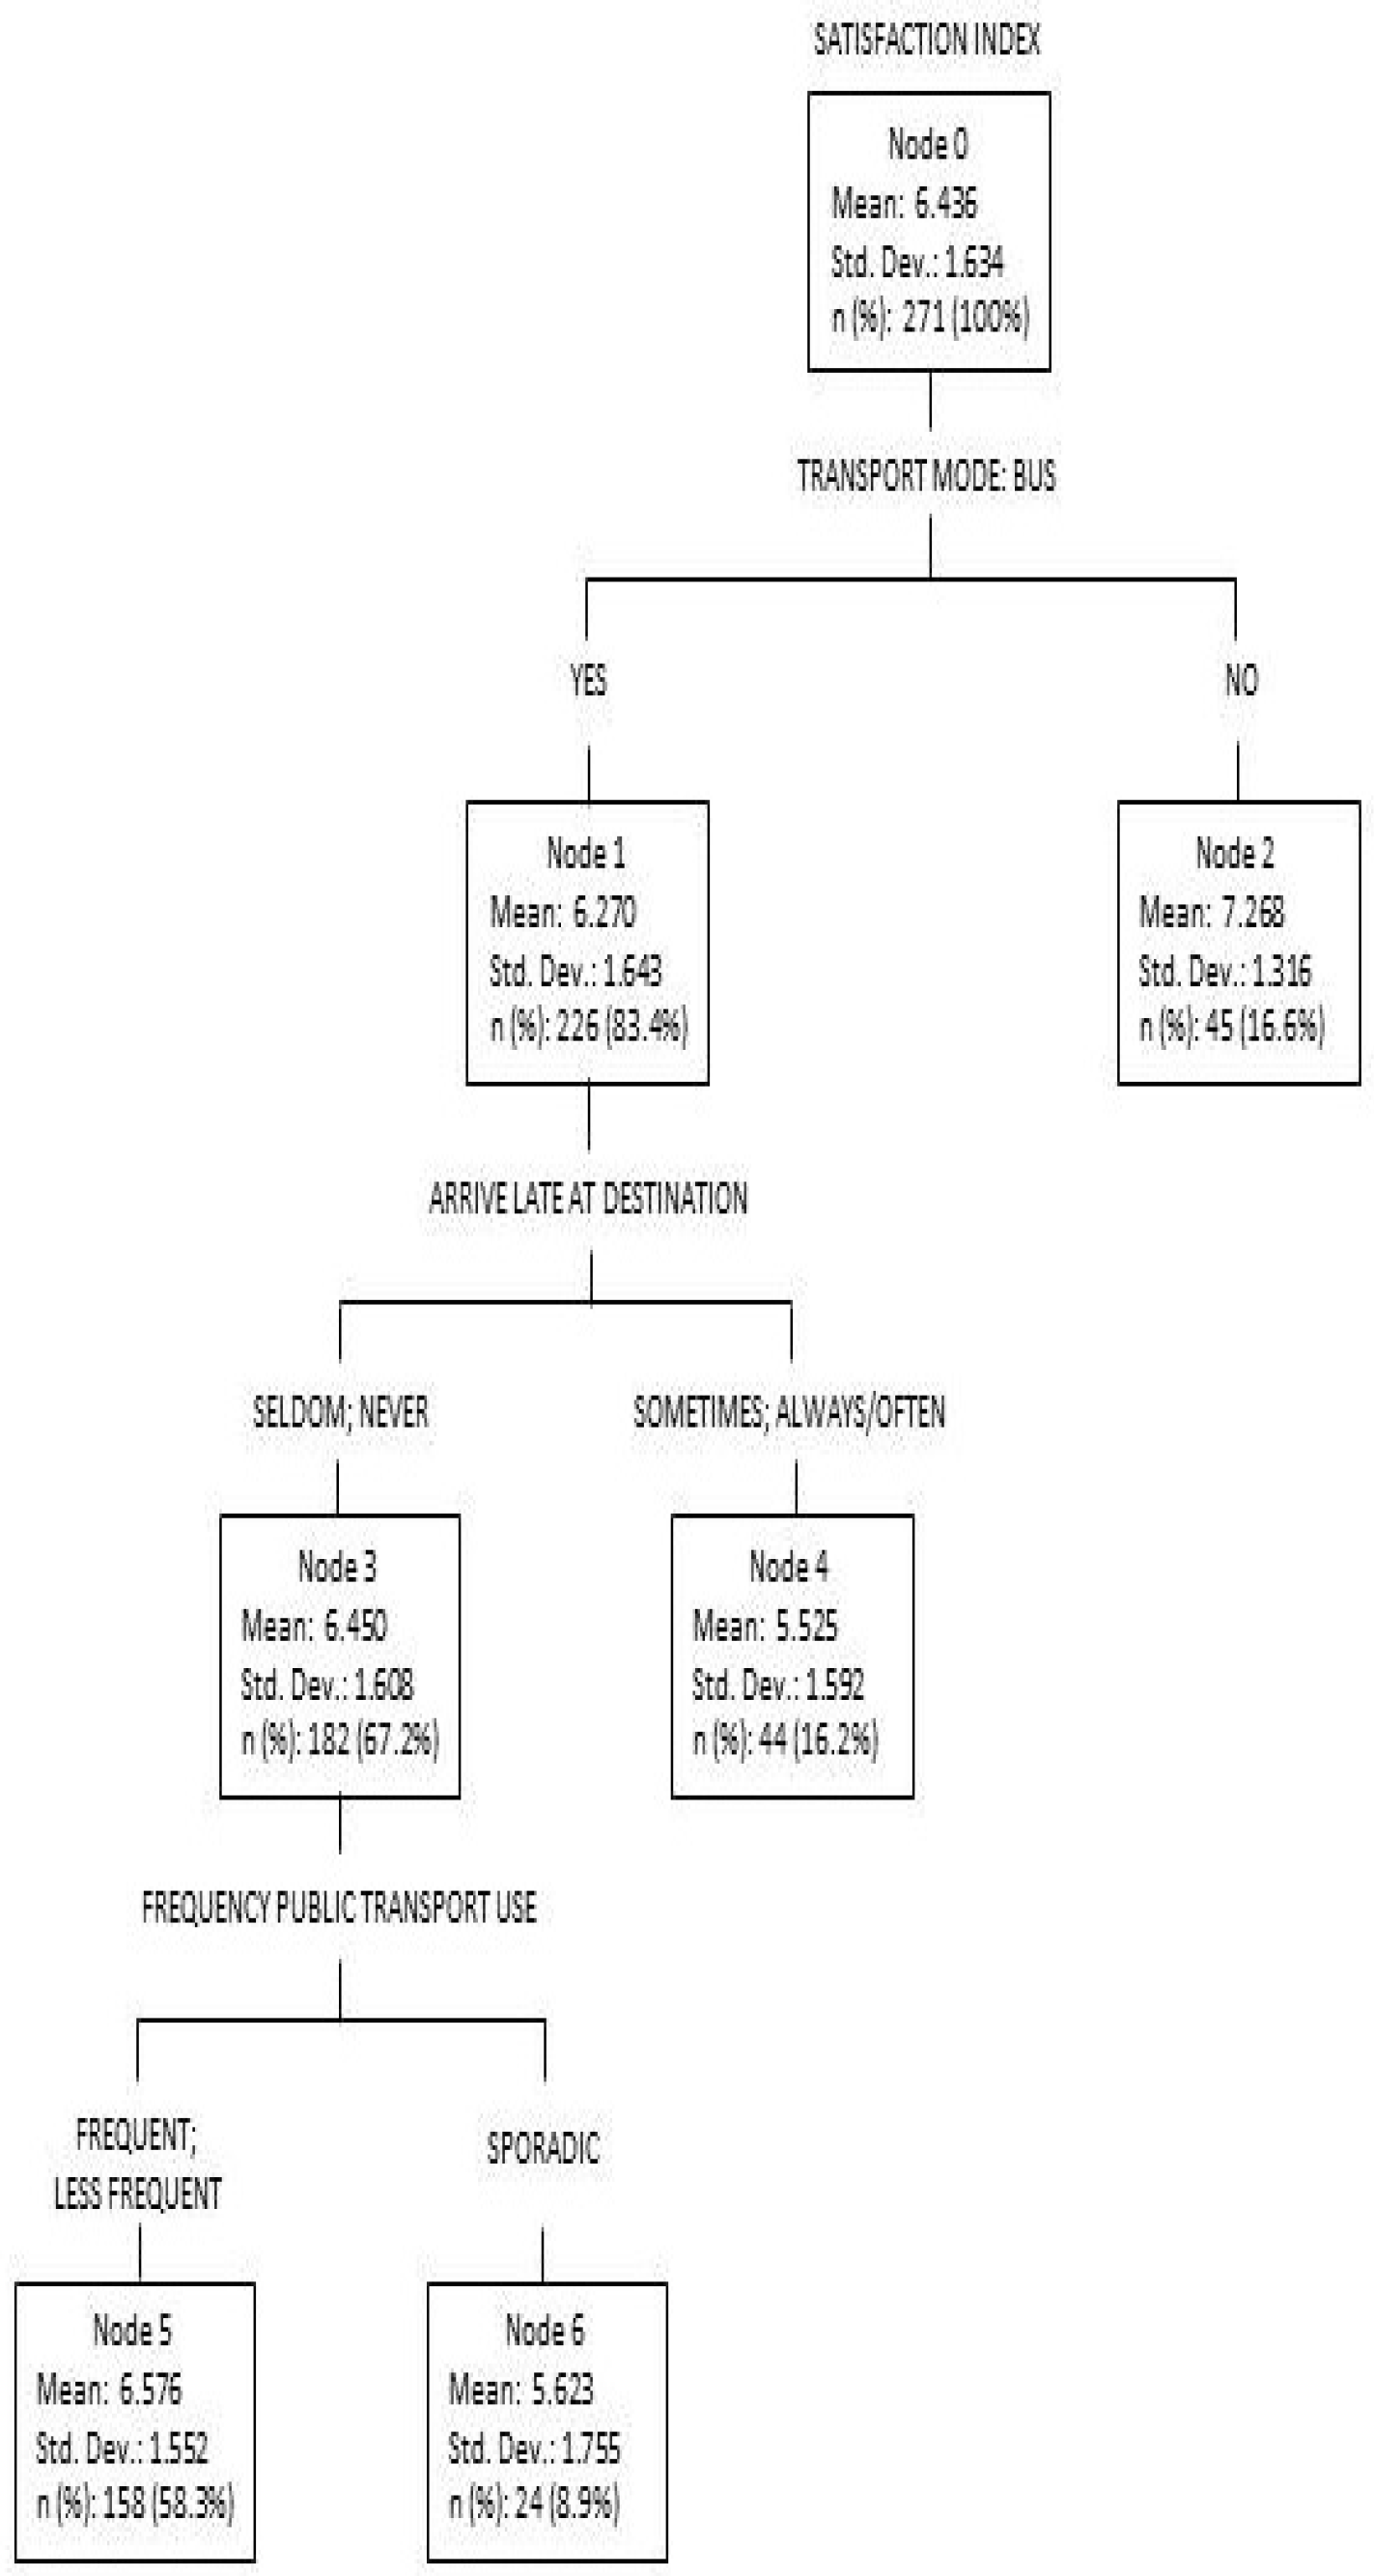
For the MAL-south, the model produced six nodes, four of which were terminal (Figure 3). The predictors of this regression tree were the variables mode of transport: bus, how frequently it arrives late at destination, and frequency of public transport use. Demographic variables were not relevant to explain overall satisfaction with public transport in this region. The risk estimate of the model in this sample was (standard error ).
The variable mode of public transport used: bus makes the primary split. Keeping towards the right, we find the most satisfied people in the MAL-south—those who do not use the bus (satisfaction index mean ). This node comprises of the sample of this tree. The perception of overall satisfaction decreases significantly from the root node to node 1, i.e., for those who use the bus in their trips. This node comprises of the sample of this tree. Additionally, the overall satisfaction with public transport decreases significantly from node 1 to node 4, which comprises those who report arriving late at their destination sometimes or often/always. This node comprises of the sample of this tree and corresponds to the least satisfied public transport users (satisfaction index mean ).
Following the paths created between the root node and terminal nodes in the model built, other associations can be highlighted, namely, node 5: when passengers do use the bus, and when they report never/seldom arriving late at their destinations, and when the frequency of public transport use is frequent/less frequent the satisfaction index mean equals .
These differences between MAL-north and MAL-south support the decision to stratify the sample of public transport users in order to explore passengers’ satisfaction with the service. These differences make it clear that specific problems exist in MAL-north and MAL-south, and thus a personalized rather than flat intervention is required from transport planners and providers.
7. Conclusions and Future Work
The role of transport in sustainable development was first recognized at the 1992 United Nation’s Earth Summit and strengthened in its outcome document—Agenda 21 [52]. Since then, government authorities and transport operators of several countries have been working together to encourage more people to use public transport as an alternative to driving. However, as such a program can only be successful with the active involvement of the population, knowing what people think, feel, and desire about public transport systems is essential. This research proposed an overall scalar measure or index for the satisfaction with public transport in the Metropolitan Area of Lisbon (MAL) based on users’ opinions about 26 service attributes. It was accomplished using the data from a survey purposefully designed to evaluate the satisfaction with the public transport system in this area. The survey used a stratified sampling scheme to select public transport users in the north and south regions of MAL and comprised 1166 valid responses. A fuzzy cluster analysis of the sampled data unveiled a hierarchical fuzzy partition which, combined with the concept of partial membership or degree of belongingness, allowed us to assign a single value to each individual representing his/her level of satisfaction. The measurement scale for satisfaction ranged from 1 (totally dissatisfied) to 10 (totally satisfied), and the average satisfaction was found to be (). The multidimensional nature of service quality that was acknowledged by previous studies (e.g., [9,28]) was validated by the fuzzy methodology adopted, as the 5-cluster partition attests. The main advantage of this methodology is the extreme usefulness of its results for transport practitioners: the index of satisfaction captures the heterogeneity of service quality while returning outcomes that are simpler and more easily understandable than the outcomes provided by other techniques widely applied for analyzing service quality in public transportation. For these reasons, we used the index in a post hoc analysis to find out the factors that might be influencing the satisfaction with public transport in the north and south regions of MAL, separately. Using regression tree models and taking the satisfaction index as the dependent variable, we were able to identify the variables that most influenced overall satisfaction. The variable that split the root node in MAL-north sample was the frequency of delay in arriving at the destination—never or seldom arriving late at the destination accounts positively for overall satisfaction with the transit system (predicted satisfaction ). The transport mode also influences transit users’ satisfaction; specifically, using the subway (even sometimes arriving with a delay) and not using the train (despite always arriving on time at the destination) account for higher satisfaction. This reflects the perception of users that the subway is quite a reliable mode, while the train is negatively perceived. The improvement in the subway network, namely, its expansion to a wider geographical area, made the subway a very convenient transport mode for many people living in the suburban areas of Lisbon. In contrast, there has been little investment in the train network and the quality of the service has deteriorated. Aware of the positive impact train transport has on both the environment and urban mobility, the Portuguese Government foresees a significant investment in the recently announced “National Program of Investment 2030” to improve the railway’s capacity in the metropolitan areas, namely, by increasing the number of circulating vehicles [53]. In MAL-south, the predictors that most affect the satisfaction with public transport are related to service conditions and frequency of use. Being a user of the bus or not is the strongest predictor of satisfaction. Those who use the bus and report they frequently arrive late at their destination are the least satisfied. Punctuality is an attribute of the service that is considered important by users when evaluating bus transport service [27]. However, the capacity to ensure passengers reach their destinations on time does not depend solely on the transit operators. Sometimes the surrounding traffic conditions are so complicated that the performance of the public transport service is irreparably affected. MAL is one such case where factors external to the service affect punctuality and the ability to reach the destination on time. As stated previously, MAL-south residents mostly travel to MAL-north, and when they do so by public transport using the bus, it entails crossing the River Tagus by the 25 April bridge. During weekdays, especially in peak hours, the bridge is a point of strong traffic congestion, which causes longer traveling times, and consequently, delays in arriving at one’s destination. Crossing the bridge in the south–north direction is more problematic due to tolls. Although there are access corridors to the bridge and exclusive tolls for buses, traveling by bus is not smooth because the daily road traffic over the bridge is enormous—about 130,000 vehicles cross the bridge daily [54]. Crossing the bridge by train is an alternative to the bus; however, despite being regarded as reliable, transit users also consider the train expensive [39], and therefore, it is not their first choice. The train is faster and less pollutant than the bus and could help reduce road traffic on the bridge if a more friendly price strategy could be implemented. The fare/price is regarded as a very important attribute for overall satisfaction with train transport [12] so this issue should receive more attention from planners and decision makers in MAL. Moreover, increasing the capacity of parking lots near the train stations would motivate users to combine the car with train when traveling to MAL-north, thereby alleviating the road traffic. In both areas, the variables regarding transport mode use, namely, bus, train, and subway, were relevant to explaining overall satisfaction. Specifically, we could identify the modes which are best and worst perceived by transport users. This is something that could be spotted because our study had the advantage of investigating the whole public transit system of MAL instead of focusing on one specific mode. Most studies on public transport satisfaction are focused on a specific mode of transport—bus (e.g., [51]), train (e.g., [12]), or boat (e.g., [55])—which permits only a partial view of the complexity of a public transport system. By considering the whole public transport system, we could detect the extent to which using (or not) a specific transport mode affected overall satisfaction, which is valuable information for transit operators and transit planners. Additionally, a set of variables (gender, reasons for using public transport, car ownership) was automatically excluded by the regression tree algorithm, thereby revealing that these variables can be considered to have little influence from the users’ perspective. The research provided methodological guidance for quantitative public transport evaluation. Firstly, the index summarized by a single indicator of the multidimensionality of service quality made the evaluation of the service easier and more objective. Secondly, the research presents a new approach to the assessment of satisfaction with public transport service. The main advantage of using a single index of satisfaction obtained from fuzzy clustering is that it reflects not only the diversity of perceptions about satisfaction, as the 5 fuzzy clusters attest; in addition, it also allows satisfaction to be explored as a single dependent variable in posterior analysis involving dependence models, as referred to above. Thirdly, the north/south stratification of the sampling design proved to be efficient. Similarly to other studies that segmented the market of public transport users to better assess heterogeneity in users’ perception of service quality [12,21], the satisfaction model in our study is distinct for each of the two regions, suggesting the users have different demands/preferences. Therefore, the combination of both prior and post hoc segmentation approaches is important for a better understanding of the market structure of transit users, thereby helping to design different policies that can accommodate different needs. The outcomes suggest that, in both areas, being able to rely on public transport to get to one’s destination on time is crucial to a positive perception of the service. Thus, transit planners and operators must find the best way to ensure service reliability. The difference between the two areas lies mainly in the modes of transport that warrant the attention of the authorities: in MAL-north it is the train service that needs to be improved, whereas the users in MAL-south are more affected by the bus service. Future research can extend the index of satisfaction with public transport to more cities or regions; this can be used to study satisfaction with each single mode of public transport and can be used to explore differences between relevant groups of analysis (e.g., countries, public vs private transit operators). Our study exemplifies how fuzzy clustering can be a useful tool to address public transport satisfaction, but the method can also be extended to other industries.
Supplementary Materials
The following are available online at https://0-www-mdpi-com.brum.beds.ac.uk/2071-1050/12/22/9759/s1.
Author Contributions
Conceptualization, Paula Vicente; Methodology, Abdul Suleman; Formal analysis, Abdul Suleman and Paula Vicente; Writing: Original Draft Preparation, Abdul Suleman and Paula Vicente; Writing: Review and Editing, Elizabeth Reis and Paula Vicente; Supervision, Elizabeth Reis. All authors have read and agreed to the published version of the manuscript.
Funding
This work was supported by Fundação para a Ciência e Tecnologia, grant UIDB/00315/2020.
Acknowledgments
The authors would like to thank two anonymous reviewers for their comments, suggestions, and careful reading of the earlier versions of this manuscript. They also extend a word of thanks to Sheryl Guo for her support during the submission process. This article is part of the project entitled Estudo de Satisfação dos Utilizadores dos Transportes Públicos da Área Metropolitana de Lisboa 2013, a joint project of the Metropolitan Transport Authority of Lisbon and Instituto Universitário de Lisboa (ISCTE-IUL).
Conflicts of Interest
The authors declare no conflict of interest.
References
- Cervero, R. Transport Infrastructure and the Environment: Sustainable Mobility and Urbanism; Working Paper 2013-03; University of California: Berkeley, CA, USA, 2013. [Google Scholar]
- UITP—International Association of Public Transportation. Climate Action and Public Transport: Analysis of Planned Actions; International Association of Public Transport: Brussels, Belgium, 2014. [Google Scholar]
- Moreno, T.; Reche, C.; Rivas, I.; Minguillón, M.; Martins, V.; Vargas, C.; Buonanno, G.; Parga, J.P.; olfi, M.; Brines, M.; et al. Urban air quality comparison for bus, tram, subway and pedestrian commutes in Barcelona. Environ. Res. 2015, 142, 495–510. [Google Scholar] [PubMed]
- ITF (International Transport Forum). Integrating Urban Public Transport Systems and Cycling. 2018. Available online: https://www.itf-oecd.org/sites/default/files/docs/integrating-urban-public-transport-systems-cycling-roundtable-summary_0.pdf (accessed on 26 October 2020).
- Quarles, N.; Kockelman, K.; Mohamed, M. Costs and Benefits of Electrifying and Automating Bus Transit Fleets. Sustainability 2020, 12, 3977. [Google Scholar] [CrossRef]
- CIVITAS. Mobility Measure. 2020. Available online: https://civitas.eu/measure/better-infrastructure-public-transport (accessed on 21 October 2020).
- European Commission. Flash Eurobarometer 382b “Europeans’ Satisfaction with Urban Transport”. 2014. Available online: https://ec.europa.eu/commfrontoffice/publicopinion/flash/fl_382b_en.pdf (accessed on 13 July 2020).
- European Commission. Special Eurobarometer 422a: “Quality of Transport”. 2014. Available online: https://ec.europa.eu/commfrontoffice/publicopinion/archives/ebs/ebs_422a_en.pdf (accessed on 13 July 2020).
- Eboli, L.; Mazzula, G. Service quality attributes affecting customer satisfaction for bus transit. J. Public Transp. 2007, 10, 21–34. [Google Scholar]
- van Lierop, D.; El-Geneidy, A. Enjoying loyalty: The relationship between service quality, customer satisfaction, and behavioral intentions in public transit. Res. Transp. Econ. 2016, 59, 50–59. [Google Scholar]
- Wen, C.; Lan, L.; Chang, H. Structural equation modeling to determine passenger loyalty toward intercity bus services. Transp. Res. Rec. J. Transp. Res. Board 2005, 1927, 249–255. [Google Scholar]
- De Oña, J.; de Oxnxa, R.; Eboli, L.; Mazzulla, G. Heterogeneity in perceptions of service quality among groups of railway passengers. Int. J. Sustain. Transp. 2015, 9, 612–626. [Google Scholar]
- Prasad, D.; Shekhar, R. Impact of Service Quality Management (SQM) Practices on Indian Railways—A Study of South Central Railways. Int. J. Bus. Manag. 2010, 5, 39–146. [Google Scholar]
- Lai, W.; Chen, C. Behavioral intentions of public transit passengers—The role of service quality, perceived value, satisfaction and involvement. Transp. Policy 2011, 18, 318–325. [Google Scholar]
- Woodbury, M.A.; Clive, J. Clinical pure types as a fuzzy partition. J. Cybern. 1974, 4, 111–121. [Google Scholar]
- Buntine, W.; Jakulin, A. Applying discrete PCA in data analysis. In Proceedings of the 20th Conference on Uncertainty in Artificial Intelligence, UAI ’04, Banff, AB, Canada, 7–11 July 2004; pp. 59–66. Available online: http://0-portal-acm-org.brum.beds.ac.uk/citation.cfm?id=1036851 (accessed on 20 November 2020).
- Sathler, D.; Monte-Mór, R.; Carvalho, J.A.M.; Machado, C.J.; Costa, A. Application of the grade of membership model (GoM) to delineate an urban hierarchy in Brazilian Amazonia. In Proceedings of the XXVI IUSSP International Population Conference, Marrakech, Morocco, 27 September–2 October 2009. [Google Scholar]
- Zhou, Y.; Wu, J.; Jia, Y. Research on Index System and Fuzzy Comprehensive Evaluation Method for Passenger Satisfaction. In Fuzzy Systems and Knowledge Discovery, Proceedings of the Second International Conference, FSKD 2005, Changsha, China, 27–29 August 2005, Part I; Wang, L., Jin, Y., Eds.; Springer: Berlin/Heidelberg, Germany, 2005; pp. 118–121. [Google Scholar]
- Yuvaraj, D.; Sivaram, M.; Karthikeyan, B.; Abdulazeez, J. Shape, Color and Texture Based CBIR System Using Fuzzy Logic Classifier. Comput. Mater. Contin. 2019, 59, 729–739. [Google Scholar]
- Ning, M.; Guan, J.; Liu, P.; Zhang, Z.; O’Hare, G.M.P. GA-BP Air Quality Evaluation Method Based on Fuzzy Theory. Comput. Contin. 2019, 58, 215–227. [Google Scholar]
- Tyrinopoulos, Y.; Antoniou, C. Public transit user satisfaction: Variability and policy implications. Transp. Policy 2008, 15, 260–272. [Google Scholar]
- Kotler, P. Marketing Management, 11th ed.; Upper Sadle River: Prentice Hall, NJ, USA, 2003. [Google Scholar]
- CEN. EN 13816—Transportation—Logistics and Services—Public Passenger Transport—Service Quality Definition, Targeting and Measurement; European Committee for Standardization (CEN): Brussels, Belgium, 2002. [Google Scholar]
- Perez, M.; Abad, J.; Carrillo, G.; Fernández, R. Effects of service quality dimensions on behavioural purchase intentions: A study in public-sector transport. Manag. Serv. Qual. Int. 2007, 17, 134–151. [Google Scholar]
- Cronin, J.; Taylor, S. Measuring service quality: A reexamination and extension. J. Mark. 1992, 56, 55–68. [Google Scholar]
- Parasuraman, A.; Zeithaml, V.; Berry, L. SERVQUAL: A multiple-item scale for measuring consumer perceptions of service quality. J. Retail. 1988, 64, 12–40. [Google Scholar]
- Del Castillo, J.; Benitez, F. A methodology for modelling and identifying users satisfaction issues in public transport systems based on users surveys. Procedia Soc. Behav. Sci. 2012, 54, 1104–1114. [Google Scholar] [CrossRef] [Green Version]
- D’Ovidio, F.; Leogr, D.; Mancarella, R.; Viola, D. The quality of public transport services: A statistical analysis. Interdisplinary J. Res. Dev. 2014, 1, 96–104. [Google Scholar]
- Manton, K.G.; Woodbury, M.A.; Tolley, H.D. Statistical Applications Using Fuzzy Sets; John Wiley & Sons, Inc.: Hoboken, NJ, USA, 1994. [Google Scholar]
- Decision System, Inc. User Documentation for DSIGoM. Version 1.0. 1999. Available online: https://www.oit.va.gov/Services/TRM/ToolPage.aspx?tid=6756 (accessed on 20 November 2020).
- Woodbury, M.A.; Clive, J.; Garson, A., Jr. Mathematical typology: A grade of membership technique for obtaining disease definition. Comput. Biomed. Res. 1978, 11, 277–298. [Google Scholar]
- Berkman, L.; Singer, B.; Manton, K.G. Black/White Differences in Health Status and Mortality among the Eldery. Demography 1998, 26, 661–678. [Google Scholar]
- Suleman, A. A fuzzy clustering approach to evaluate individual competencies from REFLEX data. J. Appl. Stat. 2017, 44, 2513–2533. [Google Scholar]
- De Oña, J.; de Oxnxa, R.; Calvo, F.J. A classification tree approach to identify key factors of transit service quality. Expert Syst. Appl. 2012, 39, 11164–11171. [Google Scholar]
- Statistics Portugal. Inquérito à Mobilidade nas Áreas Metropolitanas do Porto e de Lisboa; INE: Lisboa, Portugal, 2017. [Google Scholar]
- ECO. Carris Testa Autocarro Totalmente Elétrico e Silencioso em Duas Carreiras. ECO 2016 Swipe News SA. 2016. Available online: https://eco.pt/2016/09/22/carris-testa-autocarro-totalmente-eletrico-e-silencioso-em-duas-carreiras/ (accessed on 5 June 2020).
- Statistics Portugal. Projeções de População Residente em Portugal 2018–2080. 2020. Available online: https://www.ine.pt/xportal/xmain?xpid=INE&xpgid=ine_destaques&DESTAQUESdest_boui=406534255&DESTAQUESmodo=2 (accessed on 26 October 2020).
- Statistics Portugal. Population Aged 15 or Older by Place of Residence I; Census Population Report; INE: Lisboa, Portugal, 2011. [Google Scholar]
- Ramos, S.; Vicente, P.; Passos, A.; Costa, P.; Reis, E. Perceptions of the Public Transport Service as a Barrier to the Adoption of Public Transport: A Qualitative Study. Soc. Sci. 2019, 8, 150. [Google Scholar]
- ECSI Technical Committee. European Customer Satisfaction Index Foundation and Structure for Harmonized National Pilot Projects; ECSI: Brussels, Belgium, 1998. [Google Scholar]
- Fellesson, M.; Friman, M. Perceived satisfaction with public transport service in nine European cities. J. Transp. Forum 2008, 47, 93–103. [Google Scholar]
- Friman, M.; Gärling, T. Frequency of negative critical incidents and satisfaction with public transport services. II. J. Retail. Consum. Serv. 2001, 8, 105–114. [Google Scholar]
- Hensher, D.; Stopher, P.; Bullock, P. Service quality—Developing a service quality index in the provision of commercial bus contracts. Transp. Res. Part A 2003, 37, 499–517. [Google Scholar]
- Iman, R. Measuring Public Transport Satisfaction from User Surveys. Int. J. Bus. Manag. 2014, 9, 106–114. [Google Scholar]
- Mokonyama, M.; Venter, C. Incorporation of customer satisfaction in public transport contracts—A preliminary analysis. Res. Transp. Econ. 2013, 39, 58–65. [Google Scholar] [CrossRef]
- Vilares, M.; Coelho, P.; Cadilhe, M. Satisfação e Lealdade do Cliente: Metodologias de Avaliação, Gestão e Análise; Escolar Editora: Lisboa, Portugal, 2005. [Google Scholar]
- PORDATA. Ganho Médio Mensal dos Trabalhadores por Conta de Outrem. 2020. Available online: https://www.pordata.pt/Municipios/Ganho+m%C3%-A9dio+mensal+dos+trabalhadores+por+conta+de+outrem+total+e+por+sexo-282 (accessed on 20 November 2020).
- Costa, N. Atlas digital da Área Metropolitana de Lisboa: Acessibilidade e Transportes. 2016. Available online: https://www.aml.pt/susProjects/susWebBackOffice/uploadFiles/wt1wwpgf_aml_sus_pt_site/componentText/SUS57FCBBEE58CA4/EATLAS_AML_ACESSIBILIDADES_FORMATADO.PDF (accessed on 4 June 2020).
- De Oña, J.; de Oxnxa, R.; López, G. Transit service quality analysis using cluster analysis and decision trees: A step forward to personalized marketing in public transportation. Transportation 2016, 5, 725–747. [Google Scholar]
- Dell’Olio, L.; Ibeas, A.; Cecín, P. Modelling user perception of bus transit quality. Transp. Policy 2010, 17, 388–397. [Google Scholar]
- Weng, J.; Di, X.; Wang, C.; Wang, J.; Mao, L. A Bus Service Evaluation Method from Passenger’s Perspective Based on Satisfaction Surveys: A Case Study of Beijing, China. Sustainability 2018, 10, 2723. [Google Scholar]
- United Nations. Sustainable Transport. 2020. Available online: https://sustainable-development.un.org/topics/sustainabletransport (accessed on 23 October 2020).
- PNI. Programa Nacional de Investimentos 2030. 2020. Available online: https://www.portugal.gov.pt/pt/gc22/comunicacao/documento?i=apresentacao-do-programa-nacional-de-investimentos-para-2030 (accessed on 26 October 2020).
- IMT-Instituto da Mobilidade e dos Transportes. Dados do Relatório de Tráfego—2° Trimestre de 2020. 2020. Available online: http://www.imt-ip.pt/sites/IMTT/Portugues/InfraestruturasRodoviarias/Paginas/InfraestruturasRodoviarias.aspx (accessed on 25 September 2020).
- Mathisen, T.; Solvoll, G. Service Quality Aspects in Ferry Passenger Transport—Examples from Norway. Eur. J. Transp. Infrastruct. Res. 2010, 10, 142–157. [Google Scholar]
Figure 1.
Distribution of satisfaction index based on functional .

Figure 2.
Regression tree for MAL-north public transport users.

Figure 3.
Regression tree for MAL-south public transport users.


Table 1.
Respondents’ socio-demographic profile and public transport use.
| Characteristic | Percentage |
|---|---|
| Gender: male | |
| Age Group | |
| 15–24 | |
| 25–34 | |
| 35–44 | |
| 45–64 | |
| >64 | |
| Household income/month | |
| ≤€800 | |
| €801–€1600 | |
| €1601–€2400 | |
| >€2400 | |
| Has car | |
| Frequency of public transport use | |
| Everyday | |
| 5 days/week | |
| 3 to 4 days/week | |
| 1 to 2 days/week | |
| 1 to 3 days/month | |
| Less than 1 day/month | |
| How often arrives late at destination | |
| Always | |
| Often | |
| Sometimes | |
| Seldom | |
| Never | |
| Reason(s) for public transport use | |
| Travel home-work-home | |
| Personal affairs | |
| Work affairs | |
| School/study | |
| Shopping | |
| Entertainment | |
| Mode(s) of public transport used | |
| Bus | |
| Train | |
| Subway | |
| Boat |
a More than one answer was allowed.
Table 2.
Estimated expected rate in each item for the fuzzy clusters , , , , and .
| Variable | |||||
|---|---|---|---|---|---|
| 1 | |||||
| 2 | |||||
| 3 | |||||
| 4 | |||||
| 5 | |||||
| 6 | |||||
| 7 | |||||
| 8 | |||||
| 9 | |||||
| 10 | |||||
| 11 | |||||
| 12 | |||||
| 13 | |||||
| 14 | |||||
| 15 | |||||
| 16 | |||||
| 17 | |||||
| 18 | |||||
| 19 | |||||
| 20 | |||||
| 21 | |||||
| 22 | |||||
| 23 | |||||
| 24 | |||||
| 25 | |||||
| 26 | |||||
Table 3.
Descriptive statistics of the passenger satisfaction index.
| Mean | Std. Deviation | # | |
|---|---|---|---|
| MAL-north | 895 | ||
| MAL-south | 271 | ||
| MAL (overall) | 1166 |
Publisher’s Note: MDPI stays neutral with regard to jurisdictional claims in published maps and institutional affiliations. |
© 2020 by the authors. Licensee MDPI, Basel, Switzerland. This article is an open access article distributed under the terms and conditions of the Creative Commons Attribution (CC BY) license (http://creativecommons.org/licenses/by/4.0/).
Share and Cite
MDPI and ACS Style
Vicente, P.; Suleman, A.; Reis, E. Index of Satisfaction with Public Transport: A Fuzzy Clustering Approach. Sustainability 2020, 12, 9759. https://0-doi-org.brum.beds.ac.uk/10.3390/su12229759
AMA Style
Vicente P, Suleman A, Reis E. Index of Satisfaction with Public Transport: A Fuzzy Clustering Approach. Sustainability. 2020; 12(22):9759. https://0-doi-org.brum.beds.ac.uk/10.3390/su12229759
Chicago/Turabian StyleVicente, Paula, Abdul Suleman, and Elizabeth Reis. 2020. "Index of Satisfaction with Public Transport: A Fuzzy Clustering Approach" Sustainability 12, no. 22: 9759. https://0-doi-org.brum.beds.ac.uk/10.3390/su12229759
Note that from the first issue of 2016, this journal uses article numbers instead of page numbers. See further details here.