Article

Modeling Cross-National Differences in Automated Vehicle Acceptance

by
Shelly Etzioni
1,*,
Jamil Hamadneh
2,
Arnór B. Elvarsson
3,
Domokos Esztergár-Kiss
2,
Milena Djukanovic
4,
Stelios N. Neophytou
5,
Jaka Sodnik
6,
Amalia Polydoropoulou
7,
Ioannis Tsouros
7,
Cristina Pronello
8,9,
Nikolas Thomopoulos
10 and
Yoram Shiftan
1
1
Faculty of Civil and Environmental Engineering, Technion, Israel Institute of Technology, Haifa 3200003, Israel
2
Department of Transport Technology and Economics, Faculty of Transportation Engineering and Vehicle Engineering, Budapest University of Technology and Economics (BME), 1111 Budapest, Hungary
3
Infrastructure Management Consultants, 8008 Zürich, Switzerland
4
Faculty of Electrical Engineering, University of Montenegro, 81000 Podgorica, Montenegro
5
Department of Engineering, School of Sciences and Engineering, University of Nicosia (UNIC), Nicosia 1700, Cyprus
6
ICT Department, Faculty of Electrical Engineering, University of Ljubljana, 1000 Ljubljana, Slovenia
7
Department of Shipping, Trade and Transport, Business School, University of the Aegean, 82 100 Chios, Greece
8
Interuniversity Department of Regional and Urban Studies and Planning, Politecnico di Torino, 10125 Torino, Italy
9
Sorbonne Universités-Université de Technologie de Compiègne, 60200 Compiègne, France
10
WISE-ACT Chair and Department of Tourism and Transport, School of Hospitality and Tourism Management, University of Surrey, Guildford GU2 7XH, UK
*
Author to whom correspondence should be addressed.
Sustainability 2020, 12(22), 9765; https://0-doi-org.brum.beds.ac.uk/10.3390/su12229765
Submission received: 31 August 2020 / Revised: 15 November 2020 / Accepted: 17 November 2020 / Published: 23 November 2020

Abstract

:
The technology that allows fully automated driving already exists and it may gradually enter the market over the forthcoming decades. Technology assimilation and automated vehicle acceptance in different countries is of high interest to many scholars, manufacturers, and policymakers worldwide. We model the mode choice between automated vehicles and conventional cars using a mixed multinomial logit heteroskedastic error component type model. Specifically, we capture preference heterogeneity assuming a continuous distribution across individuals. Different choice scenarios, based on respondents’ reported trip, were presented to respondents from six European countries: Cyprus, Hungary, Iceland, Montenegro, Slovenia, and the UK. We found that large reservations towards automated vehicles exist in all countries with 70% conventional private car choices, and 30% automated vehicles choices. We found that men, under the age of 60, with a high income who currently use private car, are more likely to be early adopters of automated vehicles. We found significant differences in automated vehicles acceptance in different countries. Individuals from Slovenia and Cyprus show higher automated vehicles acceptance while individuals from wealthier countries, UK, and Iceland, show more reservations towards them. Nontrading mode choice behaviors, value of travel time, and differences in model parameters among the different countries are discussed.

1. Introduction

The automotive industry is witnessing major shifts with the advent of automated vehicles (AVs). Since the pioneer project European Eureka Prometheus in the late 1980s, many automated prototypes have been tested in different countries and self-driven at different automation levels, different road types, and different congestion levels [1]. The SAE defines six different levels of vehicular automation differing in their technological capabilities and human involvement in the driving tasks, from complete driver control over the vehicle (level 0) to fully automated vehicle, where no manual interaction is needed regardless of the driving conditions (level 5) [2]. Already, some fully automated modes have been deployed for public use through pilot projects and trials, like automated buses [3].
However, the impact of future automated mobility remains uncertain and the research community is divided: While some scholars present optimistic scenarios regarding their contribution to safety and mobility, others stress great challenges in regard to increasing total vehicle miles traveled (VMT) and congestion, sustainability, carbon emissions, sharing security, equity, accessibility, environmental issues, safety, land use and acceptability issues [4,5,6,7,8]. Therefore, policymakers, automakers, and other stakeholders have to carefully consider their plans, policies, and investments to prepare for the possibility of future technology assimilation considering different demographics and geography [9]. Gauging the propensity of certain cultures or countries to adopt or reject AVs is important for the decision of if, when, how, and where to assimilate them. Many manufacturers and scholars are interested in the question of who will be willing to use AVs and who will be the first to adopt them. Although cultural differences are often cited by scholars as influential factors of technology and automation acceptance [10,11], only one study used comparative data from more than one country to apply discrete choice models (DCMs) on AV acceptance [12]. The authors found no study using data from more than two countries. This paper aims to fill this gap by modeling user acceptance in six different countries and discussing possible implications of AVs acceptance, along with the possibility of technology assimilation, versus technology rejection, in different countries. The uncertainty related to AV deployment has led to the development of a wide range of modeling frameworks on their impacts, with different conclusions based on the assumptions of the modeling frameworks. Within the Action CA16222 of the European Cooperation in Science and Technology (COST) entitled “Wider Impacts and Scenario Evaluation of Autonomous and Connected Transport” (WISE-ACT) authors of this paper model the mode choice between conventional regular car and private AV among six participating countries, Cyprus, Hungary, Iceland, Montenegro, Slovenia, and the UK, using a stated preferences (SP) survey. These countries were selected to ensure diversity in size, car ownership rates, transport infrastructure, GDP per capita, and are located both within and outside the EU, thus reflecting diverse views of current travelers across Europe.
An SP survey was designed to capture users’ preferences among three modes: (1) A conventional private vehicle i.e., regular private car used nowadays (CAR); (2) a private automated vehicle (AV); (3) A shared automated vehicle (SAV). In this paper, which is part of a wider international study, we focus on automation acceptance among six European countries to ensure sufficient similarity and diversity between key features. We specifically focus on the acceptance of AV compared to regular car for day-to-day use, studying the choice behaviors of solo travelers. A joint DCM as well as six country-segmented models are estimated. The models include parameters that influence mode choice such as age, gender, income, current travel mode used, travel time, and travel cost and their different impacts as captured by the parameters of the country-segmented models.

2. Literature Review

There is an ever-growing volume of literature aiming to study AV acceptance of travelers, both using their own private AVs as well as using mobility-on-demand services, such as ride-hailing platforms [13]. There are multiple facets to the introduction of AVs and multiple barriers to a successful technology assimilation as discussed below. The possible benefits and disadvantages of the deployment of AVs, based on the technology’s risks and opportunities, are important to the evaluation of users’ acceptance of these novel modes.
In this section, we review numerous studies regarding the possible impacts of AV and user acceptance in different countries. By exploring studies that utilized different methodologies, we found a gap in the literature: only one study used comparative data from more than one country to apply DCM on AV acceptance [12], and none used data from more than two countries. Furthermore, of the six countries studied, we found that AV acceptance has not been studied in three of them, and studies in the other three countries are very limited, highlighting the need to focus more on this area, given the ongoing initiatives undertaken worldwide regarding AVs.

2.1. Possible Impacts of AV Assimilation

Researchers have discussed the potential AV implications, stressing both positive and negative impacts of AVs on highway capacity [14,15], driving behavior [16], public transport services [17,18,19] value of travel time [10], private parking infrastructure [20], accessibility and induced demand [21], and more. Some scholars claim that AVs may have some negative environmental, total VMT, and travel time consequences [22,23]. Kröger et al. [23], demonstrated that AVs could facilitate more travel time resulting in more congestion and emissions. According to some estimates, AVs may lead to 10% increase in total VMT because cars will probably have to relocate empty in order to serve other travelers and deadheading [5,7]. High vehicle utilization is required for high efficiency. However, it may cause AVs to wear out more, thus, the vehicles will have to be replaced more frequently [5]. Fagnant and Kockelman [24], showed that each SAV can replace up to 11 conventional cars. However, similarly to Milakis et al. [5], they also found that they may increase the total VMT by 10% compared to nonautomated modes. On the contrary, some scholars argue that AVs have the potential to reduce road accidents, have positive environmental impacts, reduce cost of travel, as well as land use benefits and the potential to increase comfort and mobility of immobile members of the society [13,24,25]. According to the OECD, the parking requirements of SAVs in Lisbon are expected to decrease by 84–94% compared to today’s land use composition [25]. Similar results were reported by Zhang et al. 2009 [26], that found that 90% of parking demand can be eliminated with SAVs use. All of these impacts studied are fundamentally based on the assumptions that some users will choose to use AVs when given the choice, i.e., that they will accept AVs.
To critically assess the possibility of AV introduction to various markets, transport choice modelers have used SP surveys to assess travel demand and mode choice. Using SP surveys is one of the most prevalent methods as it allows the exploration of potential of hypothetical modes or services [27]. To analyze travelers’ choice of new or hypothetical alternatives, it is common to design an SP survey, where a hypothetical traveler’s mode choice may be introduced alongside conventional modes. The respondent is asked to consider a trip she made or a hypothetical trip. Various alternative modes are presented with their important attributes such as travel time and cost, and the respondent has to state her preferred mode [12]. The traveler’s choice may also depend on trip purpose, trip distance and comfort among other attributes [28,29,30,31].
Table 1 provides an overview of recent SP surveys on AV acceptance and the attributes that were found important for such choices.
As shown in Table 1, travel time, wait time, travel cost, user attitudes, and socio-demographics are among the most cited attributes that effect AV acceptance.

2.2. Understanding Attitudes towards AVs

A number of cross-country qualitative opinion surveys regarding AVs were previously conducted. Schoettle and Sivak [10] distributed an extensive survey across China, India, Japan, USA, UK, and Australia, exploring the different attitudes towards AVs. Kyriakidis et al. [40], surveyed over 5000 consumers to study public opinions of AVs. More recently, Deloitte have published a study on AV acceptance based on surveys in Canada, USA, Mexico, Belgium, UK, Germany, Austria, Netherlands, France, Italy, South Africa, India, Malaysia, Thailand, Indonesia, Japan, Republic of Korea, China, and Australia [41]. World Economic Forum [42] also surveyed over 5500 consumers and modeled various scenarios to see the impact of technology on transport. Moreover, Anania et al. [43] showed the effect of positive and negative information on the willingness to use AVs. The results of AVs acceptance in the above-mentioned studies is summarized in Table 2. The survey questions were not standardized, so for each study we present the question posed, and shares of the specific responses in each case.
The surveys in Table 2 show positive attitudes towards AVs, but also some skepticism. They are qualitative and focused on understanding consumer opinions across a number of countries, but they do not use DCMs to quantify the influential factors and tradeoffs which influence mode choice and acceptance. Moreover, they do not provide any contextual element to respondents since they are not context or country specific. As reported in Table 1, various scholars have distributed SP surveys in a single country and estimated discrete choice models to predict travel behavior using a hypothetical choice set where AVs are already available to the public as an alternative to conventional cars. To the best of our knowledge, Haboucha et al. [12] are the only ones who performed a discrete choice model analysis based on an SP mode choice survey between private conventional cars and AVs across international borders—Israel and North America. It should be noted that Kröger et al. [23] used a technology diffusion model to estimate the changes in mode share for private vehicles, public transport, walking and cycling assuming AVs replace conventional cars. However, no reported study has evaluated mode choice using a discrete choice model based on a stated-choice survey with a choice set comparing AVs directly with conventional private cars in multiple countries other than Haboucha et al. [12], which may be due to the task complexity and resource requirements of such a task.
As shown in Table 1 and Table 2, AV acceptance and the characteristics of potential early adopters have already been widely explored internationally. Becker and Axhausen provided a review of the available literature, mainly based on SP surveys and explorative studies and later conducted an SP survey [28,38]. The factors attributing to mode choice may vary by country, but this has not been sufficiently explored. Table 3 addresses recent literature on AV acceptance in each country of the study presented in this paper: Cyprus, UK, Slovenia, Montenegro, Hungary, and Iceland.
As shown in Table 3, limited literature has been published on AV acceptance in these countries. No comparable SP survey has been used to estimate DCMs evaluating AV acceptance across these countries, to date.

3. Methodology

An SP experiment was designed to capture user preferences and AV acceptance. The results of this survey were used to estimate a mixed multinomial logit (MIXL) model. The following sections discuss the SP survey design as well as the MIXL model used to estimate the discrete mode choice while accounting for panel effects.

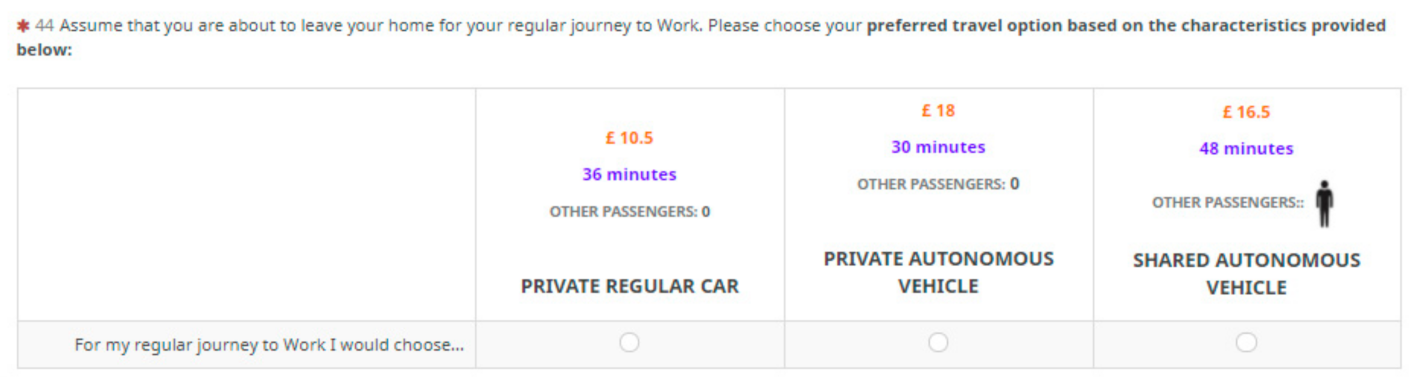
3.1. Survey Design and Administration

A state-of-the-art Bayesian D-efficient design was generated based on the experimental attributes using Ngene, a choice experiment design software. The purpose of efficient designs in stated choice experiments is to minimize the standard errors of the estimated parameters [48]. D-efficient designs are often used when sufficient parameter priors are available. Since we did not have much preliminary knowledge of our parameters other than the expected negative sign of cost and time parameters, Bayesian D-efficient design was chosen as it better accounts for incorrect priors [48]. The attribute level design included cost, door-to-door (D2D) travel time, the number of passengers ridesharing with each respondent in the SAV, as well as the gender of these passengers. A design with 24 scenarios was generated to allow sufficient variation. Each respondent was presented with 6 choice scenarios; therefore, the scenarios were divided into 4 blocks, and each respondent was randomly assigned to one of the blocks. The design levels used for the choice scenarios were partly customized around travel time and travel cost values which the respondents entered at the preceding survey part, when asked about a trip they make regularly departing from their home at least once a week. The respondents were asked to estimate D2D travel time of that regular trip, assuming they made it by conventionally available regular car, even if they did not use this mode for such a regular trip. An innovation of this approach, was to calculate a comparable country specific trip cost for each respondent at a national level, by multiplying their individually entered travel time value input (T) with a country-specific pre-set per km total travel cost (C). National average travel costs were derived based on the contemporary cost of a taxi journey from a large city (e.g., capital) to the main city airport or central rail station. The Bayesian D-efficient design values were then pivoted around the individually pre-entered travel time at the preceding survey part and national average total travel cost values, so that each individual was presented with a cost based on their travel time input for that particular trip customized for their country, using local currencies. As private AVs are likely to be more expensive than conventional cars due to the additional onboard technology and sensors, the cost of private AVs was designed to be mostly higher than of CAR’s as shown in Table 4. On some design conditions, the cost of AV was lower than that of CAR’s to fully capture the mode choice behavior of private regular car nontraders, or individuals who are very reluctant towards AVs. Design values used for the variation of the attribute levels are presented in Table 4:
Prior to the stated preference experiment, the respondents were given the following information regarding the different modes. The respondents were asked to choose their preferred mode for their regular trip which they specified earlier (see Figure 1) considering that AVs have already entered the market and are now an alternative to conventional cars:
  •  Using a Privately owned Regular Car similar to conventional private cars used today.
  •  Using a Privately owned Automated Vehicle. This option is similar to Privately owned Regular Cars, but it could be a different type and size vehicle. This vehicle will drive itself without a human driver and will leave you at your destination, to then park itself.
  •  Using a Shared Automated Vehicle which you do not own. You will be able to travel in it just by yourself (shared vehicle) or to travel with strangers (shared ride). If you choose to share it with others, you may save some money. However, on some occasions you will waste time picking up and dropping off other passengers. Occasionally, you will be able to travel faster on special road lanes, for high occupancy vehicles, and save time traveling.
Respondents were notified that the total cost of the journey includes all vehicle costs including fuel, insurance, maintenance and parking, justifying in this way the use of the contemporary taxi cost which also includes similar expenses e.g., fuel, insurance, license, maintenance.
An example choice scenario is presented in Figure 1.
To ensure survey scenarios reflect realistic travel options and make sure no dominant scenarios are included, some design conditions were defined. Considering that AVs may save vehicle access time and looking for parking time, private regular car travel time (CAR) is always longer or equal to that of private AV’s time (AV) in any given choice scenario. The survey was written in English. Each national survey was translated to the local language and translated back to English by two different translators, proficient in both languages and with a transport related background, to ensure translation consistency. The survey was distributed to the general public using a snowball sampling plan, by the country coordinators via auto interest groups, public transport providers, national road agencies, engineer’s organizations, car clubs, and other routes including newsletter and social media of interest groups. The aim of this distribution strategy was to allow the survey to be distributed via diverse channels and interest groups, namely users of public transport, nonmotorized transport modes, and cars. As the data was collected from January 2020 to July 2020, some of the data was collected prior to the COVID-19 outbreak in Europe, and some was collected after lockdown restrictions were introduced locally or nationally. All respondents answering after April 2020, were asked to consider their travel patterns prior to any COVID-19 related travel concerns and restrictions imposed in their area potentially affecting their travel choices.

3.2. The Logit Kernel Model

Data from 6 countries, Cyprus, UK, Slovenia, Montenegro, Hungary, and Iceland, were used to estimate a MIXL heteroskedastic error component type model, generally known as the logit kernel (LK). This type of model can address the repeated choice nature of the data, where choice decisions from the same individuals are naturally dependent (also known as panel data or the agent effect). This model takes into account the unobserved factors that influence the decision maker’s choice over time and captures the correlation between choice decisions made by the same individual, using error components applied to the alternative’s specific constant. In this model, the disturbances of the utilities allow both probit-like and additive Gumbel portions [49]. The utility of individual n, obtained from choosing alternative j, in choice situation t is formulated as:
U j t n = β i X i j t n + ε j t n
where
β i is a vector of parameters to be estimated for the different mode attributes (e.g., time and cost), indexed by i;
X i j t n is a vector of observable variables (e.g., trip cost, respondent’s age);
ε j t n is the random utility term made up of probit-like and independent and identically distributed (i.i.d) Gumbel random variate components.
Numeric calculation of the maximum likelihood was not possible due to high dimensionality of the integrals. Instead, the unconditional probability of the choice sequence, estimated via maximum likelihood estimation, is the integral over the values of β:
P n = L n ( β ) f ( β ) d β
where f ( β ) is the density function and L n β is the logit probability evaluated at β .
The probability that individual n chooses alternative i from a set of j alternatives in time t, is conditional on β n and can be formulated as:
L n i t ( β n ) = e β n X n i t j e β n X n i t
The mixed logit probability is the weighted average calculated at different values of β after many repeated draws, with the weights given by the density function f ( β ) [50]. One of the key parameters that can be estimated based on the results of DCMs is the Value of time (VoT). VoT is one of the most commonly used parameters in transportation planning, as many scholars believe that travel time saving is a dominant benefit of transportation investments [51,52]. VoT is typically used as a reference point to understand the tradeoffs between travel times and travel costs and is often used to evaluate transportation projects, policies and services on a consistent basis. VoT is considered to be an important facet of AV acceptability, as AVs’ market penetration in different countries is largely dependent on users’ willingness to purchase them, or pay for AVs services [53].
The VoT of country k and alternative j is calculated based on the formula:
V o T j k = β t t j k β t c j k
where β t t is the parameter estimated for travel time and β t c is the parameter estimated for travel cost.

4. Results

This section presents some descriptive statistics of the survey responses and the results of the MIXL model estimated for this study, providing inference based on the statistical significance of these results, including values of travel time.

4.1. Descriptive Statistics

While each individual answered six SP questions, only responses where AV or CAR were chosen, were analyzed. As our focus is on private AV acceptance compared to private regular car, leaving aside the question of car or ride sharing, all SAV choices were removed from the data set used for the analysis. After removing 3752 choice observations where SAV was chosen, 7953 observations were left. In total 200 incomplete questionnaires were removed, and consequently, the final data set had 7163 mode choices observations from 1669 individuals. On average, 4.3 observations from each individual were included in the data set. The number of respondents and observations used for this analysis, from each country are summarized in Table 5:
The socio-demographic characteristics of the sample are summarized in Table 6, Table 7 and Table 8. As the survey distribution was not controlled for a representative sample, the survey sample’s socio-demographic distribution is therefore compared to the population’s socio-demographic distribution. For each country, the left cells correspond to the data from the study’s sample, and right cells correspond to population census data from 2019 [54]. Since responses from individuals under the age of 15 were not considered in the analysis, the age categories only include ranges over the age of 15 (see Table 6). The Montenegro sample is relatively young in comparison to its population, whereas the Hungarian age group of 15–24 is not represented in the data. The representation of older generations in Iceland and Hungary in the sample corresponds relatively well to the population. Overall, 72% of the respondents were men, with a large variation within individual countries. In all countries, the majority of respondents identified themselves as males. The Hungary sample had the highest share of men, 86%. The data also included information about the number of family members living in the same household: 43% of the respondents came from households of over four members, 20% of three members, and 27% of two members and 10% of households had only one member. All country samples underrepresent a single-member household. Furthermore, all samples overrepresented large households. It should be noted that Hungary and the United Kingdom showed different proportions: the largest group was of two members household size rather than four plus, both of which correspond with national trends compared to the other six selected countries.
Table 7 presents the statistics regarding the respondents’ education and employment levels. The samples with the highest level of educational degree individuals were in Cyprus and the United Kingdom, where most had a postgraduate degree (56% and 54%, respectively), while in Montenegro high-school education was the most common (48%). The census data from Eurostat [54] shows that Montenegrins with lower level educational degrees are overrepresented in the survey sample, which is consistent with the overrepresentation of the 15–24 age group. The majority of respondents in Slovenia (57%) and Hungary (84%) had a bachelor/college degree. The employment status as reported by the respondents showed that the company owners represented the smallest employment group, while the majority of individuals (62%) were employees in all countries. Roughly 13% of the individuals were full-time students. The respondents’ unemployment share in Montenegro was 24%, which is higher than in other countries and is overly represented in comparison to the Eurostat data [54]. It should be noted that COVID-19 employment impacts are not reflected yet in the Eurostat data.
Table 8 presents the income range of the respondents and car ownership of the respondents. The annual gross household income was reported in income bands, which were defined separately for each country based on reported country statistics. The respondents were asked to pick one income band from a drop-down menu of 20–25 country specific income bands. The income bands were converted to four country-specific income groups: low-class (L), middle-class (M), high-class (H), and not willing to disclose. Besides the “no answer” class, all classes had about the same number of distributed income bands. About 11% of total respondents were classified as H, 38% were M, and 36% were L. Roughly 14% were not willing to disclose their household income. A large portion of the respondents from Hungary (39%) and Montenegro (52%) were classified as L income class. The income classes cannot be compared between countries directly, given the differences in the income band ranges, currency and purchasing power between the countries. Car ownership statistics reveal that overall, 90% of respondents had a car in the possession of their households. Respondents from Hungary had the lowest car ownership rates (68%).
Table 9 summarizes the reported travel habits, including trip purpose, and current transport mode used regularly. For the SP experiment, the respondents were asked to think of a regular trip they make. The reported trip purposes of this trip were classified to eight types, and currently used transport modes to 11 types. The majority of individuals reported work as the purpose of their regular trip (54%). While work trips were the most common in all countries, it should be noted that the lowest work trips proportion was in Montenegro (30%), where educational trip purpose was more common than in any of the other countries (25%). Current transport mode used for the reported regular trip showed that around 70% used private cars. Out of all countries, the sample from Hungary had the highest transit share (31%).

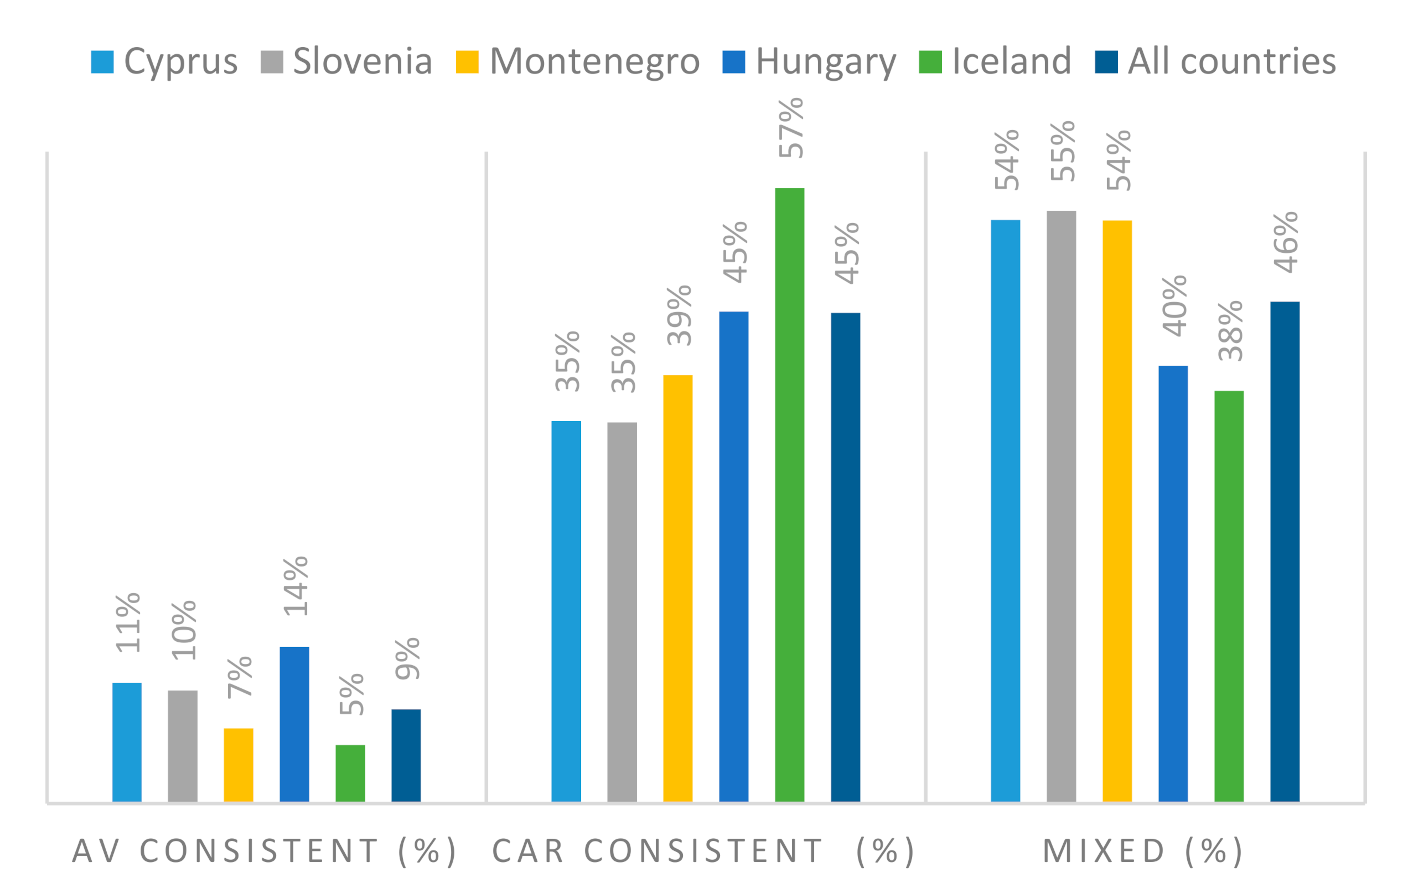
4.2. Modal Split and Choice Patterns

Across all choice decisions, regular car was the preferred option with 70% of choices, compared with 30% AV choices. While regular cars were preferred over AVs in all countries, Iceland and UK had the most regular car choices, demonstrating skepticism and reluctance towards AVs, while Slovenia and Cyprus had the most AV choices (see Figure 2).
Choice patterns were examined on the individual level to capture nontrading behaviors. Within this context, nontraders are individuals who exhibit a lack of sensitivity to the attribute’s variation, i.e., choosing the same alternative consistently throughout all choice scenarios. Only choices from individuals who had at least four choices recorded were included in this analysis. UK was removed from this analysis as the sample size (n = 79) was too small to ascertain consistent response patterns that allow for significance. Across the data set, 9% of choice sets showed exclusive AV choices, compared with 45% CAR choice sets. Nontrading patterns across all six countries are illustrated in Figure 3. It can be noted that Hungary, Slovenia, and Cyprus have the most AV consistent choices (i.e., choosing AV exclusively), while Iceland has the most CAR consistent choices. Overall, consistency in CAR choices was higher in all countries compared with AV choices, indicating major reservations towards AVs and nontrading behaviors of familiar alternatives.

4.3. Parameter Estimates

A LK type model with panel effects was estimated using Pandas Biogeme [55], using 2000 Modified Latin Hypercube Sampling (MLHS) draws which were found empirically sufficient for parameter convergence. A joint model for all countries was estimated, as well as six country-segmented models. To account for serial correlation, a random parameter (RP) normally distributed across individuals, for each alternative’s constant was specified [49]. The results of all seven models are summarized in Table 10, with the t-test of each parameter presented in parentheses. All parameters of the joint model are significant at the 5% level. For the country segmented models, insignificant parameters were kept in the model for comparative purposes.
Example utility functions for individual n are given as:
U n A V = A S C A V + A S C _ R P A V * r a n d o m . d r a w s + β t t * T r a v e l . t i m e ( n ) + β t c * T r a v e l . cos t ( n ) + β w o m a n * I s . w o m a n ( n ) + β a g e > 59 * I s . o l d e r ( n ) + β h i g h i n c o m e * H i g h . i n c o m e ( n ) + β u sec a r * U s e . c a r ( n )
U n C A R = 0 + A S C _ R P C A R * r a n d o m . d r a w s + β t t * T r a v e l . t i m e ( n ) + β t c * T r a v e l . cos t ( n )
A likelihood ratio test between the likelihood of the restricted joint model and the sum of likelihoods of the country-segmented models was conducted to test if the model parameters are statistically different among the six countries. The hypothesis of equal model parameters was rejected at the 5% level, establishing significant differences in behavior between the countries and justifying the use of a full country segmentation using the six country-segmented models. The hypothesis of alternative specific cost and time parameters within each country was rejected in all models except for the Iceland model, where alternative specific parameters for time were found significant. Originally, all cost values were presented in local currencies, but were converted to Euros based on contemporary exchange rates for comparative purposes. The parameters included in the final models were chosen based on the joint model significance: woman dummy, currently use private car for the regular trip dummy, age over 59 dummy, and a high-income dummy. As each country had 20–25 local currency income bands based on national statistics, the dummy for high income was defined based on the highest 8–9 income bands, so this variable is relative to each country’s sample. Socio-demographic variables as well as current travel habits were modeled in the utility function of AV, while CAR served as the baseline.

4.4. Models Parameters Inference

The parameters of cost and time were significant for all countries as well as for the joint model, and with the expected negative signs: as travel cost or travel time increases, the utility obtained from choosing this mode is likely to decrease. Value of time (VoT) estimates are subsequently discussed. In the joint model, women preferred CARs over AVs. This result is consistent with previous research, showing that men tend to favor AVs more than women. This could possibly be explained by affective reactions or higher concern with AVs [40,56]. This tendency is significant only in Iceland, where the woman parameter is the only country specific significant one and the most negative one. In the joint model, individuals with high household income tended to favor AVs over CARs. This can be explained by their ability to afford the anticipated higher trip cost of AVs. However, the high household income parameter was significant only in the UK’s and Iceland’s models, and its influence was the strongest in the UK model. This is an interesting result, considering that the UK and Iceland are on average relatively more affluent than the other countries. They also have the lowest AV choice proportion and AV choice consistency, indicating larger reservations towards AVs. This finding implies that AVs acceptance is not as strongly affected by income in the other countries compared to the UK and Iceland. In other words, less affluent countries (see Table 11 for GDP per capita estimates) show higher AV acceptance regardless of income class, while in the more affluent countries, it is the wealthier individuals who are more likely to choose AVs. In the joint sample, older individuals over the age of 59 preferred CARs over AVs. While younger individuals tend to be more open to new technologies, older individuals are usually more set in their ways [12] and may feel uncomfortable around technological innovations such as AVs, that may be perceived as a distant future option for them. While older age significantly decreased the utility obtained from AVs in UK, Slovenia, and Iceland, it had the strongest influence in the UK. Older age was insignificant for Cyprus, Montenegro, and Hungary. Individuals who currently use a car for their regular trip in the joint sample, favored private CARs over AVs. This could be explained by their access to a private car, the force of a habit, their trust and familiarity with this mode and pleasure derived when driving. Currently using car, decreased the probability to choose AVs in Cyprus, UK, and Montenegro, while the parameter for Cyprus was the most negative. The effect of a dummy variable for whether the respondent currently uses a car for the trip was insignificant for Hungary, Slovenia, and Iceland. The AV ASC showing the tendency to favor AVs while all other parameters kept equal, were negative and significant in all models except those of Cyprus and Slovenia where they were not significantly different from zero. This shows that individuals from Cyprus and Slovenia are the most likely to favor AVs. UK had the lowest (most negative) ASC, indicating that individuals from the UK are the least likely to favor AVs, followed by Iceland and Hungary.

4.5. Value of Time Analysis

VoT estimates are compared to the GDP per capita [57] of each country for the year 2019 (Table 11). VoT estimates are higher than expected [53], potentially due to the hypothetical nature of the choice scenarios, whilst at the same time reflecting the high uncertainty surrounding AV deployment across countries of different size and GDP per capita. This is an important finding for policy makers which needs to be further explored through further research and analysis. Nevertheless, it is interesting to compare their relative value, and their relative rank (presented in parentheses in Table 11).
Out of the six countries, Iceland has the highest VoT with the VoT of AV being higher than that of CARs. Given Iceland’s national wealth, it is no surprise that it has the highest VoT. It is an interesting finding that the calculated VoT for AV travelers from Iceland is higher than that of car users. Although still being debated by scholars [58], some studies suggest that VoT of AVs would be lower than that of regular cars’ given traveler’s ability to engage in other activities while traveling (multitasking) and therefore they may be less sensitive about their time [4,59]. However, the current finding suggests that travelers who choose AVs are more likely to be wealthier, and the user type effect is stronger than the mode effect in this case, raising sustainability related concerns. While the correlations between the rankings of the GDP and VoT are mostly evident, some rankings are inconsistent. While Montenegro has the lowest GDP per capita, their VoT ranking is third, and similar to the UK one. Furthermore, Slovenia has the second highest VoT ranking, higher than the UK one, while their GDP per capita is fourth. The differences between the GDP and VoT rankings can be either an indication of cultural differences or the result of insufficient sample size or insufficient samples, both of which are issues which need to be further addressed in future surveys, based on these findings which highlight the complexities of conducting such surveys at international level.

5. Discussion and Conclusions

The way policy makers and transportation planners plan for the possible introduction of AVs is crucial to how this technology may be accepted or rejected in different countries, and consequently, what impact their deployment will have on society and wider sustainability goals. Studying the factors which influence AVs acceptance, can facilitate the guidance of resources to appropriate directions and guide the future research of a more acceptable vehicles [9]. Discrete choice models allow the exploration of tradeoffs between different attributes of the alternative (e.g., travel time and cost) and of the individual (e.g., socio-demographic attributes), that influence mode choice. Previous studies used discrete choice models to identify the characteristics of potential early adopters of AV’s [12,24,60], but none used data from multiple countries to model national differences in AV acceptance. This study fills this gap by modeling the choice between conventional regular cars and private AVs among six European countries. To the best of our knowledge, no research has previously applied discrete choice models to AVs acceptance among more than two countries, and particularly in such diverse EU, non-EU and EEA countries. The effects of travel time, travel cost, gender, age, income, and current travel habits are quantified in a joint model as well as six country-segmented models, using a logit kernel model with panel effects.
Overall, large hesitations towards AV acceptance exist across all countries, with 70% of choices being regular cars. We found that individuals from Slovenia and Cyprus are the most likely to favor AVs, while individuals from wealthier countries, UK and Iceland, show the largest reservations towards them. While we could not find comparable research for most countries, it was previously reported that 78% of individuals from the UK express some level of concern regarding AVs [40], which is also in line with Eurobarometer 2020 survey findings [61].
We found that men favor AVs more than women do, which is consistent with previous findings that found that men were more willing to purchase AVs [1], and would pay more for them [40]. Additionally, older individuals may be more hesitant towards AVs and prefer private conventional cars, a preference which was previously established [12]. According to our findings, this effect was especially prominent in the UK. As AVs are more likely to be preferred by individuals with higher income, it seems that affordability may play a significant role in mode choice. From the perspective of policy makers, it is important to provide cost-efficient automated modes, which will be accessible to travelers of different income groups, such as shared automated vehicles. Current modal preferences may also serve as predictors for future AV acceptance, since current private regular car users, tend to be more hesitant towards AVs than other modes users. This effect was especially prominent in Cyprus, where car ownership was the highest among all collected samples, perhaps reflecting the high car dependency on the island.
Reservations towards AVs can also be emphasized by consistent choices that capture non-trading behavior: only 9% of choice sets showed consistent AV choice pattern, compared with 43% of regular car choice sets. Table 12 summarizes the results of the overall AV choices, consistent AV choices and alternative specific constant (ASC) model estimates, to illustrate the differences in AV acceptance among the six countries.
It can be noted that Cyprus and Slovenia show the highest AV choice proportion, as well as the most AV consistent choices and largest AV ASCs (not statistically significantly different from zero), indicating that AV acceptance is predicted to be the highest in these countries. Hungary shows a large proportion of AV choices and the highest AV consistency. Respondents from Iceland and the UK seem to be the most hesitant towards AV acceptance as captured by low proportion of AV choices, AV consistency, and the most negative ASCs. An interesting result is that the wealthier countries, Iceland and UK, show the least AV acceptance. These findings could also represent higher exposure and familiarity in AV-related developments and policies, which certainly requires further research regarding AV and automated transport training and education.

Study Limitations and Directions for Future Research

An inherent limitation within all SP data-based studies is the hypothetical nature of scenarios that might not reflect realistic behavior. Uncertainty, current expectations, and perceived risks can influence choice [62,63]. Additionally, this method’s critics claim that its findings can suffer from hypothetical bias. Hypothetical bias is over- or underestimation in respondents’ choices due to the fact that the decisions are not concrete, i.e., respondents are not required to act on their stated preferences [64]. In addition, basing policy-making on users’ attitudes, behaviors, and choices can be problematic due to the ‘value-action’ gap [65]. Once automated modes become available to the public, for example through an increased number of AV trials worldwide, it is important to conduct comparable revealed preferences studies and compare the results of stated and revealed preferences surveys. Furthermore, while the questionnaire was the same for all countries, there were unavoidable inconsistencies in data collection indifferent countries. The data were collected by different country coordinators and through various distribution channels, through January–July 2020, with the COVID-19 pandemic outbreak in Europe falling in the midst of data collection. There was also a lack of standardization between countries in the collected data, with regards to the socio-demographics of the samples and the sample sizes, which most probably influences comparability of our samples. Therefore, additional research with larger sample sizes and a better coordinated approach should be carried out. Further research should include more countries and more automated modes such as shared automated vehicles and automated transit as well as slow modes such as walking, biking, and micro-mobility modes such as e-scooters, to explore the full range of AVs acceptance. Likewise, more specific research can be performed on a country-specific level to quantify the AV acceptance within the context of a country’s culture, socio-demographics, and current transport behavior.

Author Contributions

Conceptualization, Y.S., S.E., and N.T.; methodology, S.E. and Y.S.; software, S.E.; formal analysis, S.E. and J.H.; investigation, S.E., J.H., D.E.-K., N.T., S.N.N., C.P., M.D., A.P., I.T., A.B.E., J.S., and Y.S.; data curation, J.H. and S.E.; writing—original draft preparation, S.E.; writing—review and editing, A.B.E., Y.S., N.T., C.P., and S.E.; supervision, S.E. and Y.S.; project administration, S.E. All authors have read and agreed to the published version of the manuscript.

Funding

This project was partly funded by the Action CA16222 of the European Cooperation in Science and Technology (COST) entitled “Wider Impacts and Scenario Evaluation of Autonomous and Connected Transport” (WISE-ACT).

Conflicts of Interest

The authors declare no conflict of interest.

References

  1. Payre, W.; Cestac, J.; Delhomme, P. Intention to use a fully automated car: Attitudes and a priori acceptability. Transp. Res. Part F Traffic Psychol. Behav. 2014. [CrossRef] [Green Version]
  2. SAE International. SAE International’s Levels of Driving Automation for on-Road Vehicles. Available online: http://www.sae.org/misc/pdfs/automated_driving.pdf (accessed on 20 January 2018).
  3. Guo, J.; Susilo, Y.; Antoniou, C.; Brenden, A.P. Influence of individual perceptions on the decision to adopt automated bus services. Sustainability 2020, 12, 6484. [Google Scholar] [CrossRef]
  4. Milakis, D. Long-term implications of automated vehicles: An introduction. Transp. Rev. 2019, 39, 1–8. [Google Scholar] [CrossRef]
  5. Milakis, D.; van Arem, B.; van Wee, B. Policy and society related implications of automated driving: A review of literature and directions for future research. J. Intell. Transp. Syst. 2017, 1–25. [Google Scholar] [CrossRef]
  6. Soteropoulos, A.; Berger, M.; Ciari, F. Impacts of automated vehicles on travel behaviour and land use: An international review of modelling studies. Transp. Rev. 2019, 39, 29–49. [Google Scholar] [CrossRef]
  7. Wadud, Z.; MacKenzie, D.; Leiby, P. Help or hindrance? The travel, energy and carbon impacts of highly automated vehicles. Transp. Res. Part A Policy Pract. 2016, 86, 1–18. [Google Scholar] [CrossRef] [Green Version]
  8. Thomopoulos, N.; Givoni, M. The autonomous car—A blessing or a curse for the future of low carbon mobility? An exploration of likely vs. desirable outcomes. Eur. J. Futures Res. 2015, 3, 1–14. [Google Scholar] [CrossRef] [Green Version]
  9. Koul, S.; Eydgahi, A. Utilizing technology acceptance model (Tam) for driverless car technology adoption. J. Technol. Manag. Innov. 2018, 13, 37–46. [Google Scholar] [CrossRef] [Green Version]
  10. Schoettle, B.; Sivak, M. Public Opinion About Self-Driving vehicles in China, India, Japan, the U.S., the U.K., and Australia; The University of Michigan Transportation Research Institute: Ann Arbor, MI, USA, 2014. [Google Scholar]
  11. Westjohn, S.; Arnold, M.J.; Magnusson, P.; Zdravkovic, S.; Zhou, J.X. Technology readiness and usage: A global-identity perspective. J. Acad. Mark. Sci. 2009, 37, 250–265. [Google Scholar] [CrossRef]
  12. Haboucha, C.J.; Ishaq, R.; Shiftan, Y. User preferences regarding autonomous vehicles. Transp. Res. Part C Emerg. Technol. 2017, 78. [Google Scholar] [CrossRef]
  13. Milakis, D.; Thomopoulos, N.; van Wee, B. Policy Implications of Autonomous Vehicles; Advances in Transport Policy and Planning Book Series; Academic Press: Cambridge, MA, USA, 2020; Volume 5. [Google Scholar]
  14. Hartmann, M.; Motamedidehkordi, N.; Krause, S.; Hoffmann, S.; Vortisch, P.; Busch, F. Impact of Autonomous Vehicles on Capacity of the German Freeway Network. In Proceedings of the ITS World Congress, Montreal, QC, Canada, 29 October–2 November 2017. [Google Scholar]
  15. Narayanan, S.; Chaniotakis, E.; Antoniou, C. Factors affecting traffic flow efficiency implications of connected and autonomous vehicles: A review and policy recommendation. Adv. Transp. Policy Plan. 2020, 5, 1–50. [Google Scholar]
  16. Le Vine, S.; Zolfaghari, A.; Polak, J.W. Autonomous cars: The tension between occupant experience and intersection capacity. Transp. Res. Part C 2015, 52, 1–14. [Google Scholar] [CrossRef]
  17. Becker, H. Verkehrsplanung für das Zeitalter des Autonomen Fahrens; Presentation; VöV: Lugano, Switzerland, 2016. [Google Scholar]
  18. Hamadneh, J.; Esztergár-Kiss, D. Impacts of Shared Autonomous Vehicles on Travelers’ Mobility. In Proceedings of the 6th International Conference on Models and Technologies for Intelligent Transportation Systems, Cracow, Poland, 5–7 June 2019. [Google Scholar] [CrossRef]
  19. Manser, P.; Becker, H.; Hörl, S.; Axhausen, K.W. Designing a large-scale public transport network using agent-based microsimulation. Transp. Res. Part A Policy Pract. 2020, 137, 1–15. [Google Scholar] [CrossRef]
  20. Elvarsson, A.B.; Martani, C.; Adey, B.T. Considering automated vehicle deployment uncertainty in the design of optimal parking garages using real options. J. Build. Eng. 2020, in press. [Google Scholar] [CrossRef]
  21. Meyer, J.; Becker, H.; Bösch, P.M.; Axhausen, K.W. Impact of Autonomous Vehicles on the Accessibility in Switzerland; Arbeitsberichte Verkehrs-und Raumplanung, 1177, IVT; ETH Zürich: Zürich, Switzerland, 2016. [Google Scholar]
  22. Fraedrich, E.; Heinrichs, D.; Bahamonde-Birke, F.J.; Cyganski, R. Autonomous driving, the built environment and policy implications. Transp. Res. Part A Policy Pract. 2019, 122, 162–172. [Google Scholar] [CrossRef] [Green Version]
  23. Kröger, L.; Kuhnimhof, T.; Trommer, S. Does context matter? A comparative study modelling autonomous vehicle impact on travel behaviour for Germany and the USA. Transp. Res. Part A Policy Pract. 2019, 122, 146–161. [Google Scholar] [CrossRef]
  24. Fagnant, D.J.; Kockelman, K.M. Preparing a nation for autonomous vehicles: Opportunities, barriers and policy recommendations. Transp. Res. Part A 2015, 77, 167–181. [Google Scholar] [CrossRef]
  25. OECD. Urban mobility system upgrade: How shared self-driving cars could change city traffic. Corp. Partnersh. Board Rep. 2020, 1–36. [Google Scholar] [CrossRef] [Green Version]
  26. Zhang, W.; Guhathakurta, S.; Fang, J.; Zhang, G. Exploring the impact of shared autonomous vehicles on urban parking demand: An agent-based simulation approach. Sustain. Cities Soc. 2009, 19, 34–45. [Google Scholar] [CrossRef]
  27. Yang, L.; Choudhury, C.F.; Ben-Akiva, M.; Silva, J.A.; Carvalho, D. Stated Preference Survey for New Smart Transport Modes and Services: Design, Pilot Study and New Revision 2009, MIT Portugal. Available online: http://www.mitportugal.org/ (accessed on 31 August 2020).
  28. Becker, F.; Axhausen, K.W. Literature review on surveys investigating the acceptance of autonomous vehicles. Transportation 2017, 44, 1293–1306. [Google Scholar] [CrossRef] [Green Version]
  29. Gurumurthy, K.M.; Kockelman, K.M. Modeling Americans’ autonomous vehicle preferences: A focus on dynamic ride-sharing, privacy and long-distance mode choices. Technol. Forecast. Soc. Chang. 2020, 150, 158. [Google Scholar] [CrossRef]
  30. Lakatos, A.; Mándoki, P. Mode-choice analysis in long-distance, parallel public transport. Transp. Res. Procedia 2020, 44, 332–341. [Google Scholar] [CrossRef]
  31. Shiftan, Y.; Burd-Eden, R. Modeling Response to Parking Policy. Transp. Res. Rec. J. Transp. Res. Board 2001, 1765, 27–34. [Google Scholar] [CrossRef] [Green Version]
  32. Zhong, H.; Li, W.; Burris, M.W.; Talebpour, A.; Sinha, K.C. Will autonomous vehicles change auto commuters’ value of travel time? Transp. Res. Part D Transp. Environ. 2020, 83, 102303. [Google Scholar] [CrossRef]
  33. Saeed, T.U.; Burris, M.; Labi, S.; Sinha, K.C. An empiricial discourse on forecasting the use of autonomous vehicles using consumers’ preferences. Technol. Forecast. Soc. Chang. 2020, 158, 120130. [Google Scholar] [CrossRef]
  34. Ashkrof, P.; de Correia, G.H.A.; Cats, O.; van Arem, B. Impact of automated vehicles on travel mode preference for different trip purposes and distances. Transp. Res. Rec. 2019, 2673, 607–616. [Google Scholar] [CrossRef] [Green Version]
  35. Correia, G.H.; Looff, E.; van Cranenburgh, S.; Snalder, M.; van Arem, B. On the impact of vehicle automation on the value of travel time while performing work and leisure activities in a car: Theoretical insights and results from a stated preference survey. Transp. Res. Part A Policy Pract. 2019, 119, 359–382. [Google Scholar] [CrossRef] [Green Version]
  36. Lavieri, P.S.; Bhat, C.R. Modeling individuals’ willingness to share trips with strangers in an autonomous vehicle future. Transp. Res. Part A Policy Pract. 2018, 124, 242–261. [Google Scholar] [CrossRef]
  37. Kolarova, V.; Steck, F.; Cyganski, R.; Trommer, S. Estimation of the value of time for automated driving using revealed and stated preference methods. Transp. Res. Procedia 2018, 31, 35–46. [Google Scholar] [CrossRef]
  38. Becker, F.; Axhausen, K.W. Predicting the Use of Automated Vehicles [First Results from the Pilot Survey]. In Proceedings of the 17th Swiss Transport Research Conference, Ascona, Switzerland, 17–19 May 2017. [Google Scholar]
  39. Krueger, R.; Rashidi, T.; Rose, J. Preferences for shared autonomous vehicles. Trans. Res. Part C 2016, 69, 343–355. [Google Scholar] [CrossRef]
  40. Kyriakidis, M.; Happee, R.; de Winter, J.C.F. Public opinion on automated driving: Results of an international questionnaire among 5000 respondents. Transp. Res. Part F Traffic Psychol. Behav. 2015, 32, 127–140. [Google Scholar] [CrossRef]
  41. Deloitte. Global Automative Consumer Study: Advanced Vehicle Technologies and Multimodal Transportation; Deloitte Touche Tohmatsu Limited: London, UK, 2019. [Google Scholar]
  42. World Economic Forum. Reshaping Urban Mobility with Autonomous Vehicles: Lessons from the City of Boston, White Paper; Boston Consulting Group: Geneva, Switzerland, 2018. [Google Scholar]
  43. Anania, E.C.; Rice, S.; Walters, N.W.; Pierce, M.; Winter, S.R.; Milner, M.N. The effects of positive and negative information on consumers’ willingness to ride in driverless vehicle. Transp. Policy 2018, 72, 218–224. [Google Scholar] [CrossRef]
  44. Šinko, S.; Knez, M.; Obrecht, M. Analysis of Public Opinion on Autonomous Vehicles. In Proceedings of the 12th International Conference on Challenges of Europe: Innovative Responses for Resilient Growth and Competitiveness, Bol, Croatia, 17–19 May 2017; pp. 219–230. [Google Scholar]
  45. Cohen, T.; Cavoli, C. Automated vehicles: Exploring possible consequences of government (non)intervention for congestion and accessibility. Transp. Rev. 2019, 39, 129–151. [Google Scholar] [CrossRef] [Green Version]
  46. Hulse, L.M.; Xie, H.; Galea, E.R. Perceptions of autonomous vehicles: Relationships with road users, risk gender and age. Soc. Sci. 2018, 102, 1–13. [Google Scholar] [CrossRef]
  47. Csuka, S.I.; Martos, T.; Kapornaky, M.; Sallay, V.; Lewis, C.A. Attitudes toward technologies in the near future: The role of Technology Readiness in a Hungarian adult sample. Int. J. Innov. Technol. Manag. 2019, 16, 1–19. [Google Scholar] [CrossRef]
  48. Walker, J.L.; Wang, Y.; Thorhauge, M.; Ben-Akiva, M. D-efficient or deficient? A robustness analysis of stated choice experimental designs. Theory Decis. 2018, 84, 215–238. [Google Scholar] [CrossRef] [Green Version]
  49. Ben-Akiva, M.; Bolduc, D.; Walker, J. Specification, Identification and Estimation of the Logit Kernel (or Continuous Mixed Logit) Model. 2001. Available online: http://emlab.berkeley.edu/reprints/misc/multinomial2.pdf (accessed on 10 July 2020).
  50. Train, K.E. Discrete Choice Methods with Simulation; University of California: Berkeley, CA, USA, 2003. [Google Scholar] [CrossRef] [Green Version]
  51. Cunningham, M.L.; Regan, M.A.; Ledger, S.A.; Bennett, J.M. To buy or not to buy? Predicting willingness to pay for automated vehicles based on public opinion. Transp. Res. Part F Traffic Psychol. Behav. 2019, 65, 418–438. [Google Scholar] [CrossRef]
  52. Kato, H.; Tanishita, M.; Matsuzaki, T. Meta-Analysis of Value of Travel Time Savings: Evidence from Japan. In Proceedings of the 12th World Conference on Transport Research, Lisbon, Portugal, 11–15 July 2010; pp. 1–23. [Google Scholar]
  53. Wardman, M.; Chintakayala, V.P.K.; de Jong, G. Values of travel time in Europe: Review and meta-analysis. Transp. Res. Part A Policy Pract. 2016, 94, 93–111. [Google Scholar] [CrossRef]
  54. Eurostat. European Statistics, Database. 2020. Available online: https://ec.europa.eu/eurostat/data/database (accessed on 31 August 2020).
  55. Bierlaire, M. A Short Introduction to PandasBiogeme; Technical Report TRANSP-OR 200605; Transport and Mobility Laboratory, Ecole Polytechnique F’ed´erale de Lausanne: Lausanne, Switzerland, 2020. [Google Scholar]
  56. Hohenberger, C.; Spörrle, M.; Welpe, I.M.; Hohenberger, C.; Spörrle, M.; Welpe, I.M. How and why do men and women differ in their willingness to use automated cars? The influence of emotions across different age groups. Transp. Res. Part A Policy Pract. 2016, 94, 374–385. [Google Scholar] [CrossRef]
  57. World Bank Data. GDP Per Capita, 2020. Available online: https://data.worldbank.org/indicator/NY.GDP.MKTP.CD (accessed on 31 August 2020).
  58. Singleton, P.A. Discussing the “positive utilities” of autonomous vehicles: Will travellers really use their time productively? Transp. Rev. 2019, 39, 50–65. [Google Scholar] [CrossRef] [Green Version]
  59. Steck, F.; Kolarova, V.; Bahamonde-Birke, F.; Trommer, S.; Lenz, B. How autonomous driving may affect the value of travel time savings for commuting. Transp. Res. Rec. 2018, 2672, 11–20. [Google Scholar] [CrossRef] [Green Version]
  60. Barbour, N.; Menon, N.; Zhang, Y.; Mannering, F. Shared Automated Vehicles: A Statistical Analysis of Consumer Use Likelihoods and Concerns. Transp. Policy 2019. [Google Scholar] [CrossRef]
  61. European Commission. Expectations and Concerns from a Connected and Automated Mobility; Special Eurobarometer 496; European Commission: Brussels, Belgium, 2020. [Google Scholar]
  62. Swait, J.; Louviere, J.J.; Williams, M. A sequential approach to exploiting the combined strength of stated preference and revealed-preference data: Application to the freight shipper choice. Transportation 1994, 21, 135–152. [Google Scholar] [CrossRef]
  63. Winter, K.; Oded, C.; Martens, K.; van Arem, B. Stated choice experiment on mode choice in an era of free-floating carsharing and shared autonomous vehicles: Raw data. Transp. Res. Board 2017, 1–17. [Google Scholar] [CrossRef]
  64. Hensher, D.A. How do respondents process stated choice experiments? Attribute consideration under varying information load. J. Appl. Econom. 2006, 47, 36–37. [Google Scholar] [CrossRef]
  65. Shove, E. Beyond the ABC: Climate change policy and theories of social change. Environ. Plan. A 2019, 42, 1273–1285. [Google Scholar] [CrossRef] [Green Version]
Figure 1. Example choice scenario from the UK survey.
Sustainability 12 09765 g001
Figure 2. Choice proportion by country.
Sustainability 12 09765 g002
Figure 3. Consistent and mixed choices by country.
Sustainability 12 09765 g003
Table 1. Literature overview of stated preference (SP) surveys evaluating automated vehicle (AV) acceptance using discrete choice models.
SourceChoice SetVariables StudiedCountry of Study
[29]AV, SAV, or airplane
long-distance travel
Travel time, travel cost, socio-demographicsUSA
[32] AV or SAV Travel time, travel cost, urban, suburban and rural residence USA
[33]Traditional vehicle, privately-owned AV, hired AV, shared AV serviceSocio-demographics, locationUSA
[34]Conventional car, public transportation, automated driving transport serviceTravel time, waiting time, walking time, costNetherlands
[35]AV with office interior, AV with leisure interior, conventional carTravel time, travel cost, and effect on value of travel time savingsNetherlands
[36]Private AV, shared AVNumber of passengers, additional travel time, discount, fare structure, travel timeUSA
[37]Walk, bicycle, public transport, private AV, shared AVTrip duration, access/egress time, waiting time, ridesharing (yes/no), travel costsGermany
[38]Train + AV, Train + SAV, SAV, AV, conventional vehicleTravel time, access/egress time, waiting time, number of changes, service frequency, travel costSwitzerland
[12]Regular car, private AV, shared AVTravel cost, travel time, attitudesIsrael/North America
[39]SAV without ride sharing, SAV with ride sharing, current mode choiceTravel cost, travel time, waiting timeAustralia
Table 2. Literature on qualitative studies on AV acceptance.
SourceQuestion PosedSample Size and LocationResponseComment
[10]“What is your general opinion regarding autonomous and self-driving vehicles?”N = 1′533
China, India, Japan, USA., UK, and Australia
56.8%
positive or rather positive
5-point Likert scale from Negative to Positive
[40]“Fully automated driving will be enjoyable.”N = 4′838
Netherlands
56.3% agrees or strongly agrees5-point Likert scale from Strongly Disagree to Strongly Agree
[42]“Would you take a ride in a fully self-driving car?”N = 5′500
27 cities in China, France, Germany, India, Japan, Netherlands, Singapore, UAE, UK and USA
58% likely or very likely5-point Likert scale from Very unlikely to very likely
[41]“To what extent do you believe that fully self-driving cars will not be safe?”N = 10′345
USA, Germany, India, Japan, Republic of Korea and China
47%–50%
agree or strongly agree (results only shown by country). China is outlier with 25%.
5-point Likert scale from Strongly Disagree to Strongly Agree
Table 3. Literature on AV acceptance in each country of study.
CountrySourceComments
Slovenia[44]Based on a national survey sample. Purchase intentions of AVs. Finds that public opinion towards AVs is more negative in Slovenia than elsewhere
Cyprusn/aAV acceptance has not been tested in Cyprus before this study.
UK[45]Using deliberative workshops, came to conclusion that with a regulated market, more socially desirable outcomes will be realized.
[46]AVs considered a somewhat low risk. While skepticism was present amongst respondents, there was little opposition for AV using existing road infrastructure.
Hungary[47] Using technology readiness to relate attitudes with acceptance of technology. Generally, optimism was an influencing factor on acceptance.
Icelandn/aAV acceptance has not been tested in Iceland before this study.
Montenegron/aAV acceptance has not been tested in Montenegro before this study.
Table 4. Design levels for the Bayesian D-efficient design.
Private Regular CarPrivate Automated CarRide Sharing/Car Sharing in an Automated Car
Trip cost0.7 × T × C0.9 × T × C0.5 × T × C
1 × T × C1.2 × T × C0.8 × T × C
1.3 × T × C1.5 × T × C1.1 × T × C
Travel time (D2D)1 × T0.8 × T0.7 × T
1.2 × T1 × T1 × T
1.4 × T1.2 × T1.3 × T
1.6 × T1.4 × T1.6 × T
Number and gender of passengers ridesharing respondentN.AN.AJust you
1 man
1 woman
2 men
2 women
1 man and 1 woman
N.A: not applicable.
Table 5. Number of respondents and observations by country.
CountrySampleObservations
Cyprus158702
United Kingdom79274
Slovenia2741091
Montenegro3211516
Hungary2851289
Iceland5522271
Total16697163
Table 6. Socio-demographic variables of respondents: gender, and age variables.
(Sample/Census Data)CyprusUKSloveniaMontenegroHungaryIcelandTotal
Total No. 158 0.9 m 79 66 m 274 2 m 321 0.6 m 285 10 m 552 0.4 m 1669
Gender
Male58%48%61%49%80%50%69%49%86%45%69%52%72%1202
Female41%52%38%51%20%50%31%51%14%55%31%48%28%461
Other1% 1% - 0% - 0% 0%6
Age *
15–2417%15%11%14%16%11%56%16%0%13%8%17%18%306
25–4966%44%49%40%66%40%41%42%44%42%45%44%50%829
50–5912%15%18%16%12%17%1%16%23%15%20%15%15%247
60–694%13%13%13%5%16%1%15%23%16%18%13%12%200
70+1%13%9%16%1%16%1%12%9%15%9%12%5%87
Household size **
112%21%17%30%11%30%5%26%11%34%12%36%11%175
219%35%46%35%23%27%10%19%37%31%33%28%27%446
317%16%16%15%23%18%16%16%23%16%20%14%20%326
4+52%29%22%20%44%25%70%40%29%20%35%22%43%722
* Age distribution excludes the range 0–14 years old. ** Household size data from 2017. Source: survey data, Eurostat [54].
Table 7. Socio-economic variables: education and employment.
(Sample/Census Data)CyprusUKSloveniaMontenegroHungaryIcelandTotal
Total No. 158 0.9 m 79 66 m 274 2 m 321 0.6 m 285 10 m 552 0.4 m 1669
Education
High-school *10%22%6%19%22%16%48%17%4%20%12%28%19%314
Bachelor/College **28%39%34%40%57%55%36%61%84%58%48%35%51%848
Postgraduate ***56%40%54%41%20%29%14%22%11%23%38%38%28%471
Others6%-5%-2%-2%-1%-2%-2%36
Employment
Company owner4%6%3%8%4%6%3%8%7%5%2%7%4%61
Employee67%41%63%41%67%41%41%31%73%41%65%50%62%1037
Full-time education17%20%10%21%18%18%22%22%1%17%12%25%13%221
Self-employed6%6%9%7%7%6%7%7%5%5%7%7%7%108
Retired2%10%10%13%2%20%3%10%14%16%9%2%7%114
Unemployed2%4%4%2%3%2%24%7%-2%2%2%6%101
Others2%12%1%7%0%7%1%15%1%14%3%9%2%27
Census data corresponds to * Less than primary, primary and lower secondary education. ** Upper secondary, post-secondary nontertiary education. *** Tertiary education. Source: survey data, Eurostat [54].
Table 8. Socio-economic variables: income and car ownership.
(Sample/Census Data)CyprusUKSloveniaMontenegroHungaryIcelandTotal
Total No.1580.9 m7966 m2742 m3210.6 m28510 m5520.4 m 1669
Household income *
H20%-25%-20%-5%-8%-8%-11%191
M51%-43%-52%-27%-39%-46%-38%635
L19%-18%-13%-52%-39%-33%-37%609
Not willing to disclose10%-14%-16%-16%-14%-13%-14%234
Car ownership **
Yes100%-81%-98%-92%-68%-95%-90%1504
No- 19% 2% 8%-32% 5%-10%165
* Income cannot be compared directly across different currencies and income levels. ** No comparable car ownership data. Source: survey data, Eurostat [54].
Table 9. Characteristics of the regular trip as reported by the respondents: trip purpose and transport mode.
Frequency (Percentage %)CyprusUKSloveniaMontenegroHungaryIcelandTotal
Trip purpose
Business journey4 (2%)1 (1%)11 (4%)23 (7%)22 (8%)11 (2%)72 (4%)
Work98 (62%)47 (60%)166 (61%)96 (30%)178 (62%)313 (57%)898 (54%)
Shopping20 (13%)13 (16%)23 (8%)34 (11%)31 (11%)108 (20%)229 (14%)
Leisure6 (4%)5 (6%)15 (5%)43 (13%)21 (7%)32 (6%)122 (7%)
Education12 (8%)8 (10%)41 (15%)81 (25%)-45 (8%)187 (11%)
Passenger pick-up10 (6%)1 (1%)4 (1%)10 (3%)10 (3%)14 (2%)49 (3%)
Social visit6 (4%)4 (5%)11 (4%)29 (9%)20 (7%)21 (4%)91 (6%)
Others2 (1%)-3 (1%)5 (2%)3 (1%)8 (1%)21 (1%)
Total158 (100%)79 (100%)274 (100%)321 (100%)285 (100%)552 (100%)1669 (100%)
Transport mode
Private car137 (87%)43 (54%)213 (78%)187 (58%)152 (53%)430 (78%)1162 (70%)
Public transit4 (2%)13 (16%)18 (7%)41 (13%)88 (31%)32 (6%)196 (12%)
Shared car6 (4%)1 (1%)9 (3%)19 (6%)3 (1%)7 (1%)45 (3%)
Shuttle 1 (1%)--10 (3%)-2 (0%)13 (1%)
Combination1 (1%)2 (2%)6 (2%)8 (2%)11 (4%)6 (1%)34 (2%)
Motorbike4 (2%)-1 (0%)7 (2%)2 (1%)2 (0%)16 (1%)
Private bicycle 1 (1%)11 (14%)14 (5%)7 (2%)8 (3%)40 (7%)81 (5%)
Shared bicycle --1 (0%)3 (1%)-1 (0%)5 (0%)
Scooter-1 (1%)-4 (1%)1 (0%)-6 (0%)
Walking4 (2%)8 (10%)5 (2%)28 (9%)2 (1%)20 (3%)67 (4%)
Others--7 (3%)7 (2%)18 (6%)12 (2%)44 (2%)
Total158 (100%)79 (100%)274 (100%)321 (100%)285 (100%)552 (100%)1669 (100%)
Table 10. Mixed multinomial logit heteroskedastic error component (LK) models estimates.
Parameters Estimates (t-Test)Joint ModelCyprusUnited KingdomSloveniaMontenegroHungaryIceland
AV alt. specific constant (ASC)−1.02 (−5.25)1.78 (1.38)−2.30 (−1.90)−0.83 (−1.48)−0.69 (−2.53)−1.41 (−2.61)−1.71 (−2.31)
AV ASC RP2.11 (3.92)2.30 (2.45)3.50 (3.53)−2.53 (−4.00)−1.32 (−1.38)3.77 (4.69)4.78 (5.7)
CAR ASC RP2.43 (5.16)4.94 (4.72)0.16 (0.05)−2.10 (−3.06)1.85 (2.68)2.70 (2.70)2.13 (1.53)
Travel cost (generic)−11.00 (−17.80)−25.50 (−5.40)−42.90 (−3.92)−8.78 (−7.47)−4.51 (−4.61)−14.90 (−6.35)−28.00 (−9.66)
Travel time D2D (generic)−5.97 (−15.50)−12.60 (−5.23)−23.80 (−3.83)−6.04 (−6.78)−2.52 (−4.93)−6.35 (−6.54)-
Travel time D2D (alt. specific: AV)------−29.90 (−8.52)
Travel time D2D (alt. specific: CAR)------−24.70 (−8.68)
Woman dummy (AV)−0.65 (−2.99)−1.61 (−1.55)0.05 (0.04)0.57 (0.98)−0.34 (−0.99)−0.12 (−0.13)−2.57 (−3.81)
High income (AV)0.76 (2.70)1.81 (1.49)3.39 (2.48)0.24 (0.43)0.57 (0.87)−0.52 (−0.48)2.03 (1.89)
Older age dummy (age > 59) (AV)−1.38 (−5.05)1.69 (0.84)−4.03 (−2.30)−2.12 (−2.07)−0.79 (−0.65)−0.37 (−0.52)−2.94 (−4.03)
Use car dummy (AV)−0.47 (−2.26)−4.11 (−2.74)−2.23 (−1.89)−0.08 (−0.13)−0.71 (−2.24)−1.03 (−1.57)0.50 (0.687)
Number of individuals166915879274321285552
Number of observations71637022941091151612892271
Initial log—likelihood−3844−402−156−707−837−649−1574
Final log—likelihood−3200−316−88−540−779−553−756
Number of MLHS draws2000
Table 11. Value of Time (VoT) and GDP per capita by country.
CountryGDP Per Capita (EUR)VoT (EUR Per Hour)Sample Size
Joint model-331669
Cyprus23,543 (3)30 (4)158
UK35,748 (2)33 (3)79
Slovenia21,766 (4)41 (2)274
Montenegro7464 (6)33 (3)321
Hungary13,923 (5)26 (5)285
Iceland56,612 (1)64 (AV) | 53 (CAR) (1)552
Table 12. AV acceptance as captured by AV choices, AV choice consistency and AV alternative specific constant (ASC).
CyprusUKSloveniaMontenegroHungaryIceland
Number of observations15879274321285552
AV choices (%)34%24%37%32%33%22%
AV consistent (%)11%-10%7%14%5%
ASC parameter (t-test)1.78 (1.38)−2.30 (−1.90)−0.83 (−1.48)−0.69 (−2.53)−1.41 (−2.61)−1.71 (−2.31)
Publisher’s Note: MDPI stays neutral with regard to jurisdictional claims in published maps and institutional affiliations.

