Article

An Exploratory Study of Consumer Food Waste Attitudes, Social Norms, Behavioral Intentions, and Restaurant Plate Waste Behaviors in Taiwan

Department of Hotel and Restaurant Management, National Pingtung University of Science and Technology, Pingtung 91202, Taiwan
*
Authors to whom correspondence should be addressed.
Sustainability 2020, 12(22), 9784; https://doi.org/10.3390/su12229784
Submission received: 14 October 2020 / Revised: 19 November 2020 / Accepted: 20 November 2020 / Published: 23 November 2020

Abstract

:
The rising trend of people dining out has made food waste in restaurants become a significant issue because of sustainability. Consumers’ attitudes toward food waste in restaurants are still undergoing scrutiny. The main purpose of this study was to test the relationships among consumers’ attitudes, social norms, behavioral intentions, and plate waste behaviors in restaurants in Taiwan. This paper contributes to the understanding of consumers’ food waste behaviors by examining a hypothesized research model. Based on a questionnaire with 464 restaurant customers, the hypothesized research model was examined by using structural equation modeling. Sequential mediation for examining the relationships of variables was conducted, and it was found that there was a significant serial mediation effect on the path of consumers’ attitudes, behavioral intentions, food waste behavior, and consumer plate waste. The results of this study can contribute to better engaging consumers in mitigating food waste in restaurants. Implications and suggestions for further research and recommendations for restaurant managers are provided based on sustainable management.

1. Introduction

Food waste has become a main challenge for sustainability [1]. It is an essential topic of environmental, societal, and economic concern [2]. In recent years, it has gained growing public, academic, and political attention [3]. Parfitt, Barthel, and Macnaughton [4] stated that food waste can happen at any stage of the food supply chain. This includes those who produce and process food, such as farmers, food manufacturers, and processors, and those who provide food for consumption, including the hospitality industry, retailers, and others. Food waste not only threatens global food security but also leads to environmental degradation and jeopardizes local community resilience, thus it inflates food prices and accelerates social inequality [5,6,7]. The cost of food waste is staggering: water resources used to irrigate crops, as well as fertilizers and fuels used in production and transportation, are wasted at the same time.
There are approximately 820 million people in the world who are starving. About 1 in 9 people cannot get enough food. Ironically, as much as one-third of food is lost or wasted during the various stages of the food supply chain from farm to table, and 14% is not even delivered after harvest [8]. According to the Food and Agriculture Organization, “food waste behavior” in developed countries has affected them, and deprives developing countries of their fair share of food and resources in developed countries as well [9]. In Europe, up to 42% of food is wasted in the final consumption stage [10], while in the United States, 31–40% of the post-harvest food supply is wasted, a large part of which occurs at the consumer level [11]. Lipinski et al. [12] noted that food waste happens at all stages of the food supply chain, with approximately 35% of food loss and waste occurring at the consumer end of the chain. Silvennoinen et al. [13] indicated that most food waste comes from restaurants, as eating out has increased and is more common in developing countries [14]. Thus, from production to final consumption, all participants in the food sequence have a vital role to play in preventing and reducing food waste, especially the ultimate restaurant consumer [4].
Preventing food waste is an important but tough strategy that requires the engagement of multiple participants [15], and reducing food waste in restaurants is sustainable and important [6]. Consumers perceive waste as an inevitable part of consumption, and producers and sellers induce consumers to make impulse purchases by introducing discounts or special offers, thereby influencing their purchasing decisions and leading to further waste [16]. Previous studies in the food service sector have focused on food waste management operations and reducing the amount of food waste, rather than on consumer food waste behavior in restaurants [17,18]. Parfitt et al. [19] point out that consumers’ plate waste in restaurants is one of the crucial sources of “away-from-home“ waste, and the majority of the food waste comes from the food service sector, which highlights an important opportunity to change consumer behavior [3].
Grandhi and Appaiah Singh [16] reported that consumer food waste behavior has been studied to scrutinize the sociodemographic factors that contribute to food waste; however, few studies have looked at psychological factors, which are in fact of greater significance in understanding the underlying causes of food waste. Furthermore, the relationships between potential factors of food waste among consumers in the food service sector have not been studied. As a result, there is an evidence gap in the methodology used to quantify food waste behavior in the sector. In modern societies, the problem of food waste is closely related to overall consumption habits and is difficult to overcome by recycling and reusing food waste alone.
In spite of all this, it is generally believed that food waste mainly comes from restaurant customers; only a few studies have identified specific factors that lead to plate waste, and there is a lack of development of behavioral change tools and positive social norms to reduce plate waste and understand customers’ behavior. The main purpose of this study is to fill the empirical gap with structural equation modelling methods and explain the fundamental factors that cause food waste behavior in restaurants. Nowadays, human consumption around the world has gradually shifted from the need to eat to the need to “eat smart”. In addition to punishments and rewards that make consumers feel guilty, it is more important to consider how to change their wasteful behavior. Based on this thinking, this paper takes restaurant consumers as the research target. Through a literature review, the research content of rational behavior theory is explored, and a conceptual framework is constructed. The purpose of this study is to understand the relationship between consumer attitudes, social norms, food waste behaviors, and plate waste, and to predict the intention of consumer waste behaviors. A better understanding of food waste behavior from the consumer’s point of view can help in designing future operational interventions to more effectively address the world’s major challenges.

2. Literature Review

2.1. Social Norms

Social norms provide a model for understanding human behavior that is of symbolic importance, particularly for the prevention of misconduct and the promotion of health [20]. “Social norms” is not a new term that refers to standards of behavior that are recognized and accepted by society at large. The marketing of social norms involves the analysis, planning, implementation, and evaluation of programs designed to influence people’s behaviors to promote individual and social well-being for specific audiences [21]. In the fields of sociology and psychology, many theories have explored and demonstrated the important role of social norms in human behavior [22]. Terrier and Marfaing [23] reported that social norms and commitments have been found to have a positive impact on consumers’ pro-environmental behaviors in hotels. Mirosa et al. [24] examined social marketing strategies and behavior change tools with doggy bags, showing that positive social norms can help remove barriers to their use and increase the economic benefits, and that restaurants can reduce the amount of food waste by offering consumers doggy bags [25]. Eatforum [26] suggested that one strategy is to raise awareness (e.g., social norms) of the consequences of food waste, and social norms could be manipulated to reduce food waste in restaurants [27,28]. Jagau and Vyrastekova [29] found that social pressure, particularly guilty feelings and humiliation, could be elicited by signals of inadequate efforts in reducing the amount of food waste.

2.2. How Attitude Influences Behavior Intention

The theory of planned behavior (TPB) is a continuation of the theory of reasoned action (TRA) in the field of psychology [30,31]. TBP was designed explicitly to explain social behavior [32]. This study applies the affect, behavior, and cognition model of attitudes to analyze consumers’ responses to food waste behavior in restaurants. In agreement with TPB, any consumer social behaviors and behavioral intentions might be elucidated by the behaviors of antecedents. Consumer behavior is interpreted by the intention to perform. In this regard, the attitude toward the behavior is “the degree to which a person has a favorable or unfavorable evaluation or appraisal of the behavior in question” [32]. According to Blackwell et al. [33], attitudes determine behavioral intentions, representing what people like and dislike, and in general, people are willing to do what they like and reject what they dislike. Schiffman and Kanuk [34] argue that attitude is a learned psychological disposition that is intended to be a lasting assessment of a subject. Hence, it is reasonable to conclude that behavior is impacted by internal factors, such as one’s attitudes, and external factors, such as norms. It is extensively conceded that affect and cognition are the building blocks from which consumers’ attitudes are assembled and from which diverse consumer responses are determined. Consumer behaviors are at the center of food waste problems in developed countries [29]. The most predominant factor of food waste in rich countries is consumer behaviors [35,36]. Previous research has shown that consumer attitudes and behavioral intentions determine food waste behavior. For instance, attitudes and intentions around not wasting food have a greater influence on food waste behavior [37]. Visschers et al. [38] argued that the behavioral intention of prohibiting food waste and attitudes could predict food waste behavior as well. Stefan et al. [39] also stated that attitudes are important in determining food waste behaviors.

2.3. Food Waste and Plate Waste in Restaurants

Food waste is an economic and environmental problem [40]. It threatens global food security [6]. Food waste occurs at all stages of the food supply chain, with approximately 35% occurring on consumer plates [41]. Consumers are responsible for the largest share of food waste in the sequence from production to consumption in developed countries [29]. Parfitt et al. [4] point out the role of consumers as having great potential for reducing food waste in developed countries. Gustavson et al. [35] and Secondi et al. [36] also pointed out the most important factor of food waste in developing countries is consumer behavior. Silvennoinen et al. [13] indicated that the main reason for food waste in restaurants is not the stage of food preparation, but the customers who dine in restaurants and the service processes. As more people are away from home and there is a growing demand for food prepared and served outside the home all around the world, reducing food waste has become an important way to achieve sustainability in restaurants [6].
The challenge of food waste in restaurants is of particular concern for sustainability, as it has undermined the environmental sustainability of the global food service supply sector [3]. Increased household incomes and too many choices drive consumers to buy too much food, resulting in edible food being wasted [42]. A large proportion of restaurant food waste is due to consumers, which highlights an important opportunity to change consumer behavior. One of the main drivers of food waste in restaurants is irresponsible consumer behavior [43]. Since consumers only throw away a small amount of food, they do not have to worry about it and do not bother to know anything further [44,45]. In general, consumers feel that wasting food is an inevitable part of consumption. Producers and marketers induce consumers to make impulse purchases by advocating discounts or promotional marketing events, thereby influencing consumers’ purchase decisions, leading to food waste later on [16].
The problem of reducing food waste in restaurants has attracted the attention of scholars. Many campaigns have been developed and launched in restaurants in an endeavor to reduce the amount of plate waste all around the world. For example, in 2014, the European Union proposed a “Year of Fighting Food Waste”, Italy proposed the Milan Protocol to halve global food waste, and the United Nations announced its latest Sustainable Development Goal (SDG) with a specific target of reducing global retail- and consumer-level food waste and food losses in the production and supply chain by half in 2030. In France, restaurants are required by law to provide take-away bags to customers [46]. The design and size of trash cans can also be indicative of consumer food waste behavior [47], and restaurants can reduce food waste by providing customers with shopping bags [25]. Mirosa et al. [48] surveyed consumers regarding their values and behaviors around tray waste at a university restaurant. Jeffery et al. [49] reported that mandatory fines can decrease the amount of plate waste and change consumers’ eating habits in restaurants. Kuo and Shih [50] used education and coercion methods to study the phenomenon of food waste in school cafeterias by gender. Overall, strategies to reduce food waste include raising ethical awareness [26], providing bags to consumers [25], changing plate sizes, giving regulation notices, providing education, and using coercion methods. Although education campaigns on food waste may not be successful in the short term, they may influence consumer behavior in the long term [51].
In the end, as sustainability issues increase on the social agenda, food waste is creating a crisis and undermining environmental sustainability. From a business perspective, relating to the environment represents an opportunity to achieve organizational performance by minimizing the cost of improvement [52]. In order to facilitate the growth of the hospitality industry to achieve the goals of sustainability, it has become crucial to pay attention to designing the appropriate strategies and management footprint of environmental sustainability in hospitality operations [53]. Food waste is a heavy operational burden for restaurants [54], and lasting and stable profits can help companies extend their lifespan with more investment in society and the environment to survive. Otherwise, balancing the budget to improve sustainability and bring about solutions for economic, social, and environmental problems is crucial to food waste reduction strategies.
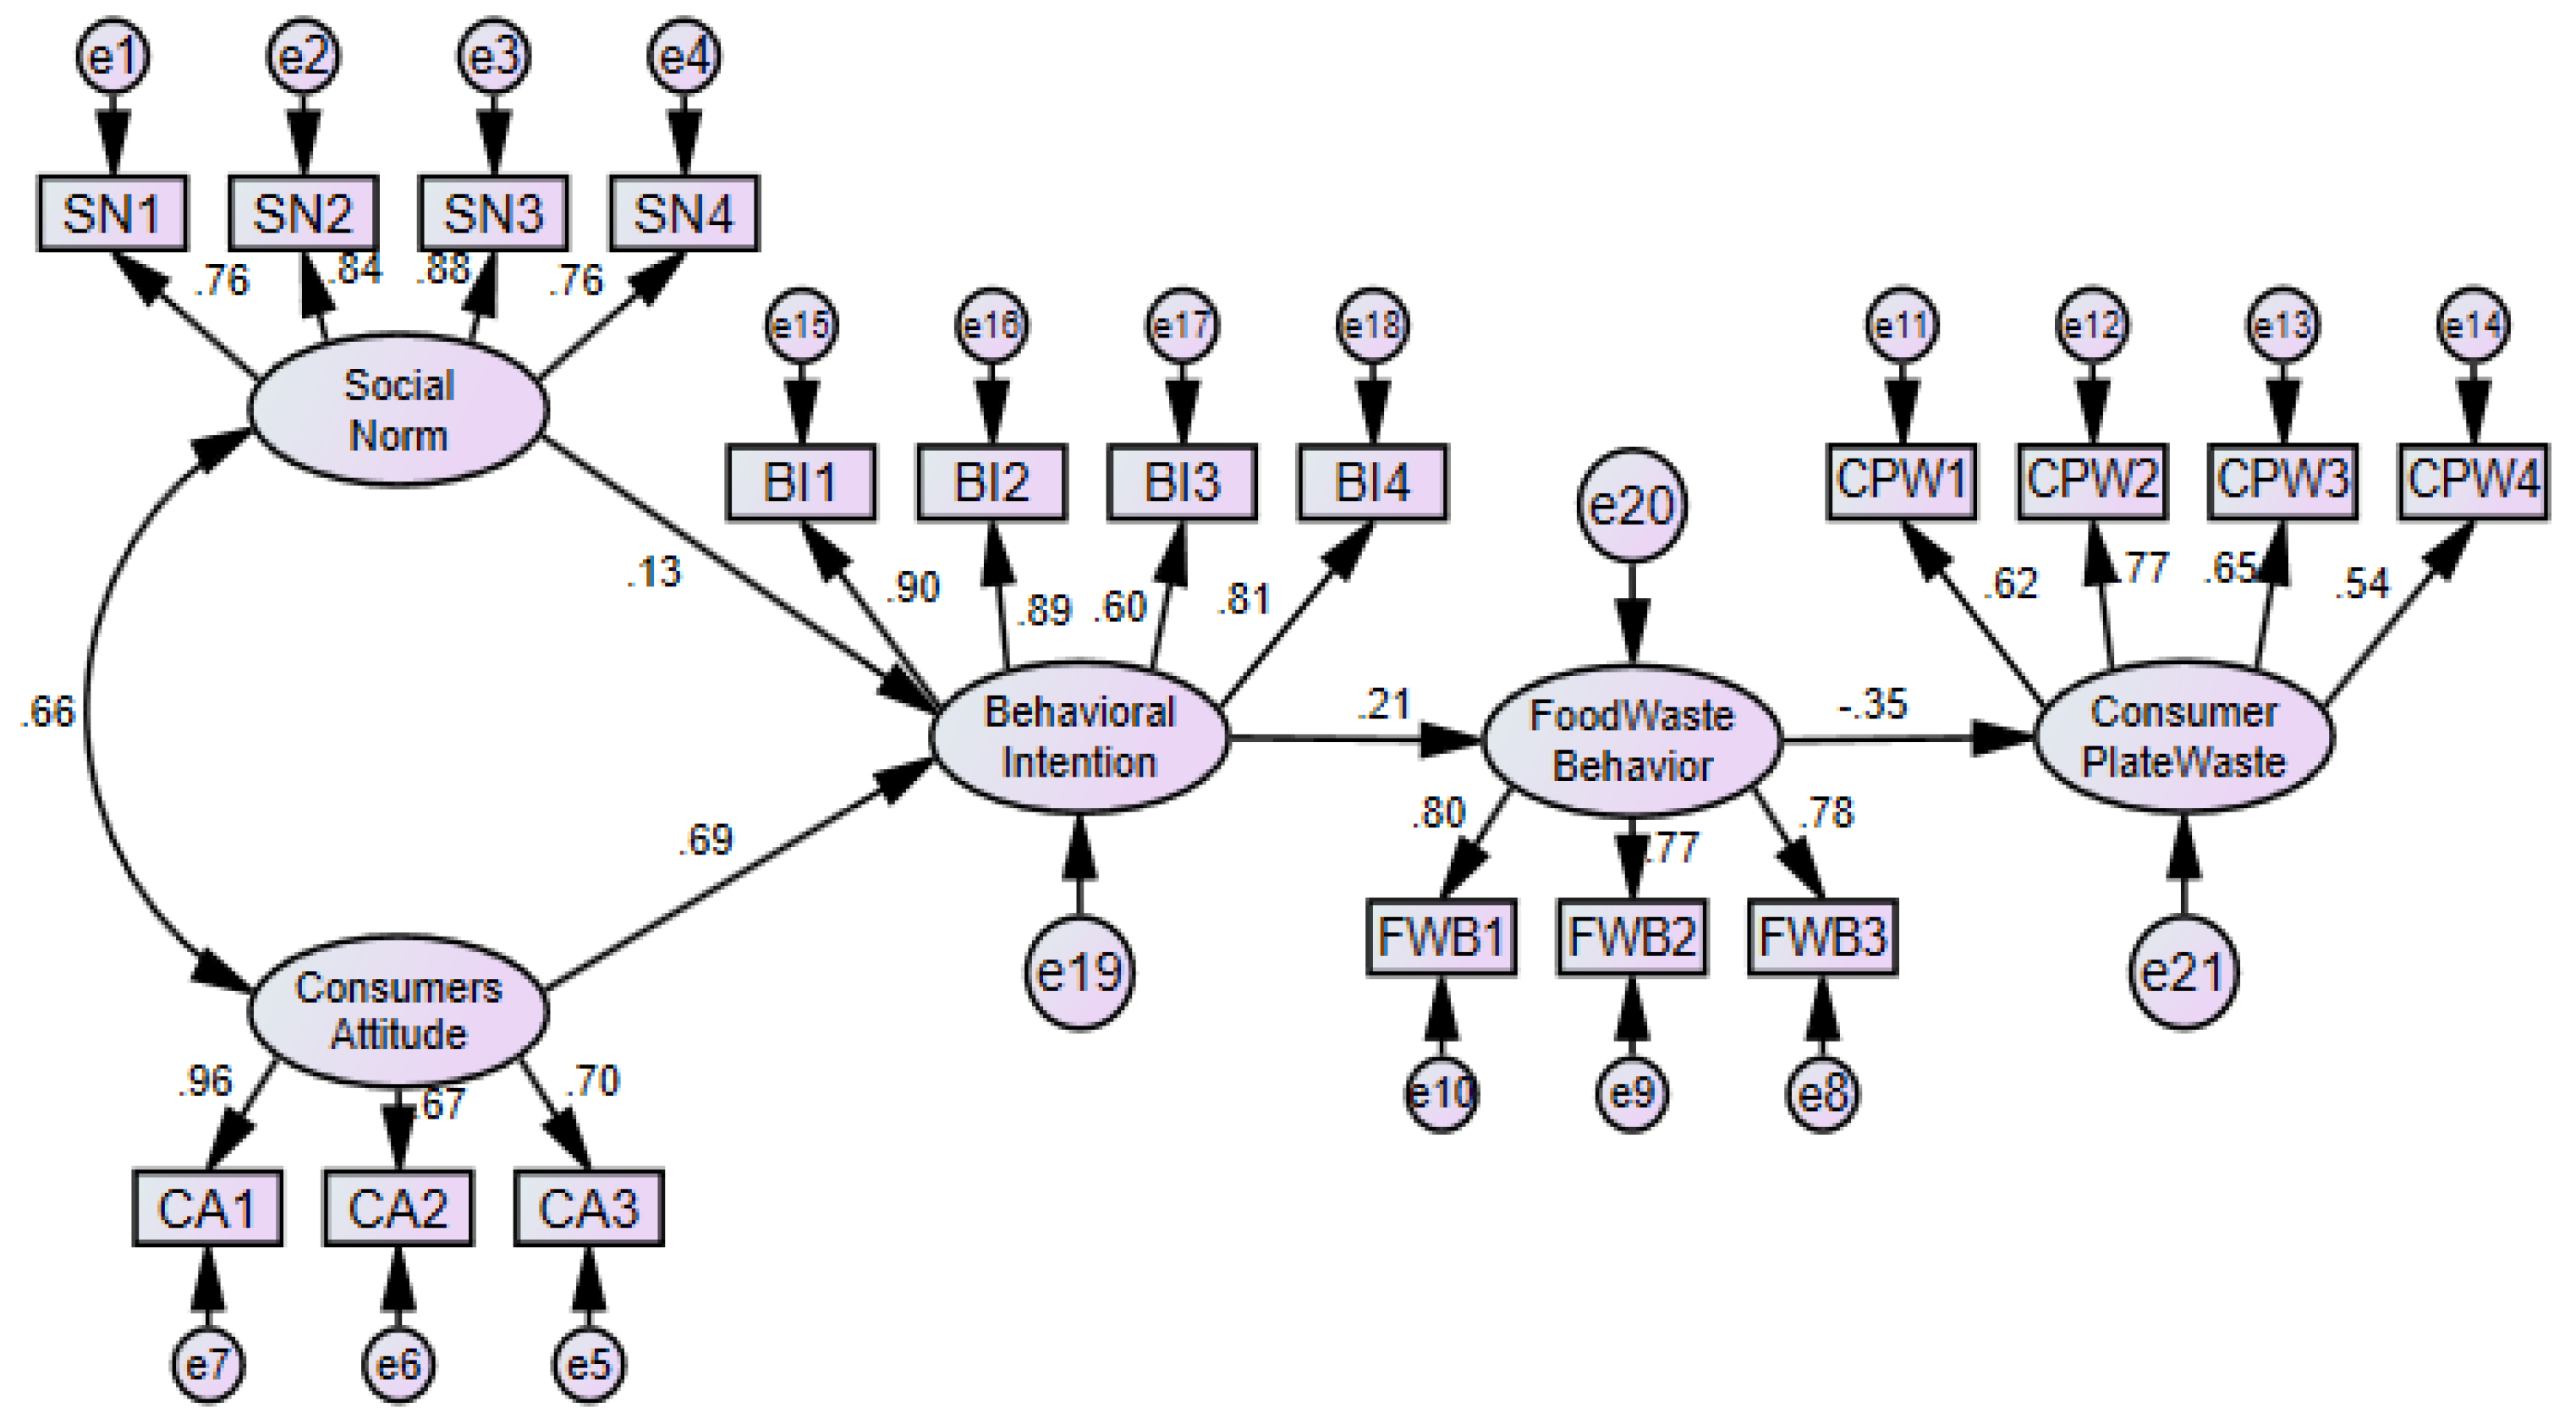
Based on the studies mentioned above, this study provides a holistic view of food waste behaviors. A causal chain between social norms (SN), consumers’ attitudes (CA), behavioral intentions (BI), food waste behaviors (FWB), and consumers’ plate waste (CPW) can be established. This demonstrates the role of social norms and consumers’ attitudes in shaping behavioral intentions and food waste behaviors. In this study, FWB is a kind of consumer perception of reducing food waste in restaurants, while CPW is the real situation where consumers actually waste food in restaurants. Most of the research used experimental designs to examine the relationships between those variables [37,51,55,56]. Unfortunately, no studies have examined the sequential mediating relationships of food waste behaviors in restaurants. Figure 1 shows the hypothesized conceptual research framework based on previous research. This study also examined the sequential mediating effects of two paths, SN-BI-FWB-CPW and CA-BI-FWB-CPW. Those tests may help us to see how the variables are connected and what the rudimentary mediators are in the sequential sequence. We hypothesized that BI and FWB not only are significant direct antecedents of FWB and CPW, but also act as separate and collective mediators between SN, CA, and FWB. Based on the relevance domains discussed above and the hypothesized conceptual research framework, statistically significant causative relationships among social norms, consumers’ attitudes, behavioral intentions, food waste behaviors, and consumers’ plate waste are verified. This study proposes six hypotheses, as follows:
Hypothesis 1 (H1).
Social norms significantly impact behavioral intentions in restaurants.
Hypothesis 2 (H2).
Consumers’ attitudes toward food waste significantly impact behavioral intentions.
Hypothesis 3 (H3).
Behavioral intentions significantly impact food waste behaviors in restaurants.
Hypothesis 4 (H4).
Food waste behavior significantly impacts consumer plate waste.
Hypothesis 5 (H5).
There are significant sequential mediating effects of BI and FWB between SN and CPW.
Hypothesis 6 (H6).
There are significant sequential mediating effects of BI and FWB between CA and CPW.

3. Methodology

3.1. Data Collection Procedure

This study developed the mediating theoretical framework by combining the research of Filimonau et al. [51], Chen and Jai [55], Lavén [56], and Stancu et al. [37], which were experimental designs rather than questionnaires. The hospitality researchers frequently examined the underlying mechanism of the mediation effects by conducting structure equation analysis to understand the causal relationships among latent variables. According to the purposes of this study, an extensive questionnaire was developed. In order to ensure its content validity, we invited 5 experts in food waste to serve as panel members. Then, we conducted a pilot study with 100 subjects. We revived the original questionnaire based on the participants’ questions, comments, and feedback and the results of item analysis.
Structural equation modeling (SEM) estimates based on covariances, so a small sample size might result in unstable covariances turn [57]. Kline [58] asserted that SEM is a method for large-sample studies. Along with model estimators, variable independence, and model complexity, statistical power, effect, and alpha can determine a sample size [59]. To determine the sample size, we calculated the minimum sample size required by giving the number of latent and measurement variables in the hypothesized model (5, 35), the anticipated effect size (0.8), the desired probability (0.05), and statistical power levels (0.8), and obtained a sample size of 400. In order to rule out possible invalid questionnaires, eventually a sample size of 464 was determined to conduct the survey. The subjects of this study were restaurant consumers. In order to obtain the minimum sample size to ascertain the specified effects, the questionnaires were issued by random sampling of 464 questionnaires in 9 restaurants. The restaurants were divided into three categories: small, medium, and large, with a capacity of fewer than 50 seats, about 50 to 100 seats, and more than 100 seats, respectively. Research assistants approached customers who had finished their lunch or dinner and were willing to complete the survey over a 2-month period, 1 August to 30 September 2020.
Figure 1 shows the hypothesized research framework and a detailed flowchart for latent variables, including social norms, consumers’ attitudes, behavioral intentions, food waste behavior, and consumer plate waste. Many studies separately defined the relationship between social norms and behavioral intentions, consumers’ attitudes and behavioral intentions, and behavioral intentions and food waste behaviors, among others [37,51,55,56]. Eventually, this study defined the conceptual framework by building on past conceptualizations. A 7-point Likert scale was used in the first 5 parts to record the respondents’ perceptions of social norms, consumers’ attitudes, behavioral intentions, food waste behavior, and consumer plate waste. The scale was 1 = strongly disagree to 7 = strongly agree. The last part of the questionnaire was about the respondents’ demographic data.
The research assistants approached every third customer and asked them to fill out the questionnaire, and 9 restaurants were chosen by proportionate stratified sampling to ensure random sampling. Every third customer was determined by pointing to a randomly numbered table. Data were collected during lunch or dinner every day, because there are more customers during those 2 rush hours in restaurants. Since we regarded the questionnaire as having sensitive questions, the research assistants asked people if they were willing to answer the questions. Once the respondents whose identities were known agreed to answer the questionnaire, then it was considered insensitive. The assistants described the objective of the questionnaire and asked people if they would participate in the study. Since the contents of the questionnaire were about food waste behavior and we hoped to ensure authenticity, we granted them anonymity by making it a self-administered questionnaire. This method is better to reduce the possibility of sensitive questions than face-to-face interviews to protect subjects. It also addresses the issue of sensitive questions by granting respondents anonymity [60]. After 2 months of data collection, the study included a total of 464 respondents. After coding and cleaning the data, we abandoned questionnaires with the same numbers or too much missing data. Eventually, 64 invalid questionnaires were eliminated. The effective response rate was 86.21%.

3.2. Reliability and Validity of Measurements

The questionnaire was developed from five latent variables: social norms, consumers’ attitudes, behavioral intentions, food waste behavior, and consumer plate waste. Each latent variable consisted of measurement models and all measurement variables in each model was identified in previous studies [37,51,55,56]. Before conducting the survey, we invited eight restaurant customers to join the pilot test focus group interview. All of them were inspired to discuss some open-ended questions. In order to ensure content validity, this study was based on the relevant literature and all items were constructed to reveal the essence of the five concepts. Besides this, five specialists in food waste or food surplus were invited to serve as panel members to control the content validity. The specialists judged whether these measures adequately stood for the construct of the concepts in order to make them clear in the questionnaire.
Before conducting the formal data collection, 100 subjects were invited to do a pre-test. All participants were asked to answer the questionnaire and encouraged to write down their comments on the meaning or wording of the questionnaire contents. We then conducted a factor analysis and corrected several items on the questionnaire according to the comments, suggestions, and item analysis. We did not change the original format of the questionnaire and there are still parts of the survey that need to be fixed. In addition, we examined the outliers and normality before examining the causal relationships among the latent and measurement variables by using SEM. Table 1 shows the reliability and validity of all variables, including the measurement variables. There is no offending estimate in the model because all of the error variance is positive, standard factor loading is less than 0.95, and t-value is greater than 1.96. All of the data reach the threshold of single variable normality in terms of statistical hypothesis, because all of the kurtosis values are less than 8 and the modulus of skewness is less than 2. Moreover, the modulus of the Mardia coefficient (164.848) is less than 360. Those estimates indicate that the data met the requirements of a multiple normality model. In other words, all of the data we collected were suitable for SEM analysis [58].
Fornell and Larcker [61] showed that the average variance extracted (AVE) can serve as another index for evaluating the reliability of measurement models, except the alpha coefficient. The average values of AVE indicate the explanatory degree of latent variables by calculating all measurement variables. Statisticians suggest that the ratio of AVE should be at least 0.6 or higher to meet the standard of a good measurement system. Particularly, the variance is greater than half because of the measurement error, while the AVE ratio is less than 0.5 [58,61]. At this time, the measurement of latent variables should be questionable and indistinct because of the certainty of measurement variables. In terms of construct reliability (CR), there is also another formula to evaluate the reliability of the measurement system. Jackson et al. [62] introduced the evaluation of the measurement model before estimating and judging the construction model to ensure that the measurement variables precisely reflect the latent variables. Accordingly, we conducted three confirmatory factor analyses in order to select relevant variables. Three confirmatory factor analyses can also avoid creating a specification error. If we do not avoid errors, it might cause inappropriate inferences or incorrect estimations. In conclusion, all the measurement systems of the five latent variables in the hypothesized research framework reached the threshold of validity.
As shown in Figure 1, 5 latent variables constitute the research hypothetical model of this study: social norms (SN), consumers’ attitudes (CA), behavioral intentions (BI), food waste behavior (FWB), and consumer plate waste (CPW). Table 1 shows that the values of reliability for all 5 measurement systems meet the requirements. Table 2 shows item reliability, construct reliability, convergence, and discriminant validity. Since this is an exploratory study, factor loadings exceeding 0.5 are acceptable [58]. For construct reliability, composite reliability (CR) is a combination of the reliability of all measurement variables and represents the internal consistency of the index of the construct [63]. It is equivalent to Cronbach’s α, so we report CR value instead of Cronbach’s α. The higher the CR value, the higher the internal consistency of the construct. All five construct reliability values were greater than 0.7, which is an acceptable threshold to ensure construct reliability [64]. Moreover, we estimated the correlations for all measurement variables by using convergence and discriminated validity. The value of AVE is the average of calculating the explanatory power of latent variables to measure variables. The higher the AVE, the higher the convergence validity of the construct. Fornell and Larcker [61] strongly suggested that it should be greater than 0.5, and 0.36–0.5 is the acceptable threshold. The AVE values of the five constructs are from 0.422 to 0.695, which meet the acceptable threshold. This means the constructs in the study have convergence validity. In terms of discriminant validity, the values in bold on the diagonal are the square root of AVE and their estimates should be greater than the values not on the diagonal, which are the Pearson’s correlation of constructs, to ensure discriminant validity. All five factors meet the requirements of discriminant validity.

3.3. Data Analysis

This study analyzed the data by using Analysis of Moment Structures (AMOS) version 24.0 and Statistical Product and Service Solution (SPSS) version 24.0 statistical software. SEM is a powerful and influential statistical tool for testing the relationships among latent and observed variables simultaneously and can also be used to reduce the number of measurement variables and condense the number of latent variables [65]. Path analysis generally takes a single indicator to completely represent a latent variable, and this is not a big problem in statistics. Fortunately, SEM can solve this problem by analyzing all latent and measurement variables together. It is important to presume that variables with errors and errors in the research model are not inter-correlated, which is seldom and tough to achieve in reality [65,66]. Coding and cleaning of the data was executed before examining the hypotheses. In addition, we used stepwise deletion to deal with missing values and excluded all the missing values. The reason is that the method is less biased when comparing with estimated missing values, including those substituted by mean or others [67].
Before conducting the analysis, we screened the 400 usable respondents again and regarded the items that were left blank as missing data. Then, we checked all the data for normality and multicollinearity. Second, in terms of examining reliability and validity, we conducted confirmatory factor analysis. The model fit for every measurement model was assessed and modification indices were utilized to develop the final structural model by reporting the statistical diagram. Maximum likelihood (ML) was chosen to derive the parameter estimates because it can calculate all the information of parameters at the same time [65]. Finally, popular bootstrapping was employed to examine the sequential mediation effect.

4. Results

In order to ensure that all data were suitable for SEM analysis, the data were tested for normality, and the results are shown in Table 1. According to the findings in Table 1, all data met the statistical hypothesis of multicollinearity and were applicable for further SEM test. In all, 464 questionnaires were collected, and 400 samples were recognized as useful. In the demographics, 168 respondents (42.0%) were male and 232 (58.9%) were female. About 67 respondents (41.8%) were under 35 years old, while 109 (27.3%) were 36 to 45 years old, and 124 (31.1%) were over 46 years old.

4.1. Evaluating Structural Evaluation Model and Testing Hypotheses

The indicators of model fit for every latent variable should be addressed in SEM research, including chi-square (χ2), degree of freedom (df), ratio of chi-square to degree of freedom (χ2/df), goodness of fit index (GFI), adjusted goodness of fit index (AGFI), root mean square error of approximation (RMSEA), standardized root mean square residual (SRMR), Tucker–Lewis index (TLI), comparative fit index (CFI), incremental fit index (IFI), Hoelter’s N, gamma hat, and McDonald’s NCI [65]. The results of model fit indicators for the final statistical model are shown in Table 3. The model met all the requirement of identification. The overall SEM model fit showed that χ2 = 164.381, df = 130, χ2/df = 1.264, GFI = 0.960, AGFI = 0.953, RMSEA = 0.026, SRMR = 0.052, TLI = 0.990, CFI = 0.991, IFI = 0.991, Hoelter’s N = 316.899, gamma hat = 0.996, and McDonald’s NCI = 0.958.
The results of the SEM tests are displayed in Table 4 and Figure 2. Table 4 shows the findings of the hypothesis tests, including parameter estimates, standard errors, critical ratio, R2 values, and the results of the tests. The endogenous latent variables were assorted as strong or weak based on a value of R2 of 0.618, 0.045, or 0.120, sequentially [68]. Consistently, behavioral intention (R2 = 0.618), food waste behavior (R2 = 0.045), and consumer plate waste (R2 = 0.120), which are endogenously latent in a row, can be expressed as weak for food waste behavior and consumer plate waste, and strong for behavioral intentions.
The final statistical model indicating all coefficients is shown in Figure 2. The path coefficients are the critical estimated parameters of the SEM tests, and all estimated coefficients were significant. The final estimated statistical model provides an outline of fit indicators for the structural and measurement model. Fortunately, hypotheses 1 and 2 are accepted. The path coefficients between social norms and behavioral intention (r = 0.131; p < 0.021) and between consumers’ attitudes and behavioral intention (r = 0.694; p < 0.000) are significant. This means that social norms and consumers’ attitudes are significantly related to behavioral intention. There were also statistically significant relationships between behavioral intention and food waste behavior (r = 0.211, p = 0.000), and between food waste behavior and consumer plate waste (r = −0.346, p = 0.000).

4.2. Sequential Mediation for Examining the Relationships of Variables

This study examined the sequential mediated effect through two paths; one is social norms to behavioral intention to food waste behaviors to consumer plate waste. We used bootstrapping to examine the sequential mediation effects of the two paths. The results imply that the hypothesis of sequential mediated effects between social norms and consumer plate waste was not supported. Table 5 shows the details of the sequential mediation results, where SN refers to social norms, BI to behavioral intention, FWB to food waste behavior, and CPW to consumer plate waste. On the other hand, sequential mediated effects were found between consumers’ attitudes and consumer plate waste. The variables of behavioral intention and food waste behavior performed well as vital mediators within the hypothesized conceptual research framework of consumers’ attitude and consumer plate waste. The results of sequential mediation of consumers’ attitude and consumer plate waste are shown in Table 6. We used two statistical methods to examine the sequential mediation effects, p-value and 95% confidence interval. Since there are also two kinds of tests for SEM (BC and PC), we used both to test the sequential mediation effects, in order to demonstrate that no matter what kind of statistical method is used, the results are the same.
Jung et al. [69] noted that SEM utilizes bootstrapping to estimate the confidence interval (CI) without resorting to distributional assumptions, and it supports the bootstrap percentile confidence (PC) intervals simply. Bias-corrected (BC) bootstrapping CI has been recommended over PC for its potential usefulness and has attracted attention for SEM. Therefore, this study calculated two values of 95% CI to ensure the accuracy of results of sequential mediated effects, including bias-corrected and percentile bootstrapping CI. With the intention of testing the sequential mediation effects of SN to CPW, we calculated BC and PC bootstrapping CIs for the indirect effect, direct effect, total effect, and serial mediation. Table 5 shows that there are no significant indirect effects through the mediators in PC bootstrapping (p = 0.084, CI = (−0.004, 0.001)), and BC was found to be insignificant as well (p = 0.045, CI = (−0.027, 0.000)). Even though two direct effects of three paths were found be significant, the total effect was not significant. Combining all of the results in Table 5, these results imply that behavioral intention and food waste behavior do not act as important mediators in social norms and consumer plate waste.
For both sequential mediation models, we found a negative relationship between FWB and CPW. When customers learned the reasons for not wasting more food, it became difficult for them to waste any when they were dining out in restaurants. It is hard to control the amount of food waste in restaurants when they understand that reducing food waste is an imperative action for saving the earth and global sustainability.
In Table 6, CA refers to the variable of consumers’ attitudes, BI to behavioral intention, FWB to food waste behavior, and CPW to consumer plate waste. The same analysis approach of Table 5 was used to examine the sequential mediation effect of CA to CPW, and Table 6 shows the details of the results. Values of BC and PC CIs for all effects were significant, with none containing zero for the range of 95% confidence interval, including indirect effect, direct effect, total effect, and sequential mediation. Although the p-value of PC is not significant (p = 0.093), the 95% confidence interval of the other methods were significant (p = 0.001, CI = (0.552, 0.828)). In summary, there is a sequential mediation effect between consumers’ attitudes and consumer plate waste. In addition, behavioral intention and food waste behavior are two vital mediators in the relationship model. We can create a possible relationship model to exemplify how behavioral intention and food waste behavior cooperatively mediate the correspondence between consumers’ attitudes and consumer plate waste. This highlights that the relationships between these exogenous and endogenous variables are shown by the two collective mediators.
The statistical power and reporting of sufficient sample sizes are very important in SEM studies [70]. The greater the statistical power, the more confident we are in the correctness of the research. Therefore, having sufficient samples is a necessary condition in SEM analysis. MacCallum et al. [71] proposed that because root mean square error of approximation (RMSEA) is generally for large samples, it can approach chi-square distribution. This study adopted RMSEA to compute the sample size and statistical power. After calculating based on the formula, the sample size was 400, which is far greater than the minimum requirement and meets the requirement of the rule of thumb. The statistical power of SEM is proportional to the number of samples and the degree of freedom. It focuses on the power of the overall test of model fit. The approach estimates power for “close fit”. Power estimation for a test of close fit is a key strength of this approach [72]. The calculation of the sample size is proportional to the degree of freedom when assuming 1 − β = 0.8. According to the actual calculation of the degree of freedom of the model, a power of 1 is obtained regardless of close fit or not close fit; the number of samples is 45 and 47. In this study, under the close fit test, the power is 0.9999916 and 0.9999804, respectively, illustrating that the estimated statistical SEM model has great statistical power.

5. Discussion

Little research has paid attention to studying the relationships of social norms, consumers’ attitudes, and food waste behaviors by using the SEM method, so this study is a kind of empirical study examining those important relationships in restaurants in Taiwan. It delineates five factors of social norms, consumers’ attitudes, behavioral intention, food waste behavior, and consumer plate waste, as identified by Filimonau et al. [51], Chen and Jai [55], Lavén [56], and Stancu et al. [37]. We emphasize the mediating role of behavioral intention and food waste behavior and tried to be the first to study the relevance of social norms, consumers’ attitudes, and consumer plate waste. Furthermore, most food waste studies have not evaluated behavioral intention and food waste behavior as multiple mediators of the relationships between social norms, consumers’ attitudes, and consumer plate waste.
Researchers have considered and perceived sensitive issues in terms of studying food waste behaviors of customers in restaurants, and this is the main reason why there is a lack of experience in testing consumers’ food waste behavior. This study tried to overcome the sensitivity in an effort to empirically examine food waste behaviors in restaurants. Most food waste studies focus on qualitative research, and a small amount of the quantitative food waste research emphasizes consumers’ food waste behaviors by using experimental designs. In terms of consumer behavior studies, SEM has been regarded as a powerful method and the application SEM in this research is new and original. In general, research on sensitive questions focus on behavior instead of attitudes, because respondents might answer questions about attitude dishonestly. This study tried to empirically explore the relationship of consumers’ attitude and behaviors in terms of food waste. Additionally, it applied multiple sequential mediation models to examine the relationships of social norms, consumers’ attitudes, behavioral intention, food waste behavior, and consumer plate waste. The results emphasize the importance of social norms, consumers’ attitudes, and behavioral intention in influencing food waste behavior and consumer plate waste. In terms of sustainability, these issues are vital for food waste management strategies in restaurants. Based on the results, restaurant managers should try to understand their customers’ perceptions of food waste attitudes and behaviors in order to manage and reduce the amount of the food waste. Furthermore, they should understand the relationships of those variables and how such perceptions affect food waste behaviors. In conclusion, we developed a combined theoretical framework to explain food waste behaviors to illustrate the relationships of social norms, consumers’ attitudes, behavioral intention, food waste behavior, and consumer plate waste.
The findings reveal links between some the sustainability notions of restaurant management. The results of hypothesis tests distinctly demonstrate that consumers’ positive perceptions of social norms and attitudes of food waste have a significant effect on their behavior intention and food waste behavior. The results provide a more holistic view of the process of consumer food waste behavior. A causal chain among social norms, consumers’ attitudes, behavioral intention, food waste behavior, and consumer plate waste can be established, demonstrating the role of consumers’ attitudes in food waste and social norms in shaping their behavior intentions and, in turn, food waste behavior and consumer plate waste. H1, H2, H3, and H4 were supported and clearly congruent with previous literature on the restaurant business [73,74].
Chen and Jai [55] found that a positive perception of corporate social responsibility and attitude led to positive behavioral intentions, while Filimonau et al. [51] indicated that concern for the environment and attitudes toward restaurant food waste have a positive effect on consumers’ behavioral intentions. Moreover, Stancu et al. [37] noted that consumers’ attitudes and injunctive norms significantly impact the intention to not produce waste and the relationship was shown to be positive. Regarding the relationship between food waste behavior and consumer plate waste (H4), the result revealed a negative significant relationship path between these two variables. This is similar to the results of some studies [73,74]. It is interesting to consider the potential controversy that survey topics can have, which can force respondents to not answer truthfully. Although the survey interviews were anonymous and the respondents were willing to answer the questions, they might still worry about repercussions associated with social norm issues.
No previous studies have investigated the sequential mediating relationships of food waste behaviors in restaurants. Marketing researchers frequently examine the underlying mechanism of SEM by conducting mediation analysis to understand the causal relationships among latent variables. Sequential mediation tests can help us to see how behavioral intentions and food waste behaviors are connected and what the radical mediators are in the series. Furthermore, this study highlights that relationships between social norms, consumers’ attitudes toward food waste, and consumer plate waste are mediated by behavioral intentions and food waste behaviors. At present, this exploratory study is significant in exploring the sequential mediating effects of using SEM, which may help us to see how the variables are linked together and what the fundamental mediators are in the sequential chain. The results of empirical exploration of the measures of social norms, consumers’ attitudes, and food waste behaviors showed significant mediating effect in the path of consumers’ attitudes (CA), behavioral intention (BI), food waste behavior (FWB), and consumer plate waste (CPW). This study proposes the CA-BI-FWB-CPW paradigm based on the results and findings. Although there was no significant sequential mediating effect in the path of social norms (SN), BI, FWB, and CPW, social norms and consumers’ attitudes jointly explained 61.8% of the variance of consumers’ behavioral intention regarding food waste. It seems that these components in the mechanism are highly interrelated. For consumers who regard social norms as an important part of their food waste attitude, this may directly influence their behavioral intentions and food waste behaviors.

6. Conclusions

6.1. Theoretical Implications

The results suggest essential academic meaning, since we propose a causal chain relationship model of the CA-BI-FWB-CPW paradigm as an acceptable model fit. The model is a combination of the CA-BI model brought up by Chen and Jai [55] and BI-FWB-CPW model [37]. Both models are built upon the model of food waste behaviors. Social norms, consumers’ attitudes, behavioral intention, and food waste behaviors comprise the elements of the consumer food waste model, and the reaction was manipulated as an estimation of effect (SN, CA, BI) and behavior (FWB, CPW). The CA-BI-FWB-CPW and SN-BI-FWB-CPW causal chains can be used to illustrate the experience of consumer food waste behaviors. Adopting face-to-face interviews as an option for understanding, which is almost impossible to measure, can provide more practical information for restaurant managers.
Overall, this study developed an exploratory infrastructure that demonstrates the process of food waste behaviors in restaurants by combining theoretical frameworks to explain the relevance of SN, CA, BI, FWB, and CPW. It also provides a more holistic view of the consumer food waste process, which is the issue of consciousness. A causal chain between SN, CA, BI, FWB, and CPW was established. No previous studies examined the sequential mediating effects in restaurants by using SEM. This study proposes the CA-BI-FWB-CPW paradigm and highlights that the relationship between consumers’ attitudes and consumer plate waste is mediated by behavioral intention and food waste behavior in restaurants in Taiwan.

6.2. Practical Implications

This research emphasizes the importance of social norms and consumers’ attitudes in influencing their behavioral intentions regarding food waste in restaurants. In terms of sustainability for restaurant operation and management, enhancing consumers’ social norms with positive attitudes toward food waste with appropriate inspiration should be a management goal of restaurants. In addition, every relationship among the variables suggests that managers should design service encounters in their restaurants to trigger customers’ emotions so they will change their behavior intentions and food waste behaviors, one by one, to reduce food waste. These issues are vital for restaurants managers in designing strategies to reduce food cost, which is good for global sustainability. Especially, service experience is an important concept in restaurant marketing, and managers should pay attention to manipulating marketing events or social norm symbols to reduce the food amount in restaurants. Restaurant managers can try to offer high-quality design with social norm symbols to preserve themes of social responsibility and global sustainability, offer reward programs, provide discounts for not offering leftovers, and improve the servers’ awareness and knowledge of food waste, all of which could evoke positive dining emotions and inspire consumers to exhibit good dining behaviors, resulting in reduced food waste, which would then improve sustainability for restaurant operation and management. Additionally, consumer food waste behaviors are affected by social norms and attitudes toward food waste in restaurants. Therefore, restaurant managers should routinely evaluate consumers’ reactions and feedback, and make appropriate adjustments to the service encounters to ensure the implementation of the sustainable strategy. Various stakeholders in restaurants can benefit from these implications.

6.3. Recommendations

There are some limitations and avenues for further research that should be taken into consideration. First of all, this is an exploratory study that collected data in restaurants, and its results may not be generalizable to other kinds of restaurants. The main reason is that different types of restaurants might have different amounts of food waste and consumer segments. We strongly suggest future studies to examine the model and collect data from different types of restaurants in different countries. In addition, further studies should consider how different types of consumers perceive social norms of food waste and how the perception of global sustainability affects food waste behaviors, consumers’ plate waste, and other factors. Second, the samples examined in this study included customers in restaurants in Taiwan, so the findings may not be generalizable to customers in different regions. Norms, attitudes, beliefs, and preferences with regard to food waste may be different among ethnic groups because of different sociocultural factors. Last but not least, future studies can collect data by using different methods to reduce the response bias and reliability, including different research modes of administration. Some of the questions in the questionnaire are sensitive and subjects might worry about repercussions associated with answering, which could lead to inaccurate and dishonest answers. Further studies should be mindful of the cultural characteristics of certain groups being surveyed in order to reduce the response bias, because some groups might see behaviors that others consider socially unacceptable as acceptable or even desired.

Author Contributions

Conceptualization, C.-H.H.; methodology, C.-H.H.; software, C.-H.H.; validation, C.-H.H. and H.-Y.T.; formal analysis, C.-H.H.; investigation, C.-H.H.; resources, C.-H.H.; data curation, C.-H.H. and H.-Y.T.; writing—original draft preparation, C.-H.H. and H.-Y.T.; writing—review and editing, C.-H.H. and H.-Y.T.; visualization, C.-H.H. and H.-Y.T.; supervision, C.-H.H.; project administration, C.-H.H.; funding acquisition, C.-H.H. All authors have read and agreed to the published version of the manuscript.

Funding

This research was funded by the Ministry of Science and Technology (MOST), Taiwan, grant number MOST109-2410-H-020-009 and National Pingtung University of Science and Technology.

Acknowledgments

The authors are immensely grateful to MOST Taiwan and National Pingtung University of Science and Technology for supporting all of our research publications and outputs. We also appreciate anonymous reviewers and editors for comments that greatly improved the manuscript.

Conflicts of Interest

The authors declare no conflict of interest.

References

  1. Wang, L.; Xue, L.; Li, Y.; Liu, X.; Cheng, S.; Liu, G. Horeca food waste and its ecological footprint in Lhasa, Tibet, China. Resour. Conserv. Recycl. 2018, 136, 1–8. [Google Scholar] [CrossRef]
  2. Von Braun, J. The World Food Situation: New Driving Forces and Required Actions; Food Policy Report; IFPRI: Washington, DC, USA, 2007; Available online: http://www.ifpri.org/pubs/fpr/pr18.pdf (accessed on 17 September 2020).
  3. Filimonau, V.; Fidan, H.; Alexieva, I.; Dragoev, S.; Marinova, D.D. Restaurant food waste and the determinants of its effective management in Bulgaria: An exploratory case study of restaurants in Plovdiv. Tour. Manag. Perspect. 2019, 32, 100577. [Google Scholar] [CrossRef]
  4. Parfitt, J.; Barthel, M.; Macnaughton, S. Food waste within food supply chains: Quantification and potential for change to 2050. Philos. Trans. R. Soc. B Biol. Sci. 2010, 365, 3065–3081. [Google Scholar] [CrossRef] [PubMed] [Green Version]
  5. Dou, Z.; Ferguson, J.; Galligan, D.; Kelly, A.; Finn, S.; Giegengack, R. Assessing U.S. food wastage and opportunities for reduction. Glob. Food Secur. 2016, 8, 19–26. [Google Scholar] [CrossRef] [Green Version]
  6. Godfray, H.C.J.; Beddington, J.R.; Crute, I.R.; Haddad, L.; Lawrence, D.; Muir, J.F.; Toulmin, C. Food security: The challenge of feeding 9 billion people. Science 2010, 327, 812–818. [Google Scholar] [CrossRef] [Green Version]
  7. Quested, T.; Johnson, H. Household Food and Drink Waste in the UK; Wastes & Resources Action Programme (WRAP): Banbury, UK, 2009. [Google Scholar]
  8. FAO-Food and Agriculture Organization. Food Wastage Footprint: Impacts on Natural Resources; Food and Agriculture Organization of the United Nations: Rome, Italy, 2013. [Google Scholar]
  9. FAO-Food and Agriculture Organization. Global Food Losses and Food Waste—Extent, Causes and Prevention; Food and Agriculture Organization: Rome, Italy, 2011. [Google Scholar]
  10. Monier, V.; Mudgal, S.; Escalon, V.; O’Connor, C.; Gibon, T.; Anderson, G.; Morton, G. Preparatory Study on Food Waste across EU 27; Report for the European Commission [DG ENV—Directorate C]; European Commission: Brussels, Belgium, 2010. [Google Scholar]
  11. Neff, R.A.; Spiker, M.L.; Truant, P.L. Wasted food: US consumers’ reported awareness, attitudes, and behaviors. PLoS ONE 2015, 10, e0127881. [Google Scholar] [CrossRef] [Green Version]
  12. Lipinski, B.; Hanson, C.; Lomax, J.; Kitinoja, L.; Waite, R.; Searchinger, T. Reducing Food Loss and Waste; World Resources Institute Working Paper 1; World Resources Institute: Washington, DC, USA, 2013; pp. 1–40. [Google Scholar]
  13. Silvennoinen, K.; Heikkilä, L.; Katajajuuri, J.-M.; Reinikainen, A. Food waste volume and origin: Case studies in the Finnish food service sector. Waste Manag. 2015, 46, 140–145. [Google Scholar] [CrossRef]
  14. Christ, K.L.; Burritt, R. Material flow cost accounting for food waste in the restaurant industry. Br. Food J. 2017, 119, 600–612. [Google Scholar] [CrossRef]
  15. Wang, L.E.; Liu, G.; Liu, X.; Liu, Y.; Gao, J.; Zhou, B.; Cheng, S. The weight of unfinished plate: A survey based characterization of restaurant food waste in Chinese cities. Waste Manag. 2017, 66, 3–12. [Google Scholar] [CrossRef]
  16. Grandhi, B.; Singh, A.J. What a waste! A study of food wastage behavior in Singapore. J. Food Prod. Mark. 2016, 22, 471–485. [Google Scholar] [CrossRef]
  17. Charlebois, S.; Schwab, A.; Henn, R.; Huck, C.W. Food fraud: An exploratory study for measuring consumer perception towards mislabeled food products and influence on self-authentication intentions. Trends Food Sci. Technol. 2016, 50, 211–218. [Google Scholar] [CrossRef]
  18. Papargyropoulou, E.; Wright, N.; Lozano, R.; Steinberger, J.; Padfield, R.; Ujang, Z. Conceptual framework for the study of food waste generation and prevention in the hospitality sector. Waste Manag. 2016, 49, 326–336. [Google Scholar] [CrossRef] [PubMed]
  19. Parfitt, Y.; Pike, A.; Ayers, S. The impact of parents’ mental health on parent–baby interaction: A prospective study. Infant Behav. Dev. 2013, 36, 599–608. [Google Scholar] [CrossRef] [PubMed] [Green Version]
  20. Berkowitz, A.D. The Social Norms Approach: Theory, Research and Annotated Bibliography; Hampton Press Inc.: Cresskill, NJ, USA, 2001. [Google Scholar]
  21. Andreasen, A.R. Marketing Social Change: Changing Behavior to Promote Health, Social Development, and the Environment; Jossey-Bass: San Francisco, CA, USA, 1995. [Google Scholar]
  22. Perkins, H.W.; Berkowitz, A.D. Perceiving the community norms of alcohol use among students: Some research implications for campus alcohol education programming. Int. J. Addict. 1986, 21, 961–976. [Google Scholar] [CrossRef] [PubMed]
  23. Terrier, L.; Marfaing, B. Using social norms and commitment to promote pro-environmental behavior among hotel guests. J. Environ. Psychol. 2015, 44, 10–15. [Google Scholar] [CrossRef]
  24. Mirosa, M.; Liu, Y.; Mirosa, R. Consumers’ behaviors and attitudes toward doggy bags: Identifying barriers and benefits to promoting behavior change. J. Food Prod. Mark. 2018, 24, 563–590. [Google Scholar] [CrossRef]
  25. Sirieix, L.; Lala, J.; Kocmanova, K. Understanding the antecedents of consumers’ attitudes towards doggy bags in restaurants: Concern about food waste, culture, norms and emotions. J. Retail. Consum. Serv. 2017, 34, 153–158. [Google Scholar] [CrossRef]
  26. Eatforum. What Is EAT? Science, Politics and Business Sharing Food for Thought. 2017. Available online: http://eatforum.org/eat-initiative/what-is-eat/ (accessed on 17 September 2020).
  27. Allcott, H. Social norms and energy conservation. J. Public Econ. 2011, 95, 1082–1095. [Google Scholar] [CrossRef] [Green Version]
  28. Stöckli, S.; Niklaus, E.; Dorn, M. Call for testing interventions to prevent consumer food waste. Resour. Conserv. Recycl. 2018, 136, 445–462. [Google Scholar] [CrossRef]
  29. Jagau, H.L.; Vyrastekova, J. Behavioral approach to food waste: An experiment. Br. Food J. 2017, 119, 882–894. [Google Scholar] [CrossRef]
  30. Fishbein, M.; Ajzen, I.; Hinkle, R. “Predicting and Understanding Voting in American Elections: Effects of External Variables.” Understanding Attitudes and Predicting Social Behavior; Prentice-Hall: Englewood Cliffs, NJ, USA, 1980; p. 173195. [Google Scholar]
  31. Fishbein, M.; Ajzen, I. Belief, Attitude, Intention and Behavior: An Introduction to Theory and Research; Adison-Wesley: Reading, MA, USA, 1975. [Google Scholar] [CrossRef]
  32. Ajzen, I. The theory of planned behavior. Organ. Behav. Hum. Decis. Process. 1991, 50, 179–211. [Google Scholar] [CrossRef]
  33. Blackwell, R.D.; Miniard, P.W.; Engel, J. Consumer Behavior; Harcourt College Publishers: Fort Worth, TX, USA, 2001. [Google Scholar]
  34. Schiffman, L.G.; Kanuk, L.L. Consumer Behavior, 7th ed.; Prentice Hall: Upper Saddle River, NJ, USA, 2004. [Google Scholar]
  35. Gustavson, J.; Cederberg, C.; Sonesson, U.; Van Otterdijk, R.; Meybeck, A. Global Food Losses and Food Waste: Extent Causes and Prevention; Food and Agriculture Organization: Dusseldorf, Germany, 2011. [Google Scholar]
  36. Secondi, L.; Principato, L.; Laureti, T. Household food waste behaviour in EU-27 countries: A multilevel analysis. Food Policy 2015, 56, 25–40. [Google Scholar] [CrossRef]
  37. Stancu, V.; Haugaard, P.; Lähteenmäki, L. Determinants of consumer food waste behaviour: Two routes to food waste. Appetite 2016, 96, 7–17. [Google Scholar] [CrossRef] [PubMed]
  38. Visschers, V.H.M.; Wickli, N.; Siegrist, M. Sorting out food waste behaviour: A survey on the motivators and barriers of self-reported amounts of food waste in households. J. Environ. Psychol. 2015, 46, 66–78. [Google Scholar] [CrossRef]
  39. Stefan, V.; van Herpen, E.; Tudoran, A.A.; Lähteenmäki, L. Avoiding food waste by Romanian consumers: The importance of planning and shopping routines. Food Qual. Prefer. 2013, 28, 375–381. [Google Scholar] [CrossRef]
  40. Hall, R.E. By how much does GDP rise if the government buys more output? Natl. Bur. Econ. Res. 2009, 40, 183–249. [Google Scholar]
  41. WRAP. The Composition of Waste Disposed of by the UK Hospitality Industry; RES093-001; WRAP: Banbury, UK, 2011. [Google Scholar]
  42. Stuart, T. Waste: Uncovering the Global Food Scandal; W.W. Norton Co.: London, UK, 2009. [Google Scholar]
  43. Tai, J.; Zhang, W.; Che, Y.; Feng, D. Municipal solid waste source-separated collection in China: A comparative analysis. Waste Manag. 2011, 31, 1673–1682. [Google Scholar] [CrossRef]
  44. Sakaguchi, L.; Pak, N.; Potts, M.D. Tackling the issue of food waste in restaurants: Options for measurement method, reduction and behavioral change. J. Clean. Prod. 2018, 180, 430–436. [Google Scholar] [CrossRef] [Green Version]
  45. Arkes, H.R. The Psychology of Waste. J. Behav. Decis. Mak. 1996, 9, 213–224. [Google Scholar] [CrossRef]
  46. Chazan, D. ‘Doggy Bag’Law Introduced in France. Daily Telegraph. 3 January 2016, p. 1, ‘Doggy Bag’ Law Introduced in France. The Telegraph Retrieved from. Available online: http://www.telegraph.co.uk/news/worldnews/europe/france/12079039/Doggy-baglaw-introduced-in-France.html (accessed on 17 September 2020).
  47. Chappells, H.; Shove, E. The dustbin: A study of domestic waste, household practices and utility services. Int. Plan. Stud. 1999, 4, 267–280. [Google Scholar] [CrossRef]
  48. Mirosa, M.; Munro, H.; Mangan-Walker, E. Reducing waste of food left on plates. Interventions based on means-end chain analysis of consumers in foodservice sector. Br. Food J. 2016, 118, 2326–2343. [Google Scholar] [CrossRef]
  49. Jeffery, R.W.; French, S.A.; Raether, C.; Baxter, J.E. An Environmental Intervention to Increase Fruit and Salad Purchases in a Cafeteria. Prev. Med. 1994, 23, 788–792. [Google Scholar] [CrossRef]
  50. Kuo, C.; Shih, Y. Gender differences in the effects of education and coercion on reducing buffet plate waste. J. Foodserv. Bus. Res. 2016, 19, 223–235. [Google Scholar] [CrossRef]
  51. Filimonau, V.; Matute, J.; Kubal-Czerwińska, M.; Krzesiwo, K.; Mika, M. The determinants of consumer engagement in restaurant food waste mitigation in Poland: An exploratory study. J. Clean. Prod. 2020, 247, 119105. [Google Scholar] [CrossRef]
  52. Tzschentke, N.A.; Kirk, D.; Lynch, P.A. Going green: Decisional factors in small hospitality operations. Int. J. Hosp. Manag. 2008, 27, 126–133. [Google Scholar] [CrossRef]
  53. Legrand, W.; Sloan, P.; Chen, J.S. Sustainability in the Hospitality Industry: Principles of Sustainable Operations; Routledge: London, UK, 2016. [Google Scholar]
  54. Giorgi, S. Understanding out of Home Consumer Food Waste; WRAP: London, UK; Brook Lyndhurst: London, UK, 2013. [Google Scholar]
  55. Chen, H.S.; Jai, T.M. (Catherine) Waste less, enjoy more: Forming a messaging campaign and reducing food waste in restaurants. J. Qual. Assur. Hosp. Tour. 2018, 19, 495–520. [Google Scholar] [CrossRef]
  56. Lavén, L. Consumers’ Food Waste Behaviour in Restaurants. Master’s Thesis, University of Gothenburg, Gothenburg, Sweden, 2017. [Google Scholar]
  57. Kyriazos, T.A. Applied Psychometrics: Sample Size and Sample Power Considerations in Factor Analysis (EFA, CFA) and SEM in General. Psychology 2018, 9, 2207–2230. [Google Scholar] [CrossRef] [Green Version]
  58. Kline, R.B. Principles and Practice of Structural Equation Modeling; Guilford Publications: New York, NY, USA, 2016. [Google Scholar]
  59. Schumacker, R.E.; Lomax, R.G. A Beginner’s Guide to Structural Equation Modeling, 4th ed.; Routledge: New York, NY, USA, 2016. [Google Scholar]
  60. Chu, A.M.; So, M.K.; Chan, T.W.; Tiwari, A. Estimating the dependence of mixed sensitive response types in randomized response technique. Stat. Methods Med Res. 2020, 29, 894–910. [Google Scholar] [CrossRef]
  61. Fornell, C.; Larcker, D.F. Evaluating structural equation models with unobservable variables and measurement error. J. Mark. Res. 1981, 18, 39–50. [Google Scholar] [CrossRef]
  62. Jackson, A.L.; Inger, R.; Bearhop, S.; Parnell, A. Erroneous behaviour of MixSIR, a recently published Bayesian isotope mixing model: A discussion of Moore & Semmens (2008). Ecol. Lett. 2009, 12, E1–E5. [Google Scholar]
  63. Jöreskog, K.G.; Sörbom, D. PRELIS 2 User’s Reference Guide: A Program for Multivariate Data Screening and Data Summarization: A Preprocessor for LISREL; Scientific Software International: Lincolnwood, IL, USA, 1996. [Google Scholar]
  64. Hair, J., Jr.; Hult, G.; Ringle, C.; Sarstedt, M. A Primer on Partial Least Squares Structural Equation Modeling (PLS-SEM); Sage Publications: Washington, DC, USA, 2014. [Google Scholar]
  65. Schreiber, J.B.; Nora, A.; Stage, F.K.; Barlow, E.A.; King, J. Reporting Structural Equation Modeling and Confirmatory Factor Analysis Results: A Review. J. Educ. Res. 2006, 99, 323–338. [Google Scholar] [CrossRef]
  66. Jackson, J.L.; Gillaspy, J.A.; Purc-Stephenson, R. Reporting practices in confirmatory factor analysis: An overview and some recommendations. Psychol. Methods 2009, 14, 6–23. [Google Scholar] [CrossRef] [PubMed]
  67. Lin, J.; Li, N.; Alam, M.A.; Ma, Y. Data-driven missing data imputation in cluster monitoring system based on deep neural network. Appl. Intell. 2020, 50, 860–877. [Google Scholar] [CrossRef] [Green Version]
  68. Chin, W.W.; Peterson, R.A.; Brown, S.P. Structural Equation Modeling in Marketing: Some Practical Reminders. J. Mark. Theory Pract. 2008, 16, 287–298. [Google Scholar] [CrossRef]
  69. Jung, K.; Lee, J.; Gupta, V.; Cho, G. Comparison of Bootstrap Confidence Interval Methods for GSCA Using a Monte Carlo Simulation. Front. Psychol. 2019, 10, 2215. [Google Scholar] [CrossRef] [Green Version]
  70. Hoyle, R.H.; Panter, A.T. Writing about structural equation models. RH Hoyle. In Structural Equation Modeling: Concepts, Issues, and Applications; Sage Publications: Thousand Oaks, CA, USA, 1995; pp. 158–176. [Google Scholar]
  71. MacCallum, R.C.; Browne, M.W.; Sugawara, H.M. Power analysis and determination of sample size for covariance structure modeling. Psychol. Methods 1996, 1, 130–149. [Google Scholar] [CrossRef]
  72. MacCallum, R.C.; Browne, M.W.; Cai, L. Testing differences between nested covariance structure models: Power analysis and null hypotheses. Psychol. Methods 2006, 11, 19–35. [Google Scholar] [CrossRef]
  73. Aktas, E.; Sahin, H.; Topaloglu, Z.; Oledinma, A.; Huda, A.K.S.; Irani, Z.; Sharif, A.M.; Wout, T.V.; Kamrava, M. A consumer behavioural approach to food waste. Management 2018, 31, 658–673. [Google Scholar] [CrossRef] [Green Version]
  74. Russell, S.V.; Young, C.W.; Unsworth, K.L.; Robinson, C. Bringing habits and emotions into food waste behaviour. Resour. Conserv. Recycl. 2017, 125, 107–114. [Google Scholar] [CrossRef]
Figure 1. Hypothesized research framework.
Sustainability 12 09784 g001
Figure 2. Estimated statistical model.
Sustainability 12 09784 g002
Table 1. Reliability and validity analysis of measurement model.
8MSDSKKUSFL (t)SESMCEVαCRAVE
Social norms
SN16.2180.823−0.691−0.4510.764 (17.406)0.1610.5840.2810.8830.8850.659
SN26.1000.873−0.670−0.2440.837 (19.845)0.1640.7000.228
SN36.0630.860−0.7350.4130.879 (21.420)0.1580.7720.168
SN46.0780.924−1.2993.5420.760 (17.295)0.1810.5780.359
Consumers’ attitudes
CA15.7130.813−0.334−0.4180.945 (23.949)0.1450.9100.0600.8010.8280.622
CA25.9420.752−0.310−0.5330.681 (14.512)0.1570.4630.303
CA35.8501.063−0.8260.3380.702 (15.707)0.2120.4920.572
Behavioral intentions
BI15.1131.274−0.211−0.6580.905 (22.854)0.2250.8180.2940.8730.8830.659
BI25.1251.321−0.486−0.1970.888 (22.222)0.2360.7890.366
BI35.9200.898−0.571−0.0930.602 (12.741)0.1890.3620.513
BI45.1651.219−0.284−0.2230.815 (19.374)0.2290.6640.498
Food waste behavior
FWB14.2051.6450.046−0.7910.801 (17.382)0.3380.6410.9690.8260.8260.613
FWB24.2951.643−0.044−0.6540.766 (16.332)0.3440.5871.112
FWB34.0181.701−0.052−0.8310.782 (16.850)0.3520.6111.124
Consumer plate waste
CPW16.5930.709−1.1456.1020.672 (12.921)0.1650.4510.2750.7090.7420422
CPW26.6080.741−1.1426.2430.717 (13.978)0.1700.5140.266
CPW36.4001.142−1.9518.8080.670 (13.031)0.2620.4490.716
CPW46.7480.556−0.4636.4790.522 (9.632)0.1350.2720.225
Mardia’s coefficient164.848P = 3600.832
Note: M: mean; SD: standard deviation; SK: skewness; KU: kurtosis; SFL(t): standard factor loading with t-value; SE: standard error of factor loading; SMC: squared multiple correlation; EV: error variance; α: Cronbach’s alpha; CR: construct reliability; AVE: average variance extracted; P: number of observer variables.
Table 2. Construct reliability, convergence validity, and discriminant validity.
Item ReliabilityConstruct ReliabilityConvergence ValidityDiscriminant Validity
Factor LoadingCRAVESNCABIFWBCPW
SN0.765, 0.838, 0.877, 0.7610.8850.6590.812
CA0.699, 0.672, 0.9630.8280.6220.6630.789
BI0.814, 0.602, 0.893, 0.9020.8830.6580.5870.7860.811
FWB0.804, 0.768, 0.7790.8260.6130.1420.0620.2460.783
CPW0.623, 0.770, 0.645, 0.5450.7420.4220.2650.3820.164−0.3550.649
Note: SN: social norms; CA: consumers’ attitudes; BI: behavioral intentions; FWB: food waste behavior; CPW: consumer plate waste. CR: composite reliability; AVE: average variance extracted.
Table 3. Modification indicators of structural model.
Fit indicesRequirementsResults
χ2 (Chi-square)The less the better164.381
df (Degree of freedom)The more the better130
χ2/df ratio1 < χ2/DF < 31.264
GFI (Goodness of fit index)>0.90.960
AGFI (Adjusted goodness of fit index)>0.90.953
RMSEA (Root-mean-square error of approximation)<0.080.026
SRMR (Standardized root-mean-square residual)<0.080.052
TLI (Tucker-Lewis index)>0.90.990
CFI (Comparative fit index)>0.90.991
IFI (Incremental fit index)>0.90.991
Hoelter’s N>200316.899
Gamma hat>0.90.996
McDonald’s NCI>0.90.958
Table 4. Results of hypothesis tests.
Independent Variables Dependent VariablesPath CoefficientEstimateSECRPR2
Social NormsBehavioral Intentions0.1310.2390.1032.3120.0210.618
Consumers’ AttitudesBehavioral Intentions0.6941.0740.10210.5070.000
Behavioral IntentionsFood Waste Behavior0.2110.2440.0663.7030.0000.045
Food Waste BehaviorConsumer Plate Waste−0.346−0.1150.022−5.1560.0000.120
SE: standard error; CR: critical ratio.
Table 5. Sequential mediation model of SN to CPW.
Estimate p-Value 95% Confidence Interval
Indirect Effect BC/PC BCPC
SN->BI->FWB->CPW−0.0100.045/0.094(−0.027, 0.000)(−0.004, 0.001)
Direct effect
SN->BI0.2060.097/0.093(−0.023, 0.273)(−0.022, 0.280)
BI->FWB0.2810.001/0.002(0.083, 0.327)(0.089, 0.328)
FWB->CPW−0.1160.000/0.001(−0.460, −0.250)(−0.445, −0.230)
Total effect
SN->CPW−0.0100.045/0.094(−0.027, 0.000)(−0.023, 0.001)
Serial Mediation−0.0070.043/0.094(−0.020, 0.000)(−0.017, 0.001)
BC: bias corrected; PC: percentile; SN: social norms; BI: behavioral intention; FWB: food waste behavior; CPW: consumer plate waste.
Table 6. Sequential mediation model of CA to CPW.
Estimatep-Value 95% Confidence Interval
Indirect Effect BC/PC BCPC
CA->BI->FWB->CPW−0.0100.000/0.001(−0.084, −0.027)(−0.077, −0.021)
Direct effect
CA->BI0.6940.001/0.093(0.552, 0.828)(0.552, 0.828)
BI->FWB0.2110.001/0.002(0.085, 0.327)(0.089, 0.328)
FWB->CPW−0.3460.001/0.001(−0.460, −0.250)(−0.445, −0.230)
Total effect
CA->CPW−0.0510.000/0.001(−0.084, −0.027)(−0.077, −0.021)
Serial Mediation−0.0300.000/0.001(−0.055, −0.015)(−0.049, −0.012)
BC: bias corrected; PC: percentile; CA: consumers’ attitudes; BI: behavioral intention; FWB: food waste behavior; CPW: consumer plate waste.
Publisher’s Note: MDPI stays neutral with regard to jurisdictional claims in published maps and institutional affiliations.

