Towards Sustainable Human Resources: How Generational Differences Impact Subjective Wellbeing in the Military?


General Jonas Zemaitis Military Academy of Lithuania, Silo 5a, 10322 Vilnius, Lithuania
*
Author to whom correspondence should be addressed.
Sustainability 2020, 12(23), 10016; https://0-doi-org.brum.beds.ac.uk/10.3390/su122310016
Submission received: 13 November 2020
/
Revised: 27 November 2020
/
Accepted: 27 November 2020
/
Published: 30 November 2020
(This article belongs to the Special Issue Wellbeing in Education, Career, and Work: Current Contributions from Emotional Intelligence and other Non-Cognitive Constructs to the Psychology of Sustainability)
Abstract
:The article analyzes the generational (age cohorts) effect on subjective wellbeing at work. The main aim is to reveal generational differences that lead to subjective wellbeing at work and possible discrepancies between the generations. The article contributes to the literature by creating and testing a theoretical model of subjective wellbeing at work as a composition of several dimensions that vary among generations, including physical experience, cognitive job performance, and appraisal, as well as social relationships and socio-emotional enablement at work. Using the military as an organization where daily routine creates similar conditions for different generations, we surveyed 890 army professionals representing three different generations: Gen Y, Gen X, and Gen Z. A structural equation modelling (SEM) technique is used to test the research model. The results support the hypothesis that generation has a strong moderating impact on the components of subjective wellbeing at work. Social relationship, as a socio-emotional experience, is the most important component of wellbeing at work for Gen Z, while socio-emotional enablement plays a central role in subjective wellbeing at work for Gen X and Gen Y.
1. Introduction
Subjective wellbeing at work indicates the level of sustainability of organizational human resources and leads to organizational performance in a long run. Hence subjective wellbeing at work is a complex phenomenon that is defined as the sum of individual’s attitude towards various job-related factors. It defines an overall quality of working life. Over the last 40 years, theory and research on subjective wellbeing at work have grown exponentially, and this shows the growing importance of this complex and multidimensional concept of organizational human resource management. The development of theory over these decades has made considerable progress. For example, research has demonstrated the impact of subjective wellbeing on staff turnover [1,2], organizational commitment [2,3,4,5,6], and organizational performance [5,6,7]. Although there appears to be significant progress, one important issue in measuring subjective wellbeing remains open: it is not known whether there is a significant difference between the determinants of subjective wellbeing at work that vary among age cohorts—generations. This issue is important for the sustainable management of human resources, as organizations are operating in a historically unique situation “when four generations were in the workplace at one time” [8] (p. 2). This situation creates new challenges and new opportunities in human resource management and raises the question whether different generations perceive wellbeing at work differently. As a new generation is entering the labour market, interest in cross-generational research increases. This interest in support assumes that generations differ in their goals and expectations, so their attitudes toward work also differ [9]. This assumption dominates the popular press, but there is a lack of reliable empirical research on the subject. Most previous studies have investigated generational differences in work attitudes and values and ignored wellbeing at work as an overall perception of one’s job.
In attempt to fill this research gap, this study examines the moderating impact of generation on subjective wellbeing at work. More specifically, the present study aims to reveal generational differences that lead to subjective wellbeing at work and possible discrepancies between the generations. We theorize that subjective wellbeing at work is a multidimensional phenomenon, the dimensions of which are determined by generation. The results of this study not only provide an understanding of generational differences and contribute to the literature on wellbeing at work, but also provide insights into how well-being at work can be enhanced across generations. These results are important for leaders at various levels in organizations who strive for high sustainability of their diverse organization’s human resources. The study is conducted in the military; therefore, it can primarily serve to create higher wellbeing for different generation in organizations with specific working environment (e.g., where rotation and other relocations takes place).
To examine generational effects on the dimensional composition of subjective wellbeing, we carried out a keyword search in the database and identified the most recurring dimensions determining subjective wellbeing at work. Accordingly, we contributed to the literature by creating and testing a theoretical model of subjective wellbeing at work as a composition of several dimensions: (1) physical experience (referring to perceived physical work environment), (2) cognitive job performance (referring to perceived job performance), (3) cognitive performance appraisal (referring to perceived fairness of appraisal), (4) social relationships at work, and (5) socio-emotional enablement at work.
We start with developing a hypothesis and designing our theoretical model. Then we conduct research in the military to test our model and identify how dimensions of subjective wellbeing at work vary in different groups of generations. Lastly, we present the results of model testing and interpret them in the light of previous studies.
2. Materials and Methods
2.1. Developing Hypothesis
Each generation has different work-related attitudes due to a different social [10] and sub-cultural [11] identity. It is important to identify these differences as Gen Y (born 1980–1994) is now gradually replacing Gen X (born 1964–1980) in management positions, and new Gen Z (born from 1995) is gradually become adults and start their first jobs after schools and universities [2]. At the same time, in ageing societies, the oldest generation, called the Baby Boomers (born 1946–1979) is still active and continues its professional life. Previous studies have already proved that generation determines some elements of wellbeing at work. For example, Gen Y can easily attribute their emotions to their job [12] and are less satisfied with communicational environment at work than other generations [13], whereas Gen Z enters a workplace not as prepared for the realities as past generations [14] and is more prone to anxiety and depression [2,15,16], which may have a negative impact on their subjective wellbeing. Notably, several studies have shown that each generation reports lower subjective wellbeing at work than their predecessors [17]. At the same time, research results not only support generational differences, but also rebut them. For example, the survey of sixty-four European transport enterprises by Kampf et al. [18] did not confirm any differences among generations in the perception of corporate culture and their components. Furthermore, research by Zabel et al. [19] showed no effect of generational cohort on protestant work ethic endorsement. These findings suggest that testing different dimensions of wellbeing yields different research results, and, therefore, subjective wellbeing at work has to be understood as a multidimensional concept and tested by considering the moderating impact of generation. Accordingly, we develop the first hypotheses:
Hypothesis 1 (H1).
The dimensions of subjective wellbeing at work are determined by generation.
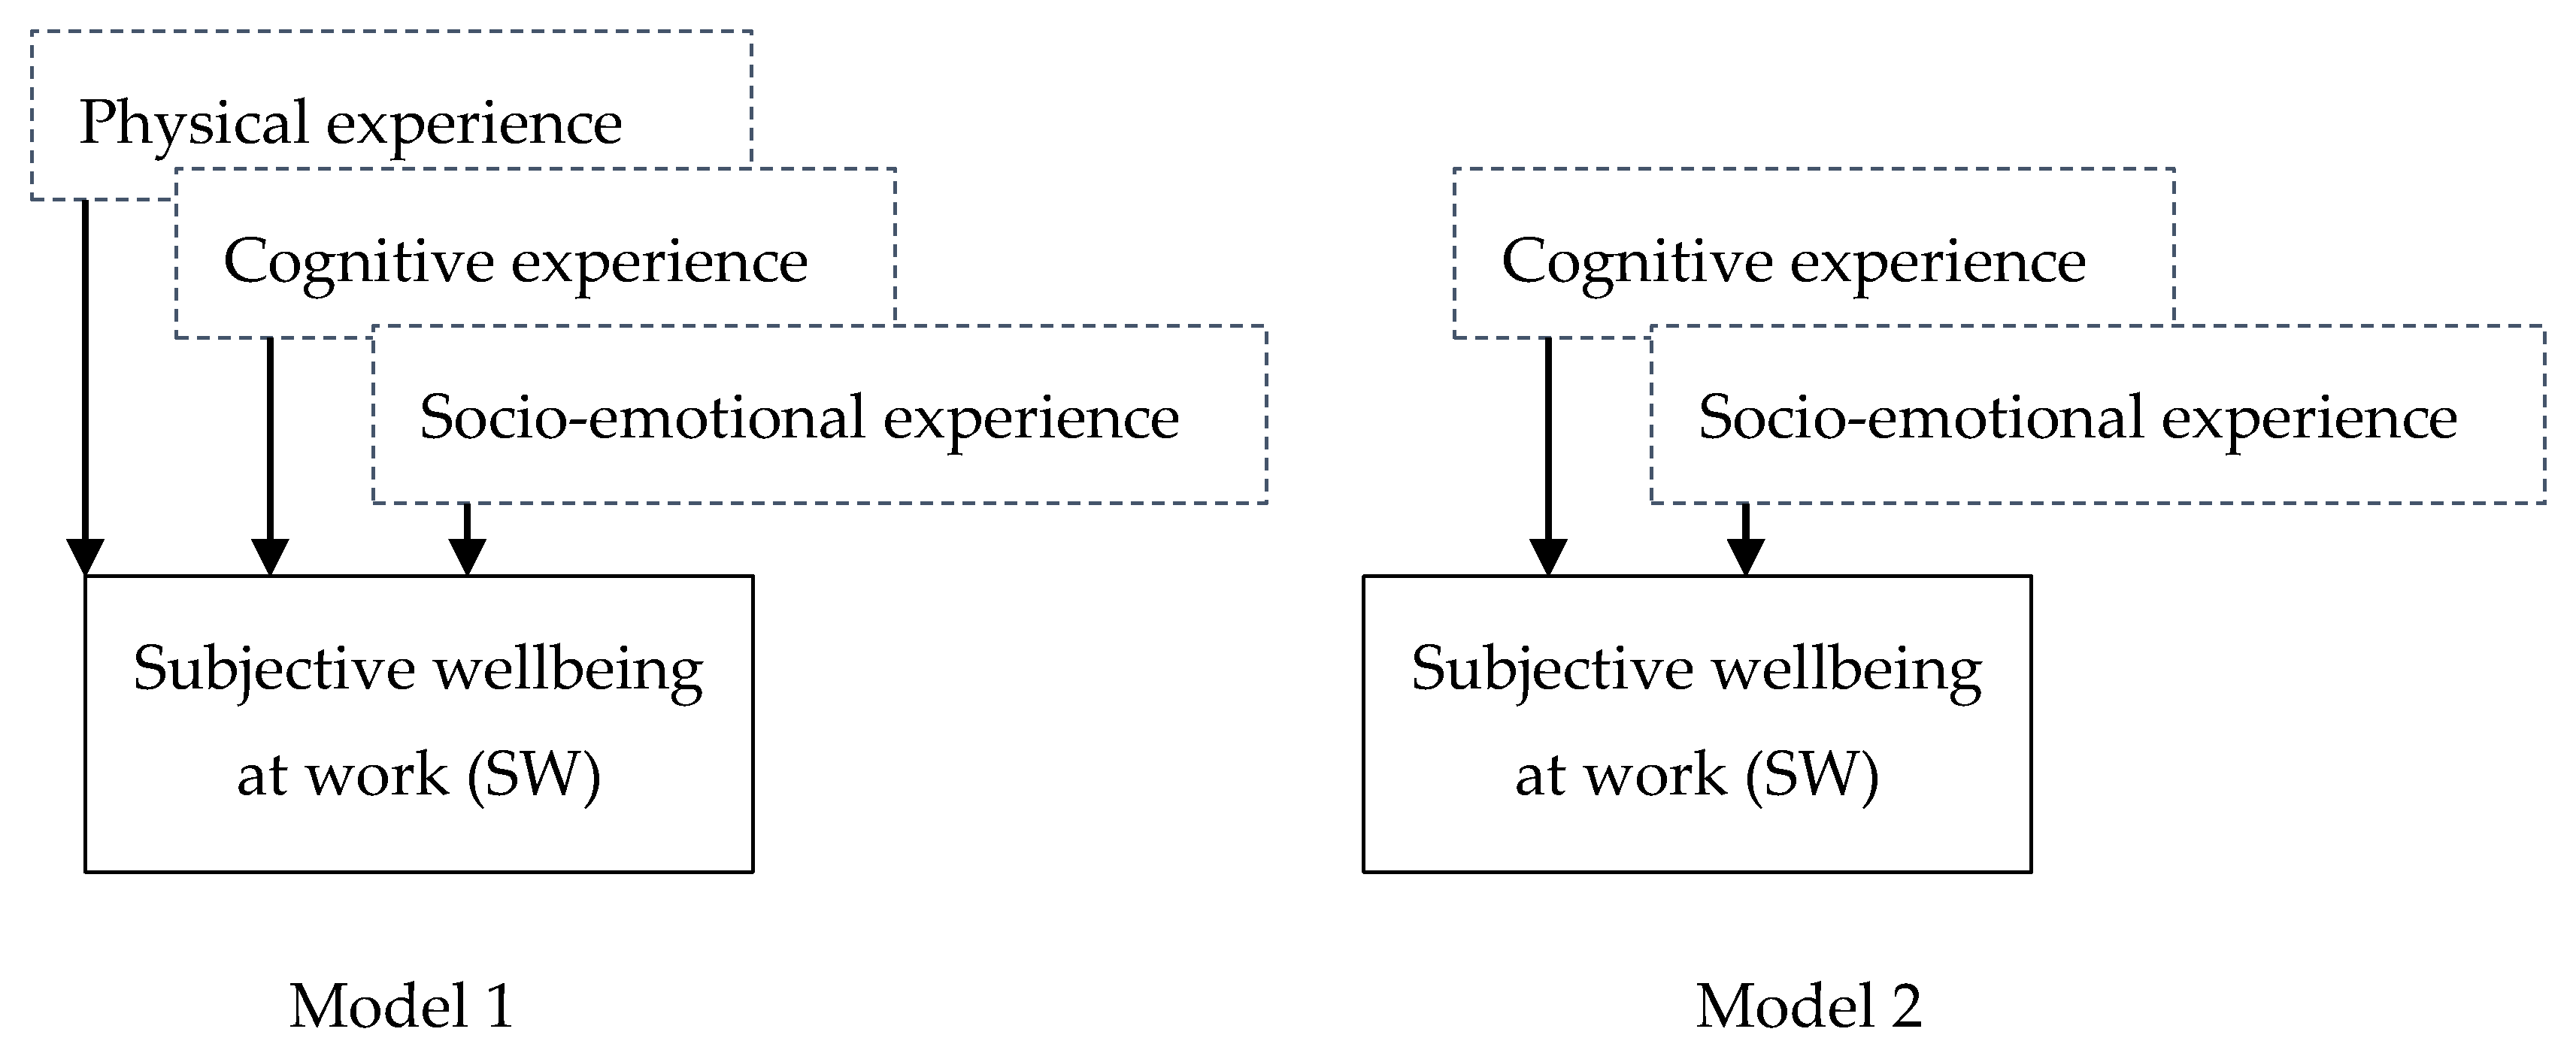
To raise further hypotheses, we classified a theoretical framework existing in the literature and identified three mainstems in subjective wellbeing at work: subjective health at work, cognitive job satisfaction, and socio-emotional relationships at work. At the beginning we performed a keyword search on the database. It should be noted that subjective wellbeing at work is still a recent area of research, and a keyword search in the Web of Science database offers less than 150 scientific articles. Significantly more developed areas of research related to subjective wellbeing are job satisfaction (more than 36,000 scientific articles) and occupational health (more than 58,000 scientific articles). Subjective wellbeing at work is a new concept that leads to a new perception of the work-related environment [20]. One of the earliest definitions of subjective wellbeing at work emphasizes the overall employee’s experience of his/her work relationships and performance [21]. Subsequent definitions continue to be centered on performance and relationships. As noted by Pagán-Castaño [20,21] in his literature meta-analysis, wellbeing at work is presented in the literature as a three-dimensional approach. The first mainstream in the literature is related to health, both physical and mental, and includes a series of studies in occupational health (see Cooper [22] for the review of 280 academic articles). The second mainstream deals with attitudes towards job performance and includes professional satisfaction of cognitive job elements. The third mainstream deals with relationships and indicates socio-emotional wellbeing at work, and includes theories such as leader–member exchange [23,24,25] and attachment theory [26]. From the perspective of the science of psychology, the employee’s subjective wellbeing can be described as an experience throughout a life course [27]. Accordingly, we can define subjective wellbeing at work as physical, cognitive, and socio-emotional experiences throughout a working life course. Based on this analysis, we developed two hypothetical models (Figure 1). Model 1 represents a holistic approach toward subjective wellbeing at work and connects all three types of experience, while Model 2 reflects only cognitive and socio-emotional experiences. The later follows the tradition of psychology and other social sciences and does not take into account the effects of the perceived physical work environment. For example, Cote and Miners [28] empirically test an impact of emotional and cognitive intelligence on job performance, while Gander et al. [29] check for placebo-effect of emotional and cognitive components in their human happiness studies.
As for the notion of physical experience, that refers to perceived physical work environment; there is a broad research field on occupational safety and health. In addition to occupational safety and health, it also includes occupational ergonomics and more advanced applied occupational ergonomics [30,31]. This area has long been addressed without analyzing generational differences or emphasizing the physical capabilities and health of older workers [32]. In recent years, the number of studies in the field increased because of the COVID-19 pandemic and demand for a risk-free work environment for different age groups [33]. Recent research in the field of workplace physical environment presents different generational approaches to both infection-related risks [34] and risks related to new forms of work [35]. Research results indicate that there are significant generational differences in perception and experience related to the physical work environment. Thus, we can hypothesize that:
Hypothesis 2 (H2).
Physical experience as an element of subjective wellbeing at work is of different importance for generations.
The second dimension of employee wellbeing is related to cognitive experience or, as Fisher names it, “cognitive judgments of work satisfaction” [36] (p. 1). Based on a social cognitive theory [37] and its application in wellbeing studies [38], employees are active agents in promoting their own wellbeing. For example, an employee consciously seeks meaningfulness in work and pursues meaningful personal goals, creates a sustainable work environment around himself/herself, or engages in efficacy-building and uses his/her social resources. Accordingly, cognitive wellbeing at work is associated with cognitive job performance and (fair) appraisal of the performance. Developing the latter, Lam et al. [39] argue that performance appraisal is one of the strongest determinants of positive attitude towards employees’ job. Job performance appraisal could be measured by salary growth, career opportunities, interesting tasks, etc., but the focus is on whether the assessment is transparent and timely.
It should be noted that the complex domain of job performance depends not only on the remuneration system of the organization, but also on inherent expectations of generation. For example, Gen Y is more responsive to performance appraisal (both extrinsic and intrinsic) than previous generations because of their exceptional performance orientation [40]. Drawing from prior analysis by Cleveland et al. [41], the age component and lifespan approaches can enrich our understanding of the inter-linkage between job satisfaction and job performance and their appraisal, as well as subjective wellbeing at work. Based on these considerations, the following hypothesis is formulated:
Hypothesis 3 (H3).
Cognitive job performance as an element of subjective wellbeing at work is of different importance for generations.
Hypothesis 4 (H4).
Cognitive performance appraisal as an element of subjective wellbeing at work is of different importance for generations.
The next dimension of subjective wellbeing at work is related to socio-emotional experience. This is probably the most complex dimension, because it involves social relationships. On the one hand, it depends on a person’s social relationship with other employees, and on the other hand on the institutional support that leads to socio-emotional engagement. Social relationships among employees of different generations is not a naturally emerging connection. According to Chaudhuri and Ghosh [42], an organization has to apply appropriate strategies to create this connection, e.g., the organization must maintain the engagement of the older generation and the commitment of the younger one. Moreover, the skills and competences approach is no longer enough to hire a new generation, as these may be emulated by an artificial system in the near future. Meanwhile, “social skills, interpersonal warmth, empathy, compassion and a ‘personal touch’” [43] (p. 96) are what create emotional wellbeing at work.
Socio-emotional enablement varies from generation to generation. Using the classical Utrecht Work Engagement Scale (UWES), Hoole and Bonnema [44] conducted cross-sectional quantitative studies and found that each subsequent generation was characterized by declining engagement in work; therefore, its active enablement is becoming increasingly important. When assessing socio-emotional experience at work as a subjective factor, it is important not only to enable but also to meet individual socio-emotional needs. These include esteem needs and needs for emotional support in coping with work stressors, etc. [14]. These needs are likely to be different for generations, because, for example, Gen Z is more prone to anxiety and depression [45], which may increase their need for social and emotional support and may negatively affect their subjective socio-emotional experience, while Gen Y is more oriented toward performance, and therefore their needs are based on the need for recognition (X). However, a large-scale study of socio-emotional skills throughout the life cycle and generations shows the opposite result [46]. The authors argue that the magnitude of generational and social emotional thresholds is smaller over time than the magnitude of other occupational factors and income. Having different research results, we develop two additional hypotheses that need to be tested:
Hypothesis 5 (H5).
Social relationships at work as an element of subjective wellbeing at work is of different importance for generations.
Hypothesis 6 (H6).
Socio-emotional enablement at work as an element of subjective wellbeing at work is of different importance for generations.
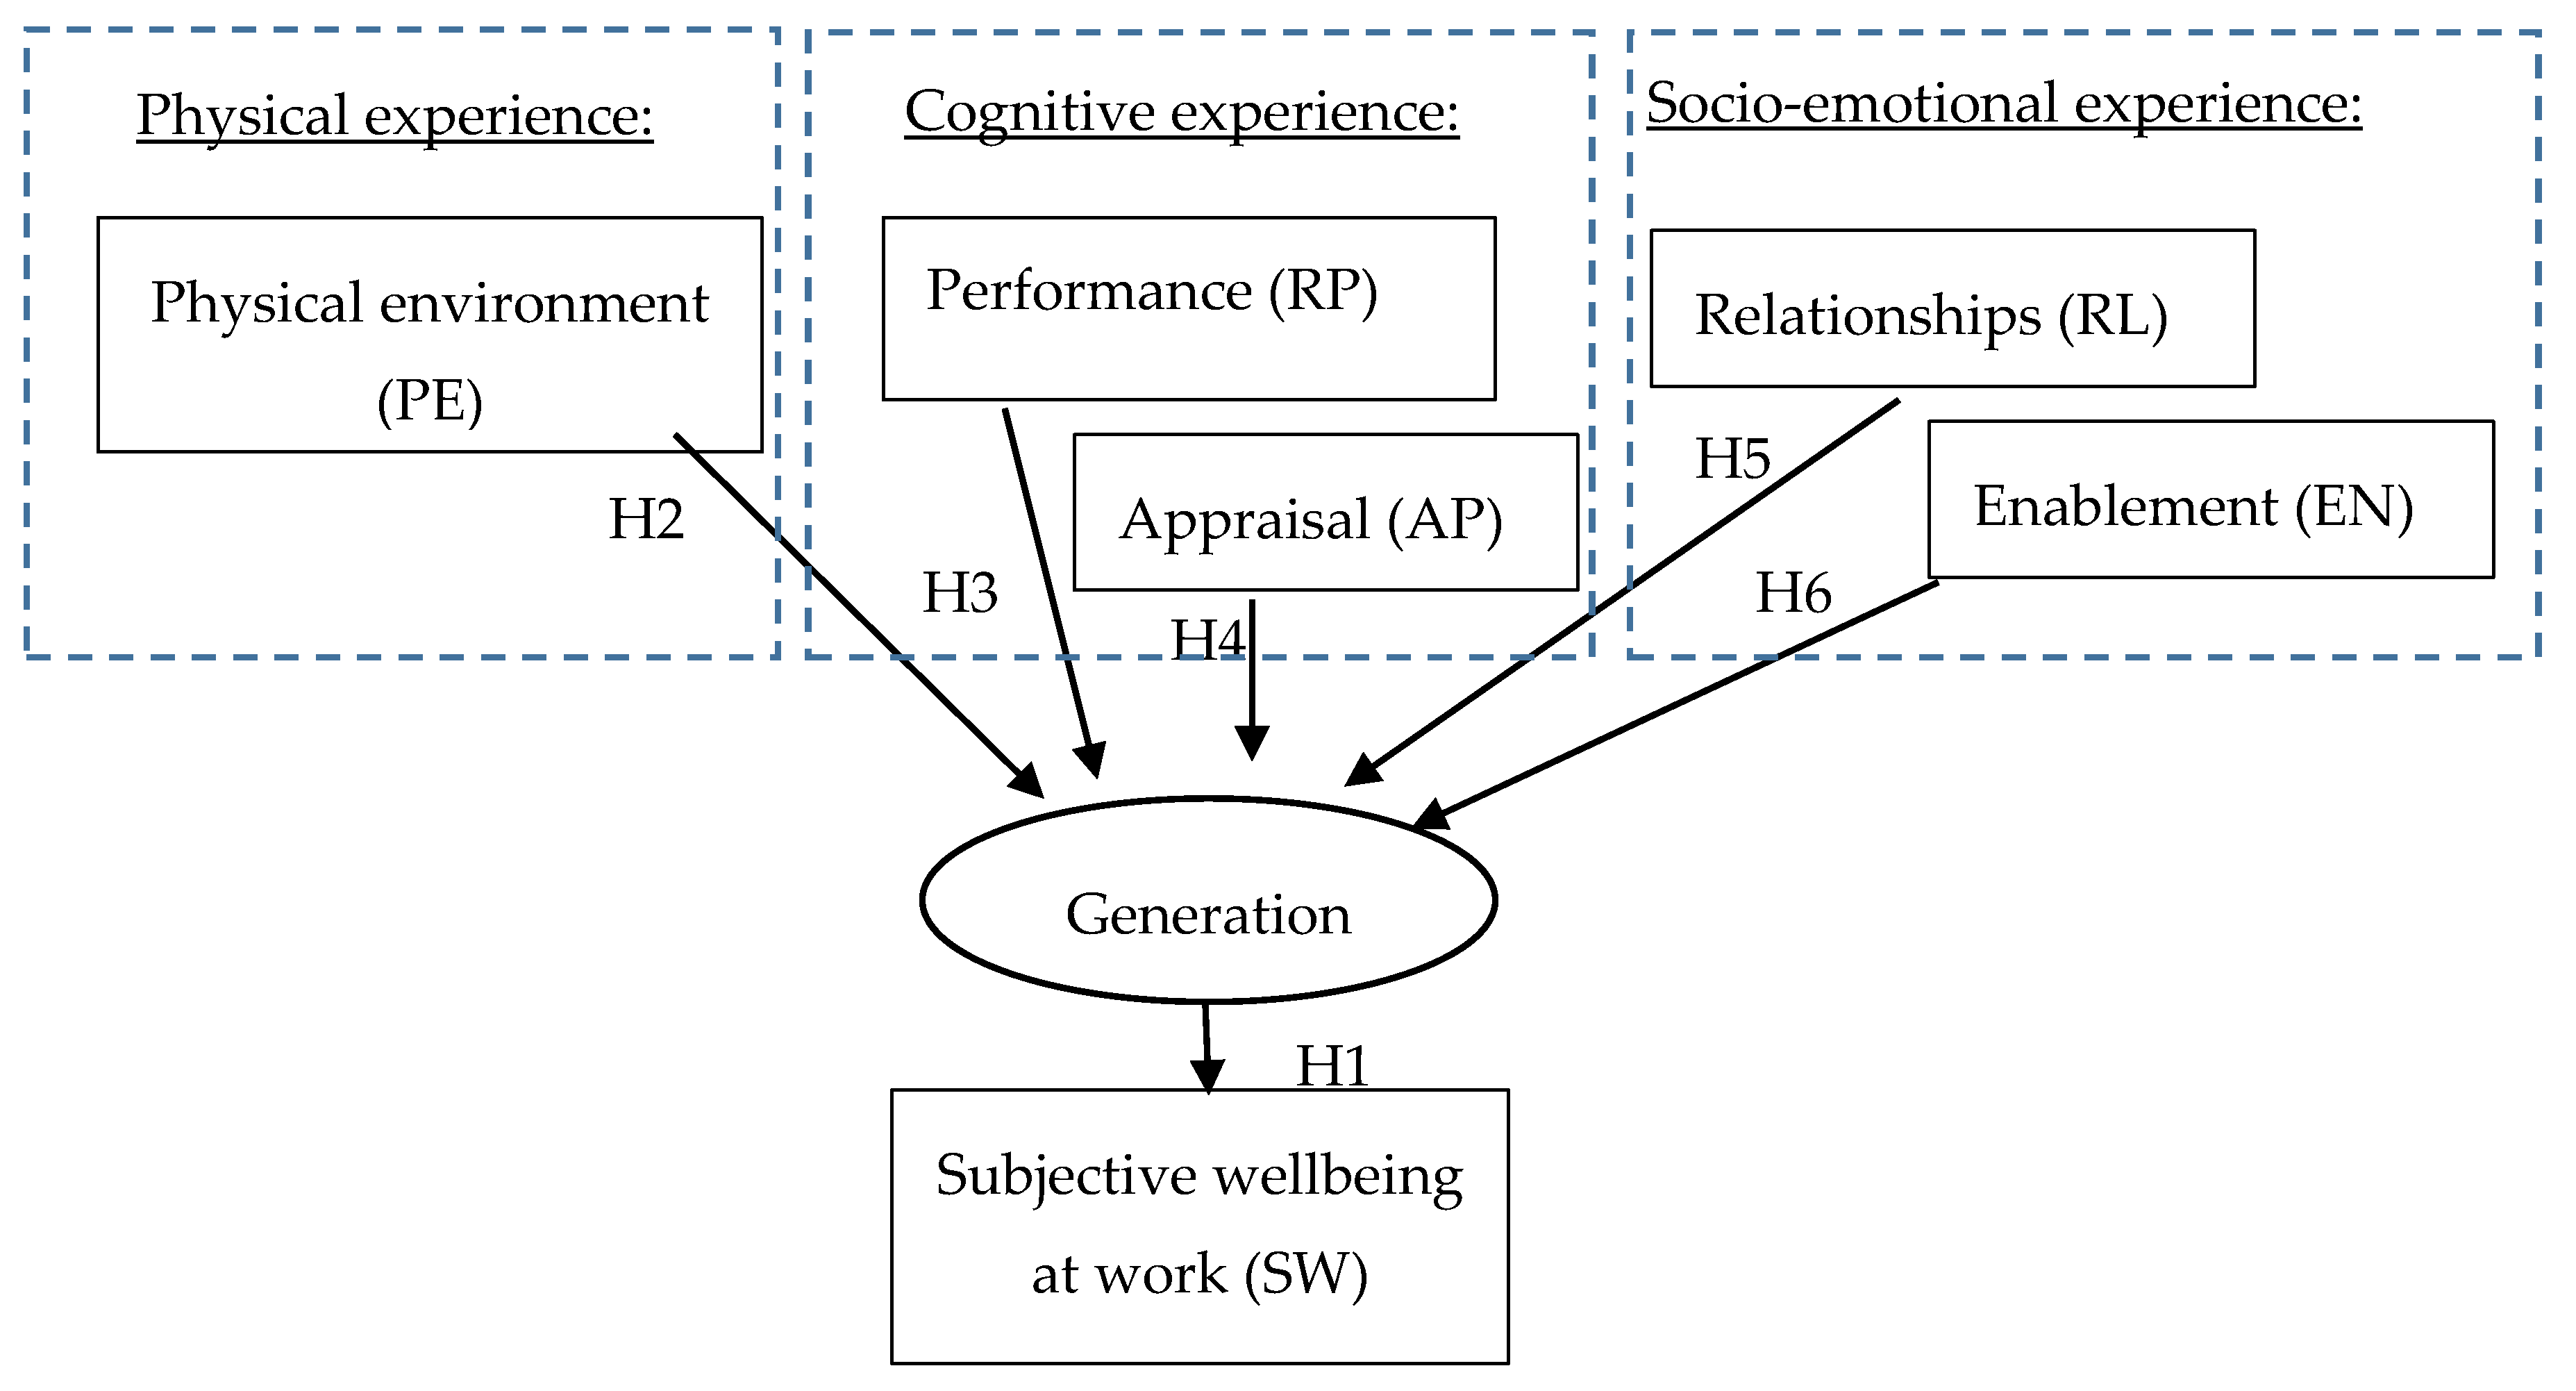
Based on the hypotheses raised, we constructed a theoretical model that explains subjective wellbeing at work through five variables: (1) PE—physical experience (referring to the perceived physical work environment), (2) RP—cognitive job performance (referring to perceived job performance), (3) AP—cognitive performance appraisal (referring to perceived fairness of appraisal), (4) RL—social relationships at work, and (5) EN—socio-emotional enablement at work (Figure 2).
2.2. Sample and Data Collection
The sample of the study consisted of 890 professional military service soldiers. Professional military service is favorable in organization studies, because (a) the number of representatives of each generation is large, geographically distributed throughout the country, and therefore highly representative, and (b) the army and its routine create similar conditions for different generations. The army routine can be illustrated in a typical military unit with a firefighter environment [47], where work is done according to general standing operating procedures as well as localized routine orders [48]. In our research, the majority of respondents are men (94.6%); 37.8% of respondents are aged 25 or younger (Gen Z), 48.2% of respondents aged 26–40 (Gen Y), and 14.0% of respondents aged 41–56 (Gen X). Subjects older than 56 years were excluded from the study, because their stratum was too small for statistical analysis. In the initial analysis, we found that other demographic characteristics do not affect the distribution of the main data. This is most likely because soldiers constantly experience military training-related environmental disturbance [49] and periodic deployments [50]. The demographic information according age and service length of the respondents is presented in detail in Table 1.
The data are collected using an annual omnibus survey carried out in the Lithuanian Armed Forces in early spring 2020. Military units and soldiers are selected using random sampling to represent the general population of enlisted military service personnel (enlisted is any rank below that of a commissioned officer) in Lithuanian Armed Forces. Research is performed using traditional paper questionnaires presented in the Lithuanian language. Study participants know the purpose and importance of the study; the anonymity of the respondents is maintained in the study.
2.3. Measures
The questionnaire is based on the 5-point Likert scale. In total, there are 29 grouped statements related to subjective wellbeing at work (service). Physical experience (PE) is made up of seven statements asking respondents to evaluate their physical environments, such as “environment to maintain physical fitness”, “living conditions during exercise”, etc. Considering the fact that a career in the military reflects “better rank, higher salary, and more status” [51] (p. 238) and is an ultimate manifestation of performance [52,53], cognitive job performance (RP) is measured using five statements concerning the impact of “personal effort”, “professional competence”, etc., on military career. Cognitive performance appraisal (AP) is measured using seven out of 20 statements for performance appraisal [54,55] such as satisfaction with the “performance feedback”, “recognition of individual performance”, etc. Social relationships (RL) are measured using three statements about satisfaction with relationships such as with “direct commanders”, “senior commanders”, and “other soldiers”. The last endogenous variable is socio-emotional enablement (EN). It is based on JCQ social support factors [56] and is composed of statements applying to military service. The respondents are asked to indicate whether they agree or disagree with seven statements such as “when you take the initiative, you feel personal support and approval of the commander”, etc. Subjective wellbeing at work (SW) is an endogenous (dependent) variable in our research.
The five exogenous (independent) variables and their reliability (the Cronbach’s alpha—CA coefficients) are presented in Table 2. All values of CA are above 0.7, indicating an acceptable level of reliability of the questionnaire [57,58,59]. The calculated CA coefficients for all questions are presented in Table 2.
2.4. Method for Data Analysis
Structural equation modelling (SEM) technique was used to test the research model. The modelling was not only based on path analysis, factor analysis, and linear regression, but it also analyzed latent constructs and measurable variables of the theoretical causal model [60]. The SEM tested causal relationships between six constructs that all together contain 29 exogenous (independent) variables and one endogenous (dependent) variable.
Firstly, we tested the measurement for convergent validity and verified our structural (theoretical) model. For this purpose, we conducted confirmatory factor analysis (CFA) of scales and estimation of fit using IBM SPSS AMOS 26.0v. CFA was conducted to estimate factor loading of all five constructs. Thus, we tested how factor loading values followed the rule, which explained that path coefficient measurement had to be above 0.5 (see Hair et al. [60]). The goodness-of-fit of the measurement model provided specific evidence of construct validity. For this purpose, several fit indices were selected: a χ2 test, the ratio of χ2 to degree of freedom, the root mean square error of approximation (RMSEA) [60], the non-normed fit index (NNFI), the incremental fit index (IFI), and the comparative fit index (CFI) [61]. When conducting the comparison between the non-nested competing models, three information fit indices were also included: the Akaike information criterion (AIC), the Browne–Cudeck criterion (BCC) in order to facilitate model comparison (when comparing two models the one with the smaller BCC is preferred), and the expected cross-validation index (ECVI).
Secondly, we divided the full sample into three groups by age cohorts (generations) and assessed construct’s convergent validity for each sample (generation) separately. Following CFA methodology [62], construct convergent validity in this study was assessed by factor loading values, Cronbach’s Alpha, composite reliability (CR), and average variance extracted (AVE) [63,64]. In this way, we assessed the stability of the theoretical model by evaluating the construct’s convergent validity for each sample.
Thirdly, we assessed discriminant validity. Confidence intervals were used to reveal evidence of discriminant validity between two constructs [62,65]. Bootstrap was used for estimating a confidence interval on a correlation coefficient at a 95% level in SEM [66]. IBM SPSS AMOS 26.0v was used for bootstrapping, as it provides two methods for estimating confidence intervals: the bias-corrected percentile method and the percentile method. The null hypothesis for discriminant validity between two constructs is rejected if the confidence interval does not include the value of one [67]. Otherwise, the null hypothesis has to be accepted, and evidence for discriminant validity is not proved.
Fourth, following the recommendations [59,60,61,63,64,68], the model was tested for its goodness-of-fit. A good model fit indicates that the constructed model matrix is close to the sample matrix [57]. To prove the goodness-of-fit, several indices were selected: a χ2 test, the ratio of χ2 to degree of freedom, the root mean square error of approximation (RMSEA), the non-normed fit index (NNFI), the incremental fit index (IFI), and the comparative fit index (CFI). When conducting the comparison between the non-nested competing models, three information fit indices were also included: the Akaike information criterion (AIC), the Browne–Cudeck criterion (BCC), and the expected cross-validation index (ECVI). Finally, models are assessed for construct convergent validity for all three generations.
3. Results
3.1. Measurement and Structural Model Analysis Verification of Convergent Validity
CFA analysis was applied to all five constructs: PE (physical experience), RP (cognitive job performance), AP (cognitive performance appraisal), RL (social relationships at work), and EN (socio-emotional enablement at work). All five constructs showed levels of significance p < 0.01, which varied at different intervals: PE ranged from 0.550 to 0.698, accordingly, RL from 0.701 to 0.783, RP from 0.643 to 0.766, AP from 0.933 to 0.969, and EN from 0.585 to 0.745. Composite reliability (CR) values ranged between 0.739 and 0.976, and the square root of average variance extracted (AVE) was between 0.640 and 0.923, as presented in Table 3. Following the data requirements for SEM analysis [59,60,64], all main indicators for model fit were 0.5 or higher: factor loadings were above 0.5; composite reliability (CR) for each construct was above 0.6; square root of average variance extracted (AVE) was above 0.5; and the square of the multiple correlation coefficient (SMC) mostly was above 0.5. In summary, all five constructs showed an indication of convergent validity.
Additionally, the sample data were examined for issues of normality using kurtosis and skewness. The kurtosis values for this sample are below 7, indicating non-violation of a normal distribution [69], and for skewness, values are below 2, indicating normal distribution [69]. Furthermore, SEM was used to examine whether the hypothesized model is consistent with the collected sample data [70]. Missing data is handled with full information maximum likelihood (FIML) estimations [71] and is tested prior to fitting the hypothesized models by using Little’s MCAR test. The amount of overall missing data for all study variables was small (1.10%) and ranged from 0% to 4% missing responses per any given individual indicator within a measure, indicating that there is no systematic pattern to the missing data [72]. Finally, Little’s MCAR test was non-significant (Chi-Square = 488.783, DF = 107, Sig. = 0.097), indicating the data were missing completely at random. 3.2. Discriminant Validity Assessment.
Two models were created to test discriminant validity. Model 1 represents our hypothesized model and includes all five constructs of physical, cognitive, and socio-emotional experiences at work. Model 2 represents cognitive and socio-emotional experiences at work and follows a narrower paradigm of well-being at work (Figure 1).
Assessing discriminant validity, we tested whether two constructs (Model 1 and Model 2) differ statistically for all generations. For this purpose, we used the bootstrap to construct confidence intervals. In conducting bootstrapping procedures, the computer program was set to re-sample 1000 times (minimum requirement is 250 times [66]) in order to assess the confidence interval of a standardized correlation at a 95% confidence level. The results of the bias-corrected percentile method estimation are shown in the Table 4. Following the rule, the “confidence interval between two constructs does not include 1” [67]. As we can see in Table 4, neither of the confidence intervals in the standardized correlation includes 1; thus, discriminant validity between constructs is achieved.
3.2. Overall Fit for Models
To prove the goodness-of-fit, Model 1 and Model 2 were tested. According to the recommended values for most indicators, Model 2 fits better than Model 1 (Table 5). Following the rule—the lower the value, calculated values for χ2, ECVI, AIC, and BCC for Model 2 show better model fit compared to Model 1. It should be noted that when analyzing other indicators (TLI, IFI, CFI, and PNFI), there is not much difference between the models’ fit. For example, ΔCFI (between lower and upper) is 0.020 and thus does not exceed the critical value of 0.020 [73]) to indicate that one of these models has better fit than the another. Most of the fit indices meet the requirements for SEM analysis (see Baumgartner and Homburg [74], and Doll, Xia, and Torkzadeh [75]): the RMSEA value is acceptable if above 0.08, and for all models this value is well below 0.08. Consequently, both of these models have good to great goodness-of-fit according to the remediations provided by Hair [60].
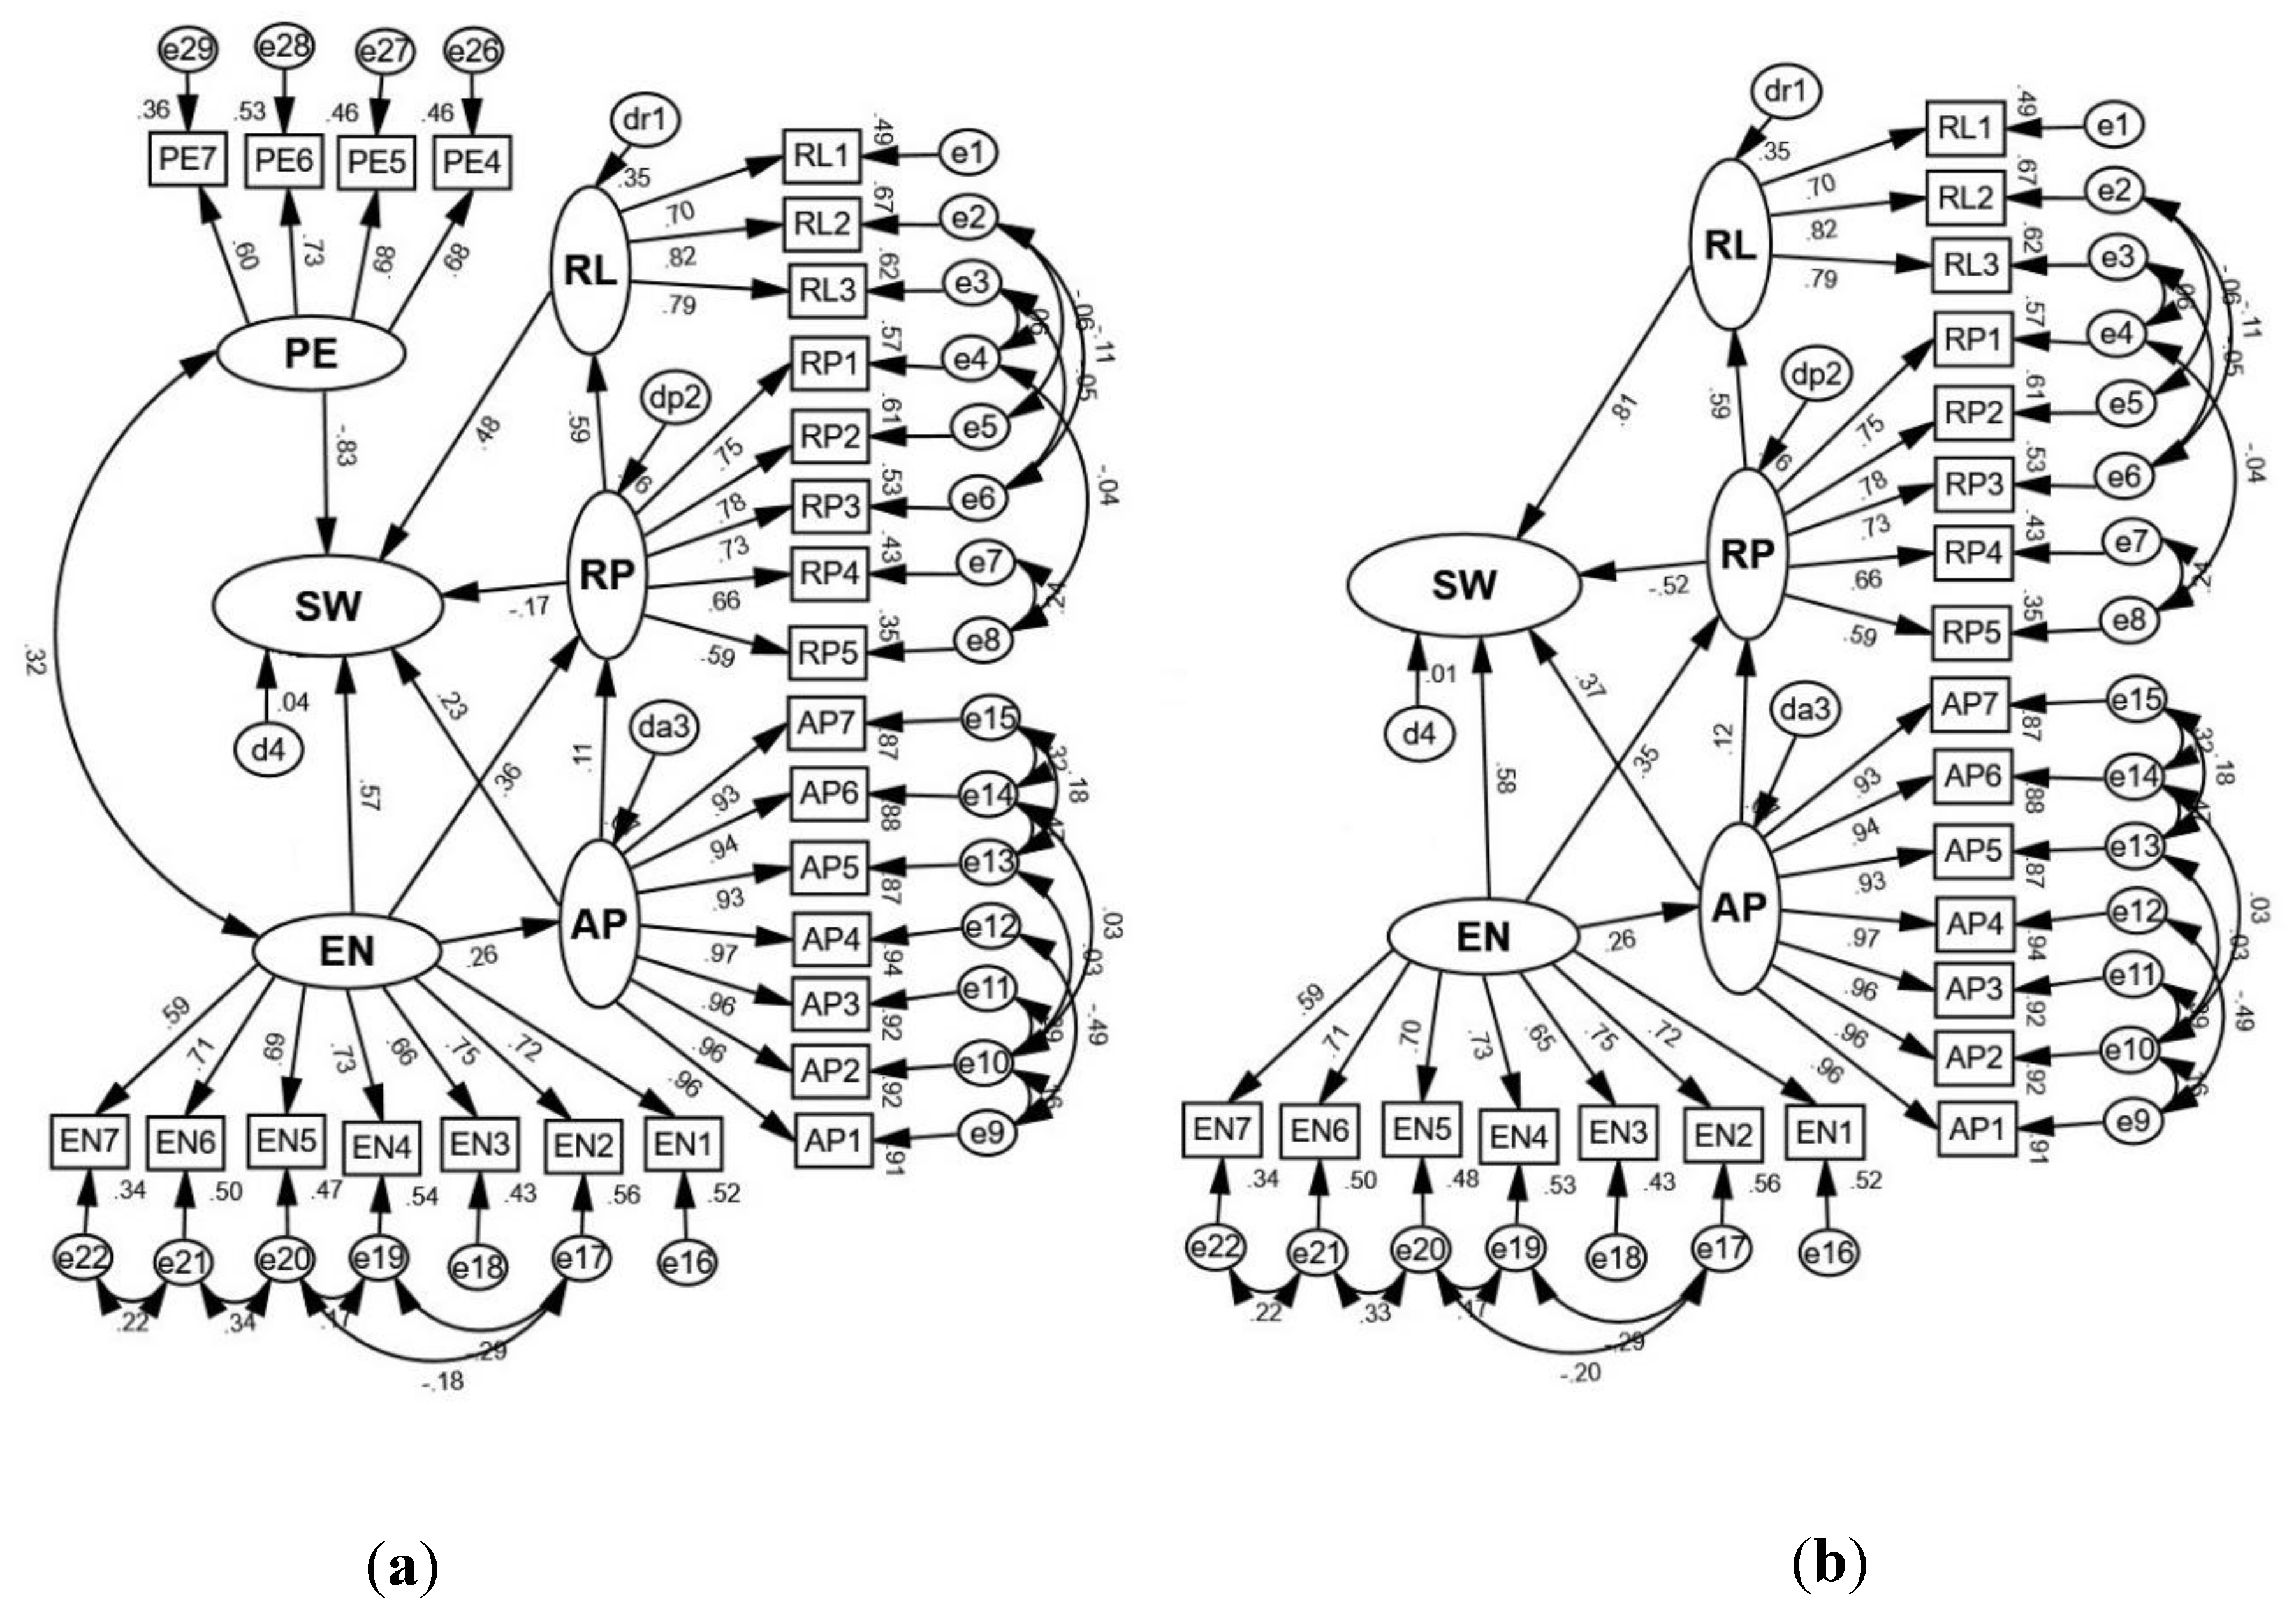
Next, we analyzed models using standardized regression measurements. The models differ substantially (Figure 3): in Model 1, the physical experience (PE) has a negative effect on subjective wellbeing at work (SW), as regression coefficient is −0.83. This means that physical experience does not contribute to subjective wellbeing at work and must therefore be eliminated from the theoretical model. In Model 2, there is no negative regression coefficient that is approaching 1. In the following analysis, we relied only on Model 2 and continued to test it by breaking down the sample by generations. By excluding physical experience (PE) from our theoretical model (Figure 1), we confirm H3 and claim that subjective wellbeing at work is compound of cognitive and socio-emotional experiences. Simultaneously, we refute H2 that subjective wellbeing at work is compound of all three (physical, cognitive, and socio-emotional) experiences and exclude H4 form future examination.
3.3. Model 2 Construct Convergent Validity Assessment for Three Generations
All data were divided into three samples to examine the moderating impact of generation on subjective wellbeing at work. Samples were created according to respondents’ age. Model Z presents the sample of respondents 25 or younger (Gen Z). Accordingly, Model Y is the respondents from 26 to 40 years old (Gen Y generation), and Model X is the respondents from 41 to 55 years old (Gen X).
The square root for AVE of each construct is much greater than its correlation with any other factor, and all AVE by the rule [76] are greater than 0.5, ranging from 0.522 to 0.961 (Table 6). The constructs’ Cronbach’s Alpha and CR are above the recommended minimum of 0.70 [73]. In this respect, the theoretical model is stable across samples and could be analyzed in more detail.
3.4. Path Coefficients for Generations
Hypothesis 1 suggests that the dimensions of subjective wellbeing at work are determined by generation. To test his hypothesis, we analyzed path coefficients between constructs for each model separately. First, we started with Model 2 (all generations together, 100% of collected data). The regression coefficients between five constructs shows very strong statistical significance (< 0.01). It is also necessary to point out the connection between RL (social relationship at work) and RP (cognitive job performance), where regression coefficient is 0.589 and constructs show very strong statistical significance (<0.01). However, deeper analysis reveals that only the regression coefficients between constructs SW (subjective wellbeing at work) and EN (socio-emotional enablement at work) as well as SW (subjective wellbeing at work) and RL (social relationships at work) were statistically significant at 5%. In other words, the regression weight for EN and RL in the prediction of SW is significantly different from zero at the 0.05 level (two-tailed) (see EN→SW, p = 0.044; and RL→SW, p = 0.034 in Table 7).
3.4.1. Subjective Wellbeing for GenX
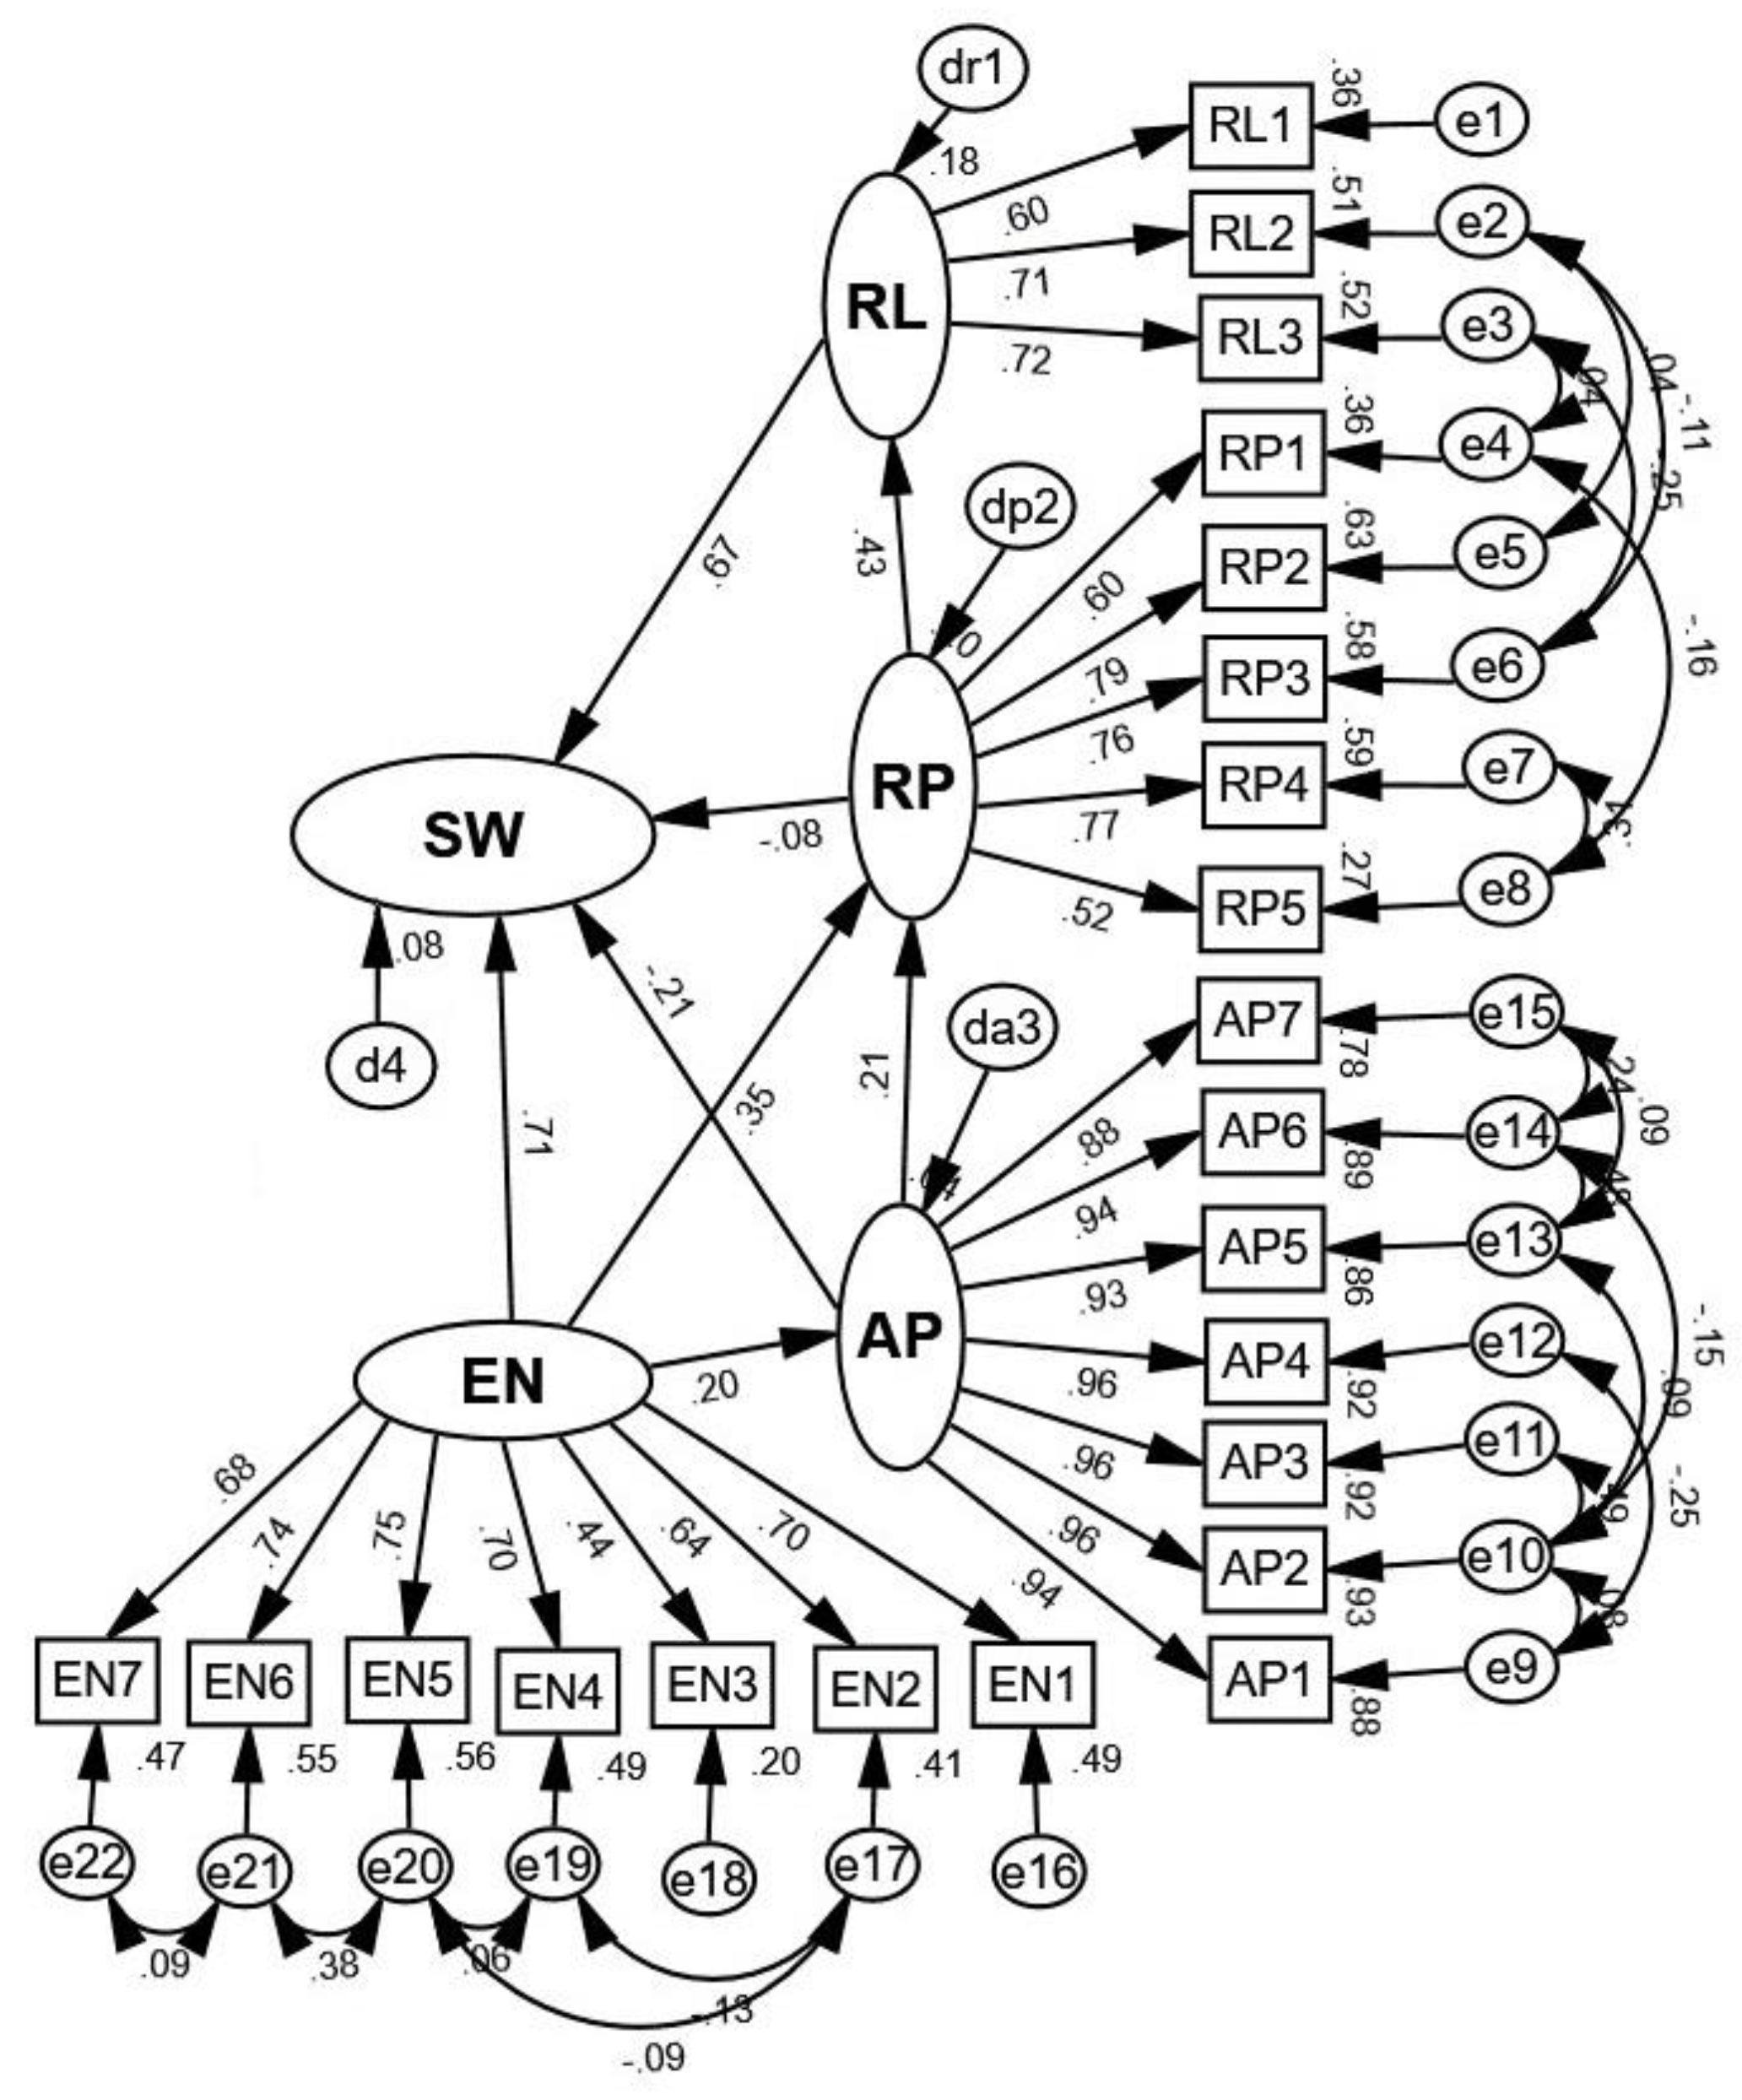
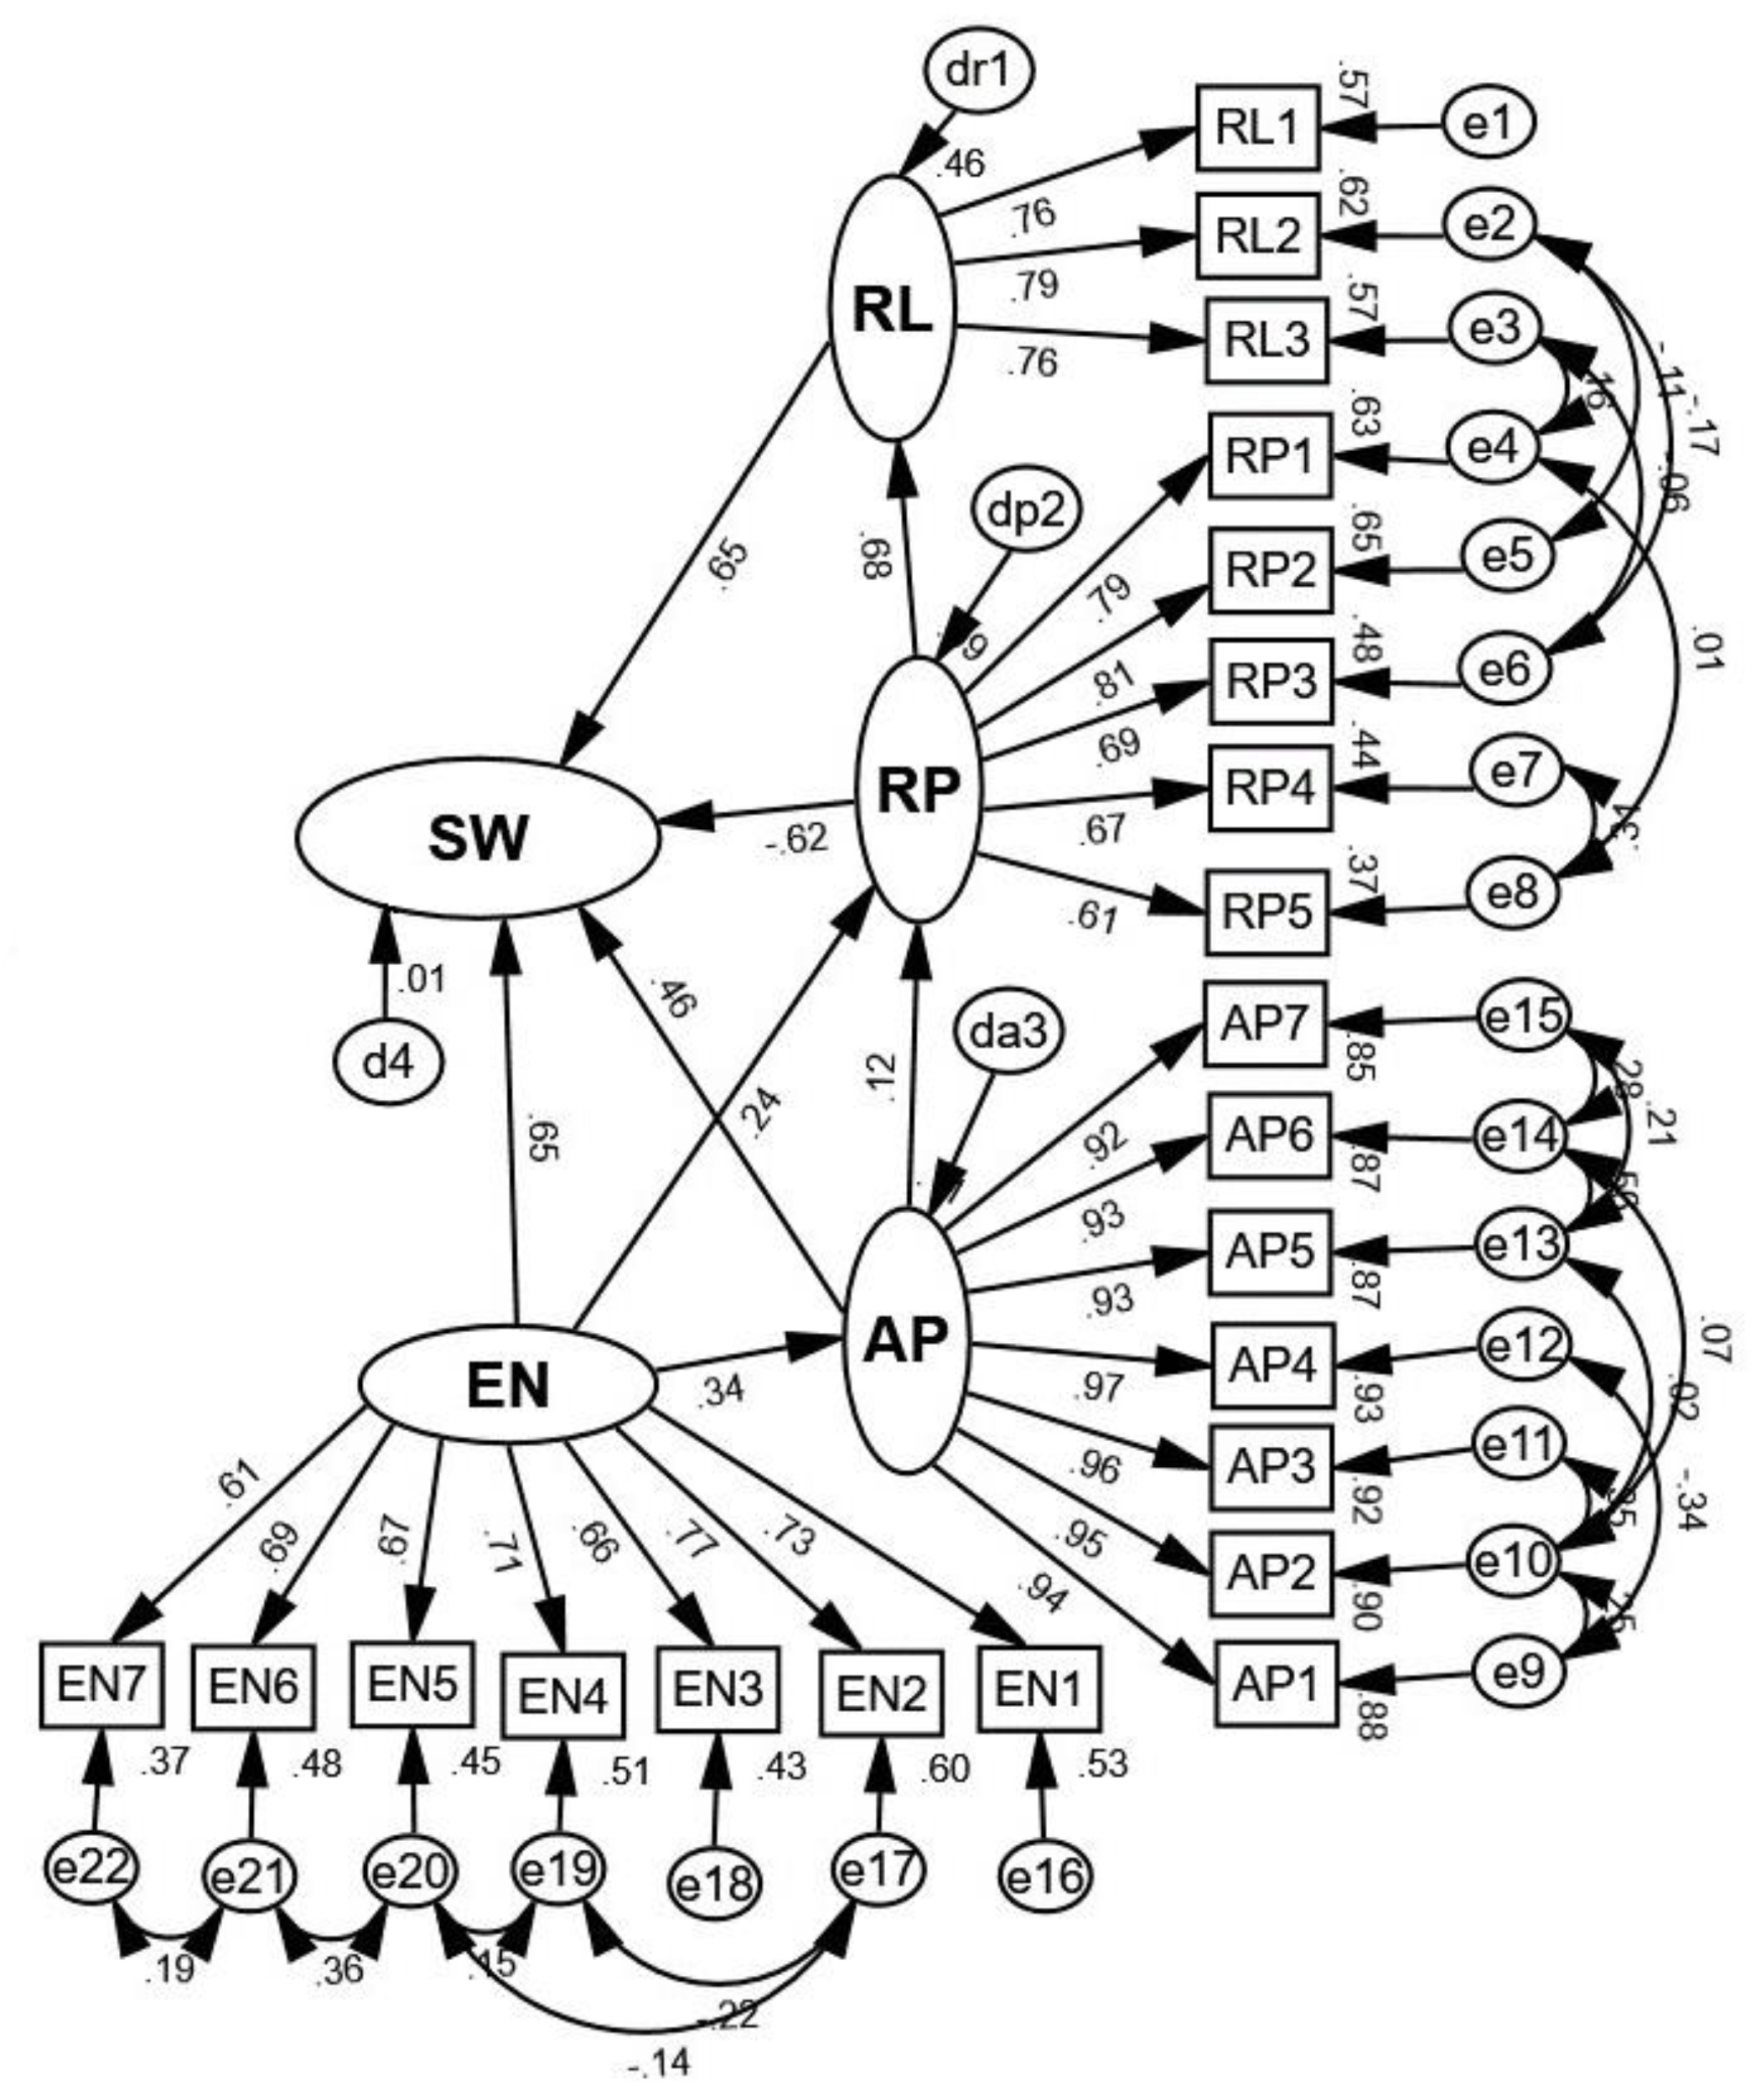
Hypothesis 3 to 6 suggest that different elements of subjective wellbeing at work are of different importance for generations. In case of Gen X, the most important is socio-emotional enablement (EN), while cognitive performance appraisal referring to perceived fairness of appraisal (AP) is not important, and cognitive job performance (RP) and social relationships at work (RL) have only an indirect effect (Appendix Figure A1). Table 8 shows the data for Gen X (Model 3) and indicates that EN (socio-emotional enablement at work) effects SW (subjective wellbeing at work) not only substantially (β = 0.715) but also highly significantly (<0.01), while RL (social relationships at work) effect is substantial (β = 0.671) and significant (p = 0.018). The other two constructs do not show significance: RP (cognitive job performance) and AP (cognitive performance appraisal) effects on SW (subjective wellbeing at work) are not significant (p = 0.506). In addition, EN (socio-emotional enablement) impact on RP (cognitive job performance) and RP (cognitive job performance) impact on RL (social relationship at work) should be noted, as this impact is highly significant (<0.01).
3.4.2. Subjective Wellbeing for Gen Y
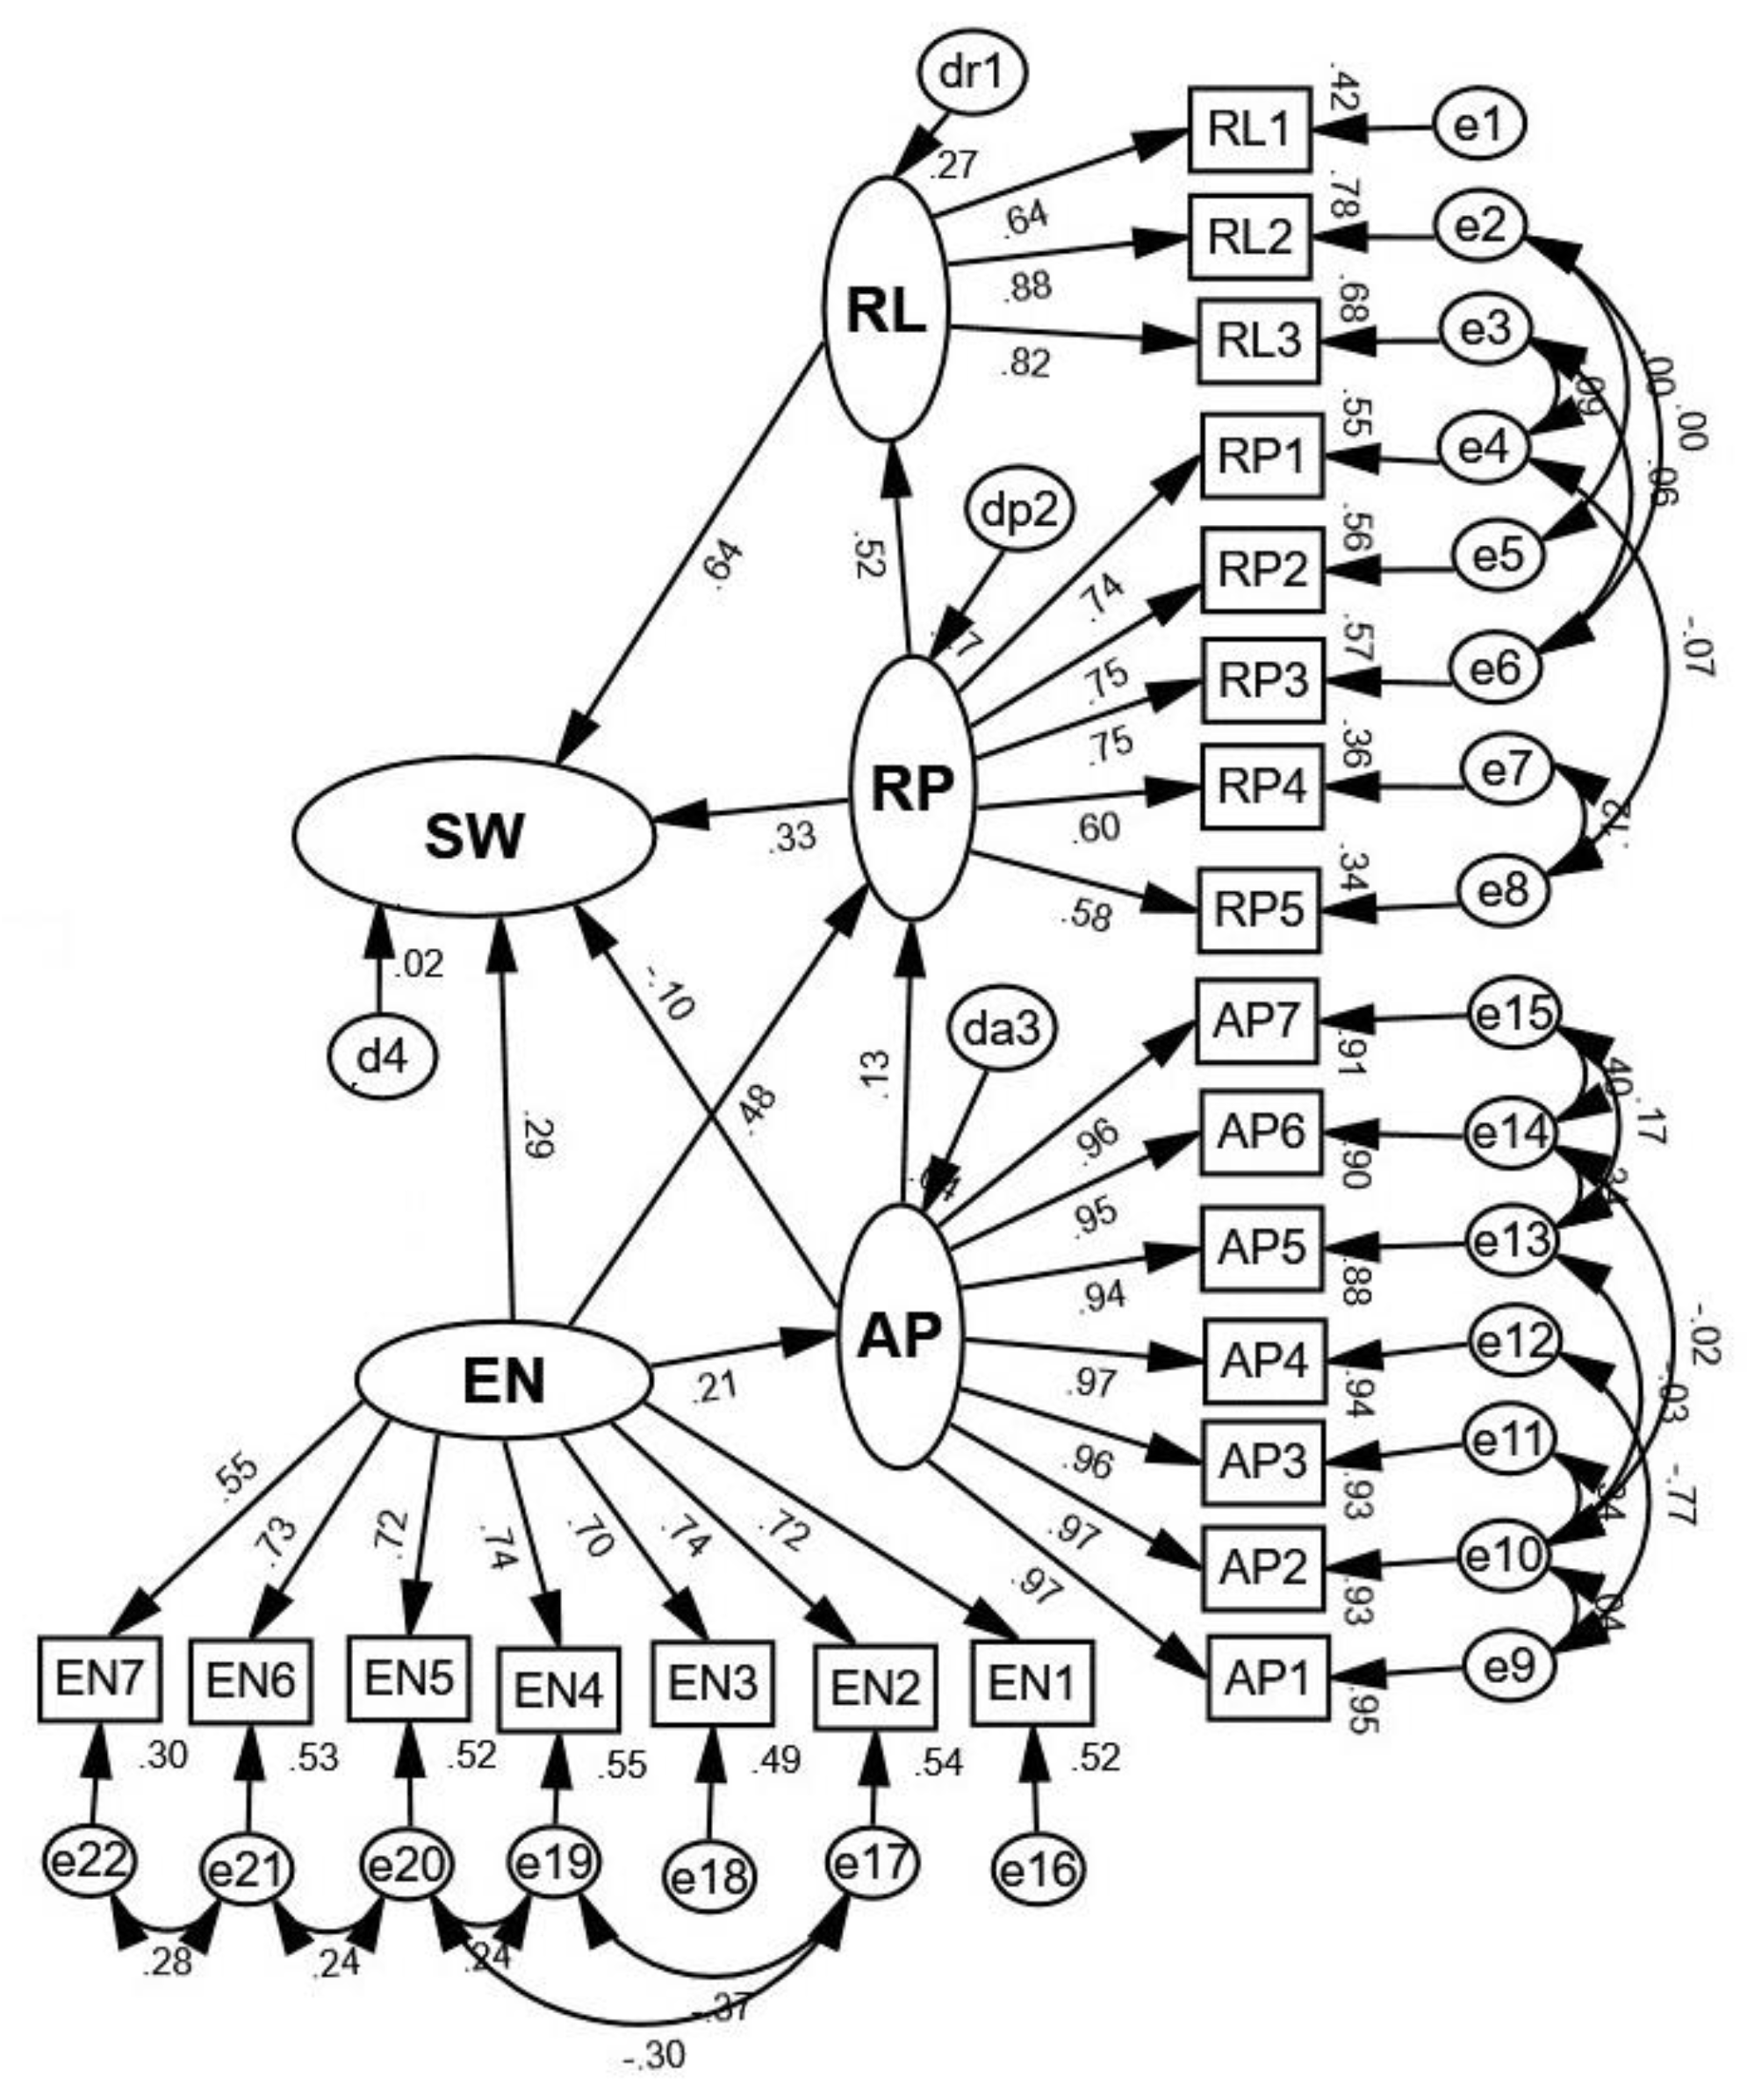
In the case of Gen Y, all four elements impact subjective wellbeing at work (SW) in one way or another (Table 9). Socio-emotional enablement (EN)’s impact on SW is a little weaker than in the case of Gen X; nevertheless, it remains a key element in the model (Appendix Figure A2). The remaining three elements make a significant indirect impact on subjective wellbeing at work. Model 4 for Gen Y is similar to Model 3 for Gen X with only one substantial difference. In Model 4, EN has some (β = 0.338) impact on AP, which is highly significant (<0.01). It should be noted that in the case of Gen Y, RP has a very large effect on RL (Table 9).
3.4.3. Subjective Wellbeing for Gen Z
The element of Gen Z’s subjective wellbeing at work is different from that of Gen X and Gen Y. The key element for Gen Z is social relationships at work. The bootstrap procedure is used to test the standard errors for total, direct, and indirect effects following recommendations by Fox [77]. The significance of indirect effects is found for the path EN→RP→SW (β = 0.141, p < 0.01) and for the path RP→RL→→SW (β = 0.174, p < 0.01). In other words, Model 5 (Appendix Figure A3) for Gen Z indicates a different composition of impacts, compared to Model 3 and Model 4: RL (social relationships at work) has the greatest effect on SW (β = 0.642, p < 0.01); thus, the effects of other constructs are statistically not significant (Table 10). As in Model 3 (Table 8) and Model 4 (Table 9), the relationships between the constructs (EN on RP and RP on RL) are statistically significant. Furthermore, it was identified that EN (socio-emotional enablement) has the statistically significant indirect effect on WB (subjective wellbeing) (EN→RP→SW for Model 4: the β = −0.150, p < 0.01; and EN→AP→SW for Model 4: the β = 0.156, p < 0.01).
4. Discussion
The study enlightens the effects different generations (age cohorts) have on subjective wellbeing at work as an overall quality of working life. Though subjective wellbeing at work has been examined in various aspects of scientific literature and various physical, cognitive, and socio-emotional components of this phenomenon have been revealed, this study further demonstrates that the importance of cognitive and socio-emotional components of subjective wellbeing at work varies between generations.
Before starting the discussion on the impact of generations on subjective wellbeing at work, we first discuss why one of the subjective wellbeing components was discarded already in the first stage of the study. Our study shows that physical experience is statistically significant for subjective wellbeing at work, but has an opposite effect than cognitive and socio-emotional experience. This is why we excluded physical experience from our hypothesized model of subjective wellbeing at work, despite the fact that numerous studies have identified the importance of the physical environment for wellbeing at work (see Cooper [22] for the review of 280 academic articles). We can assume that this contradiction arises from the different perceptions of the physical and non-physical environments. In essence, our study failed to demonstrate that subjective wellbeing at work is a composition of complementary physical, cognitive, and socio-emotional experiences. This finding does not devaluate the importance of the physical environment for wellbeing, but rather shows that physical and cognitive–social–emotional experiences at work can be contradicting. Based on the findings of this study, we propose to analyze physical experience at work separately from other experiences, as is done in ergonomics [29] and other occupational health studies [78]. The results of the study suggest that subjective wellbeing at work is difficult to analyze as a holistic phenomenon that includes all three dimensions of work-related experiences.
The most important contribution our research makes is to show that socio-emotional enablement is the most important factor in subjective wellbeing at work for Gen X and Gen Y, while social relationships at work is the main contributor for Gen Z. In our literature review, we found evidence that Gen Z enters the labour market with different attitudes and expectations than their predecessors did [8]. Our research findings may help explain why Gen Z is different. Indeed, Maloni et al. [8] argue that the older generation underestimates Gen Z’s demand for supervision and social interaction. Our research complements these results by the fact that Gen Z perceives wellbeing at work primarily as a relationship with colleagues and managers and only secondarily as cognitive job performance and job appraisal. This can be explained by the fact that young people are more prone to socialization than older ones [79].
Our results also contribute to the growing literature on social relationships at work and are conducive to debate on leader–member exchange. Previous studies [23,24,25] have demonstrated that a positive social leader–member exchange relationship contributes to job performance and job satisfaction as well as to long-term commitments at [23,24,25] work. As this study shows significant differences between generations, we suggest that the quality of leader–member exchange should be reconsidered, and important interpersonal social support by leaders should be directed not to all employees, as stated by Ellis [80], but mainly focused on younger ones.
Lastly, our results provide additional evidence for positive organizational psychology where work engagement is seen as a fulfilling work-related state of mind [39]. As engagement involves self-expression through work [26], it becomes more important for Gen X and Gen Y, which are characterized by self-discipline and flexibility at work [81]. Basically, these two generations are related to work emotionally, demonstrating the highest attachment to work [82]. It is interesting to note that positive organisational psychology, as an academic thought and field of research, has evolved in the studies of Gen X and Gen Y over the last twenty years [83,84]. In fact, positive organisational psychology today can explain in detail the behavior of these two generations at work. Concerning Gen Z, emotional work engagement is not as important for Gen Z as it is important for Gen X and Gen Y. Therefore, future development of positive organizational psychology should explore these conceptual differences in detail.
Although our research strongly supports the main hypothesis that the dimensions of subjective wellbeing at work are determined by generation, it has some limitations that should be noted. First, the study used single-source data. Although the single-source method is traditional and is used in more than 80% of attitude research in organizations [85], there are some issues of common method variance [86]. We performed a sophisticated data analysis to minimize these issues. Second, the data were collected among male-dominated military units. On the one hand, such a sample choice eliminated the gender impact and highlighted the generational impact on subjective wellbeing at work, and, on the other hand, this sample choice eliminated women’s representation, and thus their attitudes towards subjective wellbeing at work remained underexplored. Third, the survey was performed in the Lithuanian army that typically represents the “small-state army”. This type of organization is characterized not only by the typical military culture, where work is done according to general standing operating procedures, but also by the fact that, due to relatively low human resources, according to Nilsson [72], small-state armies are more affected by external environment than in comparably sized large-state armies. It can be assumed that our study, which uses a small-state army for its research sample, is more affected by generational change than others. Despite these limitations, the study is meaningful, because it confirms statistically significant differences between generations.
5. Conclusions
Our theoretical rationale suggests that generation (age cohort) has a strong moderating impact on the components of subjective wellbeing at work. Empirical findings support this theoretical rationale. We can conclude that in a military as a specific organization, where work is done according to general standing operating procedures as well as localized routine orders, there are fundamental differences between generations in perceived well-being at work. There, social relationships, as a socio-emotional experience, are the most important component of wellbeing at work for Gen Z. Gen Z perceives wellbeing at work primarily as a relationship with colleagues and managers and only secondarily as cognitive job performance and job appraisal. Accordingly, Gen Z needs to receive significant interpersonal social support from leaders in organizations. Socio-emotional enablement plays a central role in subjective wellbeing at work for Gen X and Gen Y, as these two generations are related to work emotionally.
It is important to emphasize that subjective wellbeing at work is still a recent area of research that develops on three mainstreams in research literature: subjective health at work, cognitive job satisfaction, and socio-emotional relationships at work. Our theoretical rationale and empirical findings suggest that combining all three mainstreams into a single theoretical model is difficult, because the contradiction arises from different perceptions of the physical and non-physical environment.
Author Contributions
Conceptualization: R.S., methodology: R.S.; validation: S.B.; analysis: S.B.; writing—original draft preparation: R.S. and S.B.; writing—review and editing: R.S. and S.B.; visualization: S.B.; project administration: R.S.; funding acquisition: R.S. All authors have read and agreed to the published version of the manuscript.
Funding
This research was funded by Ministry of National Defence Republic of Lithuania, as a part of the research project “Leadership research in the Lithuanian Armed Forces” (2019–2020). Any opinions, findings, and conclusions or recommendations expressed in this material are those of the authors and do not necessarily reflect the view of the funding agency.
Conflicts of Interest
The authors declare no conflict of interest. The funders had no role in the design of the study; in the collection, analyses, or interpretation of data; in the writing of the manuscript; or in the decision to publish the results.
Appendix A
Figure A1.
Statistical models with standardized regression measurements for Gen X.

Figure A2.
Statistical models with standardized regression measurements for Gen Y.

Figure A3.
Statistical models with standardized regression measurements for Gen Z.

References
- Wright, T.A.; Bonett, D.G. Job Satisfaction and Psychological Well-Being as Nonadditive Predictors of Workplace Turnover. J. Manag. 2007, 33, 141–160. [Google Scholar] [CrossRef]
- Lu, A.C.C.; Gursoy, D. Impact of Job Burnout on Satisfaction and Turnover Intention. J. Hosp. Tour. Res. 2016, 40, 210–235. [Google Scholar] [CrossRef]
- Lam, T.; Lo, A.; Chan, J. New Employees’ Turnover Intentions and Organizational Commitment in the Hong Kong Hotel Industry. J. Hosp. Tour. Res. 2002, 26, 217–234. [Google Scholar] [CrossRef]
- Wanous, J.P.; Reichers, A.E.; Malik, S.D. Organizational Socialization and Group Development: Toward and Integrative Perspective. Acad. Manag. Rev. 1984, 9, 670–683. [Google Scholar] [CrossRef]
- Baptiste, N.R. Tightening the link between employee wellbeing at work and performance: A new dimension for HRM. Manag. Decis. 2008, 46, 284–309. [Google Scholar] [CrossRef]
- Lewis, L.F.; Wescott, H.D. Multi-Generational Workforce: Four Generations United in Lean. J. Bus. Stud. Q. 2017, 8. [Google Scholar]
- Pawirosumarto, S.; Saudi, M.H.M.; Rashid, A.Z.A. Improving Employees’ Performance through Sustainable Hrm Practices: A Triple Mediation Model. J. Secur. Sustain. Issues 2020, 10, 66–80. [Google Scholar] [CrossRef]
- Maloni, M.; Hiatt, M.S.; Campbell, S. Understanding the work values of Gen Z business students. Int. J. Manag. Educ. 2019, 17, 100320. [Google Scholar] [CrossRef]
- Wang, Y.; Peng, Y. An alternative approach to understanding generational differences. Ind. Organ. Psychol. 2015, 8, 390–395. [Google Scholar] [CrossRef]
- GenXegesis: Essays on Alternative Youth (Sub) Culture; Ulrich, J.M.; Harris, A.L. (Eds.) UW Press: Madison, WI, USA, 2003; ISBN 978-0-87972-862-5. [Google Scholar]
- Kim, M.M. Early Career Earnings of African American Students: The Impact of Attendance at Historically Black versus White Colleges and Universities—ProQuest. J. Negro Educ. 2011, 80, 505–520. [Google Scholar]
- Mehra, P.; Nickerson, C. Organizational communication and job satisfaction: What role do generational differences play? Int. J. Organ. Anal. 2019, 27, 524–547. [Google Scholar] [CrossRef]
- Schroth, H. Are You Ready for Gen Z in the Workplace? Calif. Manag. Rev. 2019, 61, 5–18. [Google Scholar] [CrossRef]
- American Psychological Association. STRESS IN AMERICA TM GENERATION Z; American Psychological Association: Worcester, MA, USA, 2018. [Google Scholar]
- Cucina, J.M.; Byle, K.A.; Martin, N.R.; Peyton, S.T.; Gast, I.F. Generational differences in workplace attitudes and job satisfaction: Lack of sizable differences across cohorts. J. Manag. Psychol. 2018, 33, 246–264. [Google Scholar] [CrossRef]
- Kim, M.; Knutson, B.J.; Choi, L. The Effects of Employee Voice and Delight on Job Satisfaction and Behaviors: Comparison Between Employee Generations. J. Hosp. Mark. Manag. 2016, 25, 563–588. [Google Scholar] [CrossRef]
- Kampf, R.; Lorincová, S.; Hitka, M.; Stopka, O. Generational Differences in the Perception of Corporate Culture in European Transport Enterprises. Sustainability 2017, 9, 1561. [Google Scholar] [CrossRef] [Green Version]
- Zabel, K.L.; Biermeier-Hanson, B.B.J.; Baltes, B.B.; Early, B.J.; Shepard, A. Generational Differences in Work Ethic: Fact or Fiction? J. Bus. Psychol. 2017, 32, 301–315. [Google Scholar] [CrossRef]
- Emanuel, F.; Molino, M.; Ghislieri, C.; Ghini, R.; Tortone, A.; Cortese, C.G. Dalla valutazione dello stress lavoro-correlato alla promozione del benessere organizzativo: Il caso di una azienda farmaceutica italiana. Med. Lav. 2016, 107, 364–377. [Google Scholar]
- Warr, P. Work, Unemployment, and Mental Health; Oxford University Press: Oxford, UK, 1987; ISBN 978-0198521594. [Google Scholar]
- Pagán-Castaño, E.; Maseda-Moreno, A.; Santos-Rojo, C. Wellbeing in work environments. J. Bus. Res. 2020, 115, 469–474. [Google Scholar] [CrossRef]
- Cooper, R.; Boyko, C.; Codinhoto, R. The effect of the physical environment on mental wellbeing. In Mental Capital and Wellbeing; Field, J., Goswami, U., Jenkins, R., Sahakian, B.J., Eds.; Wiley Blackwell: Oxford, UK, 2010; pp. 967–1006. ISBN 978-1-444-30772-6. [Google Scholar]
- Kuvaas, B.; Buch, R.; Dysvik, A.; Haerem, T. Economic and social leader-member exchange relationships and follower performance. Leadersh. Q. 2012, 23, 756–765. [Google Scholar] [CrossRef] [Green Version]
- Berg, S.T.S.; Grimstad, A.; Škerlavaj, M.; Černe, M. Social and economic leader–member exchange and employee creative behavior: The role of employee willingness to take risks and emotional carrying capacity. Eur. Manag. J. 2017, 35, 676–687. [Google Scholar] [CrossRef]
- Sulasmi, E.; Agussani; Tanjung, H. Bridging the way towards sustainability performance through safety, empowerment and learning: Using sustainable leadership as driving force. J. Secur. Sustain. Issues 2020, 10, 93–107. [Google Scholar] [CrossRef]
- Lin, C.P. Modeling corporate citizenship, organizational trust, and work engagement based on attachment theory. J. Bus. Ethics 2010, 94, 517–531. [Google Scholar] [CrossRef]
- Côté, S.; Miners, C.T.H. Emotional Intelligence, Cognitive Intelligence, and Job Performance. Adm. Sci. Q. 2006, 51, 1–28. [Google Scholar] [CrossRef]
- Gander, F.; Proyer, R.T.; Ruch, W. A Placebo-Controlled Online Study on Potential Mediators of a Pleasure-Based Positive Psychology Intervention: The Role of Emotional and Cognitive Components. J. Happiness Stud. 2018, 19, 2035–2048. [Google Scholar] [CrossRef] [Green Version]
- Richardson, M.; Maspero, M.; Golightly, D.; Sheffield, D.; Staples, V.; Lumber, R. Nature: A new paradigm for well-being and ergonomics. Ergonomics 2017, 60, 292–305. [Google Scholar] [CrossRef] [PubMed]
- Maertens, J.A.; Putter, S.E.; Chen, P.Y.; Diehl, M.; Huang, Y.H. Physical Capabilities and Occupational Health of Older Workers. In The Oxford Handbook of Work and Aging; Oxford University Press: Oxford, UK, 2012; ISBN 9780199940752. [Google Scholar]
- Sundstrup, E.; Hansen, Å.M.; Mortensen, E.L.; Poulsen, O.M.; Clausen, T.; Rugulies, R.; Møller, A.; Andersen, L.L. Retrospectively assessed physical work environment during working life and risk of sickness absence and labour market exit among older workers. Occup. Environ. Med. 2018, 75, 114–123. [Google Scholar] [CrossRef] [PubMed] [Green Version]
- Kooij, D.T.A.M. The Impact of the Covid-19 Pandemic on Older Workers: The Role of Self-Regulation and Organizations. Work Aging Retire. 2020, 6, 233–237. [Google Scholar] [CrossRef]
- Abdel Wahed, W.Y.; Hefzy, E.M.; Ahmed, M.I.; Hamed, N.S. Assessment of Knowledge, Attitudes, and Perception of Health Care Workers Regarding COVID-19, A Cross-Sectional Study from Egypt. J. Community Health 2020, 45, 1242–1251. [Google Scholar] [CrossRef]
- Rasila, H.; Rothe, P. A problem is a problem is a benefit? Generation Y perceptions of open-plan offices. Prop. Manag. 2012, 30, 362–375. [Google Scholar] [CrossRef]
- Fisher, C.D. Conceptualizing and Measuring Wellbeing at Work. In Wellbeing; John Wiley & Sons, Ltd.: Chichester, UK, 2014; pp. 1–25. [Google Scholar]
- Bandura, A. Social cognitive theory in cultural context. Appl. Psychol. 2002, 51, 269–290. [Google Scholar] [CrossRef]
- Sheu, H.-B.; Robert, A.E.; Lent, W.; Sheu, H.-B. A social cognitive perspective on well-being in educational and work settings: Cross-cultural considerations. Int. J. Educ. Vocat. Guid. 2008. [Google Scholar] [CrossRef]
- Lam, S.S.K.; Yik, M.S.M.; Schaubroeck, J. Responses to formal performance appraisal feedback: The role of negative affectivity. J. Appl. Psychol. 2002, 87, 192–201. [Google Scholar] [CrossRef]
- Brightenburg, M.E.; Lee Whittington, J.; Meskelis, S.; Asare, E. Job engagement levels across the generations at work. In Global Applications of Multigenerational Management and Leadership in the Transcultural Era; IGI Global: Hershey, PA, USA, 2019; pp. 108–137. ISBN 9781522599074. [Google Scholar]
- Cleveland, J.N.; Huebner, L.A.; Anderson, K.J.; Agbeke, D.V. Lifespan perspectives on job performance, performance appraisal/management and creative performance. In Work across the Lifespan; Elsevier: Amsterdam, The Netherlands, 2019; pp. 291–321. ISBN 9780128127568. [Google Scholar]
- Chaudhuri, S.; Ghosh, R. Reverse Mentoring. Hum. Resour. Dev. Rev. 2012, 11, 55–76. [Google Scholar] [CrossRef] [Green Version]
- Lacković, N. Graduate employability (GE) paradigm shift: Towards greater socio-emotional and eco-technological relationalities of graduates’ futures. In Education and Technological Unemployment; Springer: Singapore, 2019; pp. 193–212. ISBN 9789811362255. [Google Scholar]
- Hoole, C.; Bonnema, J. Work engagement and meaningful work across generational cohorts. SA J. Hum. Resour. Manag. 2015, 13, 1–11. [Google Scholar] [CrossRef]
- Ojedokun, O.; Idemudia, E.S. Psycho-socio-emotional well-being of workers in a high-stress occupation: Are men and women really so different? Gend. Behav. 2014, 12, 5824–5838. [Google Scholar]
- Attanasio, O.; de Paula, Á.; Toppeta, A. The Persistence of Socio-Emotional Skills: Life Cycle and Intergenerational Evidence; NEMBER: Cambridge, MA, USA, 2020. [Google Scholar]
- Wilén, N.; Heinecken, L. Peacekeeping deployment abroad and the self-perceptions of the effect on career advancement, status and reintegration. Int. Peacekeeping 2017, 24, 236–253. [Google Scholar] [CrossRef]
- Steele, W.M.; Walters, R.P., Jr. Training and Developing Leaders in a Transforming Army. Mil. Rev. 2001, 81, 2. [Google Scholar]
- Kirke, C. Orders is orders aren’t they? Rule bending and rule breaking in the British Army. Ethnography 2010, 11, 359–380. [Google Scholar] [CrossRef] [Green Version]
- Zentelis, R.; Banks, S.; Roberts, J.D.; Dovers, S.; Lindenmayer, D. Managing military training-related environmental disturbance. J. Environ. Manag. 2017, 204, 486–493. [Google Scholar] [CrossRef]
- Meadows, S.; Schell, T.; Tanielian, T.; Griffin, B.; Karney, B.; Jaycox, L.; Friedman, E.; Trail, T.; Beckman, R.; Ramchand, R.; et al. The Deployment Life Study: Longitudinal Analysis of Military Families Across the Deployment Cycle; RAND Corporation: Santa Monica, CA, USA, 2016; Volume 6. [Google Scholar]
- Lindahl, J.; Colliander, C.; Danell, R. Early career performance and its correlation with gender and publication output during doctoral education. Scientometrics 2020, 122, 309–330. [Google Scholar] [CrossRef] [Green Version]
- Magpili, N.C.; Pazos, P. Self-Managing Team Performance: A Systematic Review of Multilevel Input Factors. Small Group Res. 2018, 49, 3–33. [Google Scholar] [CrossRef]
- Cleveland, J.N.; Murphy, K.R.; Williams, R.E. Multiple Uses of Performance Appraisal: Prevalence and Correlates. J. Appl. Psychol. 1989, 74, 130–135. [Google Scholar] [CrossRef]
- Karasek, R.; Brisson, C.; Kawakami, N.; Houtman, I.; Bongers, P.; Amick, B. The Job Content Questionnaire (JCQ): An instrument for internationally comparative assessments of psychosocial job characteristics. J. Occup. Health Psychol. 1998, 3, 322–355. [Google Scholar] [CrossRef] [PubMed]
- Edimansyah, B.A.; Rusli, B.N.; Naing, L.; Mazalisah, M. Reliability and construct validity of the Malay version of the job content questionnaire (JCQ). Southeast Asian J. Trop. Med. Public Health 2006, 37, 412–416. [Google Scholar] [PubMed]
- IGI Global. Consumer Behavior, Organizational Development, and Electronic Commerce; Advances in Electronic Commerce; Khosrow-Pour, D.B.A., Ed.; IGI Global: Hershey, PA, USA, 2009; ISBN 9781605661261. [Google Scholar]
- Byrne, B.M. Structural Equation Modeling with EQS: Basic Concepts, Applications, and Programming, 2nd ed.; Taylor and Francis: Abingdon, UK, 2013; ISBN 9780203726532. [Google Scholar]
- Bekešiene, S.; Smaliukiene, R. Intelligent technologies in development of leadership competence. In Intelligent Technologies in Logistics and Mechatronics Systems, ITELMS 2009, Proceedings of the 4th International Conference, Panevezys, Lithuania, 4–5 June 2009. [Google Scholar]
- Bekesiene, S.; Hoskova-Mayerova, S. Decision tree-Based classification model for identification of effective leadership indicators. J. Math. Fundam. Sci. 2018, 50, 121–141. [Google Scholar] [CrossRef]
- Hair, J. Multivariate Data Analysis, 8th ed.; Cengage Learning EMEA: Hampshire, UK, 2019; ISBN 9781473756540. [Google Scholar]
- Browne, M.W.; Cudeck, R. Alternative Ways of Assessing Model Fit. Sociol. Methods Res. 1992, 21, 230–258. [Google Scholar] [CrossRef]
- Torkzadeh, G.; Koufteros, X.; Pflughoeft, K. Confirmatory analysis of computer self-efficacy. Struct. Equ. Modeling 2003, 10, 263–275. [Google Scholar] [CrossRef]
- Bentler, P.M.; Bonett, D.G. Significance tests and goodness of fit in the analysis of covariance structures. Psychol. Bull. 1980, 88, 588–606. [Google Scholar] [CrossRef]
- Fornell, C.; Larcker, D.F. Structural Equation Models with Unobservable Variables and Measurement Error: Algebra and Statistics. J. Mark. Res. 1981, 18, 382–388. [Google Scholar] [CrossRef]
- Wang, K.; Xu, Y.; Wang, C.; Tan, M.; Chen, P. A Corrected Goodness-of-Fit Index (CGFI) for Model Evaluation in Structural Equation Modeling. Struct. Equ. Modeling 2020, 27, 735–749. [Google Scholar] [CrossRef]
- Hancock, G.R.; Nevitt, J. Structural Equation Modeling: A Multidisciplinary Journal Bootstrapping and the Identification of Exogenous Latent Variables within Structural Equation Models; Taylor & Francis: Abingdon, UK, 2009. [Google Scholar] [CrossRef]
- Tan, S.H.; Tan, S.B. The Correct Interpretation of Confidence Intervals. Proc. Singap. Healthc. 2010, 19, 276–278. [Google Scholar] [CrossRef] [Green Version]
- Bagozzi, R.P.; Yi, Y. On the evaluation of structural equation models. J. Acad. Mark. Sci. 1988, 16, 74–94. [Google Scholar] [CrossRef]
- Curran, P.J.; West, S.G.; Finch, J.F. The Robustness of Test Statistics to Nonnormality and Specification Error in Confirmatory Factor Analysis. Psychol. Methods 1996, 1, 16–29. [Google Scholar] [CrossRef]
- Lei, P.W.; Wu, Q. An NCME instructional module on: Introduction to structural equation modeling: Issues and practical considerations. Educ. Meas. Issues Pract. 2007, 26, 33–43. [Google Scholar] [CrossRef]
- Enders, C.K.; Bandalos, D.L. The relative performance of full information maximum likelihood estimation for missing data in structural equation models. Struct. Equ. Modeling 2001, 8, 430–457. [Google Scholar] [CrossRef]
- Nilsson, N. Practicing mission command for future battlefield challenges: The case of the Swedish army. Def. Stud. 2020, 20, 436–452. [Google Scholar] [CrossRef]
- Hair, J.F.; Hult, G.T.M.; Ringle, C.; Sarstedt, M. A Primer on Partial Least Squares Structural Equation Modeling (PLS-SEM); SAGE: Los Angeles, CA, USA, 2014; ISBN 9781452217444. [Google Scholar]
- Baumgartner, H.; Homburg, C. Applications of structural equation modeling in marketing and consumer research: A review. Int. J. Res. Mark. 1996, 13, 139–161. [Google Scholar] [CrossRef] [Green Version]
- Doll, W.J.; Xia, W.; Torkzadeh, G. A confirmatory factor analysis of the end-user computing satisfaction instrument. MIS Q. 1994, 18, 453–460. [Google Scholar] [CrossRef]
- Hair, J.F.; Sarstedt, M.; Ringle, C.M.; Mena, J.A. An assessment of the use of partial least squares structural equation modeling in marketing research. J. Acad. Mark. Sci. 2012, 40, 414–433. [Google Scholar] [CrossRef]
- Fox, J. Effect Analysis in Structural Equation Models. Sociol. Methods Res. 1980, 9, 3–28. [Google Scholar] [CrossRef]
- Judge, T.A.; Ilies, R.; Dimotakis, N. Are Health and Happiness the Product of Wisdom? The Relationship of General Mental Ability to Educational and Occupational Attainment, Health, and Well-Being. J. Appl. Psychol. 2010, 95, 454–468. [Google Scholar] [CrossRef] [PubMed] [Green Version]
- Khalil, K.; Asgher, U.; Khalil, M.; Khawaja, K.; Ayaz, Y.; Nazir, S.; Oka, N.; Ruiz, J.A. An Empirical Study on Organizational Socialization and Its Relationship with Employees’ Age and the Knowledge Management. In Advances in Intelligent Systems and Computing; AISC; Springer: Berlin/Heidelberg, Germany, 2021; Volume 1201, pp. 355–361. [Google Scholar]
- Ellis, A.M.; Bauer, T.N.; Erdogan, B.; Truxillo, D.M. Daily perceptions of relationship quality with leaders: Implications for follower well-being. Work Stress 2019, 33, 119–136. [Google Scholar] [CrossRef]
- Hannay, M.; Fretwell, C. The Higher Education Workplace: Meeting the Needs of Multiple Generations. Res. High. Educ. J. 2011, 10, 1. [Google Scholar]
- Shacklock, K.; Brunetto, Y. The intention to continue nursing: Work variables affecting three nurse generations in Australia. J. Adv. Nurs. 2012, 68, 36–46. [Google Scholar] [CrossRef] [PubMed] [Green Version]
- Donaldson, S.I.; Ko, I. Positive organizational psychology, behavior, and scholarship: A review of the emerging literature and evidence base. J. Posit. Psychol. 2010, 5, 177–191. [Google Scholar] [CrossRef]
- Donaldson, S.I.; Lee, J.Y.; Donaldson, S.I. Evaluating Positive Psychology Interventions at Work: A Systematic Review and Meta-Analysis. Int. J. Appl. Posit. Psychol. 2019, 4, 113–134. [Google Scholar] [CrossRef] [Green Version]
- Arnold, K.A. Transformational leadership and employee psychological well-being: A review and directions for future research. J. Occup. Health Psychol. 2017, 22, 381–393. [Google Scholar] [CrossRef]
- Chang, S.J.; van Witteloostuijn, A.; Eden, L. From the Editors: Common method variance in international business research. J. Int. Bus. Stud. 2010, 41, 178–184. [Google Scholar] [CrossRef]
Figure 1.
Two models of subjective wellbeing at work.

Figure 2.
Hypothesized theoretical model.

Figure 3.
Statistical models with standardized regression measurements: (a) Model 1; (b) Model 2.


Table 1.
Demographic information of the respondents.
| Category | Description | Number of Respondents, N | Percentage, % | |
|---|---|---|---|---|
| Age | 18–25 | 336 | 37.8 | |
| 26–40 | 429 | 48.2 | ||
| 41–56 | 125 | 14.0 | ||
| Length of service | Up to 5 years | 441 | 49.6 | |
| 6–15 | 278 | 31.2 | ||
| 16–25 | 153 | 17.2 | ||
| More than 26 | 18 | 2.0 |
Note: sample size N = 890.
Table 2.
Model construct data and construct reliability.
| Construct (Endogenous Variable) | Exogenous Variables | Code | Factor Loading | Cronbach’s Alpha (CA) |
|---|---|---|---|---|
| PE | a2.1 | PE1 | 0.562 | 0.755 |
| a2.3 | PE2 | 0.611 | ||
| a2.5 | PE3 | 0.481 | ||
| a2.9 | PE4 | 0.729 | ||
| a2.6 | PE5 | 0.719 | ||
| a2.8 | PE6 | 0.724 | ||
| a2.10 | PE7 | 0.617 | ||
| RP | a22_1 | RP1 | 0.848 | 0.833 |
| a22_3 | RP2 | 0.693 | ||
| a22_4 | RP3 | 0.699 | ||
| a22_7 | RP4 | 0.592 | ||
| a22_8 | RP5 | 0.668 | ||
| AP | a28_1 | AP1 | 0.928 | 0.986 |
| a28_2 | AP2 | 0.927 | ||
| a28_3 | AP3 | 0.926 | ||
| a28_4 | AP4 | 0.922 | ||
| a28_5 | AP5 | 0.922 | ||
| a28_6 | AP6 | 0.919 | ||
| a28_7 | AP7 | 0.915 | ||
| RL | a22_2 | RL1 | 0.706 | 0.761 |
| a22_5 | RL2 | 0.751 | ||
| a22_6 | RL3 | 0.630 | ||
| EN | a29_1 | EN1 | 0.895 | 0.868 |
| a29_2 | EN2 | 0.669 | ||
| a29_3 | EN3 | 0.666 | ||
| a29_4 | EN4 | 0.664 | ||
| a29_5 | EN5 | 0.629 | ||
| a29_6 | EN6 | 0.612 | ||
| a29_7 | EN7 | 0.567 |
Note: N = 890 for all items. The responses for all observed items range from 1 to 5. PE = physical experience; RP = cognitive job performance; AP = cognitive performance appraisal; RL = social relationship; EN = socio-emotional enablement.
Table 3.
Convergent validity of constructs for all generations.
| Construct | Index | Std. Loading | Unstd. Loading | S.E. | C.R. (t-Value) | p Value | SMC | CR | AVE |
|---|---|---|---|---|---|---|---|---|---|
| PE | PE4 | 0.635 | 0.803 | 0.050 | 16.173 | *** | 0.462 | 0.780 | 0.640 |
| PE5 | 0.698 | 0.910 | 0.056 | 16.115 | *** | 0.456 | |||
| PE6 | 0.675 | 1 | 0.528 | ||||||
| PE7 | 0.550 | 0.812 | 0.055 | 14.727 | *** | 0.358 | |||
| RP | RP1 | 0.746 | 0.868 | 0.041 | 21.315 | *** | 0.567 | 0.830 | 0.705 |
| RP2 | 0.766 | 1 | 0.611 | ||||||
| RP3 | 0.721 | 0.918 | 0.044 | 20.743 | *** | 0.527 | |||
| RP4 | 0.694 | 0.855 | 0.046 | 18.611 | *** | 0.430 | |||
| RP5 | 0.643 | 0.838 | 0.052 | 16.011 | *** | 0.347 | |||
| AP | AP1 | 0.955 | 0.984 | 0.013 | 72.888 | *** | 0.913 | 0.976 | 0.923 |
| AP2 | 0.957 | 1 | 0.916 | ||||||
| AP3 | 0.96 | 1.003 | 0.011 | 88.768 | *** | 0.921 | |||
| AP4 | 0.969 | 1.005 | 0.014 | 72.676 | *** | 0.939 | |||
| AP5 | 0.935 | 0.957 | 0.016 | 61.333 | *** | 0.873 | |||
| AP6 | 0.940 | 0.961 | 0.015 | 63.184 | *** | 0.884 | |||
| AP7 | 0.933 | 0.950 | 0.016 | 59.959 | *** | 0.870 | |||
| RL | RL1 | 0.701 | 0.873 | 0.045 | 19.513 | *** | 0.488 | 0.739 | 0.698 |
| RL2 | 0.742 | 1.02 | 0.048 | 21.149 | *** | 0.668 | |||
| RL3 | 0.783 | 1 | 0.619 | ||||||
| EN | EN1 | 0.719 | 1.073 | 0.055 | 19.494 | *** | 0.517 | 0.854 | 0.679 |
| EN2 | 0.745 | 0.941 | 0.049 | 19.044 | *** | 0.556 | |||
| EN3 | 0.657 | 0.865 | 0.048 | 17.892 | *** | 0.430 | |||
| EN4 | 0.730 | 1.092 | 0.058 | 18.699 | *** | 0.535 | |||
| EN5 | 0.690 | 0.982 | 0.046 | 21.273 | *** | 0.472 | |||
| EN6 | 0.706 | 1 | 0.498 | ||||||
| EN7 | 0.585 | 0.801 | 0.044 | 18.145 | *** | 0.344 |
Note: N = 890 for all items. The responses for all observed items range from 1 to 5. PE = physical experience; RP = cognitive job performance; AP = cognitive performance appraisal; RL = social relationships; EN = socio-emotional enablement. CR—composite reliability; AVE—average variance extracted; SMC—square of the multiple correlation coefficient; ***—statistical significance at 1%.
Table 4.
Discriminant validity between constructs for all generations.
| Parameter | All Generations | |||||
|---|---|---|---|---|---|---|
| Model 1 | Model 2 | |||||
| RW 1 | Bias-Corrected 2 [Lower; Upper] | P 3 | RW 1 | Bias-Corrected 2 [Lower; Upper] | P 3 | |
| AP <--- EN | 0.667 | [0.478; 0.819] | 0.004 | 0.660 | [0.467; 0.807] | 0.003 |
| RL <--- RP | 0.516 | [0.355; 0.680] | 0.002 | 0.516 | [0.355; 0.681] | 0.002 |
| RP <--- AP | 0.042 | [0.018; 0.067] | 0.001 | 0.043 | [0.020; 0.069] | 0.001 |
| RP <--- EN | 0.340 | [0.24; 0.481] | 0.001 | 0.330 | [0.231; 0.466] | 0.001 |
| SW <--- RP | −0.058 | [−0.286; 0.187] | 0.675 | −0.107 | [−0.341; 0.140] | 0.407 |
| SW <--- EN | 0.180 | [0.032; 0.346] | 0.022 | 0.113 | [−0.036; 0.259] | 0.125 |
| SW <--- AP | 0.028 | [−0.013; 0.069] | 0.172 | 0.028 | [−0.014; 0.071] | 0.192 |
| SW <--- RL | 0.182 | [−0.061; 0.416] | 0.158 | 0.191 | [−0.055; 0.437] | 0.139 |
| SW <--- PE | −0.220 | [−0.336; −0.113] | 0.002 | --- | ---- | ---- |
| PE <--> EN | 0.164 | [0.478; 0.819] | 0.001 | --- | ---- | ---- |
Notes: 1 Regression weight. 2 Bias-corrected percentile method [lower; upper]. 3 P—statistical significance.
Table 5.
Overall models fit comparison.
| Model fit | Recommended Value | All Generations | |
|---|---|---|---|
| Model 1 | Model 2 | ||
| χ2 | Lower is better | 619.605 (p = 0.000) | 425.085 (p = 0.000) |
| χ2/df | <3 | 2.093 (df = 296) | 2.085 (df = 204) |
| RMSEA | <0.08 | 0.035 | 0.035 |
| 1 CI | [0.031; 0.039]1 | [0.030; 0.040]1 | |
| TLI | >0.9 | 0.979 | 0.984 |
| IFI | >0.9 | 0.982 | 0.987 |
| CFI | >0.9 | 0.967 | 0.987 |
| PNFI | Higher is better | 0.815 | 0.787 |
| ECVI | Lower is better | 0.941 | 0.691 |
| AIC | Lower is better | 837.605 | 615.085 |
| BCC | Lower is better | 844.686 | 620.351 |
Note: 1 90% Confidence Intervals, CI = [Lower; Upper].
Table 6.
Construct convergent validity estimation of Model 2 for three independent samples.
| Sample Z (n = 336) | ||||
| Latent Variable’s Code | Factor loading [Lower; Upper] | Cronbach’s Alpha | CR | AVE |
| RL (3) | [0.533; 0.718] | 0.825 | 0.685 | 0.651 |
| RP (5) | [0.411; 0.578] | 0.813 | 0.658 | 0.530 |
| AP (7) | [0.943; 0.970] | 0.988 | 0.977 | 0.961 |
| EN (7) | [0.408; 0.686] | 0.871 | 0.753 | 0.522 |
| Sample Y (n = 429) | ||||
| Latent Variable | Factor loading [Lower; Upper] | Cronbach’s Alpha | CR | AVE |
| RL (3) | [0.574; 0.650] | 0.812 | 0.636 | 0.607 |
| RP (5) | [0.610; 0.712] | 0.845 | 0.791 | 0.657 |
| AP (7) | [0.910; 0.945] | 0.984 | 0.960 | 0.931 |
| EN (7) | [0.607; 0.756] | 0.869 | 0.836 | 0.601 |
| Sample X (n = 125) | ||||
| Latent Variable | Factor loading [Lower; Upper] | Cronbach’s Alpha | CR | AVE |
| RL (3) | [0.645; 0.685] | 0.728 | 0.700 | 0.661 |
| RP (5) | [0.501; 0.743] | 0.820 | 0.789 | 0.658 |
| AP (7) | [0.871; 0.965] | 0.983 | 0.960 | 0.931 |
| EN (7) | [0.418; 0.791] | 0.853 | 0.842 | 0.608 |
Note: PE = physical experience; RP = cognitive job performance; AP = cognitive performance appraisal; RL = social relationships; EN = socio-emotional enablement; CR—composite reliability; AVE—average variance extracted.
Table 7.
Path coefficients for all generations in Model 2.
| Construct | Std. Weight | Unstd. Weight | S. E. | C.R. (t-Value) | p Value |
|---|---|---|---|---|---|
| AP <--- EN | 0.260 | 0.66 | 0.092 | 7.170 | *** |
| RP <--- AP | 0.116 | 0.043 | 0.013 | 3.238 | 0.001 |
| RP <--- EN | 0.352 | 0.33 | 0.038 | 8.588 | *** |
| RL <--- RP | 0.589 | 0.516 | 0.038 | 13.636 | *** |
| SW <--- RP | −0.522 | −0.107 | 0.093 | −1.156 | 0.248 |
| SW <--- EN | 0.585 | 0.113 | 0.066 | 2.704 | 0.044 |
| SW <--- AP | 0.368 | 0.028 | 0.023 | 1.232 | 0.218 |
| SW <--- RL | 0.815 | 0.191 | 0.099 | 2.923 | 0.034 |
Note: ***—statistical significance < 0.01. PE = physical experience; RP = cognitive job performance; AP = cognitive performance appraisal; RL = social relationships; EN = socio-emotional enablement, SW = subjective wellbeing at work.
Table 8.
Path coefficients for Gen X in Model 3.
| Construct | Std. Weight | Unstd. Weight | S. E. | C.R. (t-Value) | p Value |
|---|---|---|---|---|---|
| AP <--- EN | 0.201 | 0.479 | 0.233 | 2.055 | 0.040 |
| RP <--- AP | 0.213 | 0.087 | 0.038 | 2.271 | 0.023 |
| RP <--- EN | 0.353 | 0.342 | 0.104 | 3.297 | *** |
| RL <--- RP | 0.427 | 0.267 | 0.076 | 3.506 | *** |
| SW <--- RP | −0.078 | −0.025 | 0.137 | −0.179 | 0.858 |
| SW <--- EN | 0.715 | 0.218 | 0.114 | 3.917 | *** |
| SW <--- AP | −0.214 | −0.027 | 0.041 | −0.666 | 0.506 |
| SW <--- RL | 0.671 | 0.337 | 0.21 | 2.609 | 0.018 |
Note: ***—statistical significance <0.01. PE = physical experience; RP = cognitive job performance; AP = cognitive performance appraisal; RL = social relationships; EN= socio-emotional enablement; SW = subjective wellbeing at work.
Table 9.
Path coefficients for Gen Y in Model 4.
| Construct | Std. Weight | Unstd. Weight | S. E. | C.R. (t-Value) | p Value |
|---|---|---|---|---|---|
| AP<--- EN | 0.338 | 0.832 | 0.131 | 6.366 | *** |
| RP <--- AP | 0.117 | 0.050 | 0.023 | 2.140 | 0.032 |
| RP<--- EN | 0.243 | 0.255 | 0.062 | 4.083 | *** |
| RL<--- RP | 0.676 | 0.553 | 0.052 | 10.727 | *** |
| SW<--- RP | −0.617 | −0.105 | 0.117 | −0.902 | 0.367 |
| SW<--- EN | 0.650 | 0.117 | 0.084 | 6.784 | *** |
| SW<--- AP | 0.461 | 0.034 | 0.031 | 1.075 | 0.282 |
| SW<--- RL | 0.651 | 0.136 | 0.141 | 2.967 | 0.024 |
Note: ***—statistical significance < 0.01. PE = physical experience; RP = cognitive job performance; AP = cognitive performance appraisal; RL = social relationship; EN = socio-emotional enablement; SW = subjective wellbeing at work.
Table 10.
Path coefficients for Gen Z in Model 5.
| Construct | Std. Weight | Unstd. Weight | S. E. | C.R. (t-Value) | p Value |
|---|---|---|---|---|---|
| AP <--- EN | 0.207 | 0.538 | 0.151 | 3.568 | *** |
| RP <--- AP | 0.127 | 0.038 | 0.017 | 2.310 | 0.021 |
| RP <--- EN | 0.480 | 0.375 | 0.053 | 7.131 | *** |
| RL <--- RP | 0.524 | 0.540 | 0.071 | 7.646 | *** |
| SW <--- RP | 0.333 | 0.107 | 0.193 | 0.553 | 0.580 |
| SW <--- EN | 0.293 | 0.074 | 0.123 | 0.598 | 0.55 |
| SW <--- AP | −0.096 | −0.009 | 0.038 | −0.245 | 0.807 |
| SW <--- RL | 0.642 | 0.200 | 0.158 | 9.268 | *** |
Note: ***—statistical significance < 0.01. PE = physical experience; RP = cognitive job performance; AP = cognitive performance appraisal; RL = social relationships; EN = socio-emotional enablement; SW = Subjective wellbeing at work.
Publisher’s Note: MDPI stays neutral with regard to jurisdictional claims in published maps and institutional affiliations. |
© 2020 by the authors. Licensee MDPI, Basel, Switzerland. This article is an open access article distributed under the terms and conditions of the Creative Commons Attribution (CC BY) license (http://creativecommons.org/licenses/by/4.0/).
Share and Cite
MDPI and ACS Style
Smaliukiene, R.; Bekesiene, S. Towards Sustainable Human Resources: How Generational Differences Impact Subjective Wellbeing in the Military? Sustainability 2020, 12, 10016. https://0-doi-org.brum.beds.ac.uk/10.3390/su122310016
AMA Style
Smaliukiene R, Bekesiene S. Towards Sustainable Human Resources: How Generational Differences Impact Subjective Wellbeing in the Military? Sustainability. 2020; 12(23):10016. https://0-doi-org.brum.beds.ac.uk/10.3390/su122310016
Chicago/Turabian StyleSmaliukiene, Rasa, and Svajone Bekesiene. 2020. "Towards Sustainable Human Resources: How Generational Differences Impact Subjective Wellbeing in the Military?" Sustainability 12, no. 23: 10016. https://0-doi-org.brum.beds.ac.uk/10.3390/su122310016
Note that from the first issue of 2016, this journal uses article numbers instead of page numbers. See further details here.