Modeling Flash Floods and Induced Recharge into Alluvial Aquifers Using Multi-Temporal Remote Sensing and Electrical Resistivity Imaging


 , ,
, ,
Abstract
:1. Introduction
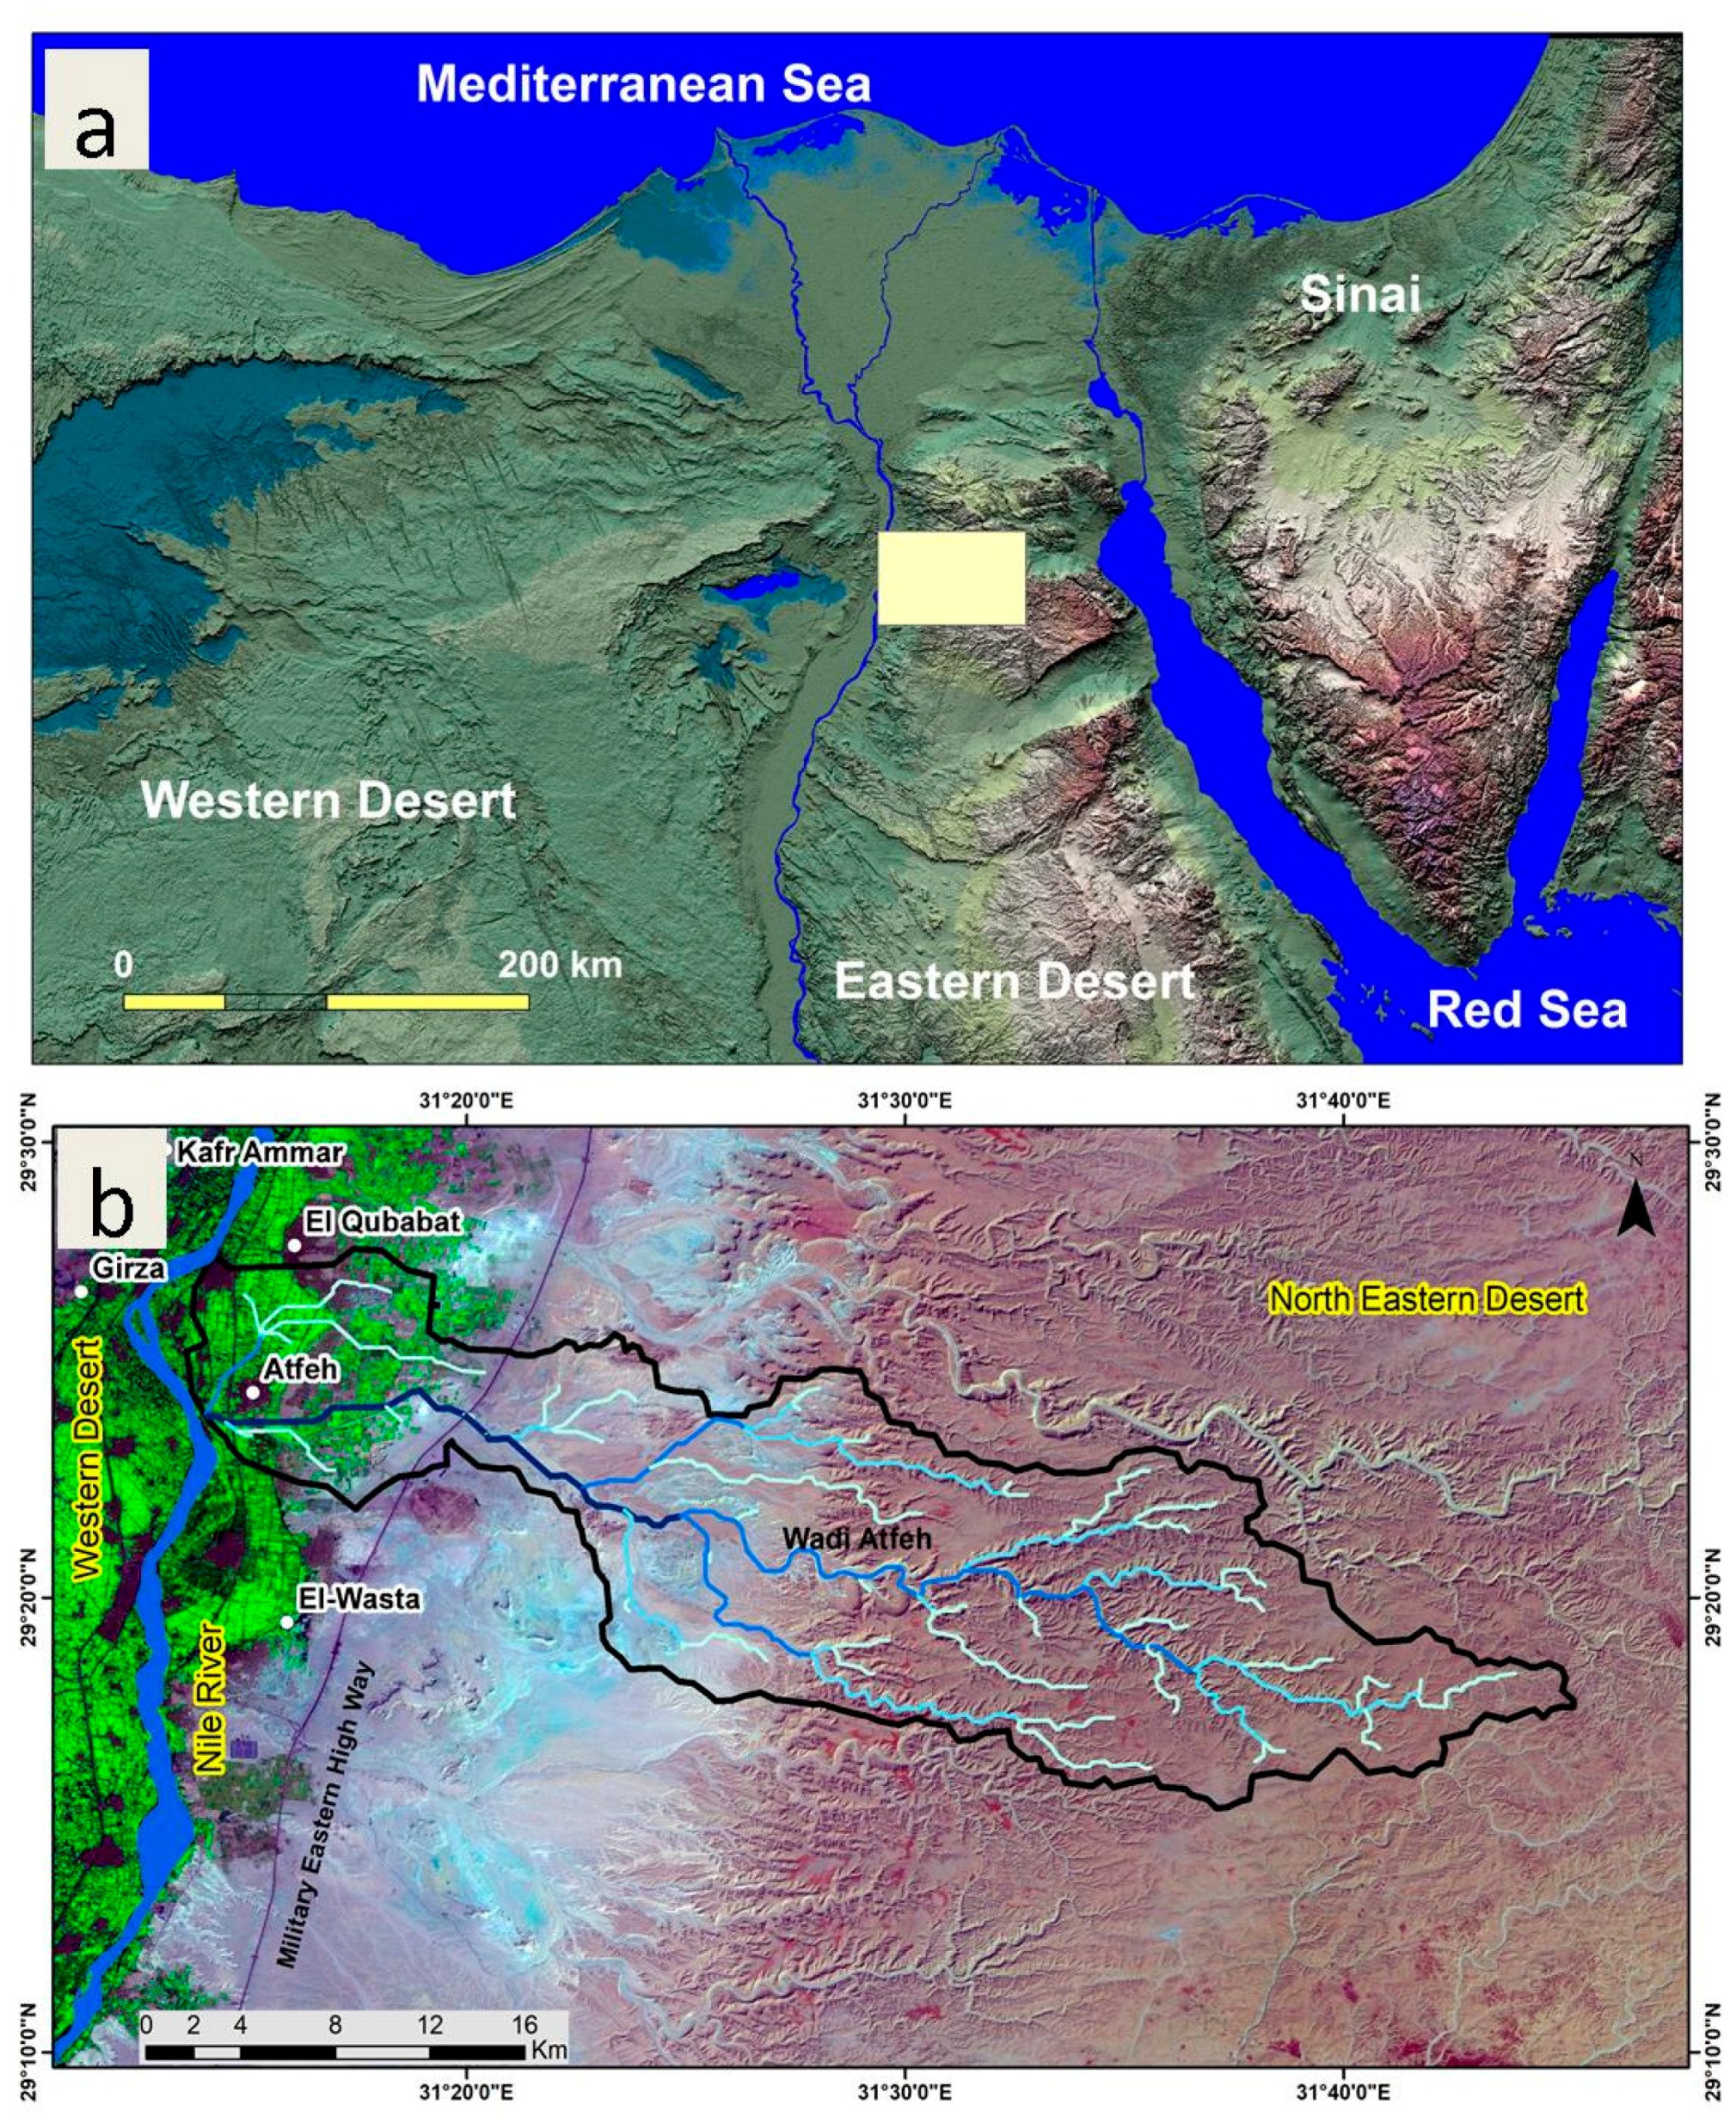
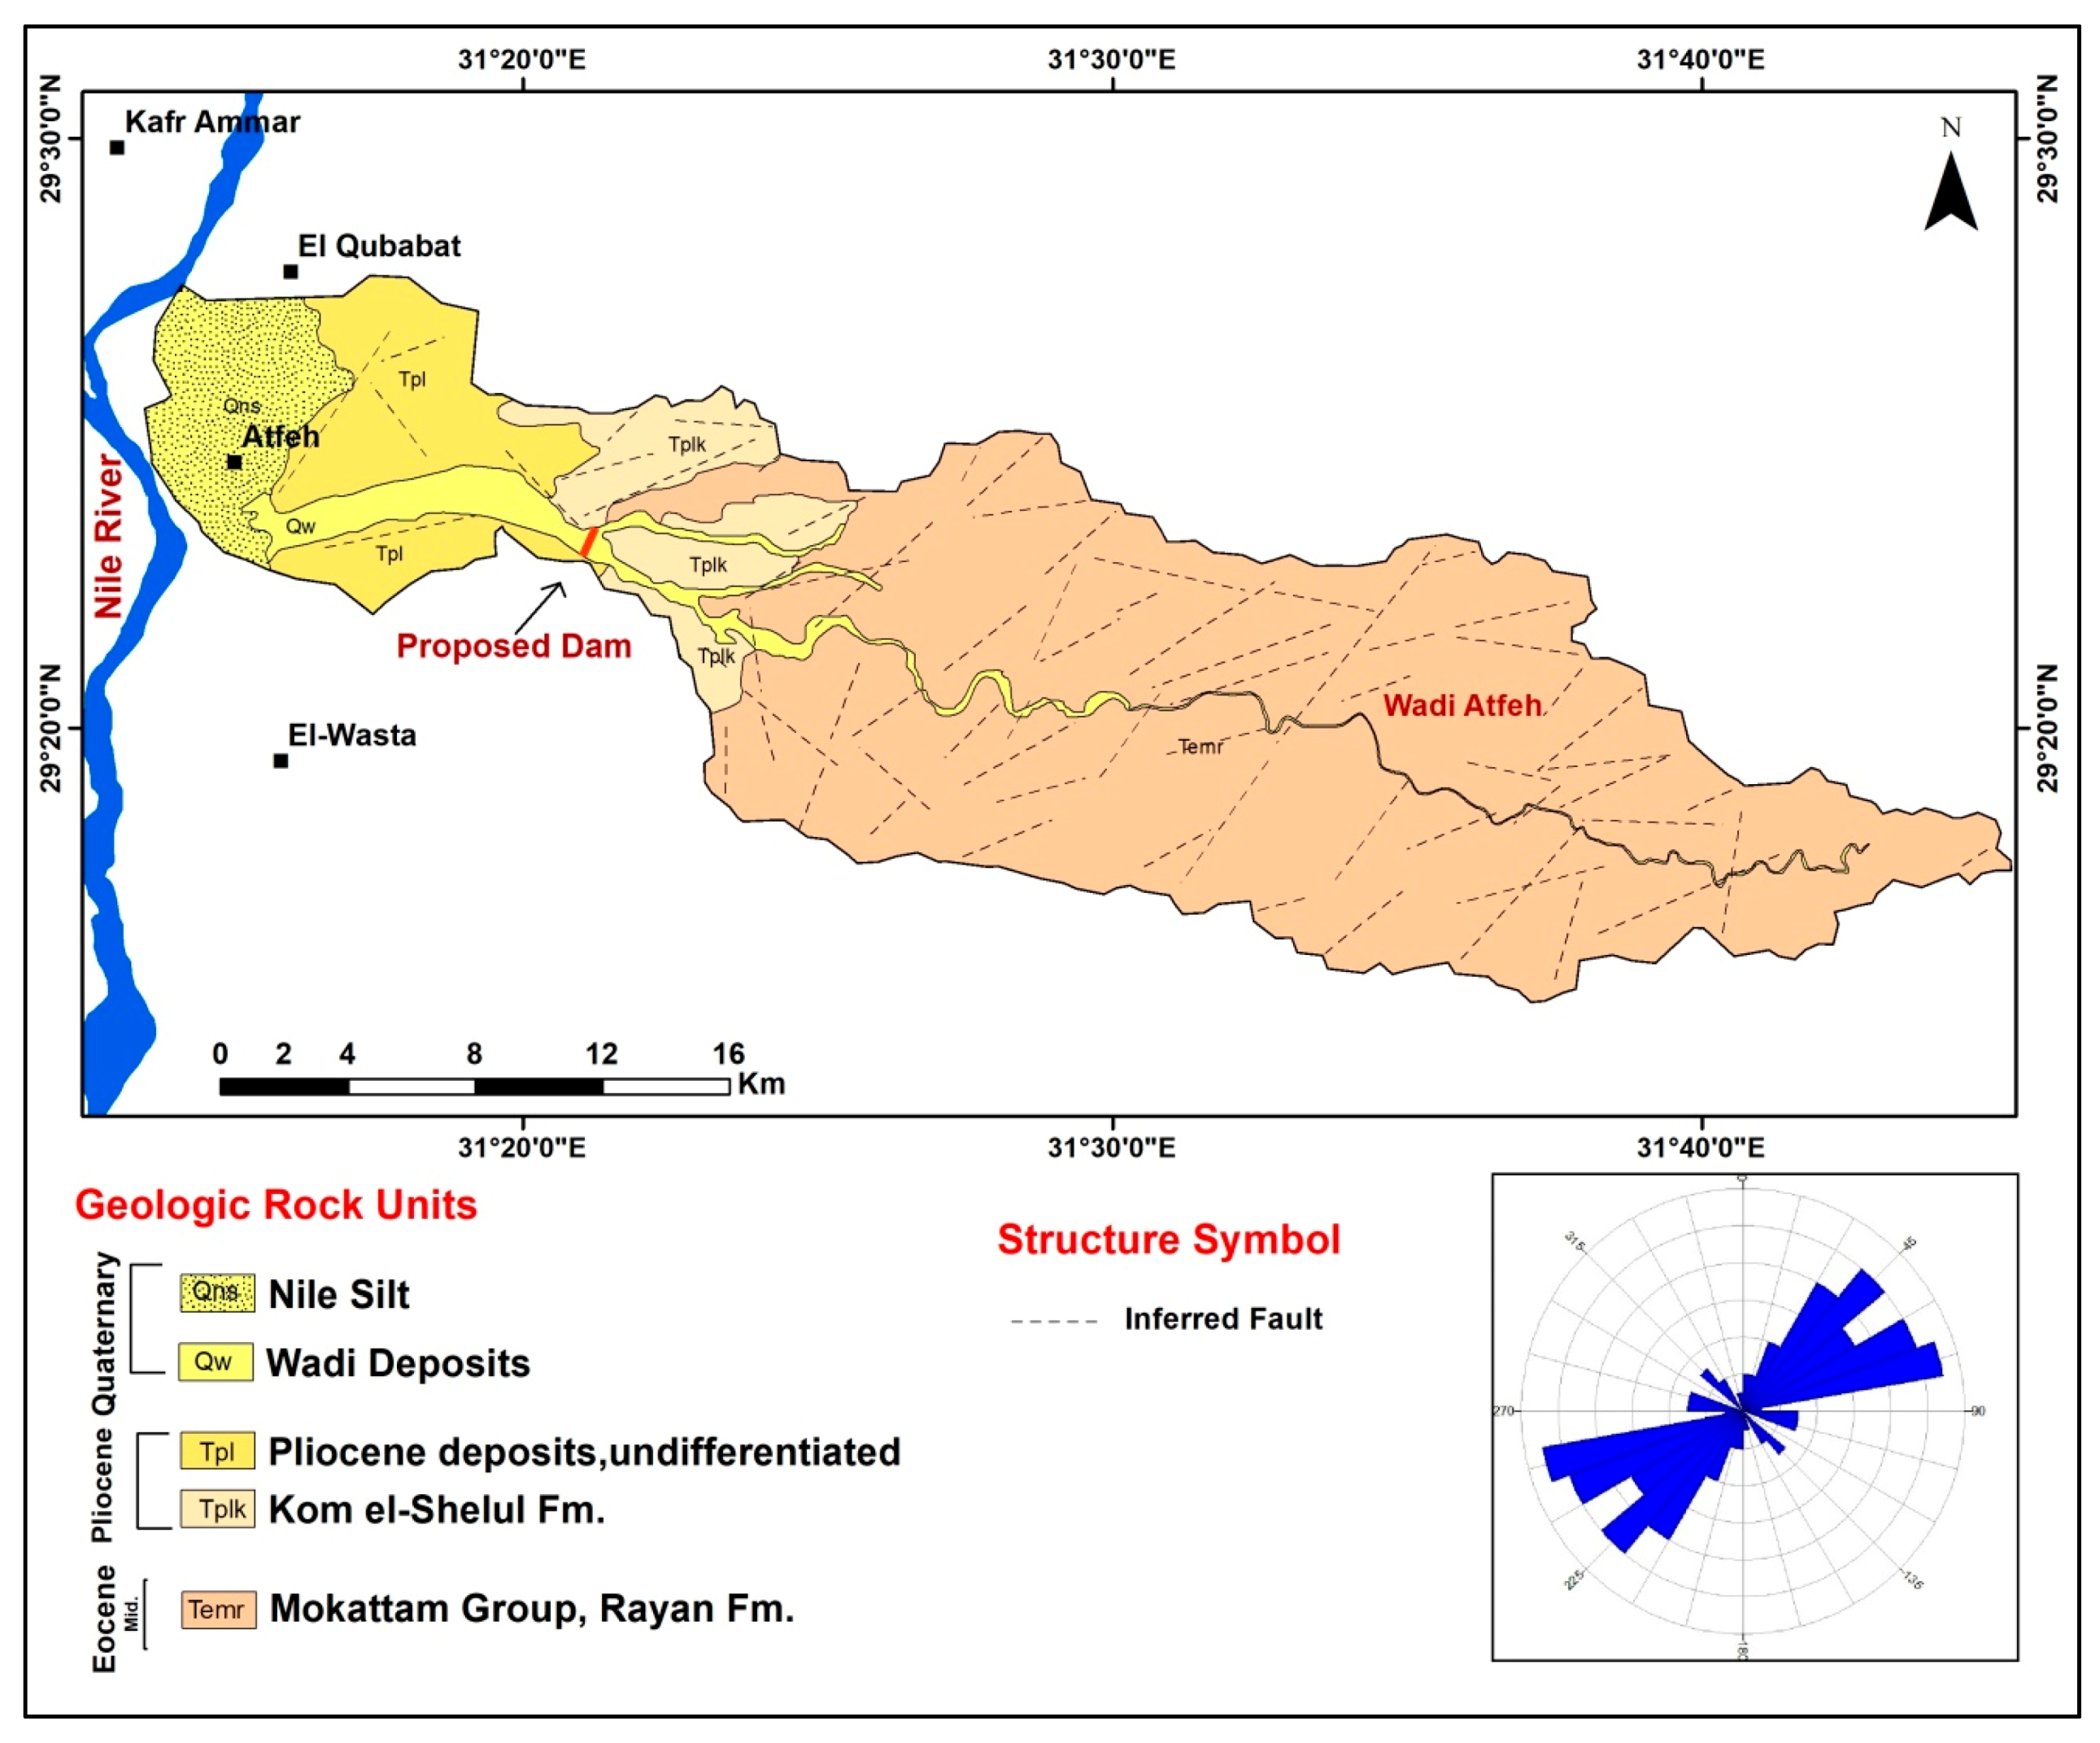
2. Site Description
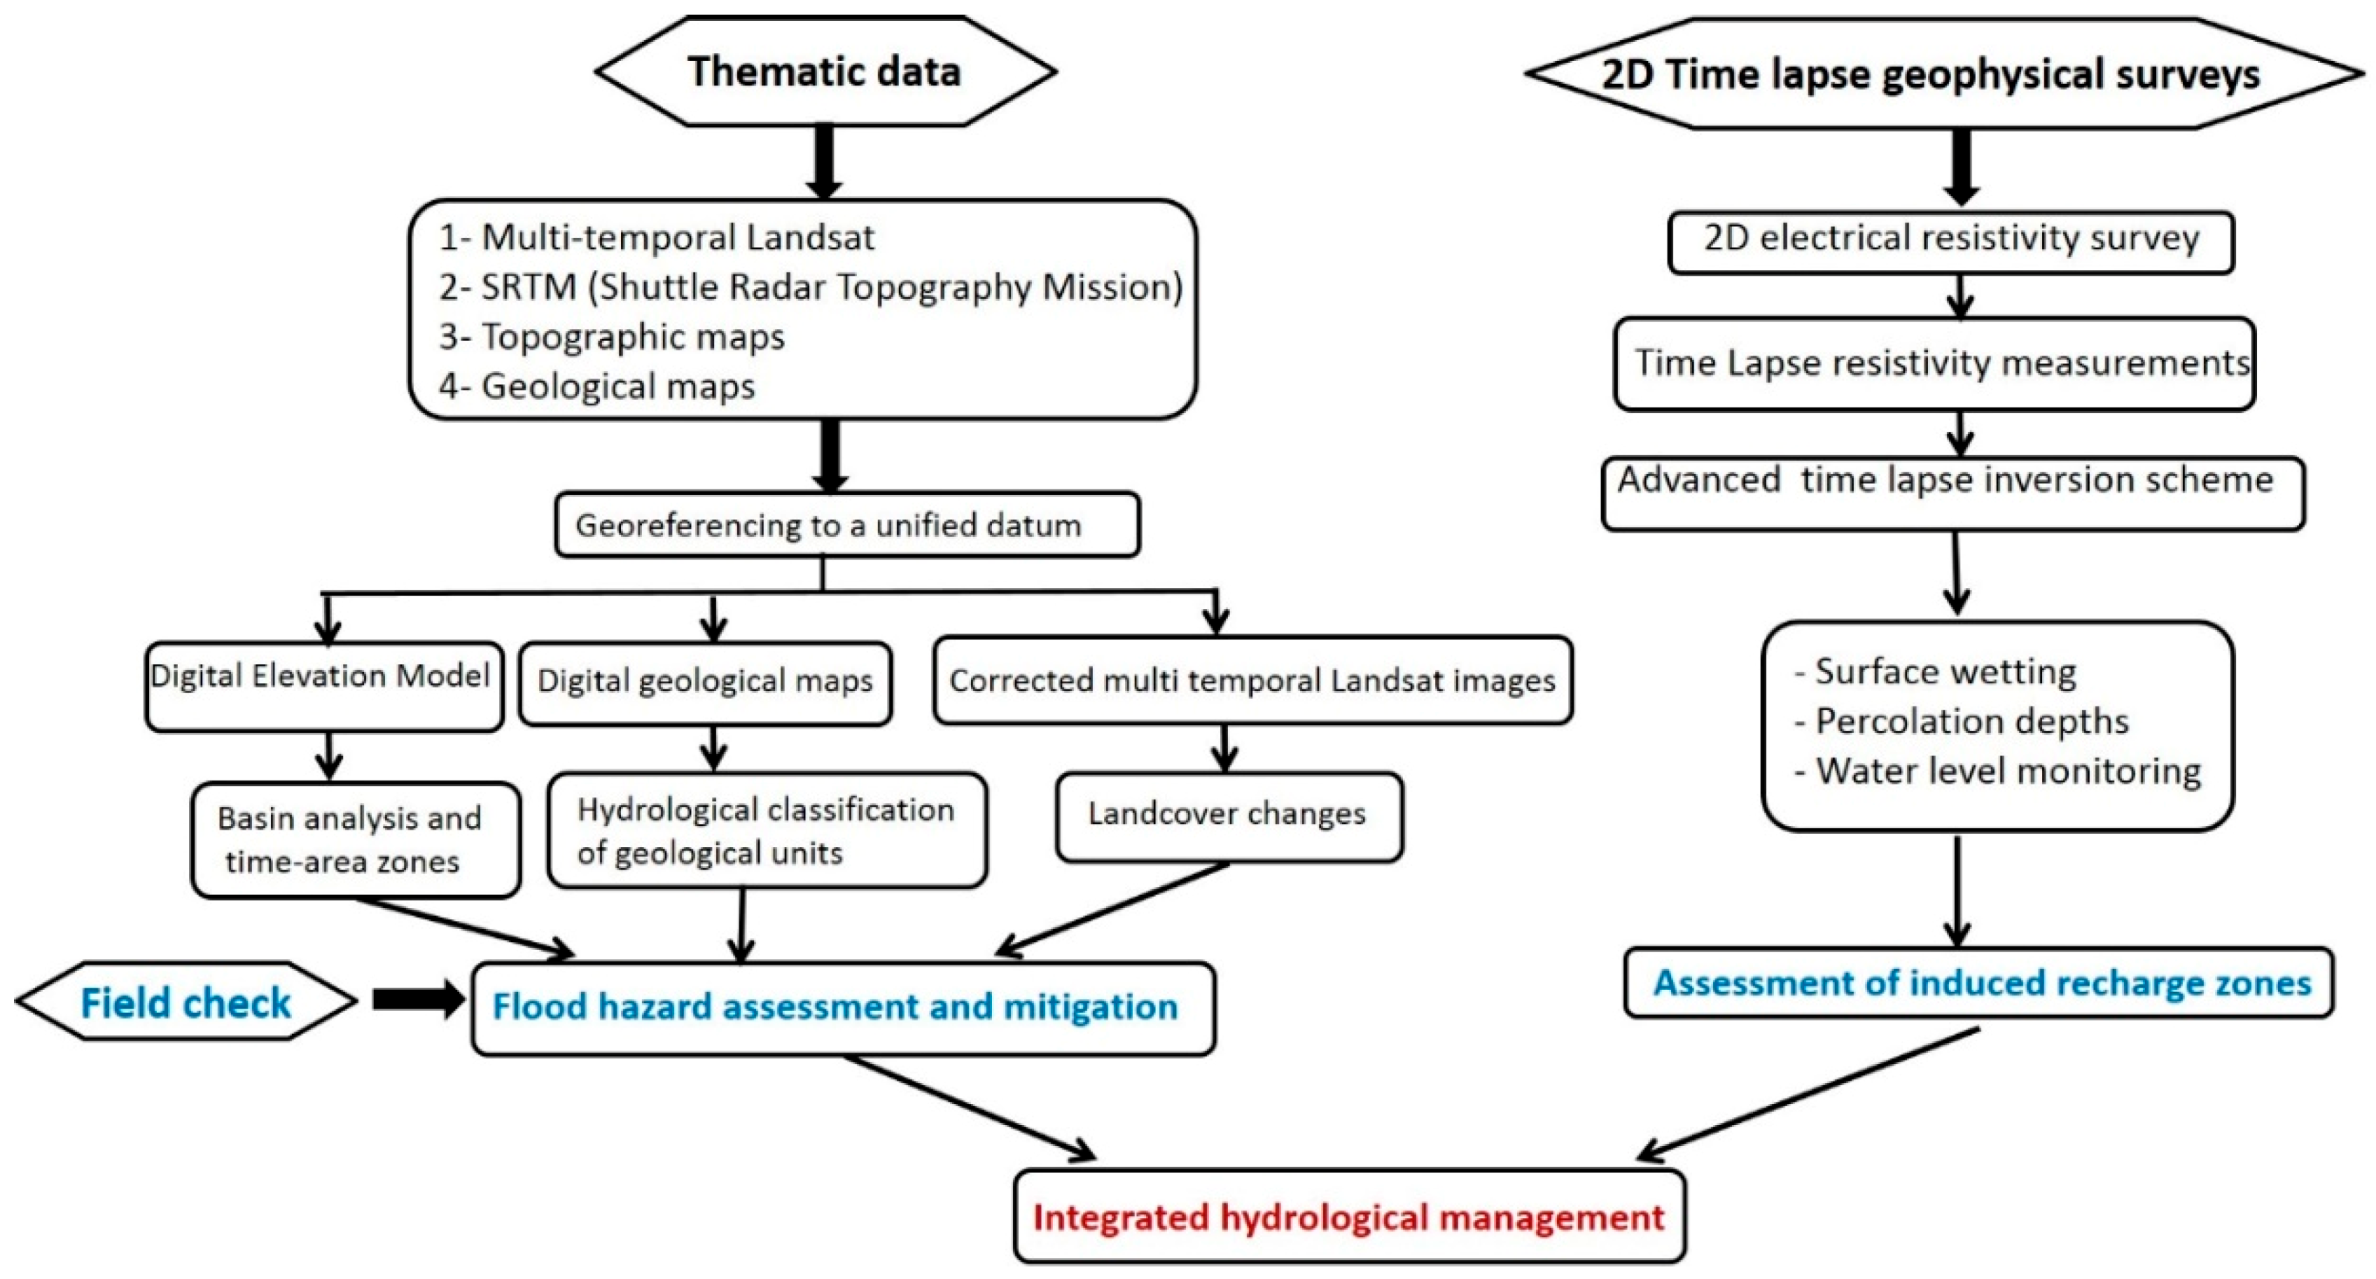
3. Materials and Methods
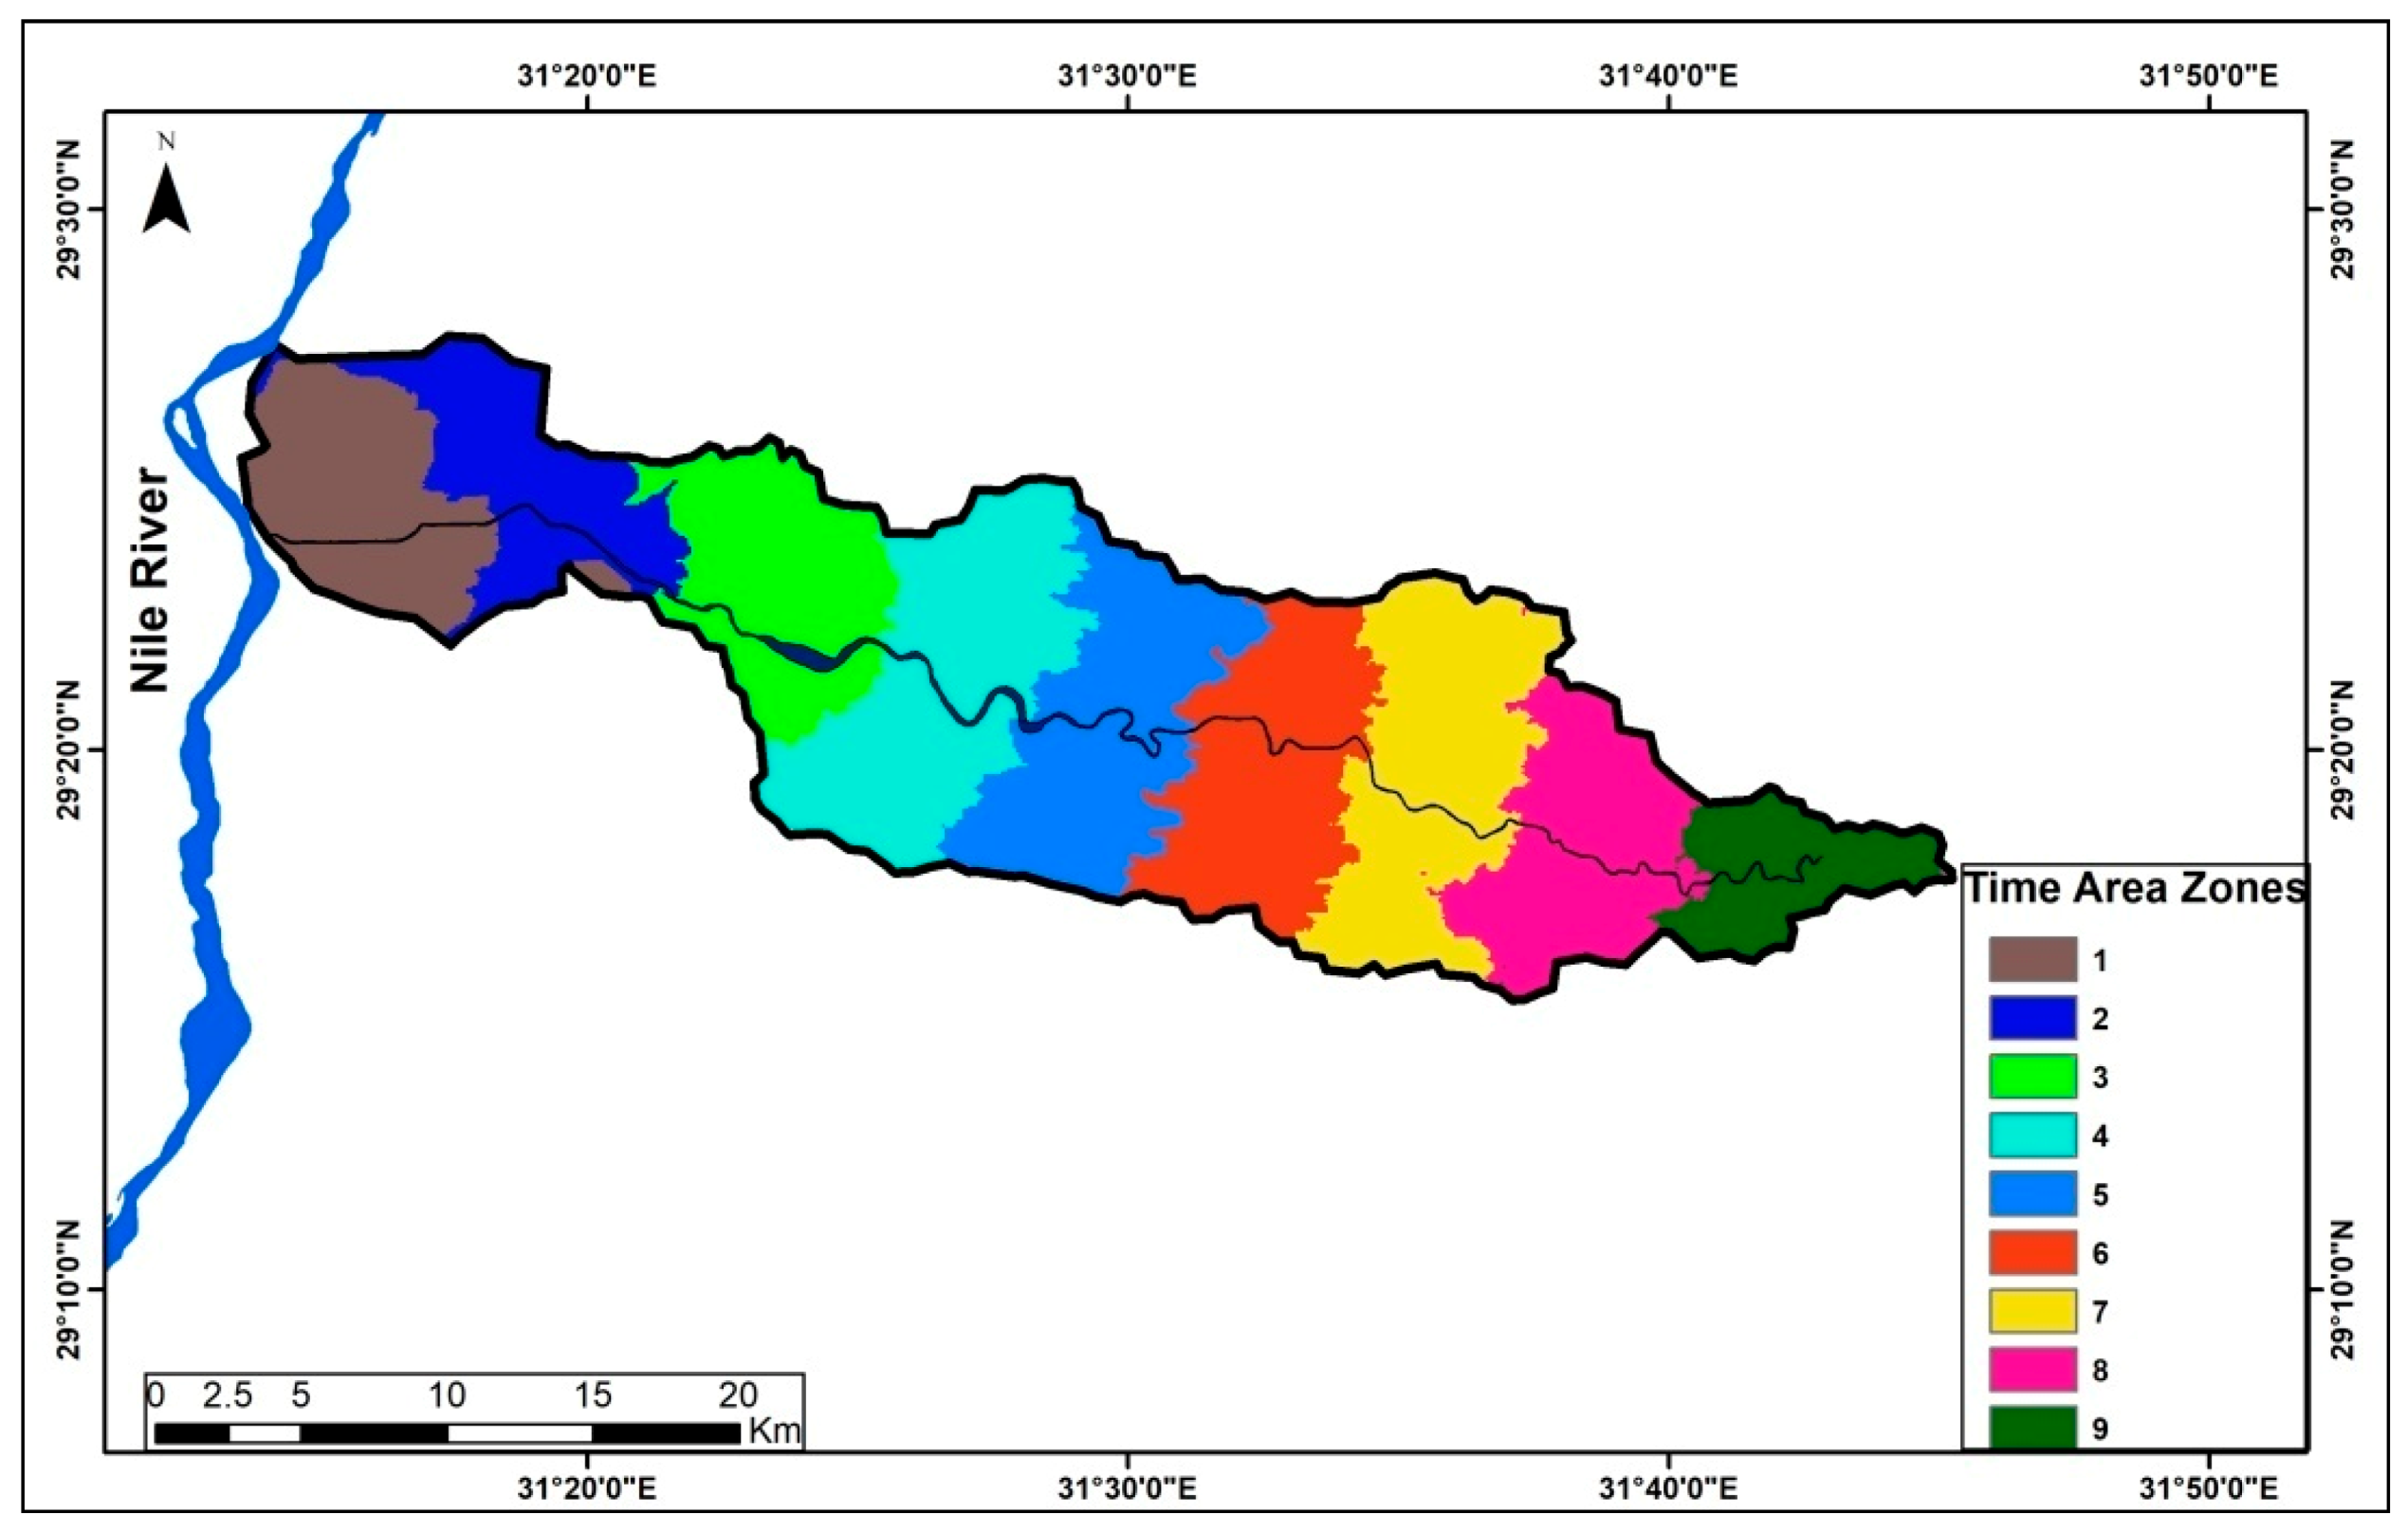
3.1. Remote Sensing Datasets and the Surface Hydrological Parameters
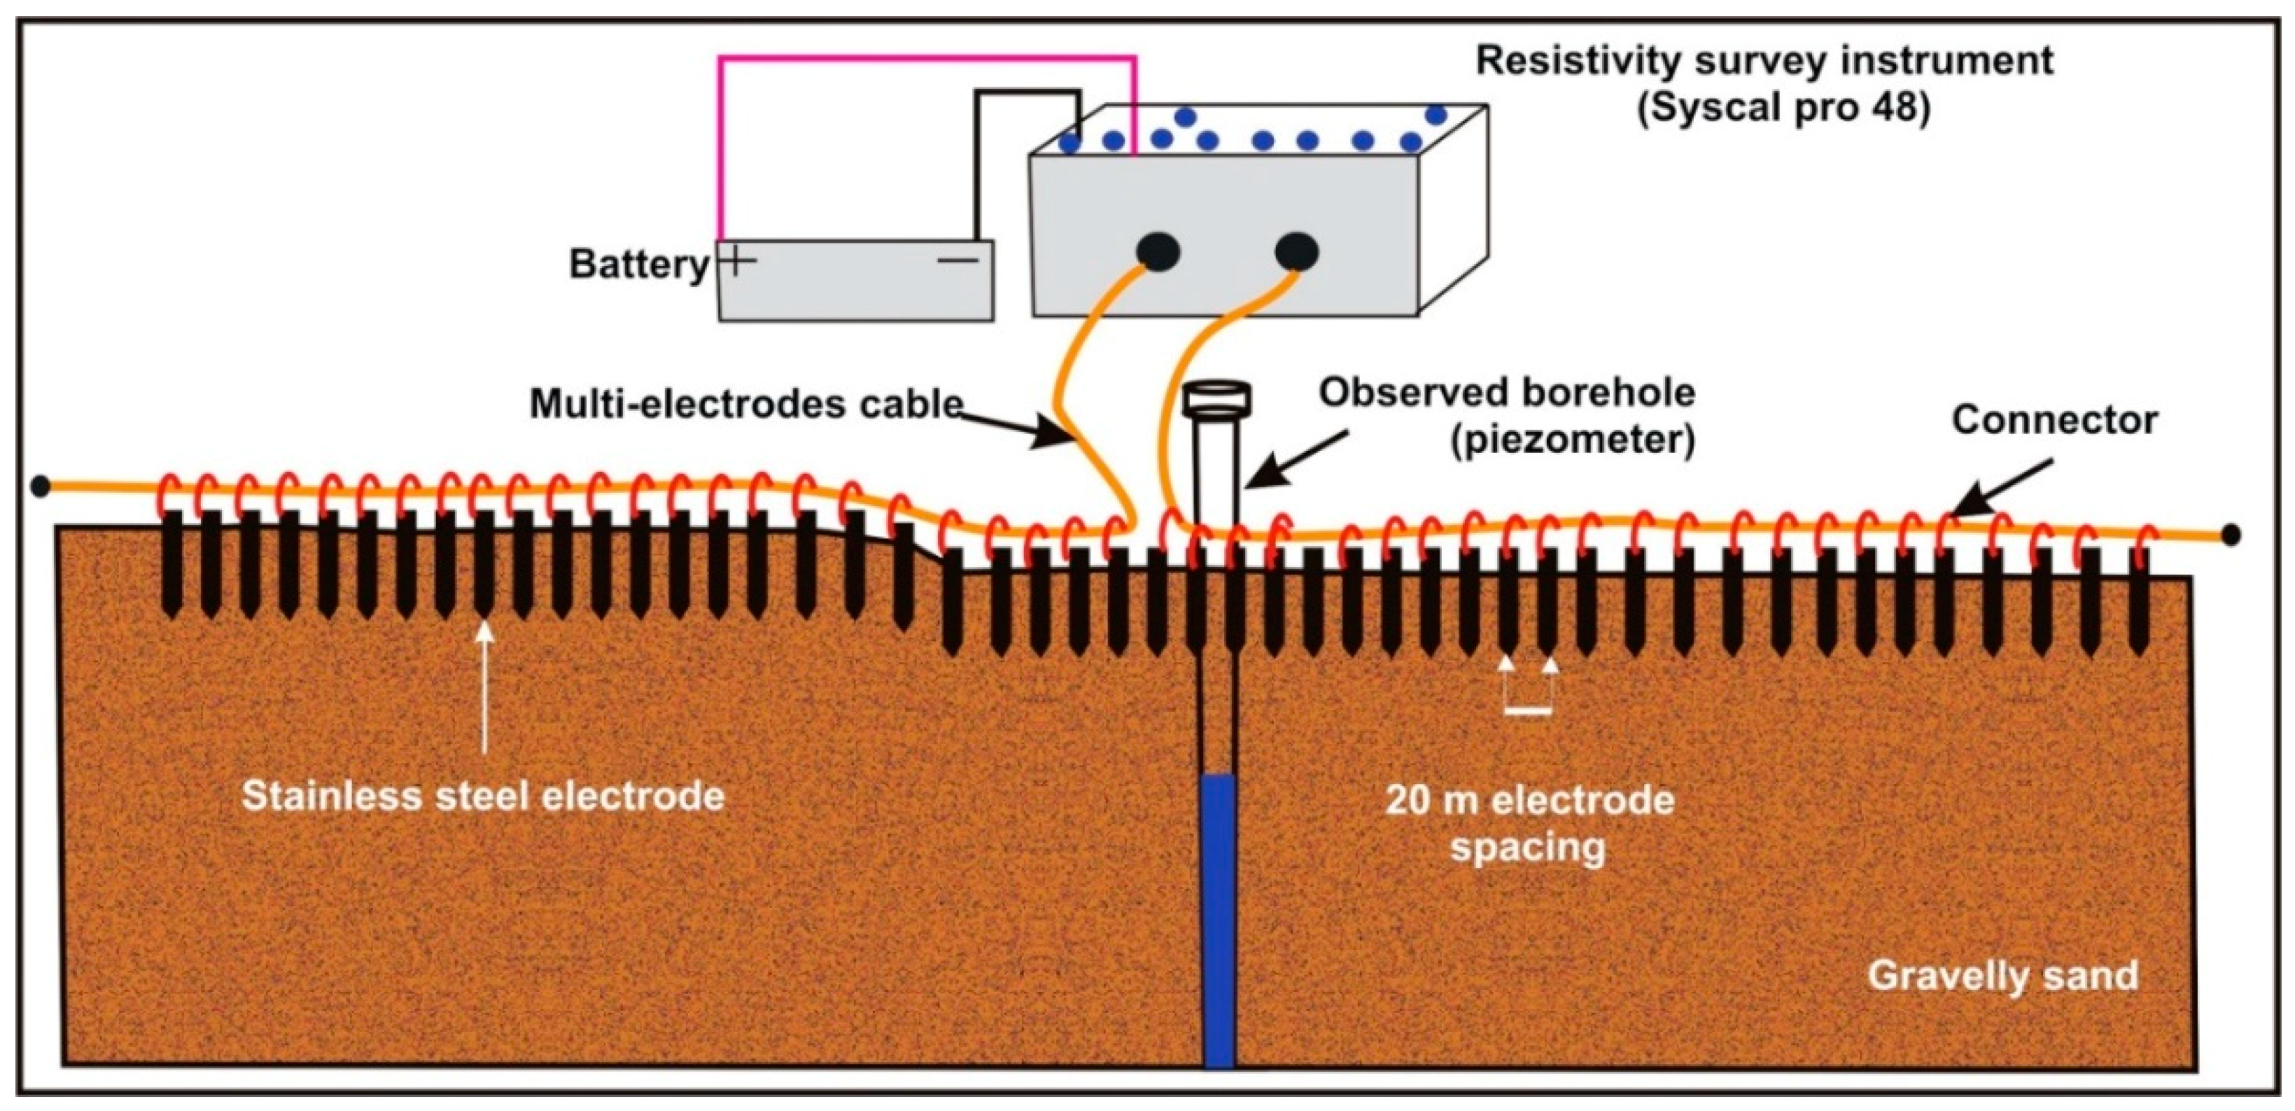
3.2. Geophysical Surveys and Time-Lapse ERI Measurements
4. Results and Discussion
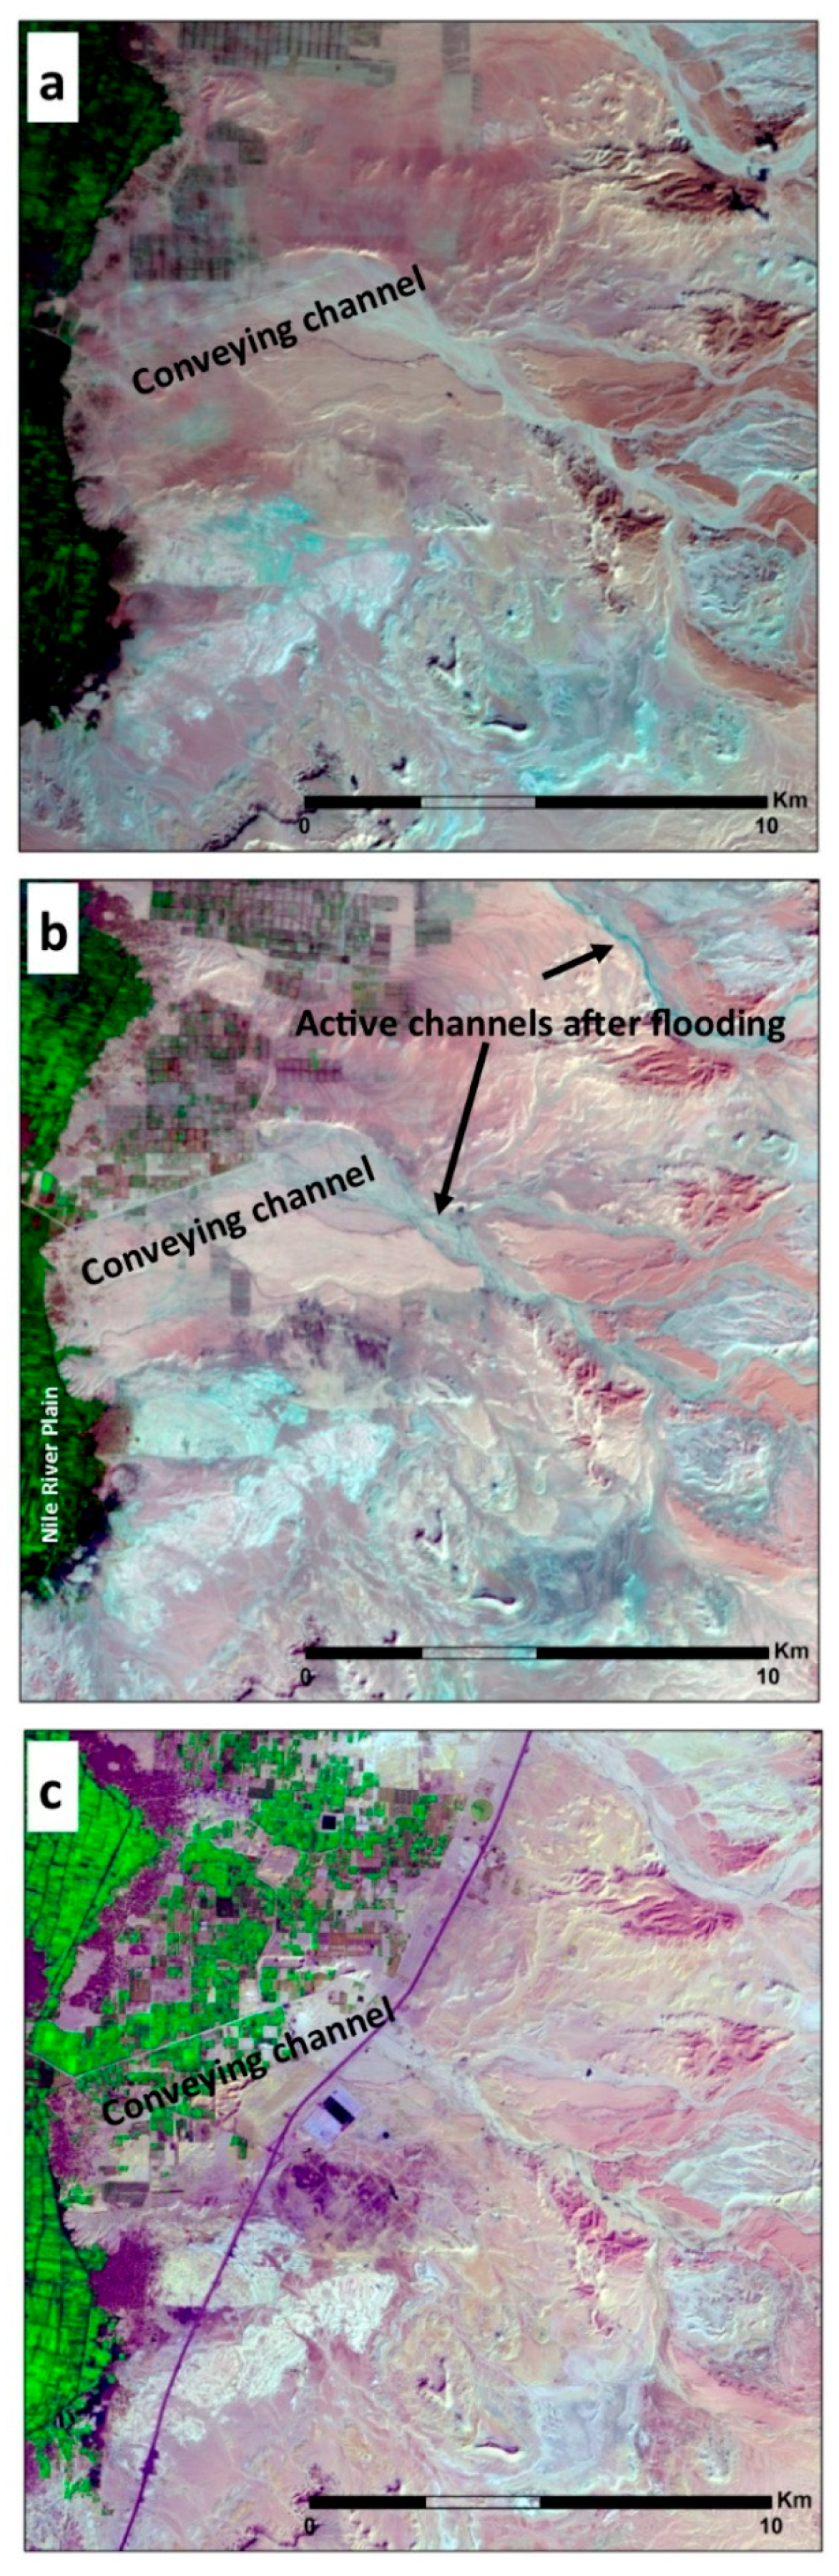
4.1. Regional Geomorphological and Surface Hydrological Investigation
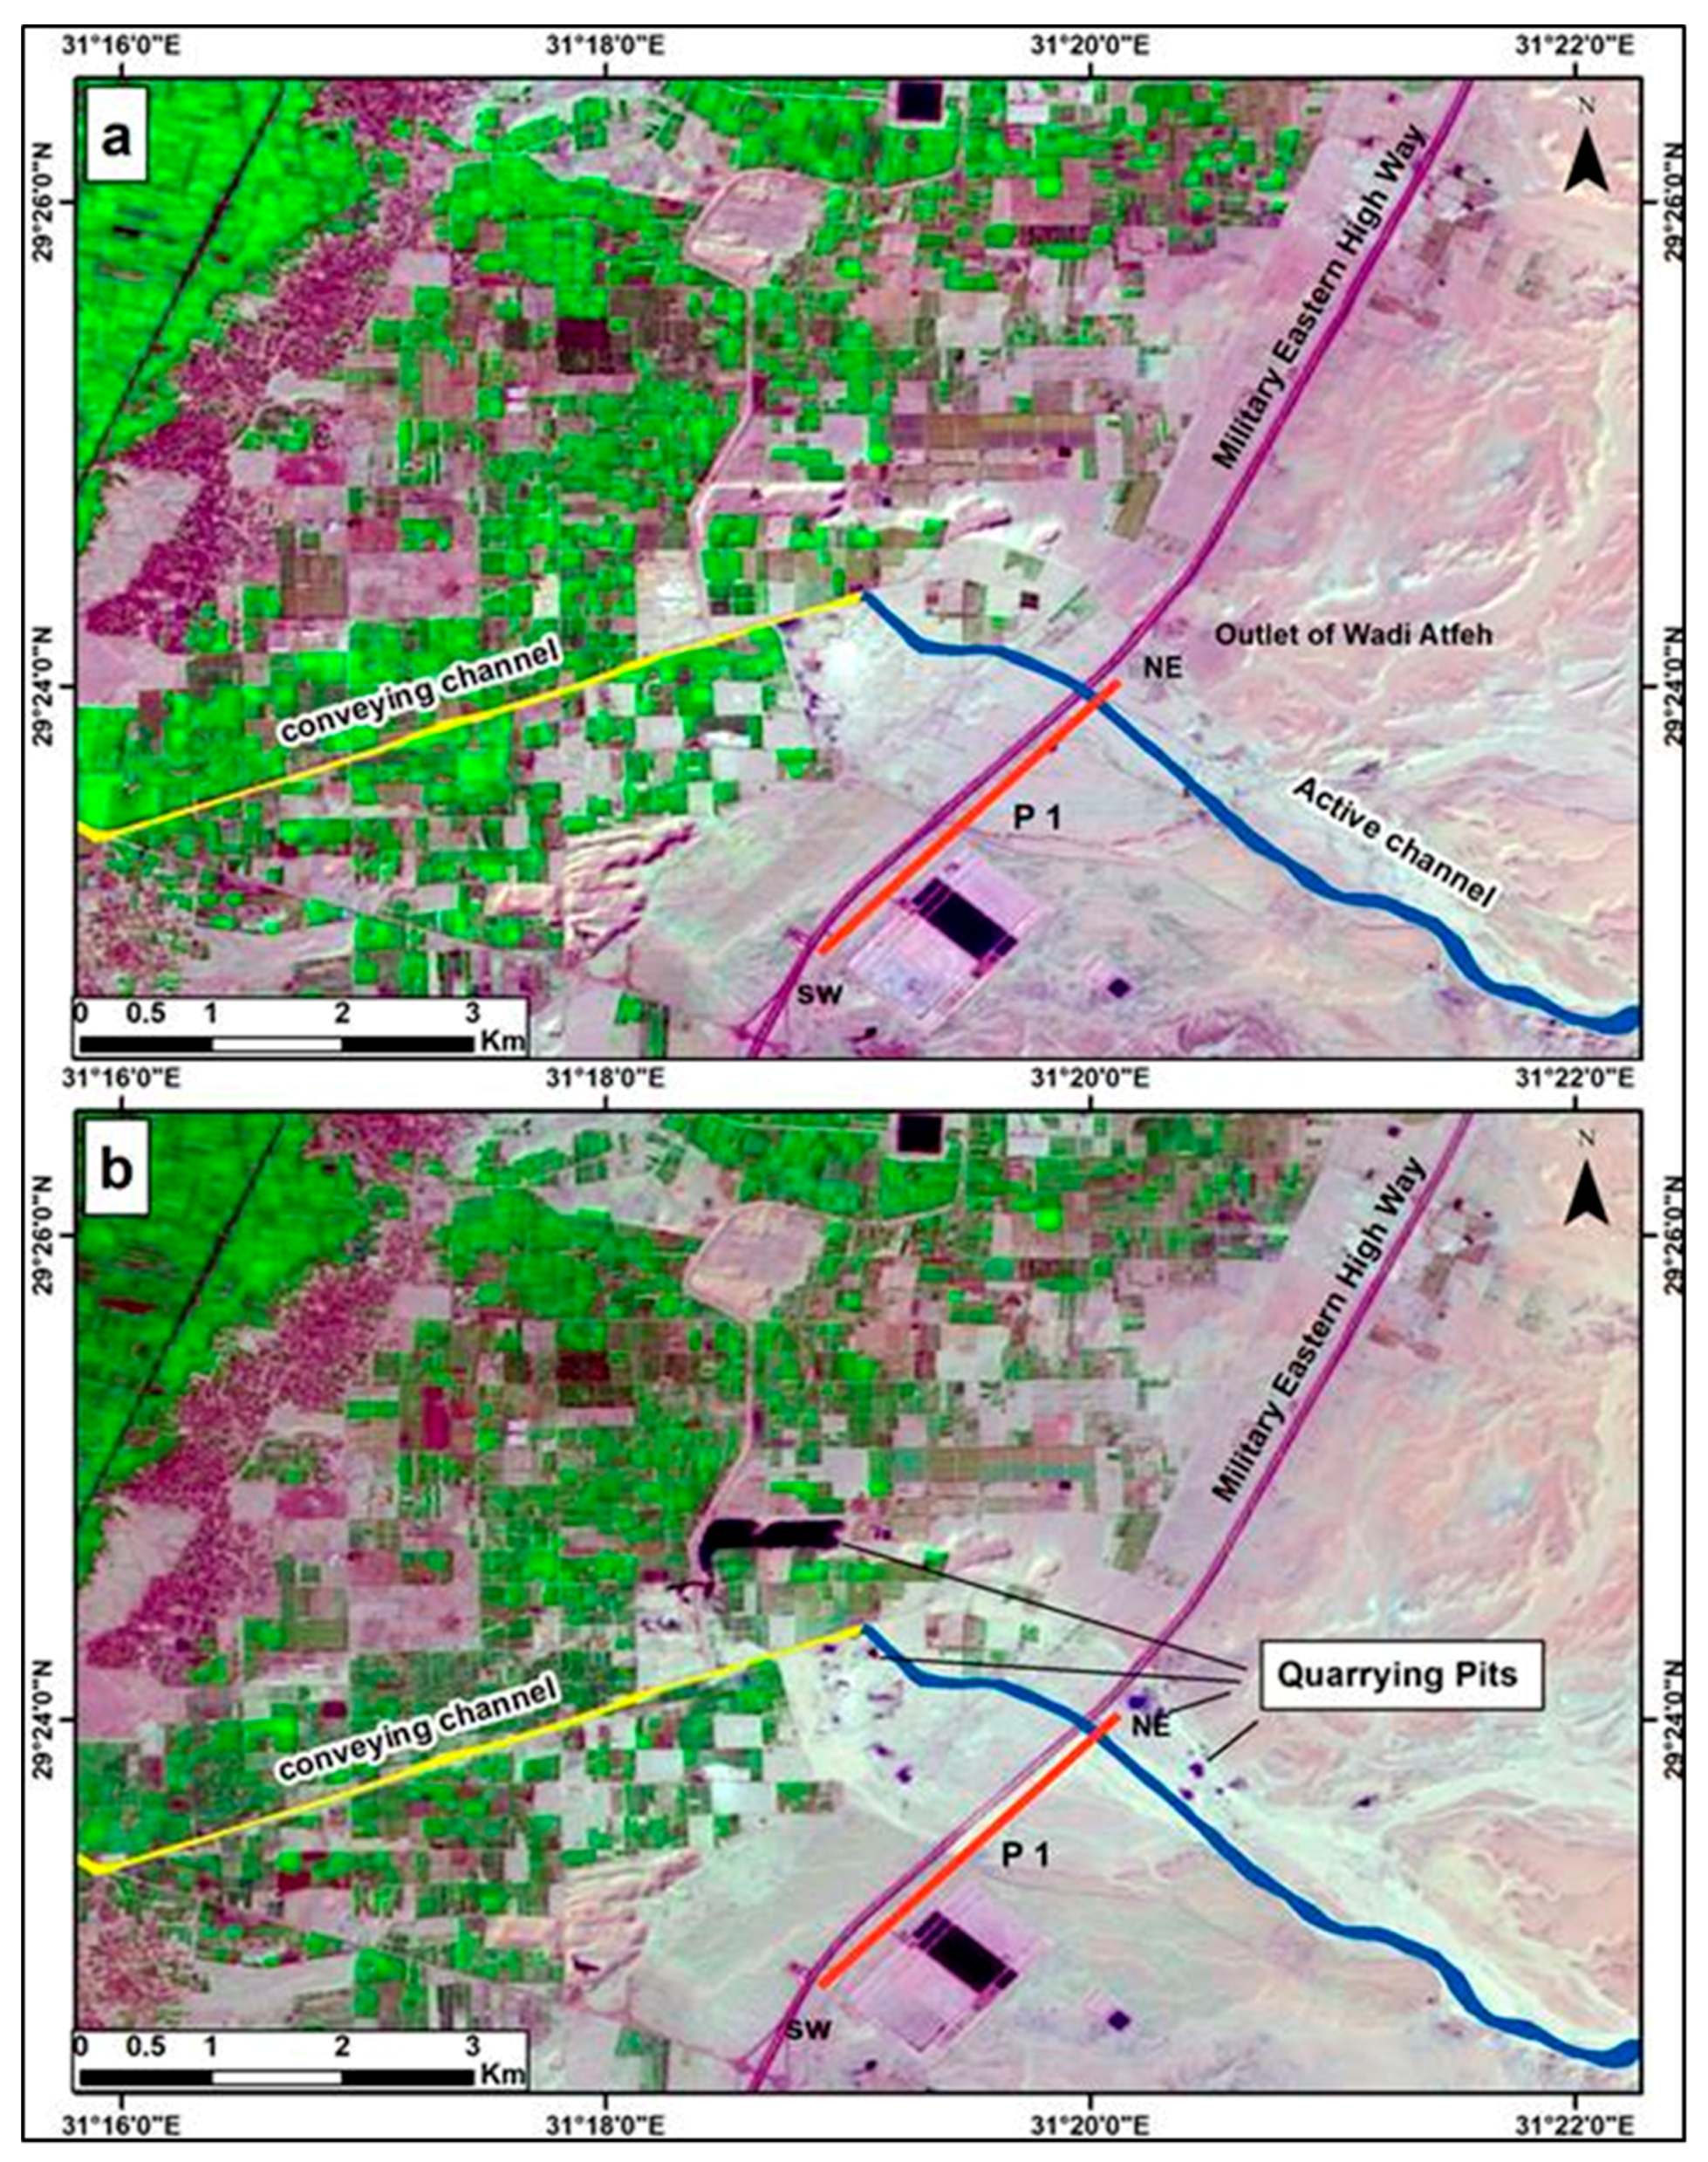
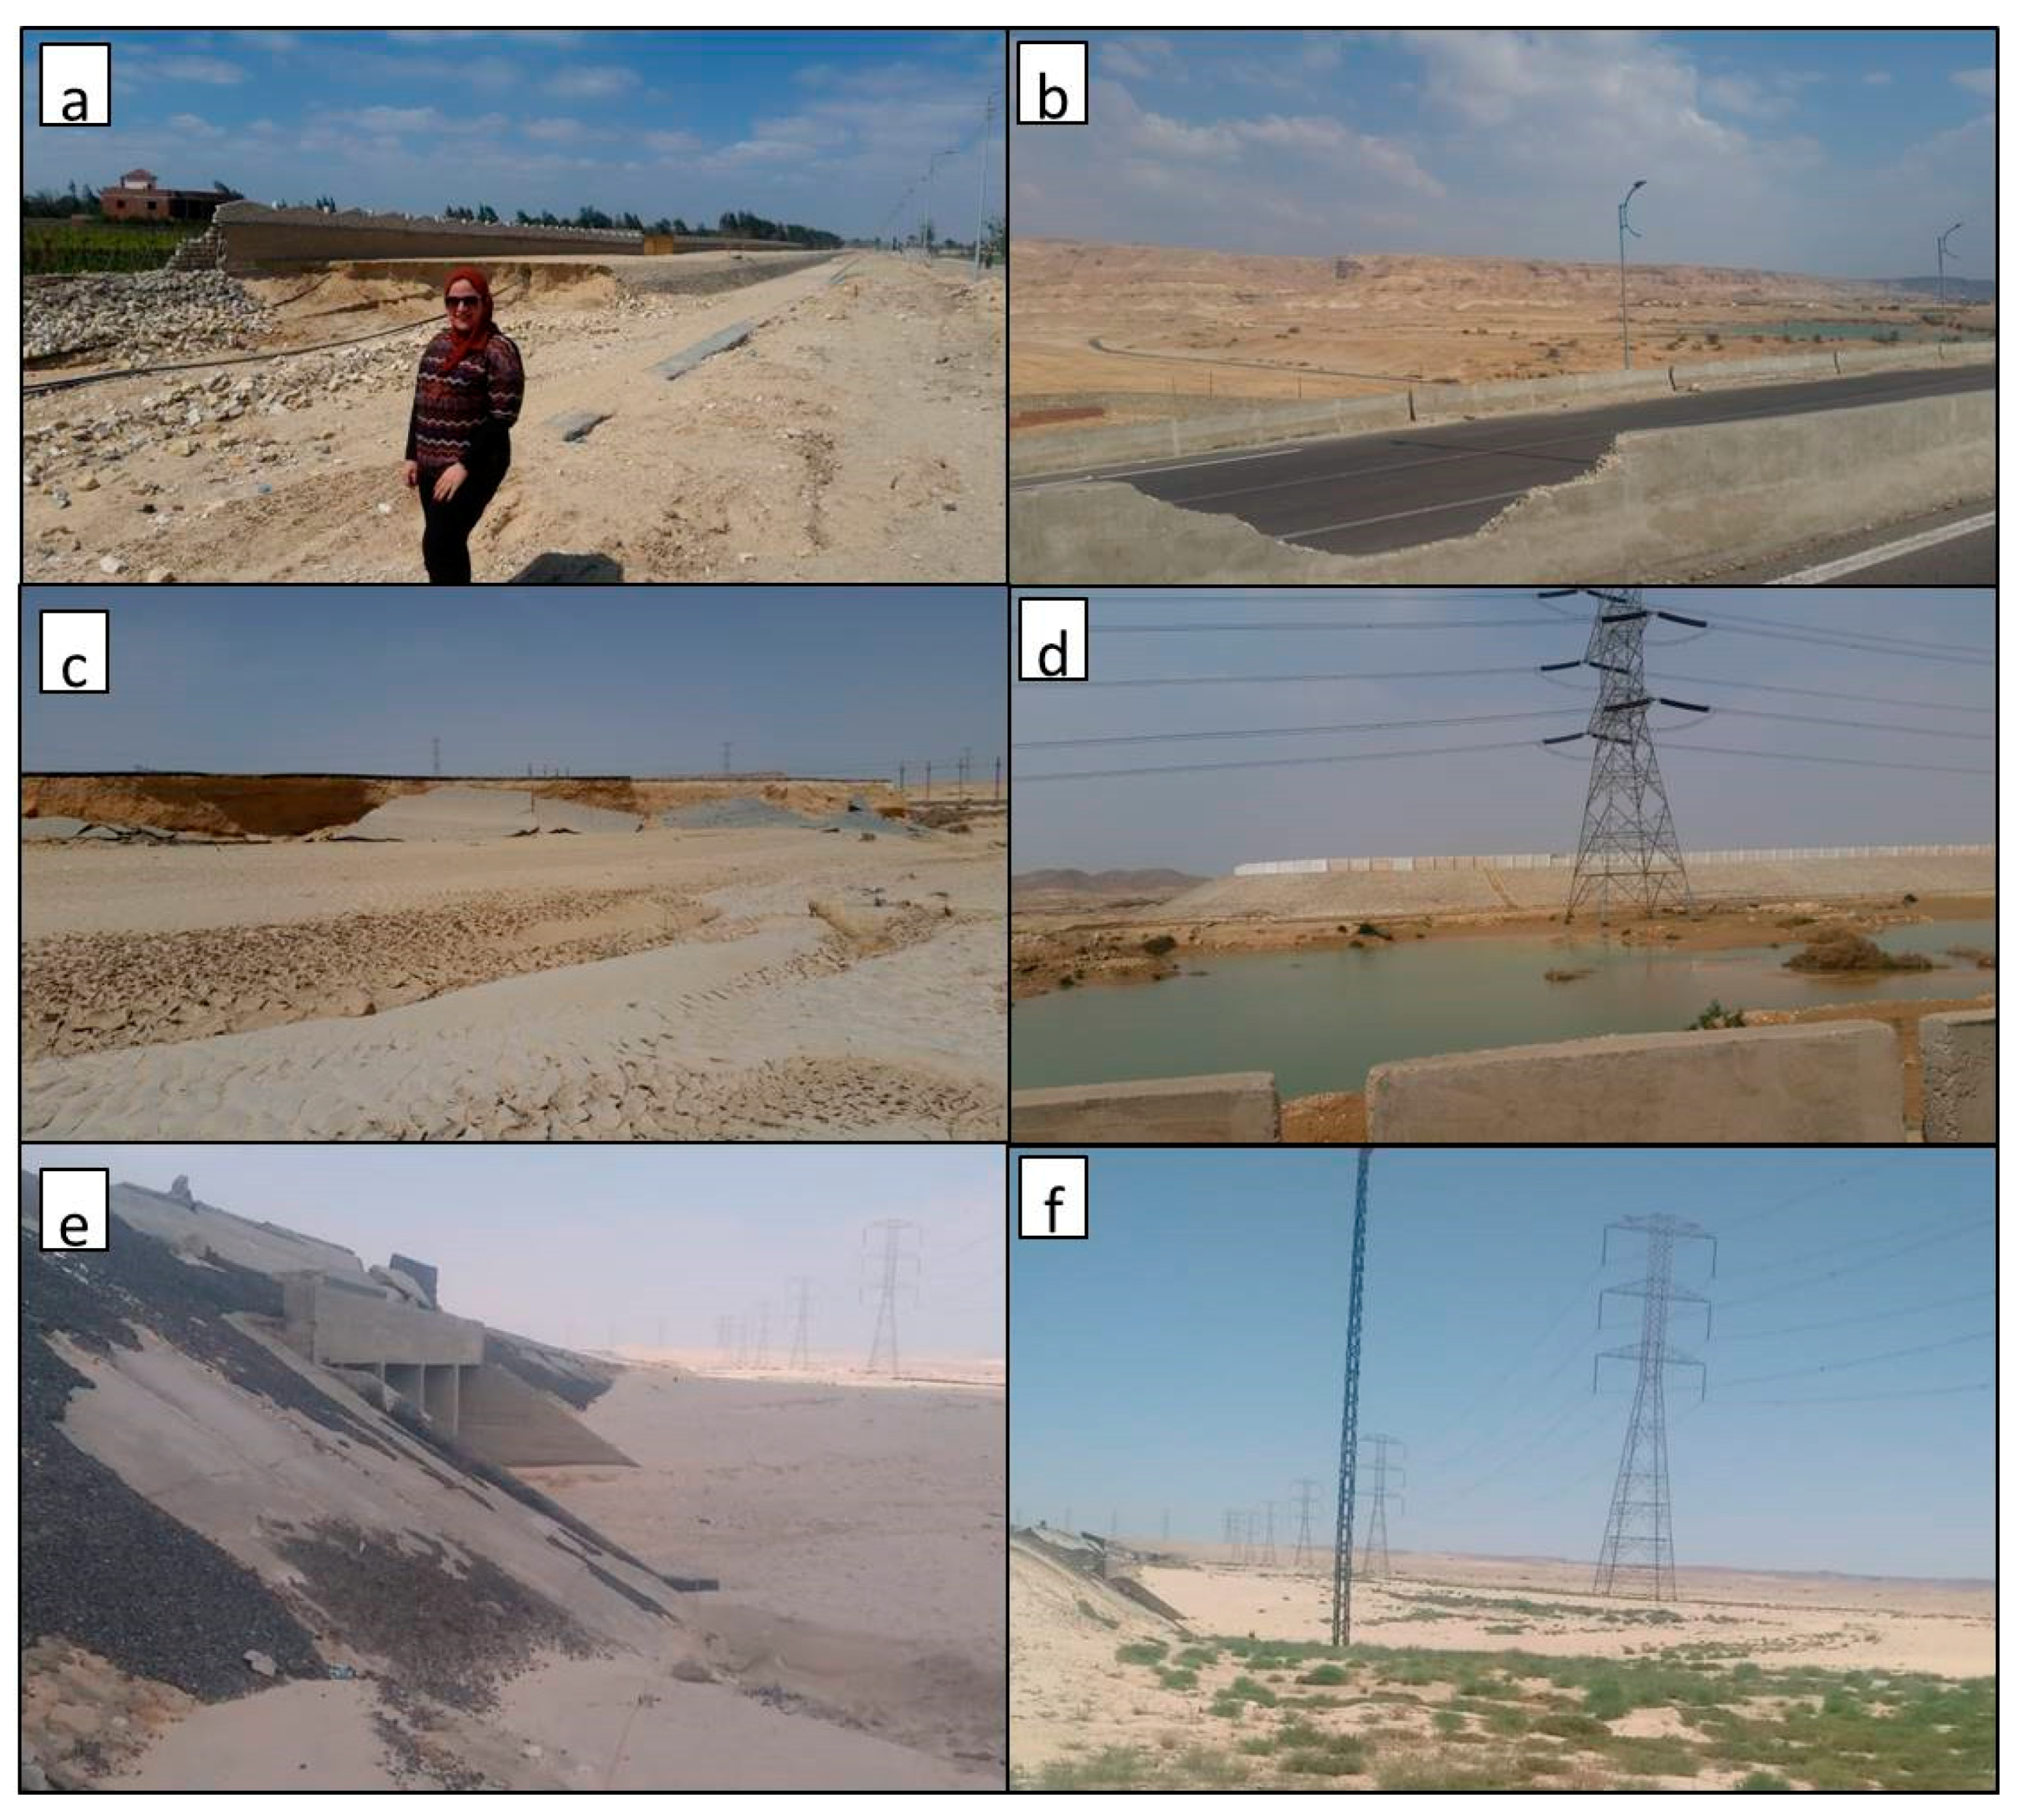
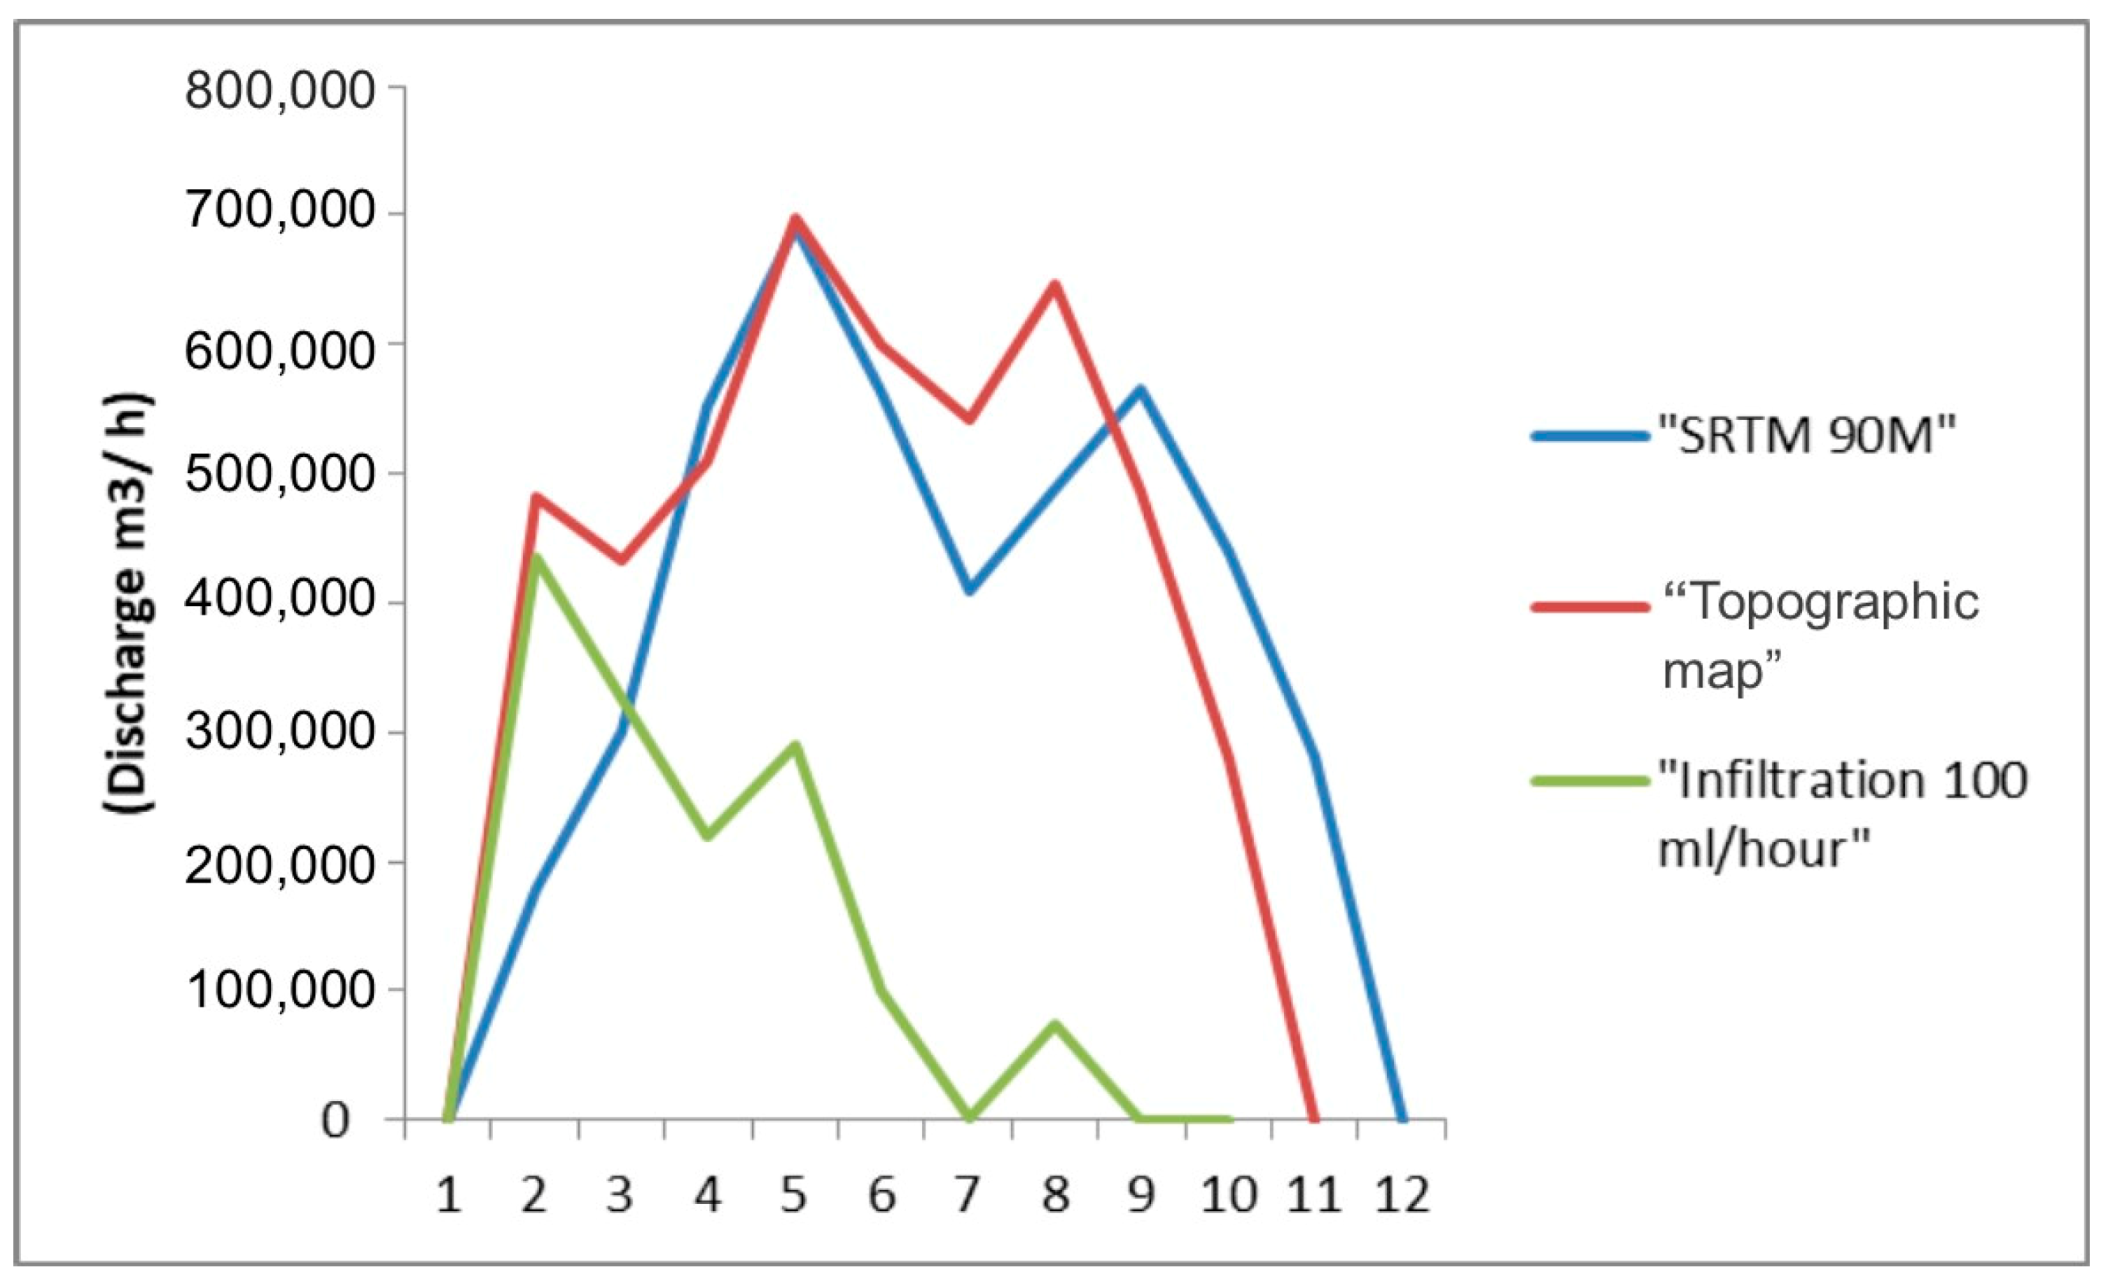
4.2. Flash Flood Assessment Using Different Datasets: Limitations, Capabilities, and Potentials
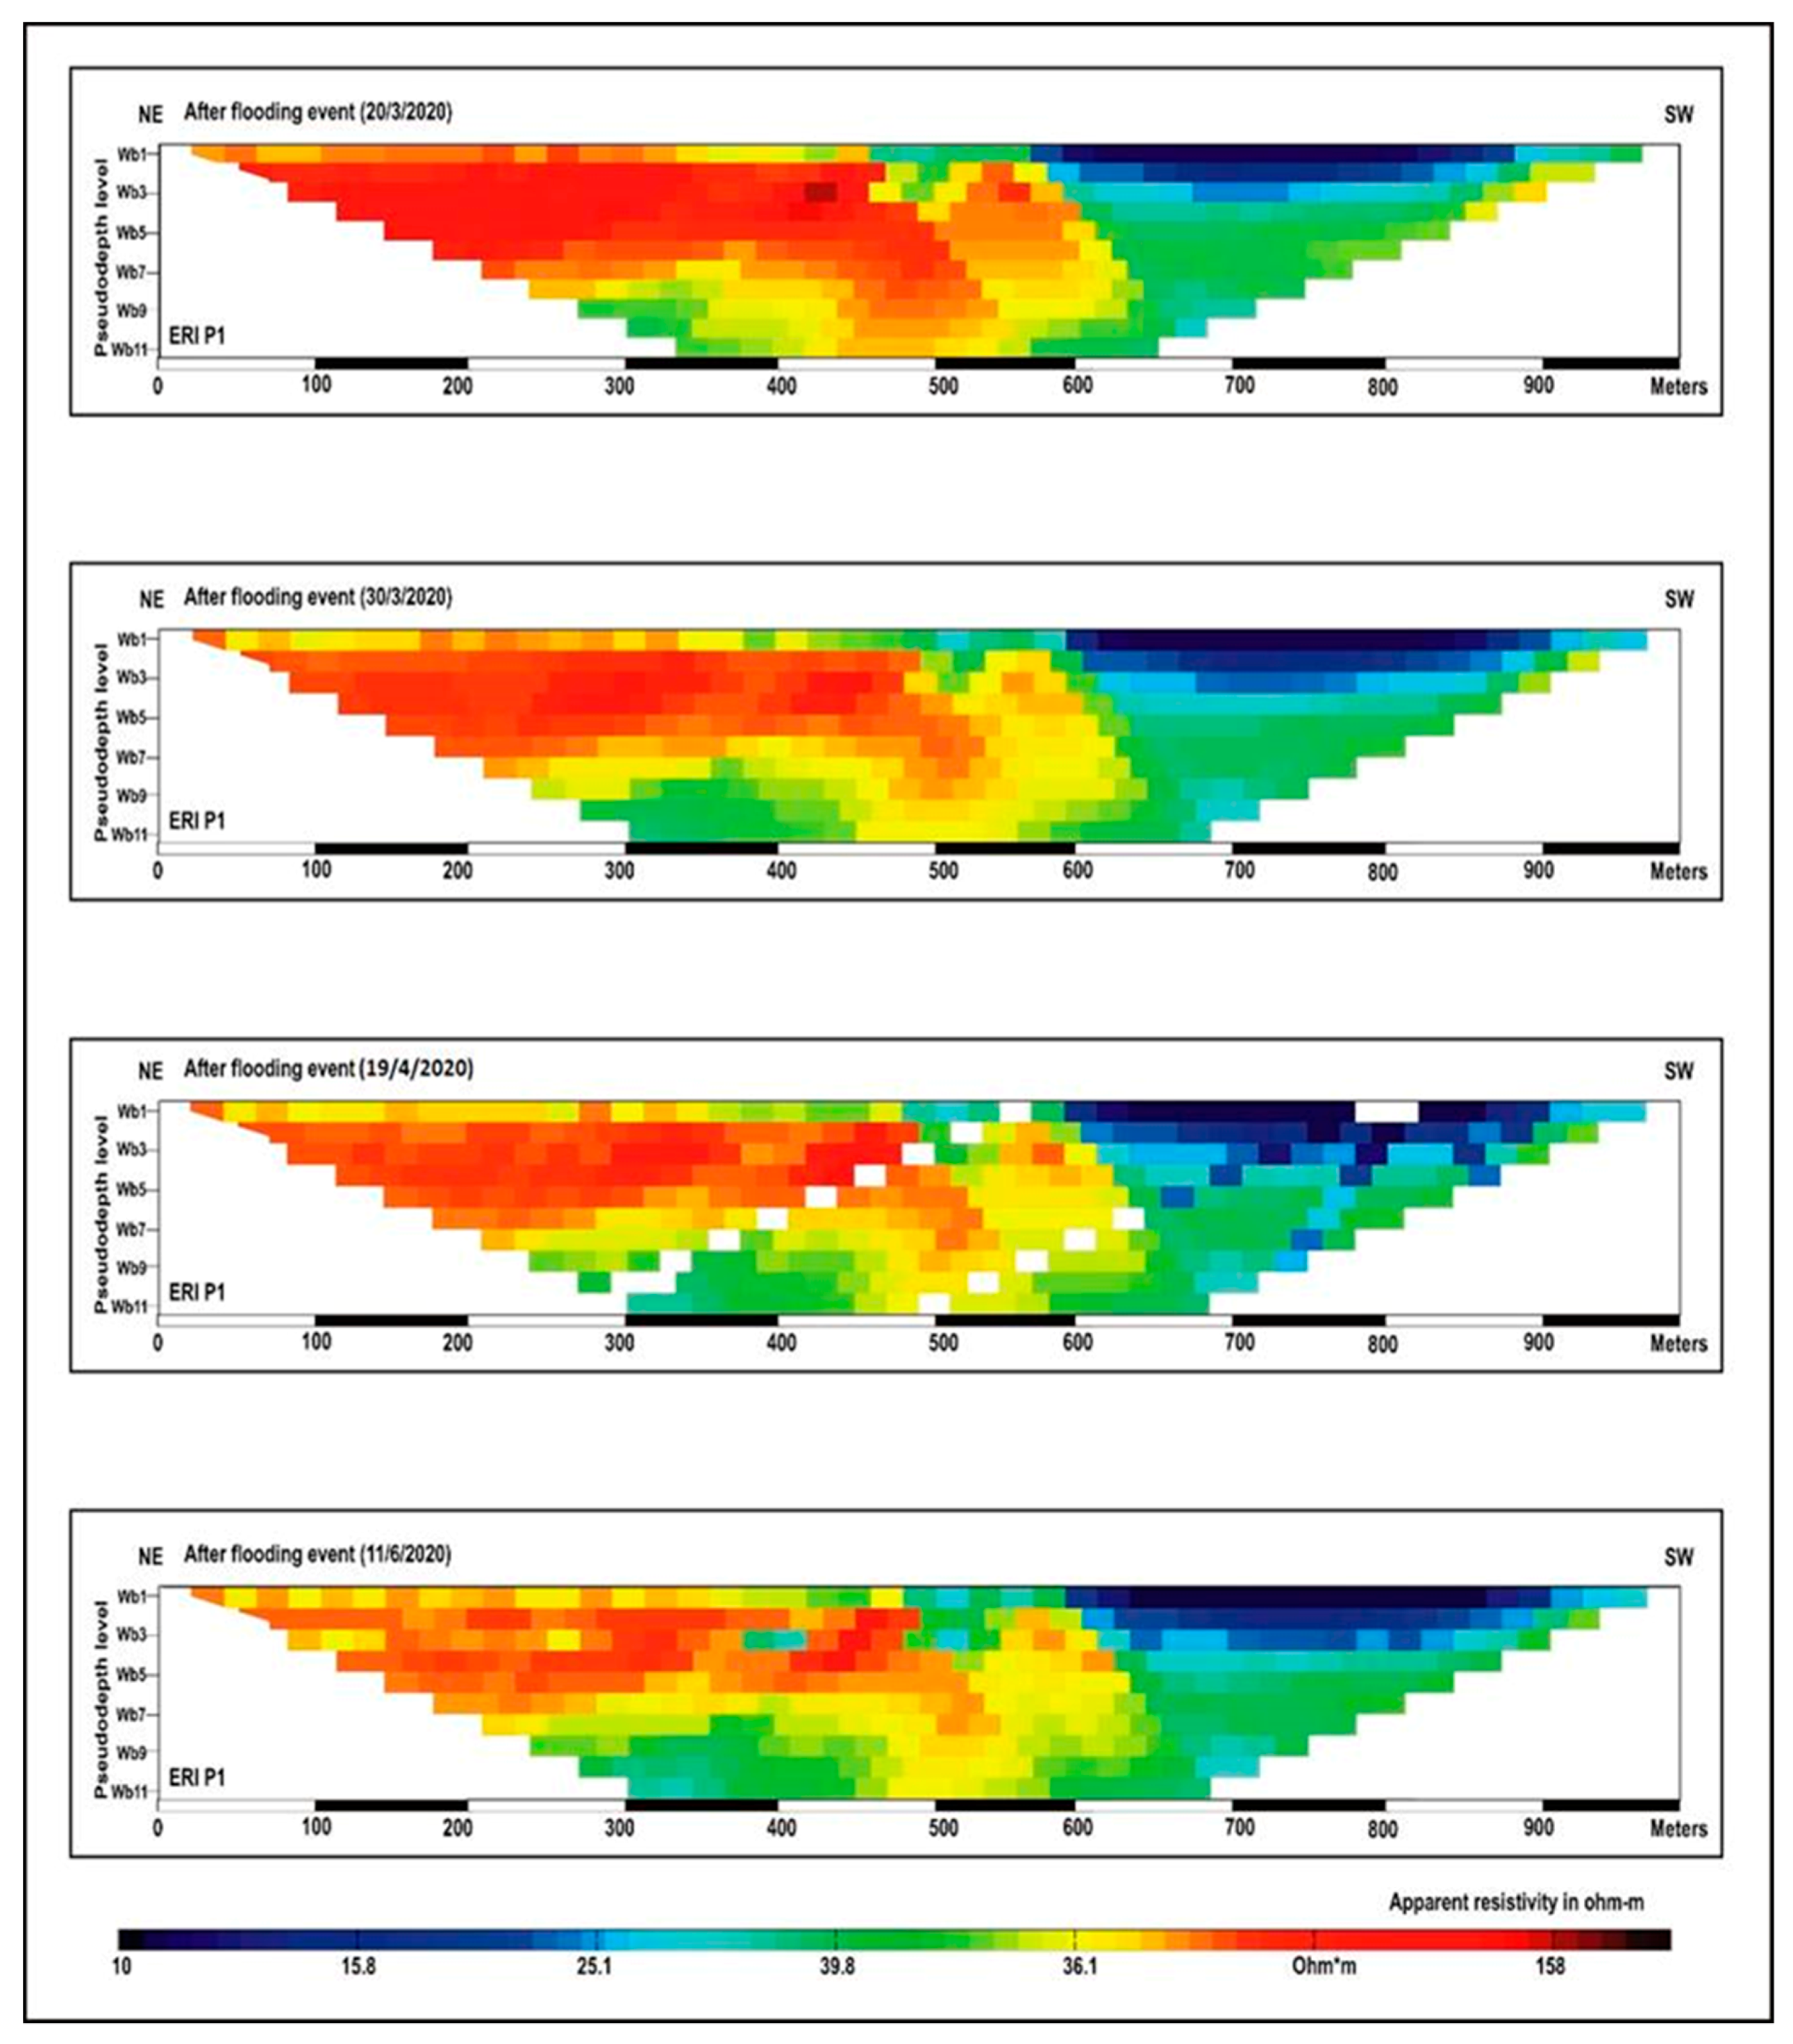
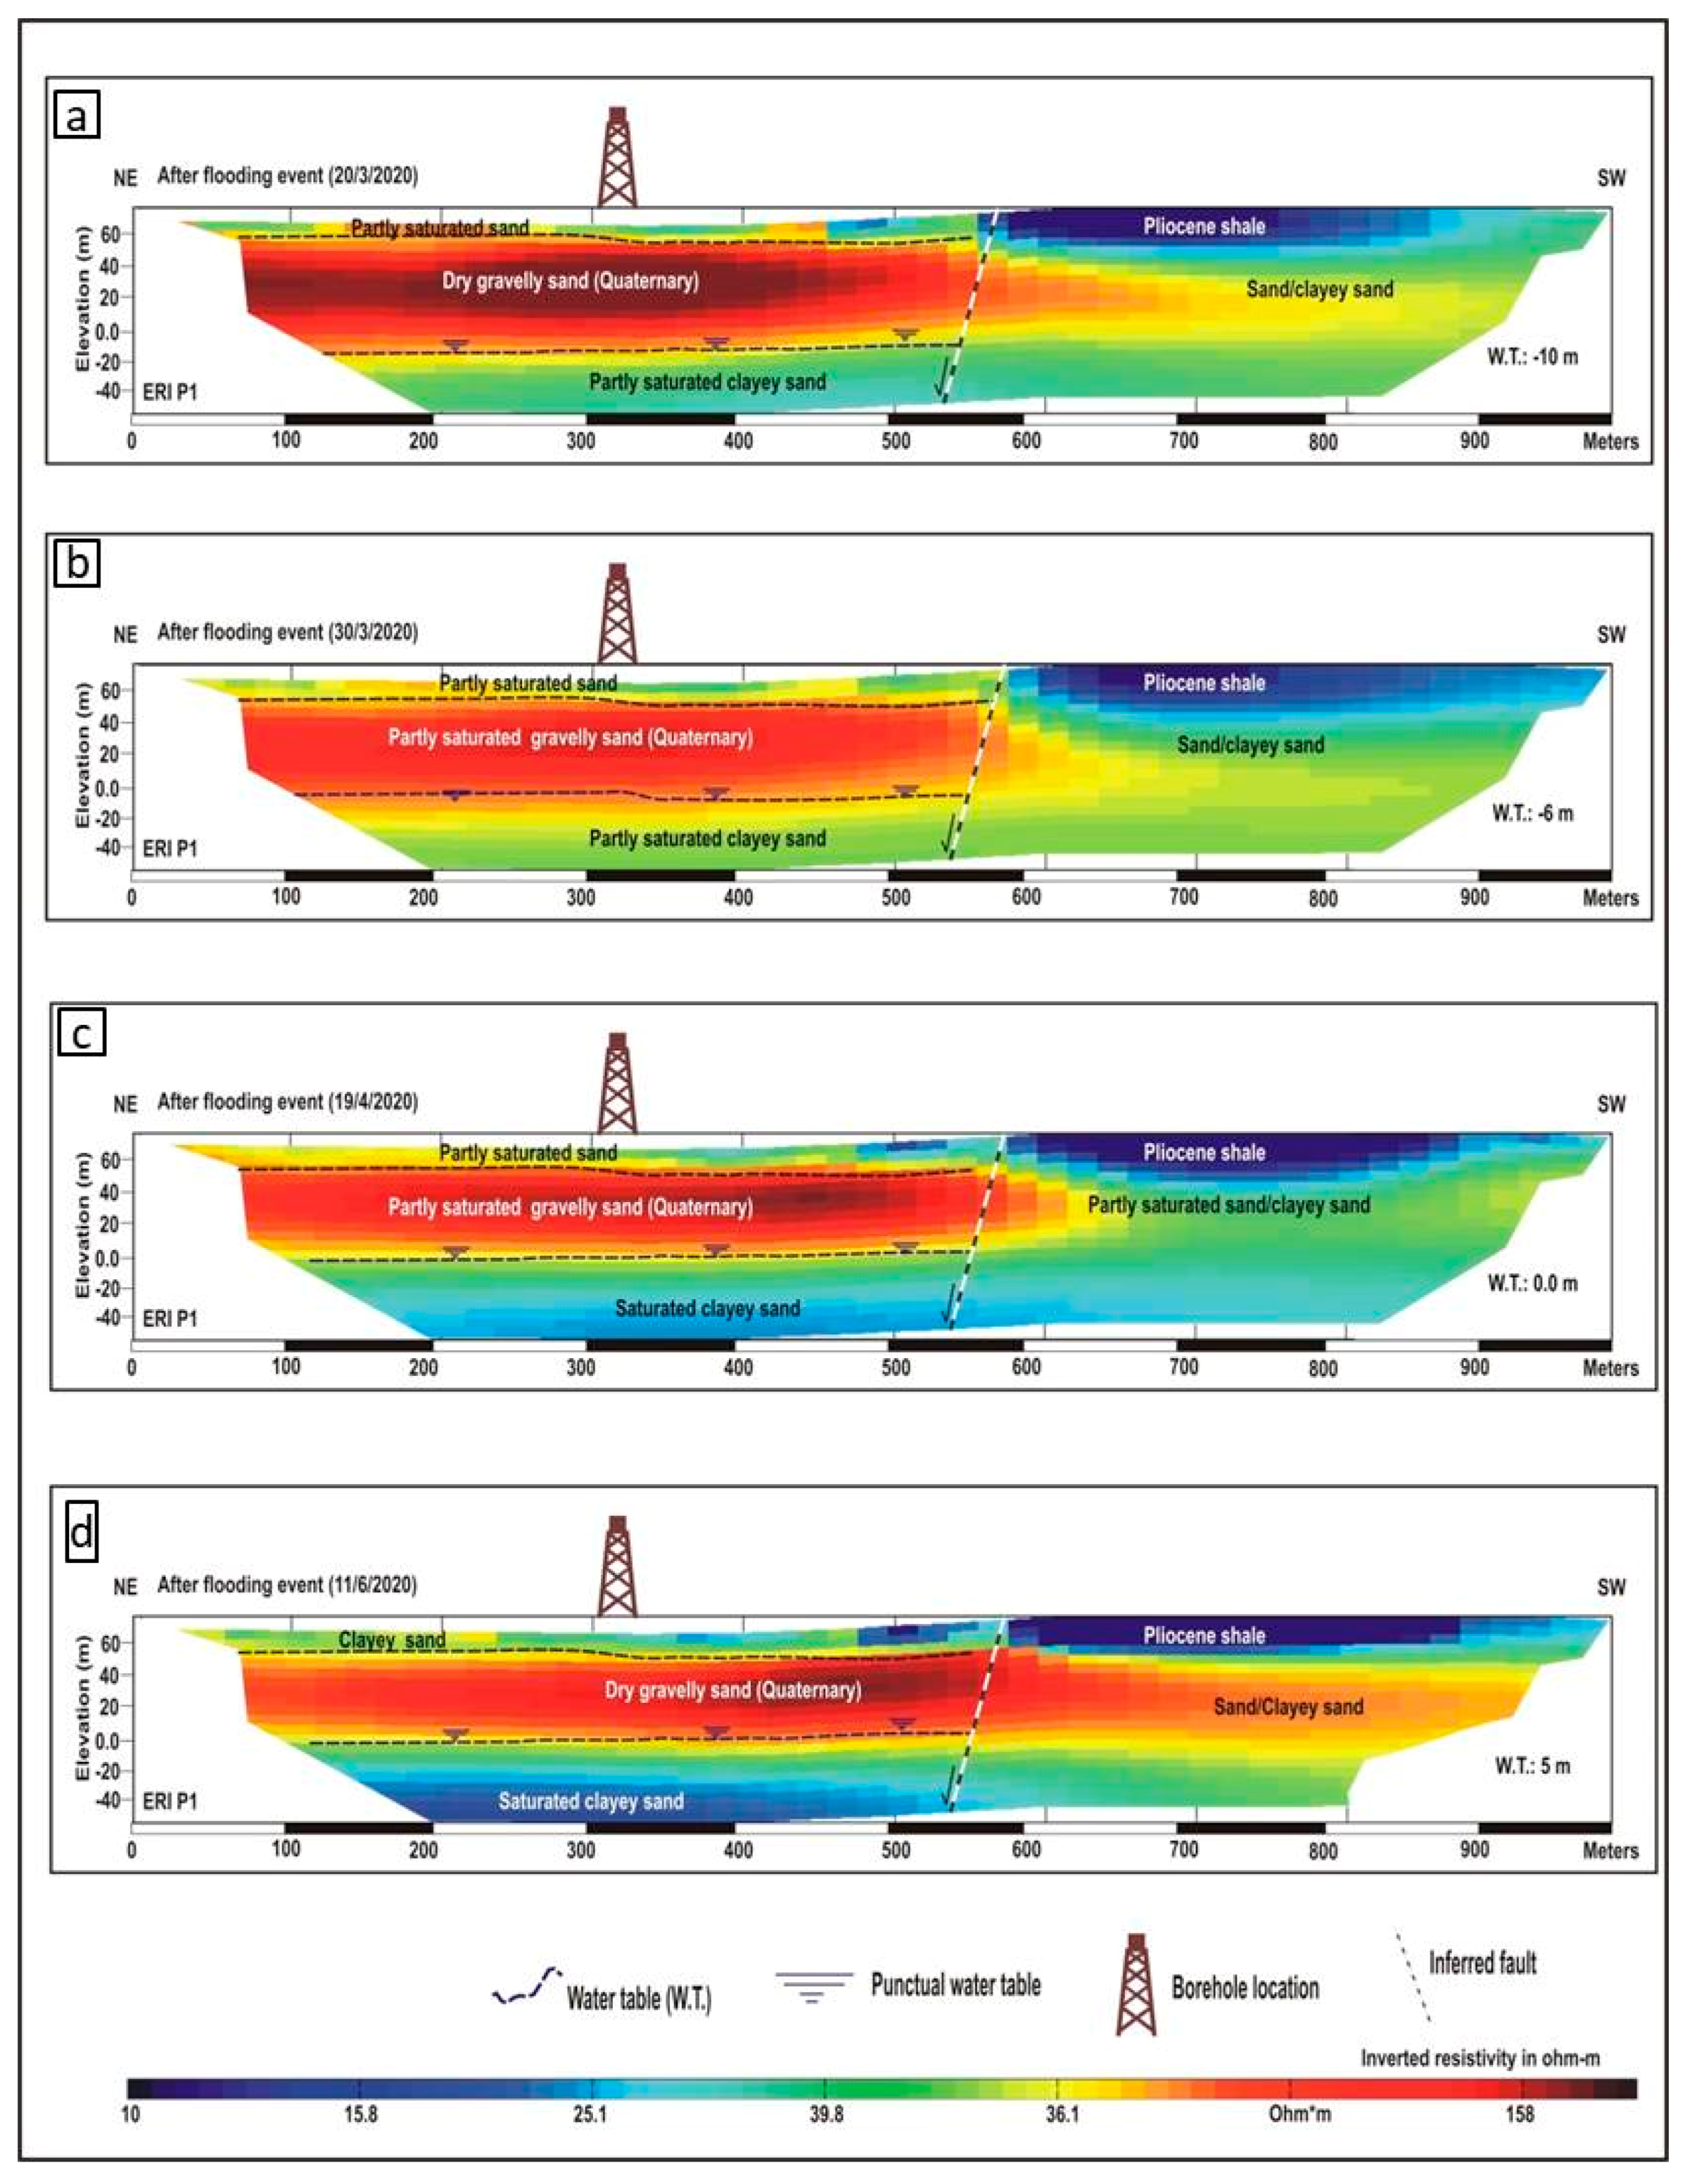
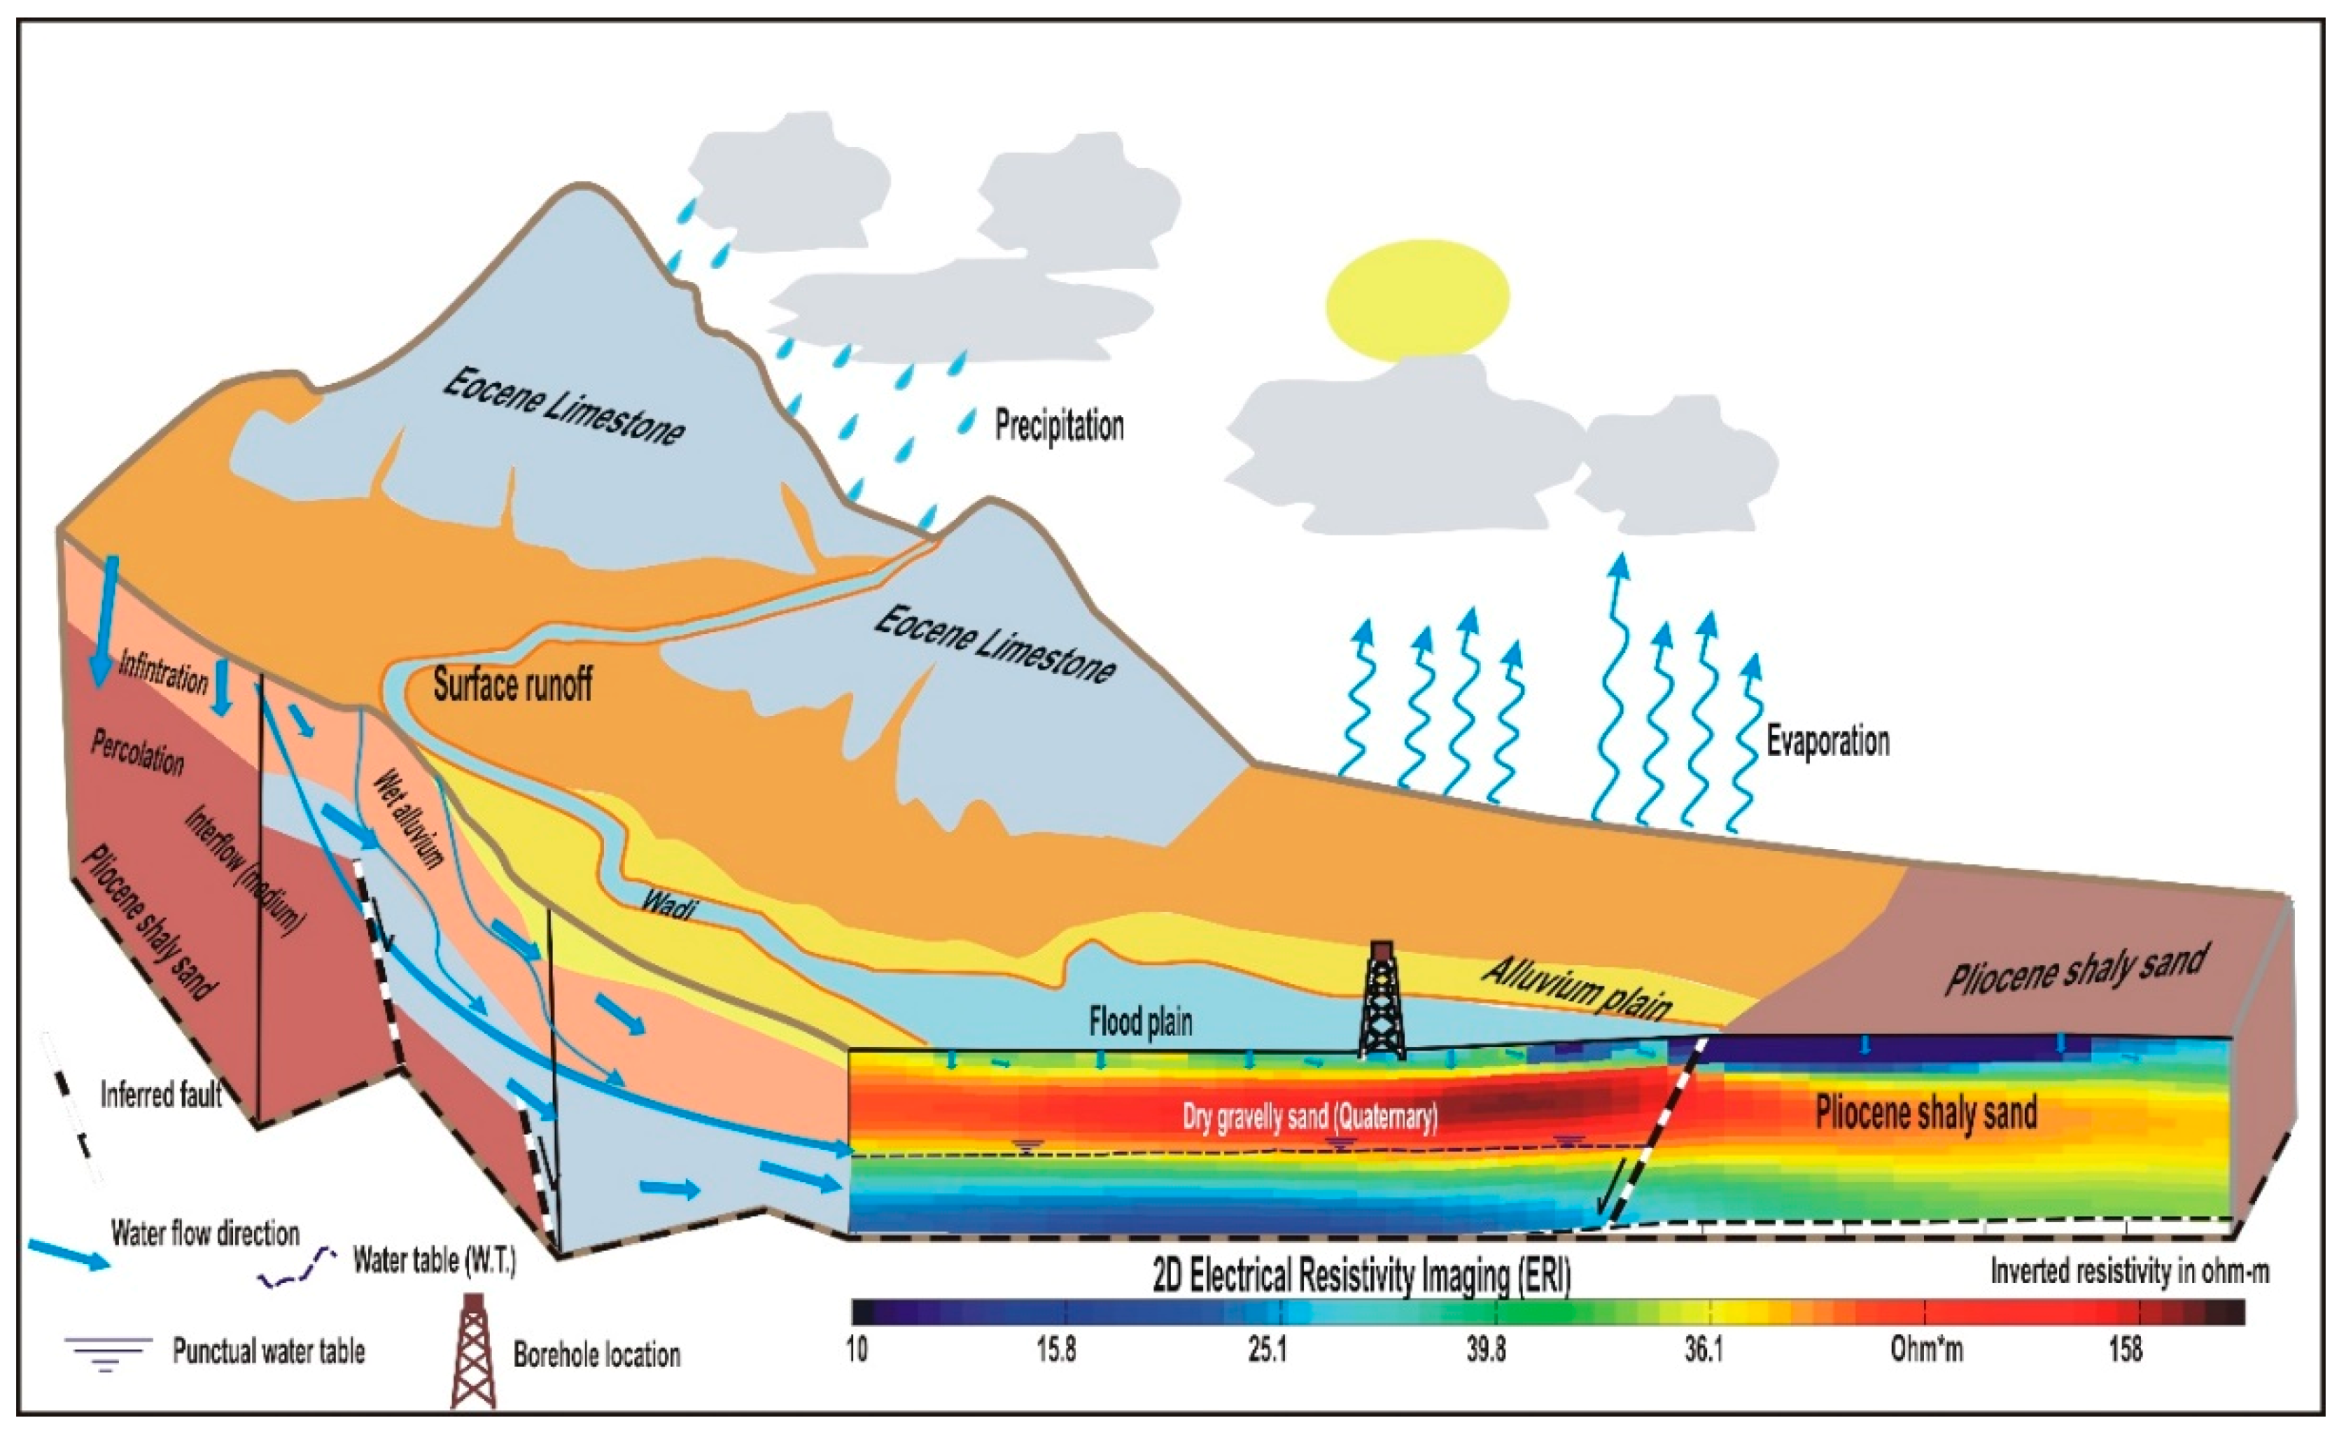
4.3. Monitoring Flash Flood Water Infiltration to the Alluvium Aquifer
5. Conclusions and Recommendations
Author Contributions
Funding
Conflicts of Interest
References
- Borga, M.; Boscolo, P.; Zanon, F.; Sangati, M. Hydrometeorological analysis of the August 29, 2003 flash flood in the eastern Italian Alps. J. Hydrometeorol. 2007, 8, 1049–1067. [Google Scholar] [CrossRef]
- Ozturk, M.; Copty, N.; Saysel, A. Modeling the impact of land use change on the hydrology of a rural watershed. J. Hydrol. 2013, 497, 97–109. [Google Scholar] [CrossRef]
- Zhang, M.; Chen, F.; Liang, D.; Tian, B.; Yang, A. Use of Sentinel-1 GRD SAR Images to Delineate Flood Extent in Pakistan. Sustainability 2020, 12, 5784. [Google Scholar] [CrossRef]
- El Bastawesy, M.; El Ella, E.M.A. Quantitative estimates of flash flood discharge into waste water disposal sites in Wadi Al Saaf, the Eastern Desert of Egypt. J. Afr. Earth Sci. 2017, 136, 312–318. [Google Scholar] [CrossRef]
- Subyani, A.M. Hydrologic behavior and flood probability for selected arid basins in Makkah area, western Saudi Arabia. Arab. J. Geosci. 2009, 4, 817–824. [Google Scholar] [CrossRef]
- Sultan, M.; Wagdy, A.; Manocha, N.; Sauck, W.; Gelil, K.A.; Youssef, A.F.; Becker, R.; Milewski, A.; El Alfy, Z.; Jones, C. An integrated approach for identifying aquifers in transcurrent fault systems: The Najd shear system of the Arabian Nubian shield. J. Hydrol. 2008, 349, 475–488. [Google Scholar] [CrossRef]
- Moawad, M.B.; Abdel Aziz, A.O.; Mamtimin, B. Flash floods in the Sahara: A case study for the 28 January 2013 flood in Qena, Egypt. Geomat. Nat. Haz. Risk 2016, 7, 215–236. [Google Scholar] [CrossRef] [Green Version]
- Niyongabire, E.; Hassan, R.; Elhassan, E.; Mehdi, M. Use of digital elevation model in a GIS for flood susceptibility mapping: Case of Bujumbura City. In Proceedings of the 6th International Conference on Cartography and GIS, Albena, Bulgaria, 13–17 June 2016; pp. 241–248. [Google Scholar]
- Abdel-Fattah, M.; Kantoush, S.; Saber, M.; Sumi, T. Hydrological modeling of flash flood at Wadi Samail, Oman. Annu. Disaster Prev. Res. Inst. Koyto Univ. 2016, 59, 533–541. [Google Scholar]
- Besser, H.; Mokadem, N.; Redhouania, B.; Rhimi, N.; Khlifi, F.; Ayadi, Y.; Omar, Z.; Bouajila, A.; Hamed, Y. GIS-based evaluation of groundwater quality and estimation of soil salinization and land degradation risks in arid Mediterranean site (SW Tunisia). Arab. J. Geosci. 2017, 10, 350. [Google Scholar] [CrossRef]
- Saber, M.; Abdrabo, K.I.; Habiba, O.M.; Kantosh, S.A.; Sumi, T. Impacts of Triple Factors on Flash Flood Vulnerability in Egypt: Urban Growth, Extreme Climate, and Mismanagement. Geosciences 2020, 10, 24. [Google Scholar] [CrossRef] [Green Version]
- Azeez, O.; Elfeki, A.; Kamis, A.S.; Chaabani, A. Dam break analysis and flood disaster simulation in arid urban environment: The Um Al-Khair dam case study, Jeddah, Saudi Arabia. Nat. Hazards 2020, 100, 995–1011. [Google Scholar] [CrossRef]
- Othman, A.; Shaaban, F.; Abotalib, A.Z.; El-Saoud, W.A.; Gabr, S.S.; Habeebullah, T.; Hegazy, D. Assessment of Rockfalls in Mountainous Urban Areas, Western Saudi Arabia. Arab. J. Sci. Eng. 2020. [Google Scholar] [CrossRef]
- Rantz, S.E. Measurement and Computation of Streamflow; US Department of the Interior, Geological Survey: Virginia, VA, USA, 1982; Volume 2175.
- Robinson, J.B.; Hazell, W.F.; Young, W.S. Effects of August 1995 and July 1997 Storms in the City of Charlotte and Mecklenburg County. North Carolina; US Geological Survey Fact Sheet FS-036-98: Virginia, VA, USA, 1998. [Google Scholar]
- Holmes, R.R.; Dinicola, K. 100-Year Flood–It’s All about Chance; US Geological Survey General Information Product: Virginia, VA, USA, 2010; Volume 106. [Google Scholar]
- Rice, K.C.; Hornberger, G.M. Comparison of hydrochemical tracers to estimate source contributions to peak flow in a small, forested, headwater catchment. Water Resour. Res. 1998, 34, 1755–1766. [Google Scholar] [CrossRef]
- Smith, B.; Rodriguez, S. Spatial analysis of high-resolution radar rainfall and citizen-reported flash flood data in ultra-urban New York City. Water 2017, 9, 736. [Google Scholar] [CrossRef] [Green Version]
- Lamichhane, N.; Sharma, S. Development of flood warning system and flood inundation mapping using field survey and LiDAR data for the Grand River near the city of Painesville, Ohio. Hydrology 2017, 4, 24. [Google Scholar] [CrossRef] [Green Version]
- Liu, C.; Guo, L.; Ye, L.; Zhang, S.; Zhao, Y.; Song, T. A review of advances in China’s flash flood early-warning system. Nat. Hazards 2018, 92, 619–634. [Google Scholar] [CrossRef] [Green Version]
- Alfieri, L.; Thielen, J. A European precipitation index for extreme rain-storm and flash flood early warning. Meteorol. Appl. 2015, 22, 3–13. [Google Scholar] [CrossRef] [Green Version]
- El Bastawesy, M.; White, K.; Nasr, A. Integration of remote sensing and GIS for modelling flash floods in WadiHudain catchment, Egypt. Hydrol. Process. 2009, 23, 1359–1368. [Google Scholar] [CrossRef]
- Santo, A.; Nicoletta, M.; De Falco, M. Post flash flood survey: The 14th and 15th October 2015 event in the Paupisi-Solopaca area (Southern Italy). J. Maps 2017, 13, 19–25. [Google Scholar] [CrossRef] [Green Version]
- Yousif, M.; Hussien, H.; Abotalib, A.Z. The respective roles of modern and paleo recharge to alluvium aquifers in continental rift basins: A case study from El Qaa plain, Sinai, Egypt. Sci. Total Environ. 2020, 739, 139927. [Google Scholar] [CrossRef]
- Hussien, H.M.; Kehew, A.E.; Aggour, T.; Korany, E.; Abotalib, A.Z.; Hassanein, A.; Morsy, S. An integrated approach for identification of potential aquifer zones in structurally controlled terrain: Wadi Qena basin, Egypt. Catena 2017, 149, 73–85. [Google Scholar] [CrossRef]
- Janizadeh, S.; Avand, M.; Jaafari, A.; Phong, T.V.; Bayat, M.; Ahmadisharaf, E.; Prakash, I.; Pham, B.T.; Lee, S. Prediction success of machine learning methods for flash flood susceptibility mapping in the tafresh watershed, Iran. Sustainability 2019, 11, 5426. [Google Scholar] [CrossRef] [Green Version]
- Hosseini, F.S.; Choubin, B.; Mosavi, A.; Nabipour, N.; Shamshirband, S.; Darabi, H.; Haghighi, A.T. Flash-flood hazard assessment using ensembles and Bayesian-based machine learning models: Application of the simulated annealing feature selection method. Sci. Total Environ. 2020, 711, 135161. [Google Scholar] [CrossRef] [PubMed]
- Alipour, A.; Ahmadalipour, A.; Abbaszadeh, P.; Moradkhani, H. Leveraging machine learning for predicting flash flood damage in the Southeast US. Environ. Res. Lett. 2020, 15, 024011. [Google Scholar] [CrossRef]
- Sultan, M.; Yan, E.; Sturchio, N.; Wagdy, A.; Abdel Gelil, K.; Becker, R.; Manocha, N.; Milewski, A. Natural discharge: A key to sustainable utilization of fossil groundwater. J. Hydrol. 2007, 335, 25–36. [Google Scholar] [CrossRef]
- Abotalib, A.Z.; Sultan, M.; Elkadiri, R. Groundwater processes in Saharan Africa: Implications for landscape evolution in arid environments. Earth Sci. Rev. 2016, 156, 108–136. [Google Scholar] [CrossRef] [Green Version]
- Attwa, M.; Basokur, A.T.; Akca, I. Hydraulic conductivity estimation using direct current (DC) sounding data: A case study in East Nile Delta, Egypt. Hydrogeol. J. 2014, 22, 1163–1178. [Google Scholar] [CrossRef]
- Hübner, R.; Günther, T.; Heller, K.; Noell, U.; Kleber, A. Impacts of a capillary barrier on infiltration and subsurface stormflow in layered slope deposits monitored with 3-D ERT and hydrometric measurements. Hydrol. Earth Syst. Sci. 2017, 21, 5181. [Google Scholar] [CrossRef] [Green Version]
- Hojat, A.; Arosio, D.; Ivanov, V.I.; Loke, M.H.; Longoni, L.; Papini, M.; Tresoldi, G.; Zanzi, L. Quantifying seasonal 3D effects for a permanent electrical resistivity tomography monitoring system along the embankment of an irrigation canal. Near Surf. Geophys. 2020, 18, 427–443. [Google Scholar] [CrossRef]
- Henaish, A.; Attwa, M. Internal structural architecture of a soft-linkage transfer zone using outcrop and DC resistivity data: Implications for preliminary engineering assessment. Eng. Geol. 2018, 244, 1–13. [Google Scholar] [CrossRef]
- Attwa, M.; Zamzam, S. An integrated approach of GIS and geoelectrical techniques for wastewater leakage investigations: Active constraint balancing and genetic algorithms application. J. Appl. Geophys. 2020, 175, 103992. [Google Scholar] [CrossRef]
- Moreira, C.A.; Casagrande, M.F.S.; Borssatto, K. Analysis of the potential application of geophysical survey (induced polarization and DC resistivity) to a long-term mine planning in a sulfide deposit. Arab. J. Geosci. 2020, 13, 1–12. [Google Scholar] [CrossRef]
- McLachlan, P.; Chambers, J.; Uhlemann, S.; Sorensen, J.; Binley, A. Electrical resistivity monitoring of river–groundwater interactions in a Chalk river and neighboring riparian zone. Near Surf. Geophys. 2020, 18, 385–398. [Google Scholar] [CrossRef]
- Schmidt-Hattenberger, C.; Bergmann, P.; Labitzke, T.; Wagner, F.; Rippe, D. Permanent crosshole electrical resistivity tomography (ERT) as an established method for the long-term CO2 monitoring at the Ketzin pilot site. Int. J. Greenh. Gas Control. 2016, 52, 432–448. [Google Scholar] [CrossRef]
- Steelman, C.M.; Kennedy, C.S.; Capes, D.C.; Parker, B.L. Electrical resistivity dynamics beneath a fractured sedimentary bedrock riverbed in response to temperature and groundwater–surface water exchange. Hydrol. Earth Syst. Sci. 2017, 21, 3105. [Google Scholar] [CrossRef] [Green Version]
- Said, R. The Geology of Egypt. Bakema Rotterdam Broodfield 1990, 734, 28. [Google Scholar]
- Klitzsch, E.; List, F.K.; Pohlmann, G. Geological Map of Egypt; 3 Sheets, Scale 1:500,000; Conoco Coral and Egyptian General Petroleum Company: Cairo, Egypt, 1987. [Google Scholar]
- El-Sayed, S.A.; Morsy, S.M.; Zakaria, K.M. Recharge sources and geochemical evolution of groundwater in the Quaternary aquifer at Atfih area, the northeastern Nile Valley, Egypt. J. Afr. Earth Sci. 2018, 142, 82–92. [Google Scholar] [CrossRef]
- Morsy, S.M.; Abdel Monaim, N.A. Hydrological modeling for potentiality of water harvesting and land/use planning, wadi El Atfehy, Eastern Desert, Egypt. Egypt. J. Geol. 2018, 62, 1–19. [Google Scholar]
- Abotalib, A.Z.; Mohamed, R.S. Surface evidences supporting a probable new concept for the river systems evolution in Egypt: A remote sensing overview. Environ. Earth Sci. 2013, 69, 1621–1635. [Google Scholar] [CrossRef]
- RIGW (Research Institute for Groundwater). Explanatory Note on the Hydrogeological Map of Egypt, 1:500,000; University of Michigan Library: Cairo, Egypt, 1991. [Google Scholar]
- Sakran, S.; Said, S.M. Structural setting and kinematics of Nubian fault system, SE Western Desert, Egypt: An example of multi-reactivated intraplate strike-slip faults. J. Struct. Geol. 2018, 107, 93–108. [Google Scholar] [CrossRef]
- Sallam, O.M.; El Shewy, M.A.; Dawoud, M.A. New Reclamation Mega Projects and Increasing the Pressure on Water System in the Nile Valley and Delta in Egypt. In Proceedings of the WSTA 11th Gulf Water Conference, Water in the GCC. “Towards Efficient Management”, Muscat, Oman, 20–22 October 2014. [Google Scholar]
- Said, R. The Geological Evolution of the River Nile; Springer Science & Business Media: New York, NY, USA, 2012. [Google Scholar]
- Korany, E.A.; Soliman, M.M.; Faiad, B.J. Modeling of the hydrogeologic response of the Quaternary aquifer in the delta of El-Atfehy, eastern Desert, Egypt, and an assessment approach for development of groundwater resources. Ain Shams Sci. Bull. 1997, 35, 89e110. [Google Scholar]
- Yeh, H.F.; Chen, J.F.; Lee, C.H. Application of a water budget to evaluate rainfall recharge and slope stability. J. Chin. Inst. Environ. Eng. 2004, 14, 1e10. [Google Scholar]
- Masoud, M. Rainfall–runoff modeling of ungauged Wadis in arid environments (case study Wadi Rabigh–Saudi Arabia). Arab. J. Geosci. 2014, 8, 2587–2606. [Google Scholar] [CrossRef]
- de la Vega, M.; Osella, A.; Lascano, E. Joint inversion of Wenner and dipole–dipole data to study a gasoline-contaminated soil. J. Appl. Geophys. 2003, 54, 97–109. [Google Scholar] [CrossRef]
- Clément, R.; Descloitres, M.; Günther, T.; Oxarango, L.; Morra, C.; Laurent, J.P.; Gourc, J.P. Improvement of electrical resistivity tomography for leachate injection monitoring. Waste Manag. 2010, 30, 452–464. [Google Scholar] [CrossRef] [PubMed]
- Günther, T. DC2DInvRes-Direct Current 2D Inversion and Resolution. 2007. Available online: http://dc2dinvres.resistivity.net/ (accessed on 30 September 2019).
- LaBrecque, D.J.; Miletto, M.; Daily, W.; Ramirez, A.; Owen, E. The effects of noise on Occam’s inversion of resistivity tomography data. Geophysics 1996, 61, 538–548. [Google Scholar] [CrossRef]
- Ronczka, M.; Günther, T.; Grinat, M.; Wiederhold, H. Monitoring freshwater–saltwater interfaces with SAMOS–installation effects on data and inversion. Near Surf. Geophys. 2020, 18, 369–383. [Google Scholar] [CrossRef]
- Audenrieth, I.; Martin, R.; Yogeshwar, P.; Willig, D. Analysis of measurement errors from electrical resistivity imaging investigation of First World War mining tunnels in La Boisselle, France. Near Surf. Geophys. 2020, 18, 561–573. [Google Scholar] [CrossRef]
- Günther, T. Inversion Methods and Resolution Analysis for the 2D/3D Reconstruction of Resistivity Structures from DC- Measurements. Ph.D. Thesis, University of Mining and Technology, Freiberg, Germany, 2004. [Google Scholar]
- El Bastawesy, M.; White, K.H.; Gabr, S. Hydrology and geomorphology of the Upper White Nile Lakes and their relevance for water resources management in the Nile basin. Hydrol. Process. 2013, 27, 196–205. [Google Scholar] [CrossRef]


| Date | Flash Flood Affected Zones | Remarks |
|---|---|---|
| April 2018 | North Eastern Desert catchments and New Cairo | Damage to roads and vehicles |
| 2015 | Wadi Assuiti and Wadi Qena | Destroyed houses in the Eastern side of the Nile Valley |
| May 2014 | Wadi Al Saf and Wadi Atfeh North Eastern Desert | Drowning of clay queries, road destruction, over-flooding of wastewater facilities |
| 28 January 2013 | Wadi Qena basin | Flooding of cultivated lands and destruction of road networks |
| 13 November 1997 | Upper Egypt: Aswan, Sohag, Asyut, Minia, and Qena | Deaths of 23 persons, destruction of 260 houses, over-flooding of thousands of hectares |
| 1975 | Wadi Taref, Wadi Assuiti, and Sohag Governorate | 180 houses destroyed and 1500 citizen displaced |
Publisher’s Note: MDPI stays neutral with regard to jurisdictional claims in published maps and institutional affiliations. |
© 2020 by the authors. Licensee MDPI, Basel, Switzerland. This article is an open access article distributed under the terms and conditions of the Creative Commons Attribution (CC BY) license (http://creativecommons.org/licenses/by/4.0/).
Share and Cite
El-Saadawy, O.; Gaber, A.; Othman, A.; Abotalib, A.Z.; El Bastawesy, M.; Attwa, M. Modeling Flash Floods and Induced Recharge into Alluvial Aquifers Using Multi-Temporal Remote Sensing and Electrical Resistivity Imaging. Sustainability 2020, 12, 10204. https://0-doi-org.brum.beds.ac.uk/10.3390/su122310204
El-Saadawy O, Gaber A, Othman A, Abotalib AZ, El Bastawesy M, Attwa M. Modeling Flash Floods and Induced Recharge into Alluvial Aquifers Using Multi-Temporal Remote Sensing and Electrical Resistivity Imaging. Sustainability. 2020; 12(23):10204. https://0-doi-org.brum.beds.ac.uk/10.3390/su122310204
Chicago/Turabian StyleEl-Saadawy, Omnia, Ahmed Gaber, Abdullah Othman, Abotalib Z. Abotalib, Mohammed El Bastawesy, and Mohamed Attwa. 2020. "Modeling Flash Floods and Induced Recharge into Alluvial Aquifers Using Multi-Temporal Remote Sensing and Electrical Resistivity Imaging" Sustainability 12, no. 23: 10204. https://0-doi-org.brum.beds.ac.uk/10.3390/su122310204