Article

Citizen Science as Part of the Primary School Curriculum: A Case Study of a Technical Day on the Topic of Noise and Health

1
Department of Environmental Sciences, Jožef Stefan Institute, 1000 Ljubljana, Slovenia
2
Jožef Stefan International Postgraduate School, 1000 Ljubljana, Slovenia
3
National Institute of Public Health, 1000 Ljubljana, Slovenia
*
Author to whom correspondence should be addressed.
Sustainability 2020, 12(23), 10213; https://0-doi-org.brum.beds.ac.uk/10.3390/su122310213
Submission received: 28 October 2020 / Revised: 26 November 2020 / Accepted: 3 December 2020 / Published: 7 December 2020
(This article belongs to the Collection Sustainable Citizenship and Education)

Abstract

:
In this paper, we summarise lessons learned conducting citizen science (CS) activities within the CitieS-Health H2020 project on the topic of noise exposure and health at a primary school in Ljubljana, Slovenia. Activities were organised in the form of a School Tech-Day Event (STDE) as part of the school’s curriculum involving second-grade pupils, ages 7–8. The STDE was aligned with the project’s methodological framework, which is based on co-creation and co-design principles. To this end, the pupils initially were involved in identifying noise-related issues and translation of selected topics into research questions. Next, together with mentors, they participated in the process of hypothesis formulation and the designing of data collection protocols. Finally, they participated in three focussed noise measurement experiments, as well as data analysis and presentation. We report and critically evaluate the whole chain of activities, focussing on the participant dimension using selected components of the citizen science evaluation framework. The event was very well-received by both pupils and teachers, and their active participation and hands-on experience with scientific processes contributed to their improved scientific literacy. Overall, the demonstrated concept of CS activities has great potential for ongoing inclusion in the school curriculum in its current format, or else adjusted according to specifics from other science and technology fields.

1. Introduction

Citizen science (CS) is an approach where the public or non-professional scientists are involved in the scientific research process. The power of citizen science, having been recognised by the scientific community [1], is resulting in an ever-growing number of related citizen science projects and activities, particularly on the topics of Earth science [2], nature conservation [3], as well as agriculture and food science [4]. It has been recognised that if CS projects are appropriately designed, children can be involved actively in citizen science activities, in which they can both learn from and contribute to research [5,6,7]. In particular, if such research is integrated into school curricula, their engagement can add significant value to formal education [8]. Among the benefits of such integration for students, Shah and Martinez [9] listed the instilment of community awareness, critical thinking, problem solving, and practical experience, noting that hands-on experience is the most important aspect when the youngest students are involved. This is especially important for education in the science, technology, engineering, and mathematics (STEM) fields, as many nations are suffering deficits in such skills in their respective workforces [10,11]. Moreover, as shown by Queiruga-Dios et al. [12], integration of citizen science projects not only increases scientific literacy but can also serve as a framework in which students can participate in the attainment of the United Nations’ Sustainable Development Goals (SDGs).
Topics often addressed in the school environment involving citizen science concepts include, but are not limited to, biodiversity [13,14,15], human exposure, environmental health, lifestyle, and climate change [16,17,18,19]. In this paper, we summarise lessons learned conducting citizen science activities within the CitieS-Health H2020 project (https://citieshealth.eu/) on the topic of noise exposure and health at a primary school in Ljubljana, Slovenia, organised in the form of a School Tech-Day Event (STDE) as part of the school’s curriculum. The primary school involved is one of the stakeholders in the pilot study in Ljubljana, and the STDE was organised at the invitation of the teachers. Noise is a parameter that children understand and can relate to, and is of great importance to them. Namely, children are viewed as being a group that is vulnerable to the effects of noise due to their still-developing cognitive functions and coping skills [20,21]. Noise exposure can impact their well-being, annoyance tolerance, cognitive function, and even health [20,22]. Adverse health effects observed in children from excessive chronic noise exposure include noise-induced hearing impairments, sleep disturbances, low birth weight, adverse endocrine responses, and increased blood pressure [20]. Recently, excessive noise exposure’s influence in early childhood on attention and hyperactivity has also been examined [23].
Considering that children spend a large amount of time listening and learning, establishing a positive sound environment that fosters their learning is crucial, as is raising their awareness of this topic. In this paper, the whole chain of activities conducted within the STDE, including the tools used, is reported and critically evaluated, comprising the following four main phases: (i) identification of concerns and definition of respective research questions with pupils; (ii) co-design of research activities and formulation of hypotheses; (iii) data collection and reflection on the results obtained during the measuring experiment; and (iv) presentation of results. For the overall evaluation, selected components from the citizen science evaluation framework, as suggested by Kieslinger et al. [24], were adopted and tailored according to the specifics of the activities conducted.

2. Materials and Methods

2.1. Study Design

The School Tech-Day Event (STDE) took place in March 2020 at the Spodnja Šiška primary school in Ljubljana, Slovenia, as part of the school’s regular curriculum. The school is one of 52 primary schools in the Municipality of Ljubljana (MOL) and, as such, is part of the Republic of Slovenia’s compulsory and state-funded education system, which is organised into a single-structure nine-year basic program for pupils aged 6 to 15 [25]. The school is located in the Šiška District (LAT: 46.06496, LON: 14.49760), the most populous district in MOL. During the 2019/2020 school year, 520 pupils attended the school. Out of these, 62 second-graders (ages 7–8), three of their teachers, and four researchers with a background in environmental sciences participated in the STDE event, which lasted approximately four school hours (one school hour lasts 45 min) and was organised in line with the CitieS-Health project’s methodological framework [26] in the following sequence and phases:
  • Identification phase: Pupils’ concerns and interests regarding noise and health were identified, and respective selected topics were translated into research questions.
  • Design phase: The data collection protocol was defined in a co-design process with pupils, comprising hypothesis formulation and selection, as well as familiarising pupils with the data collection approach and tools, respectively.
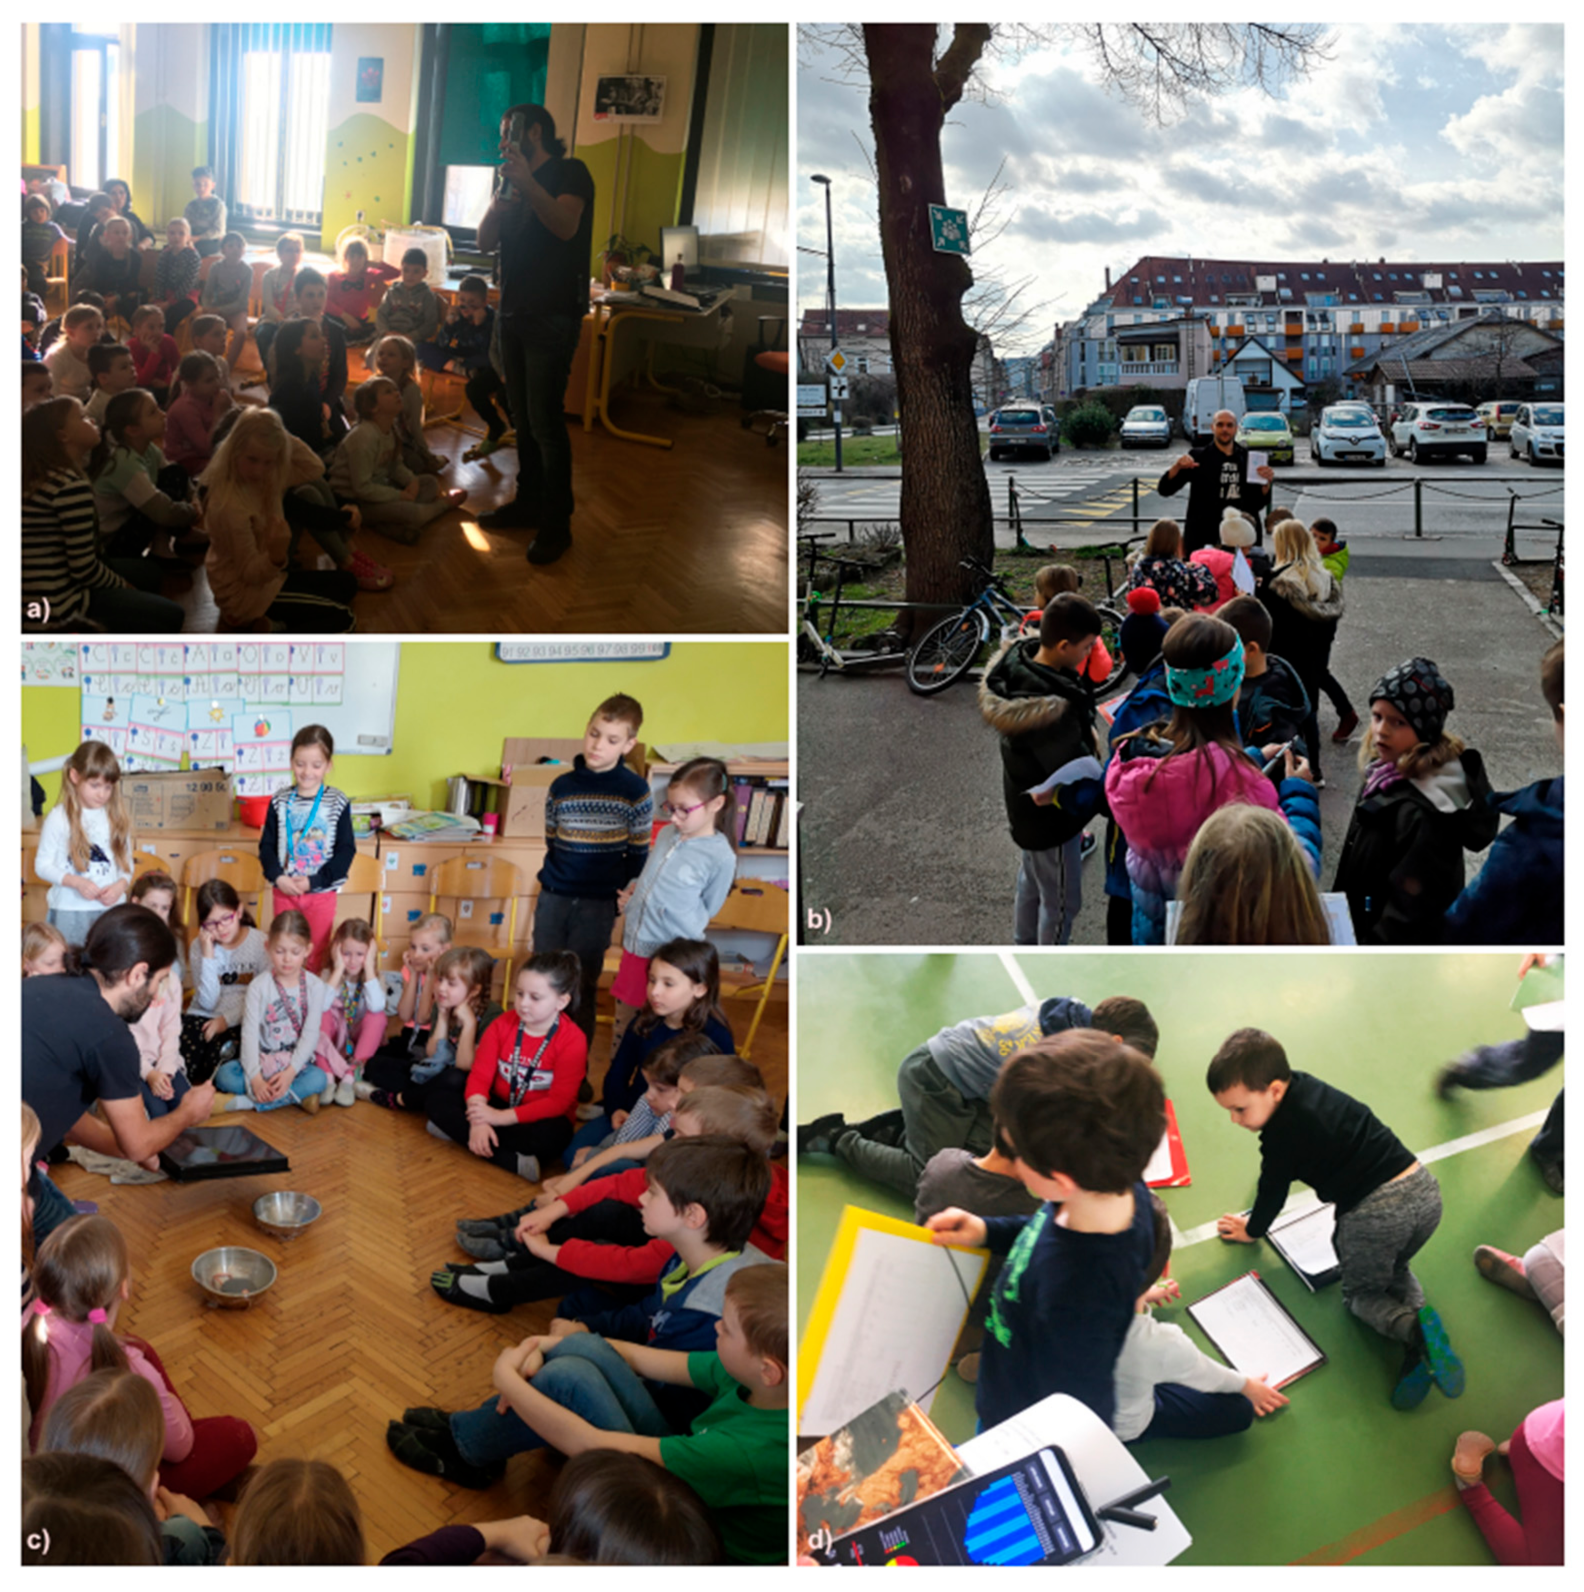
  • Deployment phase: This phase entailed overall data collection and analysing processes, as well as a reflection on the findings.
  • Action phase: The results obtained within separate groups of pupils during the deployment phase were presented among the groups, while knowledge gained during the STDE was evaluated through an online quiz.
A pre-event questionnaire (Table S1 in the Supplementary Information) was prepared and administered to get insights into pupils’ noise perception and, following discussion on its outcomes with pupils, to help identify the research questions to be addressed. The pupils completed a paper version of a questionnaire two weeks prior to the event with guided completion, i.e., with their teachers’ assistance. The actual STDE event then unfolded in the following sequence. Initially, a general introductory PowerPoint presentation (PPT) was prepared for pupils to raise awareness and empower them on the importance of sounds and hearing in everyday life. A presentation with the questionnaire’s results followed. Selected noise-related experiments were then demonstrated to the pupils to teach them about sound’s physical properties. After considering the questionnaire’s results and the noise-related concerns identified therein, through discussions with pupils, research questions and hypotheses were formulated. Three research assignments were then defined, and the measurement experiments co-designed and conducted both inside and outside the school in three separate groups, each group comprising approximately 20 pupils. The results from the measurements were analysed by respective pupil groups, then presented to each other in the form of a mini-symposium. The day ended with an online quiz. In Table 1, the STDE agenda—Comprising individual items, their durations, aims, and tools used—is provided, and selected indicative photos from the event are shown in Figure 1 and Figure 2.

2.2. Tools Used

In this section, various tools used during the STDE are described, with more details provided under Supplementary Information.
Pre-event questionnaire: The questionnaire comprised eight questions of combined type—Multiple-choice, rating-scale, and Likert-scale questions. In addition to determining whether the pupils are familiar with the concept of noise and what it means and whether they think their environment is noisy, they were asked to identify noise sources within the school environment and its surroundings, the extent to which they are disturbed by these noise sources, and how they feel when exposed to noise. The questionnaire aimed to stimulate pupil’s critical thinking about the topic of noise and their sound environment, to identify noise-related issues that are relevant to them, and in this way help formulate research questions. A version of the questionnaire translated from Slovenian into English can be found in the Supplementary Information (Table S1).
The introductory lesson with a PowerPoint presentation titled “My sound environment” was conducted using a two-way communication approach to educate pupils on the importance of their ability to hear and sounds in our daily lives. The pupils were encouraged to express which sounds they perceive as pleasant and supportive, as well as which ones they viewed as noisy and annoying. The pupils were then provided with some suggestions on how they can improve their sound environment (e.g., seek a healthy sound environment, such as in nature).
Noise demo-experiments: Three experiments were selected and demonstrated to teach pupils who had no prior knowledge of the physical properties of sound. The first one was the “dancing rice” experiment, designed to demonstrate how sound travels in waves. In this experiment, a bowl is covered with plastic wrap, then uncooked rice is placed on the top, and a metal tray and wooden spoon are used as a noise generator. Sound waves that were created banging the spoon on the tray caused vibrations in the wrap, which made the rice move [27]. The second experiment was the “bell jar” experiment, which aimed to demonstrate that sound waves cannot travel without a medium. For this experiment, a vacuum pump was used to remove air from the vacuum chamber with a smartphone as a sound generator [28]. For the final experiment, named “Let’s Get Loud”, we wanted to help pupils understand the decibel (dB) as a unit of measurement while giving them a sense of the expected values in the living environment. To this end, we first measured the noise level in silence for one minute, then urged them to make noise first by talking, then shouting. Throughout the experiment, we observed the movement of values on the display screen of a SoundTest-Master (Laserliner®), a noise level measuring instrument, and at the end, we discussed the observations.
Sound measurements: The NoiseCapture App, an open-source Android application designed to measure and share the noise environment, was used, as it is an app designed for use by the general population, providing all the noise metrics needed for specific purposes—and most importantly, it can be calibrated. The app, developed by the Noise-Planet project, allows for recording of real-time noise levels and provides information on the following parameters: equivalent noise level in dB(A) for the duration of a measurement; statistical sound levels (LAmin and LAmax); percentile noise levels (LA90, LA50 and LA10); repartition of noise exposure at different levels; and a noise level spectrum. Each noise measurement is combined with its GPS track and can be displayed on a map [29,30]. To enhance the accuracy and precision of the measurements, two external microphones, a Dayton Audio iMM-6 (Springboro, OH, USA) microphone and a MicW i436 microphone (Beijing, China), previously evaluated by Kardous and Shaw [31] and proved to be fit for these purposes, were used with the application. Prior to deployment, the microphones were calibrated using the VOLTCRAFT SLC-100 Sound Level Calibrator.
Quiz: The knowledge that pupils obtained during the STDE was assessed through an interactive learning game prepared within Kahoot!, a game-based learning platform mostly used for educational purposes (kahoot.com) [32]. To this end, we prepared a multiple-choice quiz comprising 22 questions covering the following broader topics: sound’s physical characteristics as a wave, sound’s general characteristics, (fun) facts about sound, sensing of sound/noise, sound measurements, and exposure to noise (Table S2 in Supplementary Information). The ultimate aim of the game was to find out how attentively pupils listened and followed the day’s activities and how much they remembered.
Miscellaneous materials: For purposes of presenting the gathered data, materials such as markers, crayons, paper posters, and interactive whiteboards were used.

2.3. Overall Evaluation

For the overall evaluation, two aspects, as suggested by Kieslinger et al. [24], were considered: (i) the outcome level to assess the activities’ overall goals and the benefits to participants, and (ii) the process level to identify the activities’ operational strengths and weaknesses. In their evaluation framework for both levels, Kieslinger et al. [24] proposed several criteria along the three dimensions of evaluation: scientific impact, participants’ learning and empowerment, and impact on the wider society. In this work, we focussed on the participant dimension and used selected evaluation criteria and supporting questions, tailored according to the nature and specifics of the activities conducted.

3. Results

3.1. Identification Phase

The pupils’ concerns and interests, as identified through their answers to eight questions (Q1–8) in a pre-event questionnaire, were translated into research questions based on a dialogue with pupils during the presentation of the survey’s results. Overall, the results of the questionnaire (Table S1 in Supplementary Information) revealed that most pupils are familiar with the concept of noise pollution and its disturbing effects. The vast majority of them (87%) correctly identified the definition of noise (Q1); however, a few (3%) did not know what noise was, or they thought it was a pleasant sound (10%). To this end, only the questionnaire replies from those familiar with the definition of noise were considered for further processing. Of these, less than a third (31%) think their school is located in a noisy environment (Q2), while the majority (76%) think that it is noisy inside their school (Q4). The observations, as given in these responses, are consistent with those reported in the literature [33,34,35,36,37]. Among noise sources outside the school (Q3), road traffic was mentioned most often (17×), followed by rail (4×) and air traffic (3×), while factories, a tractor, and sirens were mentioned once each. As the main reasons for indoor noise (Q5), most often mentioned were children screaming (38×), followed by loud talking (26×), walking, and running down the hallway (14×), and rumbling in the dining room (14×), while noise from doors creaking/rattling, buzzing of ventilation systems, and electronics were mentioned 3× each. Perception of noise assessed based on questionnaire items Q6 and Q7 revealed comparable results. On a five-point scale (Q6), the majority of pupils (26%) selected the middle value, meaning fewer of them chose the extremes, indicating a similar share of pupils being a little (11%) and a lot (15%) annoyed by noise at school. A similar but slightly more scattered distribution of responses was observed on an eleven-point scale (Q8), with the majority of pupils (17%) choosing the middle value, and the rest evenly distributed towards both extremes, i.e., 41% less disturbed by noise and 43% more disturbed. These results triggered a discussion with the pupils on the differing perception of noise by individuals, the reasons for this, and the ways such differences can be illustrated, e.g., using different scales. In this way, pupils learned that perception of noise could be driven by various factors [38,39,40] and are a matter of subjective assessment or opinion. In agreement with this were their very diverse responses to the questionnaire item Q8. When exposed to noise, most are bothered by the fact that they cannot hear their friends and teachers (37×) and are unable to concentrate (33×). Respondents also stated that their ears hurt (20×), or that noise makes them angry (15×), nervous (15×), or agitated (13×), and two individuals indicated noise makes them sad and furious, and two of them indicated that it does not affect them.
Following the results from the questionnaire and the concerns expressed therein, three main research questions (RQs) were identified. The first two addressed outdoor noise in the vicinity of the school. Considering that the vast majority of pupils identified traffic as the dominant source of noise in the area, the first RQ was “How is traffic noise propagated in the area surrounding the school?” Related to this was the second RQ: “Which side of the school is exposed to the most noise?” This one aimed to address outdoor noise source types and magnitude. Given that most pupils identified their school as a noisy environment, the third RQ tackled indoor noise sources within the school: “Which room in the school is the noisiest?”

3.2. Design Phase

Three sets of research assignments (RAs) were defined that addressed the three main research questions identified and based on discussions with pupils the hypotheses were formulated (Table 2). For RA1 and RA2, a map of the area surrounding the school was used to identify potential noise sources and their propagation concerning the school (Figure S1 in Supplementary Information). Through this discussion, locations were identified and selected for noise measurements to test the hypotheses. In the case of RA3, the pupils named various locations within the school where different noise levels could be expected. For all RAs, the same data-recording protocol was defined (Table S3 in Supplementary Information). The pupils were instructed to write down the results in a data record table, in which, in addition to the values measured (Min, LA90, LA50, LA10, Max, and Leq dB(A)), their perceptions of noise on a five-point scale (very quiet, quiet, medium loud, loud, or very loud) were also gauged. In the case of RA2, the pupils wrote down the noise sources that they identified at each location. Measurements were carried out for one minute at each of the previously selected locations without making additional noise on their part, with the microphone on the phone held still and the sound/noise direction facing them. In this regard, we demonstrated the application’s functions, including the calibration of the device. We also discussed the importance of accuracy in the research results to ensure quality control, a topic that is recognised as one of the most important aspects of CS activities [41,42,43]. The pupils were then divided into three groups, and each group carried out one of the research assignments. In the following subsections, more details regarding the design of each individual RA are described.

3.2.1. RA1

With the help of a map, potential noise sources within a radius of 250 m surrounding the school were identified, such as automobiles, trains, and industrial facilities. Celovška Road was identified as a potential major source of noise, as it is the busiest road close to the school (Figure S1 in Supplementary Information). Walking alongside the road connecting the school to Celovška Road, it was expected that the noise from this road would be audible at the school and that levels would increase when approaching the road. The pupils agreed with these assumptions, and two respective hypotheses were formulated (Table 2). In order to test these hypotheses, four measurement locations along the 250 m of road connecting the school with Celovška Road were selected: next to the road, in front of the school and two in between (Figure S1 in Supplementary Information).

3.2.2. RA2

With the aid of a map, the urban design of the area surrounding the school and potential noise sources [44] were discussed. The pupils unanimously agreed that road traffic would be the most significant source of noise and that no other major sources in the investigated area can be expected, as the school is located in a relatively quiet area of a residential neighbourhood. However, it was assumed that there would be differences in noise levels at different sites near the school building. To this end, two respective hypotheses were formulated (Table 2). Four measurement locations were selected to test the hypotheses, one on each side of the school premises: at the entrance to the school in front of the main building; on the west side of the building; on the north side at the edge of the school playground; and on the east side next to the school gym (Figure S2 in Supplementary Information).

3.2.3. RA3

Within RA3, differences in noise levels and sources in different indoor school environments were investigated. The pupils identified various rooms in the school and ranked them according to expected noise levels. Following this discussion, three hypotheses were formulated (Table 2) regarding noise levels concerning activities taking place in individual rooms. In this respect, six rooms within the school were then selected to measure noise levels: two classrooms, the hallway, the dining room, the gym, and the library.

3.3. Deployment Phase

This section is about the pupils’ collection and evaluation of data from the three research assignments. The focus was on the pupils’ observed involvement, their ability to conduct the research, and the scientific concepts learned, especially considering their age and inexperience. The following was observed and summarised separately for the measurement/data treatment/evaluation phase.

3.3.1. Performing the Measurements

It was clear since the beginning of the measurement experiments that some pupils were more interested than others. It is also known that interest influences motivation to learn significantly [45]. This fact prompted us to engage the “silent ones” a bit more and ask them follow-up questions. Some pupils followed the data that the application collected with great interest and were impressed by how the numbers changed even with a small stimulus (e.g., when a pencil fell on the ground in complete silence). Similarly, pupils were thrilled to see how the numbers significantly increased at locations with the highest noise levels.
At each measuring point, the pupils had to be silent for 60 s to obtain measurements. For some, this was a challenging task, especially in the beginning, as they did not understand the process entirely. In contrast, others became less disciplined over time, as they lost focus or became distracted. However, they all soon adopted the “find the location–listen–identify noise sources–take measurements” routine.
In all three groups, individual pupils had difficulties writing down the results that the researcher dictated to them. This issue was handled differently from group to group, for example, pupils were instructed either to record the data one number at a time, digit by digit, or to write down the results together at the end of the measurements. During the measuring period, pupils asked questions mostly regarding the measuring device and for instructions on how to fill in the blank table that they were given. While reporting about noise perception, their answers, as expected and in agreement with the results of the pre-event questionnaire, ranged from “none at all” to “very noisy”, since they did not have an extensive frame of reference. Over time, especially at noisier locations, their perceptions became more uniform.
Very early in the measurement process, the pupils started thinking about the measured values and making comparisons. Before measurements, they tried to predict the measured value based on observations of their surroundings. Furthermore, during measurements and while recording the results, they established that, despite the short-term measurement, the noise level fluctuates considerably and that, consequently, the minimum and maximum values differ significantly from the average. Accordingly, they tried to identify the reasons for the highest measured values.

3.3.2. Data Treatment and Evaluation
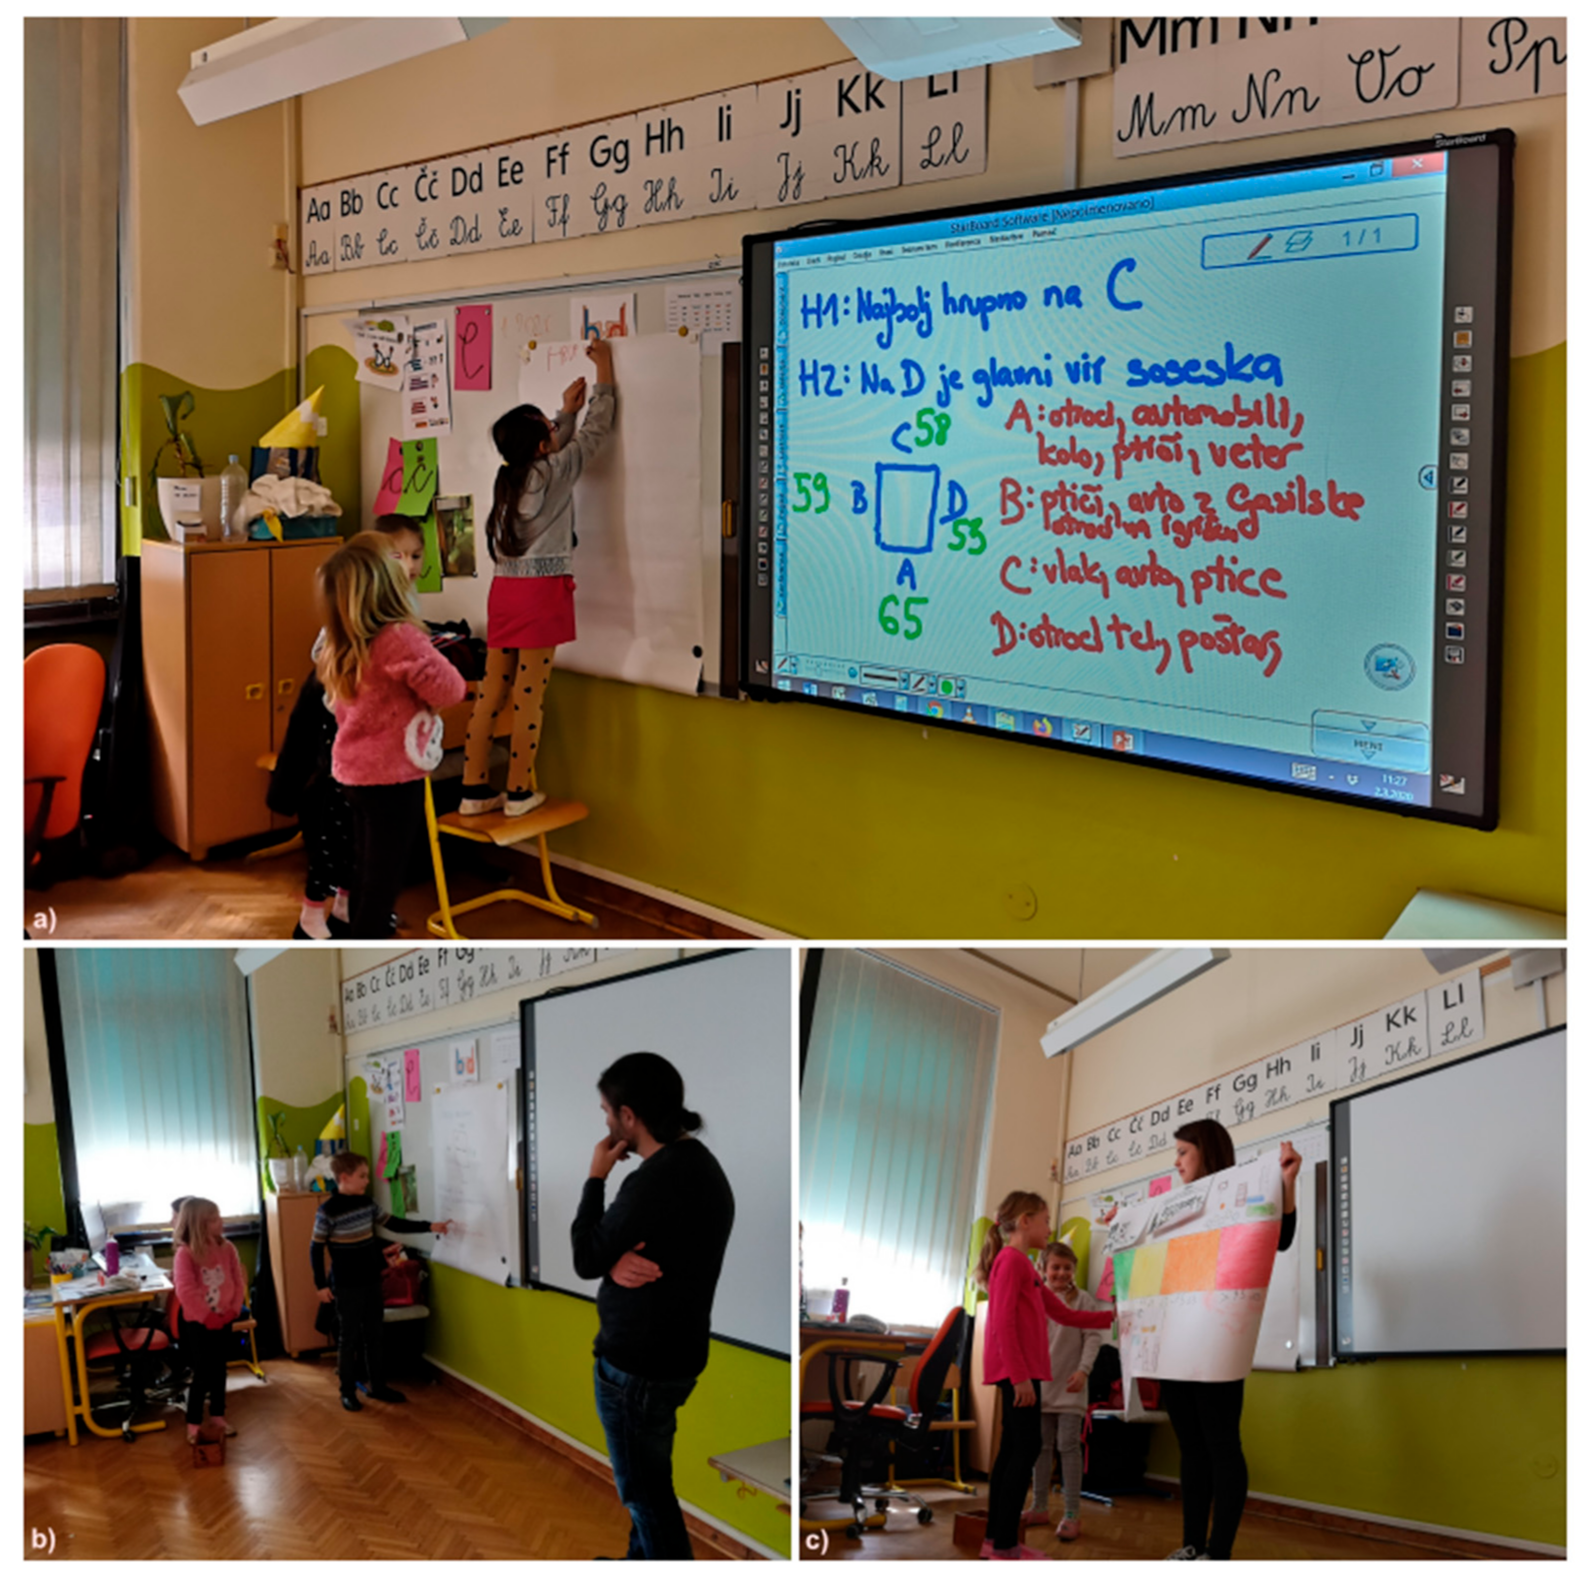
After data collection, the three groups of pupils separately started data treatment and evaluation in their classrooms. Guided by their accompanying mentors, the pupils were encouraged to process the gathered data and try to test their hypotheses. They were instructed to summarise their findings in a format that can be presented to others (Figure 2). To this end, the three groups selected slightly different approaches.
In the case of RA1, the pupils drew a poster with a chart showing a decrease in noise with increasing distance from the main street. In doing so, it was observed that the pupils’ comprehension of the gathered data varied in no small degree. Some understood the data clearly at first glance and deduced that the closer we moved to the main road, the more decibels our device measured. Others had a more difficult time understanding the relative differences. Similarly, when plotting the measurements, some had a clear picture of how the plot should look and what it means, how to identify the dependent and independent variables, and how to plot each value. Interestingly, these were not the same pupils as the ones who understood the numbers themselves. When discussing the results, they demonstrated a clear understanding of the general findings and determined that the cars were the cause of the increased noise. When all the data were compiled, they observed that as one moves away from the main road, the noise decreases, confirming H1. Alternatively, when discussing H2, they pointed out that the few cars that drove by on the smaller street in front of the school made so much noise that the noise from the cars on Celovška Road was not audible, effectively disproving H2. An important conclusion was the fact that even a single source of noise (one car) that is somewhat closer can surpass hundreds of these same sources that are a few 100 m away, and in this way learned the concept of sound propagation in the real world.
In the case of RA2, the school building was sketched, and the results were written on a digital school board (Figure 2). In this way, the results were visible to all and fostered group discussion. Three pupils volunteered to write down group observations in the form of a poster to be presented to others. For each of the measurement locations they counted, by raising hands, how many of them indicated individual levels of noise perceptions. It quickly became clear to them that perceptions vary widely. In addition to differences in noise perception, by comparing the measured values at all four locations, the pupils realised that the measurements alone were not necessarily representative and not the only indicator needed for a proper assessment of their hypothesis. For example, while most pupils perceived a singing bird as a pleasant sound, the measuring device “perceived” it as very noisy. Considering the measured values only, they were surprised to find out that both their hypotheses would have to be rejected. The overall exercise gave pupils a practical example and proof of the characteristics of sound previously discussed based on the outcome of the pre-event questionnaire. Namely, that sound perception depends on the type of sounds/noises as well as on the listener.
In the case of RA3, after reviewing the measured results, the noise levels in different indoor school environments were presented by using a colour scale that pupils drew themselves, using the dB scale from the NoiseCapture app. This scale uses green, yellow, orange, and red colours, with green indicating the lowest noise level and red the highest. The pupils then were divided into groups, with each drawing one indoor school environment in which the noise level was measured. Each group then ranked their drawing on a noise level scale below the colour that represented the measured noise level range for that indoor school environment. The pupils looked forward to the drawing process, with some putting significant effort into drawing specific details. Of course, the topic was not that interesting to everyone, so not every pupil participated diligently, with some merely following the instructions. Their findings based on the measurements confirmed their initial hypothesis. In this way, the pupils learned that the most important factor influencing indoor noise levels is the activity of the occupants, which is also in line with the answers of the pupils given in the initial questionnaire. Moreover, conducting measurements over a predefined period (1 min), they learned that the louder it is, the more the noise level varies.

3.4. Action Phase

The results obtained within the separate groups of pupils during the deployment phase were presented in the form of a “mini-symposium” (Figure 2), while the knowledge gained during the STDE was evaluated through an online quiz.

3.4.1. Mini-Symposium

All groups presented their results to their peers at a “mini-symposium”, all reunited in one classroom (Figure 2). While some pupils were more engaged while collecting and visualising the data, others were excited about presenting their findings. Although this excitement was evident, the information that they remembered from the group discussions was relatively sparse, and most required significant assistance from the researchers leading each group. Some pupils showed a better understanding of the information being presented but were unable to communicate their findings to a large group. To this end, graphical presentations were helpful, and as the quality of the visualisations increased, so did the quality of the presentations. At first, it was not easy to gauge whether the presented information was clear to the pupils, as they did not ask questions. To this end, their teachers became involved by raising relevant questions to stimulate debate. From the discussion that followed, it was evident that the pupils had understood the main ideas about conducting research and the results, but lacked knowledge about the process.

3.4.2. Evaluation Based on Quiz

To wrap up the STDE, a short quiz was prepared using the Kahoot! platform, aimed at providing some fun for pupils while simultaneously evaluating the gained knowledge. The quiz contained a total of 22 questions and statements selected based on what they learned that day. The pupils were divided into three groups. Each group was led by one of the mentors, who managed the app and helped pupils answer the questions, in which they were asked to choose the correct or incorrect answer from a list. The questions covered the following six general themes: the sound’s physical characteristics as a wave (Q: 1–4); the sound’s general characteristics (Q: 9, 6, 5); (fun) facts about sound (Q: 8, 10, 11, 14, 15, 17); sound/noise sensing (Q: 7, 12, 13); sound measurements (Q: 18, 19, 20, 21); and sound exposure (Q: 16, 22).
More specifically, in the first group of questions, we were mainly interested in whether the pupils remembered the basics facts about sound, e.g., what it is, how it travels, where it spreads, and how fast. Furthermore, we were interested in whether the pupils understood that communication takes place with the help of sound and that we can determine sound’s direction while hearing it and that we also can hear in the dark. Linked to this topic, we also were interested in whether the pupils understood that animals also communicate through sound; for example, the fact that even animals that do not have vocal cords emit sound, although differently, was included in the quiz. The second set of questions was related to noise. First, we generally were interested in whether the pupils learned what noise is. Among other queries, they were asked to rank certain sounds from quietest to loudest. Concerning the negative impacts of noise on health, we included a question on hearing organs and ear disease specialists. The third set of questions was related to the practical activities conducted during the technical day, namely noise measurement. With these questions, we mainly were interested in whether the pupils learned about the decibel as a measurement unit, the importance of calibrating measuring devices, and other vital practicalities in taking measurements. The final question was, “What can we do for our well-being and hearing?”, the answer to which comprised the overall intended lesson taught during the STDE.
Overall, the results from the quiz revealed that the pupils had learned a lot during the technical day. Namely, the vast majority of questions (82–95%) were answered correctly by all three groups (Table S2 in Supplementary Information). With the two exceptions (Q13 and Q22) in two separate groups, all of the incorrect answers are related to a specific type of question and lack of information provided. Namely, incorrect answers occurred with the “Which of the following statements is NOT correct?” type of question (Q5), in which a superficial reading can lead to the pupil missing the word “NOT”. Incorrect answers also appeared with Q8 (“In which substance does sound propagate the fastest?”) and Q3 (“Which animal is the loudest?”). The correct answers to these questions were not explicitly provided or emphasised during the STDE. This finding is further supported by the fact that all three groups correctly answered Q4 (“In which substance does sound NOT travel?”), dealing with a specific physical characteristic of a sound with which pupils of this age were not familiar before; however, it was thoroughly discussed during the dedicated experiment. The results of the quiz can also be biased for several reasons, and their interpretation not necessarily straightforward. One of the reasons is the fact that the quiz was answered in relatively large groups of students, which automatically means that not everyone can participate equally—the more dominant ones prevail. In addition, the students knew that, in addition to the correct answers, the speed of the response also counts here, which often caused chaos and hindered thoughtful debate and concentration in reaching consensus and answering of questions.

4. Conclusions and Reflections

4.1. STDE Evaluation

In addressing the citizen science evaluation framework’s participant dimension, as suggested by Kieslinger et al. [24], various criteria at the “process and feasibility” and “outcome and impact” levels were used as follows.

4.1.1. Process and Feasibility

At the process and feasibility level, the evaluation criteria comprise target group alignment, degree of participation intensity, facilitation, and communication [24]. To this end, the following was observed:
All the activities carried out within the STDE were designed for and tailored according to the capabilities and needs of the specific target group involved—Primary school pupils ages 7–8. Individual pupils’ degree of involvement varied throughout the day, from participation in group activities only to more active voluntary participation in data analysis and presentation. With the attempt to enhance their participation, very diverse approaches and tools were used, ranging from classic lecturing and conducting experiments to taking measurements and using an online learning platform. While some specific activities demanded cooperation from all pupils in the same manner (e.g., filling out a data collection sheet), others allowed for different levels and types of involvement. For example, it was observed that some pupils were more prepared to conduct measurements, while others were more involved in the analysis and discussions.
An important goal of the STDE was to stimulate pupils’ interest in science and demonstrate how the research work is conducted. To this end—Following the philosophy and concept of the CitieS-Health project—They were engaged based on the co-creation and co-design principles in all four general phases—Identification, design, deployment, and action. The actual involvement level varied between these phases. For example, the pupils were very much involved in discussions regarding the formulation of research questions and hypotheses. However, they had less say in the design of the experimental work, which researchers partly outlined prior to the event (e.g., selection of sensors, calibration procedures, and data collection templates). Due to time constraints and working in larger groups, execution of measurements mostly entailed observations from their perspective, while active evaluation and presentation of the results were limited to enthusiastic individuals and volunteers. Throughout the process, the pupils were guided by researchers who received help from teachers, and two-way communication was encouraged [46]. Communication, although fully open in both directions, mostly was one-sided in practice and took place in the direction of the researcher to pupil.

4.1.2. Outcome and Impact

At the outcome and impact level, the following criteria were considered: participating individuals’ development regarding knowledge, skills, and competencies; science literacy; behaviour and motivation; and engagement. The following was observed:
During the STDA, in addition to general knowledge gained regarding noise and health (e.g., what sound is, how it is produced, how and where it propagates, how we perceive it, how it can affect us if sound becomes noise, and that people can perceive noise differently), the pupils became familiar with noise measurement devices, including instrument calibration and the importance of data quality control. This fact has broader implications, as the pupils elicited insight into “how science works”, “what science is”, and “why we need science”, which are all crucial aspects for improving scientific literacy [47]. By directly showing them the entire process, starting with the formulation of a research questions and hypothesis, figuring out how to test it, performing the tests, evaluating how they relate to the hypothesis, and finally forming some kind of conclusions, they were able to observe and participate in the scientific method directly. While their motivation varied in the course of the day, which was to be expected for students of their age [48], overall they seemed very motivated and proud, especially when they realised that they actively were involved in activities as young scientists and understood something that they did not before. Moreover, teachers’ interest in conducting similar activities in the future also was sparked. Whether this will result in behavioural changes, as reported for similar CS activities by other authors [49,50], e.g., mitigation of noisy environments in schools, is impossible to predict; however, the pupils did reinforce their knowledge about sound and noise and learned how to reduce the negative consequences from noise pollution to benefit their health, e.g., by avoiding traffic/busy roads, not listening to loud music, and not making loud noises at school.

4.2. Recommendations for Future Research

Our recommendations for future research lead in two directions. The first aspect concerns new technologies available today and the practicalities of their use. This research used one set of tools to measure one specific environmental stressor (noise). Given the rapid development of environmental sensing systems and supporting information and communication technology tools, including applications on smartphones, the teaching possibilities in the school curriculum virtually are unlimited. However, their selection and fitness for purpose evaluation are not always straightforward. To this end, methodologies exist that can help with the evaluation and selection process of such tools [51,52], including criteria for selection of smartphone applications for noise measurements [29]. Future research is also needed to evaluate how these tools (e.g., instruments, apps) engage pupils, provide the necessary learning environment, and address these questions: Are more professional measuring devices required or are apps on smartphones enough for these types of activities? Should there be smaller, separate groups of pupils, each with a phone and app? Should pupils (and teachers) be more involved in selecting these devices and apps, and how can they be integrated into the overall learning process?
The second aspect is the evaluation of the efficiency of the overall process, specifically of the pupils’ newly acquired knowledge. In this study, an interactive game was introduced for this purpose. However, it proved to be challenging to assess the knowledge that the pupils gained during the day. A more detailed approach should be considered to discern what the average pupil learned and what the outliers were. In this specific case, a standard exam or questionnaire most likely would fail to engage them after four hours of activities, which is why an interactive game was chosen. Although it proved to be engaging and gave some insight into the pupils’ knowledge gained, a need exists for further work to establish the respective protocols. Not only is assessing their knowledge on a particular topic relevant, but it also is necessary to gather more in-depth knowledge about their experience as citizen scientists. Future research should provide more information on ways to gather and analyse this information. Do pupils understand what research is? What do they define as science? Who are researchers, and what do they do? What role does citizen science play in their lives? These questions could prove to be too complex for young children, but a simplified version would suffice.

Supplementary Materials

The following are available online at https://0-www-mdpi-com.brum.beds.ac.uk/2071-1050/12/23/10213/s1: Table S1: Pre-event questionnaire; Table S2: Kahoot quiz; Figure S1. Map of the area surrounding the school with selected measurement locations for RA1; Figure S2. Map of the area surrounding the school with selected measurement locations for RA2; Table S1. Data gathering sheet.

Author Contributions

Conceptualisation, D.K. and T.Š.; methodology, D.K.; writing—Original draft preparation, D.K.; project administration, D.K.; data curation, D.K., T.Š., R.N. and N.K.; writing—Reviewing and editing, D.K., T.Š., R.N. and N.K. All authors have read and agreed to the published version of the manuscript.

Funding

This project has received funding from the European Union’s Horizon 2020 research and innovation programme under grant agreement No 824484, and the Young Researchers Program and P1-0143 program “Cycling of substances in the environment, mass balances, modelling of environmental processes and risk assessment”, both funded by the Slovenian Research Agency. This publication reflects only the authors’ view, and the European Commission is not responsible for any use that may be made of the information it contains.

Conflicts of Interest

The authors declare no conflict of interest.

Ethical Approval

Ethical approval for the CitieS-Health project in Slovenia was obtained from the National Medical Ethics Committee of the Republic of Slovenia (approval nr. 0120-80/2020).

References

  1. Hecker, S.; Haklay, M.E.; Bowser, A.; Makuch, Z.; Vogel, J.; Bonn, A. (Eds.) Citizen Science: Innovation in Open Science, Society and Policy; UCL Press: London, UK, 2018. [Google Scholar]
  2. Lee, K.A.; Lee, J.R.; Bell, P. A Review of Citizen Science within the Earth Sciences: Potential Benefits and Obstacles. Proc. Geol. Assoc. 2020. [Google Scholar] [CrossRef]
  3. MacPhail, V.J.; Colla, S.R. Power of the People: A Review of Citizen Science Programs for Conservation. Biol. Conserv. 2020, 249, 108739. [Google Scholar] [CrossRef]
  4. Ryan, S.F.; Adamson, N.L.; Aktipis, A.; Andersen, L.K.; Austin, R.; Barnes, L.; Beasley, M.R.; Bedell, K.D.; Briggs, S.; Chapman, B.; et al. The Role of Citizen Science in Addressing Grand Challenges in Food and Agriculture Research. Proc. R. Soc. B Biol. Sci. 2018, 285, 20181977. [Google Scholar] [CrossRef] [PubMed]
  5. Hunt, N.; O’Grady, M.; Muldoon, C.; Kroon, B.; Rowlands, T.; Wan, J.; O’Hare, G. Citizen Science: A Learning Paradigm for the Smart City? Interact. Des. Archit. J. 2015, 27, 28–43. [Google Scholar]
  6. Makuch, K.; Aczel, M. Children and Citizen Science. In Citizen Science: Innovation in Open Science, Society and Policy; Hecker, S., Haklay, M., Bowser, A., Makuch, Z., Vogel, J., Bonn, A., Eds.; UCL Press: London, UK, 2018; pp. 391–409. [Google Scholar]
  7. Mominó, J.M.; Piera, J.; Jurado, E. Citizen Observatories as Advanced Learning Environments. In Analyzing the Role of Citizen Science in Modern Research; Ceccaroni, L., Piera, J., Eds.; IGI Global: Hershey, PA, USA, 2016; pp. 192–212. [Google Scholar]
  8. Harlin, J.; Kloetzer, L.; Patton, D.; Leonhard, C. Leysin American School high school students. Turning Students into Citizen Scientists. In Citizen Science: Innovation in Open Science, Society and Policy; Hecker, S., Haklay, M., Bowser, A., Makuch, Z., Vogel, J., Bonn, A., Eds.; UCL Press: London, UK, 2018; pp. 410–428. [Google Scholar]
  9. Shah, H.R.; Martinez, L.R. Current Approaches in Implementing Citizen Science in the Classroom. J. Microbiol. Biol. Educ. 2016, 17, 17–22. [Google Scholar] [CrossRef] [PubMed]
  10. Ejiwale, J. Barriers to Successful Implementation of STEM Education. J. Educ. Learn. 2013, 7, 63. [Google Scholar] [CrossRef] [Green Version]
  11. Kearney, C. Efforts to Increase Students’ Interest in Pursuing Science, Technology, Engineering and Mathematics Studies and Careers; European Schoolnet: Brussels, Belgium, 2016; p. 96. [Google Scholar]
  12. Queiruga-Dios, M.Á.; López-Iñesta, E.; Diez-Ojeda, M.; Sáiz-Manzanares, M.C.; Vázquez Dorrío, J.B. Citizen Science for Scientific Literacy and the Attainment of Sustainable Development Goals in Formal Education. Sustainability 2020, 12, 4283. [Google Scholar] [CrossRef]
  13. Soanes, K.; Cranney, K.; Dade, M.C.; Edwards, A.M.; Palavalli-Nettimi, R.; Doherty, T.S. How to Work with Children and Animals: A Guide for School-Based Citizen Science in Wildlife Research. Austral Ecol. 2020, 45, 3–14. [Google Scholar] [CrossRef]
  14. Saunders, M.E.; Roger, E.; Geary, W.L.; Meredith, F.; Welbourne, D.J.; Bako, A.; Canavan, E.; Herro, F.; Herron, C.; Hung, O.; et al. Citizen Science in Schools: Engaging Students in Research on Urban Habitat for Pollinators. Austral Ecol. 2018, 43, 635–642. [Google Scholar] [CrossRef] [Green Version]
  15. Kelemen-Finan, J.; Scheuch, M.; Winter, S. Contributions from Citizen Science to Science Education: An Examination of a Biodiversity Citizen Science Project with Schools in Central Europe. Int. J. Sci. Educ. 2018, 40, 2078–2098. [Google Scholar] [CrossRef]
  16. Zipf, L.; Primack, R.B.; Rothendler, M. Citizen Scientists and University Students Monitor Noise Pollution in Cities and Protected Areas with Smartphones. PLoS ONE 2020, 15, e0236785. [Google Scholar] [CrossRef] [PubMed]
  17. Hyder, A.; May, A.A. Translational Data Analytics in Exposure Science and Environmental Health: A Citizen Science Approach with High School Students. Environ. Health 2020, 19, 73. [Google Scholar] [CrossRef] [PubMed]
  18. Booth, J.N.; Chesham, R.A.; Brooks, N.E.; Gorely, T.; Moran, C.N. A Citizen Science Study of Short Physical Activity Breaks at School: Improvements in Cognition and Wellbeing with Self-Paced Activity. BMC Med. 2020, 18, 62. [Google Scholar] [CrossRef]
  19. Kermish-Allen, R.; Peterman, K.; Bevc, C.A. The Utility of Citizen Science Projects in K-5 Schools: Measures of Community Engagement and Student Impacts. Cult. Stud. Sci. Educ. 2018, 14, 627–641. [Google Scholar] [CrossRef]
  20. Stansfeld, S.; Clark, C. Health Effects of Noise Exposure in Children. Curr. Environ. Health Rep. 2015, 2, 171–178. [Google Scholar] [CrossRef] [Green Version]
  21. van Kamp, I.; Davies, H. Noise and Health in Vulnerable Groups: A Review. Noise Health 2013, 15, 153–159. [Google Scholar] [CrossRef] [PubMed]
  22. Clark, C.; Paunovic, K. WHO Environmental Noise Guidelines for the European Region: A Systematic Review on Environmental Noise and Quality of Life, Wellbeing and Mental Health. Int. J. Environ. Res. Public. Health 2018, 15, 2400. [Google Scholar] [CrossRef] [Green Version]
  23. Schubert, M.; Hegewald, J.; Freiberg, A.; Starke, K.R.; Augustin, F.; Riedel-Heller, S.G.; Zeeb, H.; Seidler, A. Behavioral and Emotional Disorders and Transportation Noise among Children and Adolescents: A Systematic Review and Meta-Analysis. Int. J. Environ. Res. Public. Health 2019, 16, 3336. [Google Scholar] [CrossRef] [Green Version]
  24. Kieslinger, B.; Schäfer, T.; Heigl, F.; Dörler, D.; Richter, A.; Bonn, A. Evaluating Citizen Science—Towards an Open Framework. In Citizen Science—Innovation in Open Science; Hekler, S., Haklay, M., Bowser, A., Vogel, J., Bonn, A., Eds.; Society and Policy; UCL Press: London, UK, 2018; pp. 81–95. [Google Scholar]
  25. MESS. The Education System in the Republic of Slovenia 2018/2019; Ministry of Education, Science and Sport of the Republic of Slovenia: Ljubljana, Slovenia, 2019.
  26. Raul, T.; Ortiz, R.; Gignac, F.; Daher, C.; Nieuwenhuijsen, M.; Rodney, O.; Gabriele, D.; Giulia, M.; Antonella, F.; Bruna, D.; et al. Documentation on Activities and Outcomes in CS Actions; 1st Report; CitieS-Health: Barcelona, Spain, 2019. [Google Scholar]
  27. Dancing Rice Experiment. Available online: http://homeschoolfridays.com/how-to-see-sound-experiments-for-kids/ (accessed on 28 October 2020).
  28. Bell JAR Experiment. Available online: https://www.youtube.com/watch?v=oY_9hKdTG8o (accessed on 28 October 2020).
  29. Guillaume, G.; Can, A.; Petit, G.; Fortin, N.; Palominos, S.; Gauvreau, B.; Bocher, E.; Picaut, J. Noise Mapping Based on Participative Measurements. Noise Mapp. 2016, 3. [Google Scholar] [CrossRef] [Green Version]
  30. Picaut, J.; Fortin, N.; Bocher, E.; Petit, G.; Aumond, P.; Guillaume, G. An Open-Science Crowdsourcing Approach for Producing Community Noise Maps Using Smartphones. Build. Environ. 2019, 148, 20–33. [Google Scholar] [CrossRef]
  31. Kardous, C.A.; Shaw, P.B. Evaluation of Smartphone Sound Measurement Applications. J. Acoust. Soc. Am. 2014, 135, EL186–EL192. [Google Scholar] [CrossRef] [PubMed] [Green Version]
  32. Wang, A.I.; Tahir, R. The Effect of Using Kahoot! For Learning—A Literature Review. Comput. Educ. 2020, 149, 103818. [Google Scholar] [CrossRef]
  33. Chan, K.M.K.; Li, C.M.; Ma, E.P.M.; Yiu, E.M.L.; McPherson, B. Noise Levels in an Urban Asian School Environment. Noise Health 2015, 17, 48–55. [Google Scholar] [CrossRef] [PubMed] [Green Version]
  34. Kapetanaki, S.; Konstantopoulou, S.; Linos, A. Noise Measurements and Sources of Noise in Primary Schools Located in Vulnerable Areas in Greece: A Cross-Sectional Study. Occup. Med. Health Aff. 2018, 6, 1–10. [Google Scholar] [CrossRef]
  35. Woolner, P.; Hall, E. Noise in Schools: A Holistic Approach to the Issue. Int. J. Environ. Res. Public. Health 2010, 7, 3255–3269. [Google Scholar] [CrossRef] [PubMed] [Green Version]
  36. Grubesa, S.; Suhanek, M. Traffic Noise. Acoust. Mater. 2020. [Google Scholar] [CrossRef]
  37. Environmental Noise in Europe, European Environment Agency. 2020. Available online: https://www.eea.europa.eu/publications/environmental-noise-in-europe (accessed on 21 September 2020).
  38. Skagerstrand, Å.; Köbler, S.; Stenfelt, S. Loudness and Annoyance of Disturbing Sounds—Perception by Normal Hearing Subjects. Int. J. Audiol. 2017, 56, 775–783. [Google Scholar] [CrossRef]
  39. Koprowska, K.; Łaszkiewicz, E.; Kronenberg, J.; Marcińczak, S. Subjective Perception of Noise Exposure in Relation to Urban Green Space Availability. Urban For. Urban Green. 2018, 31, 93–102. [Google Scholar] [CrossRef]
  40. Reybrouck, M.; Podlipniak, P.; Welch, D. Music and Noise: Same or Different? What Our Body Tells Us. Front. Psychol. 2019, 10. [Google Scholar] [CrossRef]
  41. Kosmala, M.; Wiggins, A.; Swanson, A.; Simmons, B. Assessing Data Quality in Citizen Science. Front. Ecol. Environ. 2016, 14, 551–560. [Google Scholar] [CrossRef] [Green Version]
  42. Lukyanenko, R.; Parsons, J.; Wiersma, Y.F. Emerging Problems of Data Quality in Citizen Science. Conserv. Biol. 2016, 30, 447–449. [Google Scholar] [CrossRef] [PubMed] [Green Version]
  43. Aceves-Bueno, E.; Adeleye, A.S.; Feraud, M.; Huang, Y.; Tao, M.; Yang, Y.; Anderson, S.E. The Accuracy of Citizen Science Data: A Quantitative Review. Bull. Ecol. Soc. Am. 2017, 98, 278–290. [Google Scholar] [CrossRef] [Green Version]
  44. Morillas, J.M.B.; Gozalo, G.R.; González, D.M.; Moraga, P.A.; Vílchez-Gómez, R. Noise Pollution and Urban Planning. Curr. Pollut. Rep. 2018, 4, 208–219. [Google Scholar] [CrossRef]
  45. Harackiewicz, J.M.; Smith, J.L.; Priniski, S.J. Interest Matters: The Importance of Promoting Interest in Education. Policy Insights Behav. Brain Sci. 2016, 3, 220–227. [Google Scholar] [CrossRef] [PubMed] [Green Version]
  46. Prozesky, D.R. Communication and Effective Teaching. Community Eye Health 2000, 13, 44–45. [Google Scholar]
  47. Krajcik, J.S.; Sutherland, L.M. Supporting Students in Developing Literacy in Science. Science 2010, 328, 456–459. [Google Scholar] [CrossRef]
  48. Malmberg, L.-E.; Lim, W.H.T.; Tolvanen, A.; Nurmi, J.-E. Within-Student Variability in Learning Experiences, and Teachers’ Perceptions of Students’ Task-Focus. Frontline Learn. Res. 2016, 4, 62–82. [Google Scholar] [CrossRef] [Green Version]
  49. Jordan, R.C.; Gray, S.A.; Howe, D.V.; Brooks, W.R.; Ehrenfeld, J.G. Knowledge Gain and Behavioral Change in Citizen-Science Programs. Conserv. Biol. 2011, 25, 1148–1154. [Google Scholar] [CrossRef]
  50. Toomey, A.H.; Domroese, M.C. Can Citizen Science Lead to Positive Conservation Attitudes and Behaviors? Hum. Ecol. Rev. 2013, 20, 50–62. [Google Scholar]
  51. Peake, J.M.; Kerr, G.; Sullivan, J.P. A Critical Review of Consumer Wearables, Mobile Applications, and Equipment for Providing Biofeedback, Monitoring Stress, and Sleep in Physically Active Populations. Front. Physiol. 2018, 9, 743. [Google Scholar] [CrossRef]
  52. Liu, S.; Gao, R.X.; Mo, L.; Freedson, P.S. Wearable Sensing for Physical Activity Measurement: Design and Performance Evaluation. IFAC Proc. Vol. 2013, 46, 53–60. [Google Scholar] [CrossRef]
Figure 1. STDE activities: (a) demonstration of noise measurement devices; (b) mentors explaining details from data collection; (c) “Dancing rice” experiment; and (d) pupils performing measurements and recording data in a school gym.
Sustainability 12 10213 g001
Figure 2. Pupils evaluate the results collected during the measurement experiments: (a) summarising the results on a poster; (b,c) presenting results during the “mini-symposium”.
Sustainability 12 10213 g002
Table 1. The School Tech-Day Event (STDE) agenda, including the aims and tools used within individual items.
ItemsDuration (min)AimsTools
Introduction10To raise awareness and empower pupils about the importance of sounds and hearing in everyday life.PPT presentation
Questionnaire results10To identify relevant research questions.PPT presentation
Science experiments demonstrations15To teach pupils about a sound’s physical properties.“Dancing rice”, “Bell jar” and “Let’s Get Loud” experiments
Co-design of experiments20To define research hypotheses and to design the experimental work, including the tools to be used.Map of the school’s surroundings
Measurement experiments60To gather data and information needed for hypothesis testing.Smartphones with a sound measurement app
External microphones;
Sound-level calibrator; Data collection sheets
Presentation of the results60To encourage pupils to think about the collected results, as well as their evaluation and presentation.Markers, crayons, paper posters, interactive whiteboards
Quiz20To evaluate the knowledge gained during the STDE.The Kahoot! game-based learning platform
Table 2. The research assignments, aims, and respective hypotheses.
Research AssignmentsAimsHypotheses
RA1: A road as a source of noiseTo investigate the propagation of traffic noise between the busiest nearby road and the school.
  • H1: The noise level will decrease with distance from Celovška Road.
  • H2: The noise from cars on Celovška Road is audible from the school.
RA2: Exposure of the school to sources of noise from its surroundingsTo identify which side of the school building is exposed to the most noise and what are the main sources of noise in that area.
  • H1: Noise will be the loudest at Location C due to the proximity of a major road.
  • H2: Neighborhood noise is the predominant noise at Location D.
RA3: Noise on school premisesTo investigate differences in noise levels between different school rooms.
  • H1: The noisiest place in the school is the gym.
  • H2: The quietest place in the school is the library.
  • H3: The noise level at a particular location varies and depends on the activity.
Publisher’s Note: MDPI stays neutral with regard to jurisdictional claims in published maps and institutional affiliations.

