Article

Waste to Catalyst: Synthesis of Catalysts from Sewage Sludge of the Mining, Steel, and Petroleum Industries

by
Gabriela Castro-León
,
Erik Baquero-Quinteros
,
Bryan G. Loor
,
Jhoselin Alvear
,
Diego E. Montesdeoca Espín
,
Andrés De La Rosa
and
Carolina Montero-Calderón
*
Chemical Engineering Faculty, Universidad Central del Ecuador, Ritter s/n & Bolivia, Quito 17-01-3972, Ecuador
*
Author to whom correspondence should be addressed.
Sustainability 2020, 12(23), 9849; https://0-doi-org.brum.beds.ac.uk/10.3390/su12239849
Submission received: 5 August 2020 / Revised: 21 September 2020 / Accepted: 22 September 2020 / Published: 25 November 2020

Abstract

:
The generation of sewage sludge presents a problem for several manufacturing companies as it results from industrial processes or effluent treatment systems. The treatment of this type of waste requires high economic investment, for this reason, it is necessary to find alternatives to recover the valuable materials of the sludges. In this study, metal catalysts were synthesized using waste sludge from the steel, mining, and hydrocarbon industries. The waste sludge was subjected to thermal treatments for the removal of organic content and the reduction of metals with hydrogen current to activate their catalytic properties. The sludge and synthesized catalysts were analyzed to determine their physical, chemical, thermoenergetic, and catalytic properties. Catalytic activity was evaluated using CO chemisorption and by thermal–catalytic decomposition of crude oil. The best conditions for synthesizing the catalysts were a calcination temperature between 300 and 500 °C and a reduction temperature between 300 and 900 °C. The catalysts presented a specific surface between 2.33 and 16.78 m2/g. The catalytic material had a heat capacity between 0.7 and 1.2 kJ/kg∙K. The synthesized materials presented catalytic activity comparable to that of commercial catalysts. With this recovery technique, the industrial waste can be valorized, obtaining catalyst derived from the sludges and promoting the circular economy of manufacturing companies.

1. Introduction

Global waste generation is expected to double by 2025, of which industrial waste will comprise nearly 50% of the total. Global waste generation is projected to reach 11 million tons/day by 2100 [1].
Production processes use raw materials based on metals or containing metals, and some wastes are generated as sludge in the production stages, which often cannot be minimized. These process sludges, as well as those generated in water treatment systems, are considered hazardous waste according to Ecuadorian regulations [2]; therefore, sludge must be technically disposed of through environmental management. In Ecuador in 2017, it was estimated that 300 thousand tons of sewage sludge was generated and that companies invested approximately $200 million in environmental prevention processes [3]. Thus, Ecuador seeks to promote sustainable production and responsible consumption alternatives that include the recovery of raw materials from waste as part of its new economic development agenda based on the circular economy [4].
The economic potential of organic sewage sludge valorization for biogas production, co-incineration, or as a fertilizer in landscaping and agriculture is considered to be a possible line of action for the support of the social and solidarity economy of communities in developing countries [5].
Alternatives involving the encapsulation of sludge as a part of construction materials have been proposed, such as the incorporation of tailings from lead mine washing plants in ceramics for bricks [6], the use of gold mine tailings as cement mortar [7,8], and the preparation of high-porosity bricks by utilizing red mud and mine tailings [9]. Some recovery alternatives for the synthesis of chemicals for the retention of metal contaminants have been reported, such as the use of residuals from drinking water treatment as an adsorbent for the retention of phosphorus compounds [10], for metal removal from electroplating wastewater effluent [11], or the adsorption of heavy metal ions by porous material prepared with silicate tailings [12]. The recovery of metal components present in sludge includes the production of iron-based secondary raw material from bauxite tailings and red muds [13] and gold recovery from mining waste by thiosulphate leaching [14]. Sludges from the electroplating process have been used to produce inorganic pigments for applications in ceramic glazes [15], and kimberlite tailings have been used in carbon capture [16].
The synthesis of metal catalysts from sewage sludge and their application in the oxidation of hydrocarbons has been reported since 2000 [17]. Since then, similar applications have been reported for multiple purposes, such as the oxidative dehydrogenation of propane with textile sludge-based catalysts [18], for the removal of volatile organic compounds using ferric catalysts derived from sludge produced by water purification [19], and for the N−H insertion reaction using catalysts derived from sewage sludge of carbonaceous materials [20].
Our research group has studied catalytic activity in crude cracking reactions using a catalyst derived from sludge resulting from wastewater treatment by the textile [21], the galvanoplasty [22], and tannery [23] industries, obtaining yields comparable to those for commercial catalysts. These catalysts have also been tested in terms of the catalytic decomposition of methane [24], in which conversion rates of reactants higher than 90% were obtained. Due to this, materials that have part of the organic or polymeric matrix with oxides or metals [25,26] can be used as photocatalyst.
This work evaluated the possibility of synthesizing catalysts from waste sludge from three industries with the potential for economic development in Ecuador: sludge from the wastewater treatment plants of steelworks, metal mining tailings, and tank bottom sludge from hydrocarbon storage. These sludges contain metals such as iron, gold, and copper that could confer catalytic properties. After synthesis, the physical, chemical, and thermoenergetic properties were characterized, and the catalytic capacity of the materials was determined. The catalysts derived from mining tailings presented good thermal stability and a catalytic activity comparable to commercial catalysts. This alternative method to valorize hazardous sludges could aid in the implementation of the national development plans based on the circular economy.

2. Results

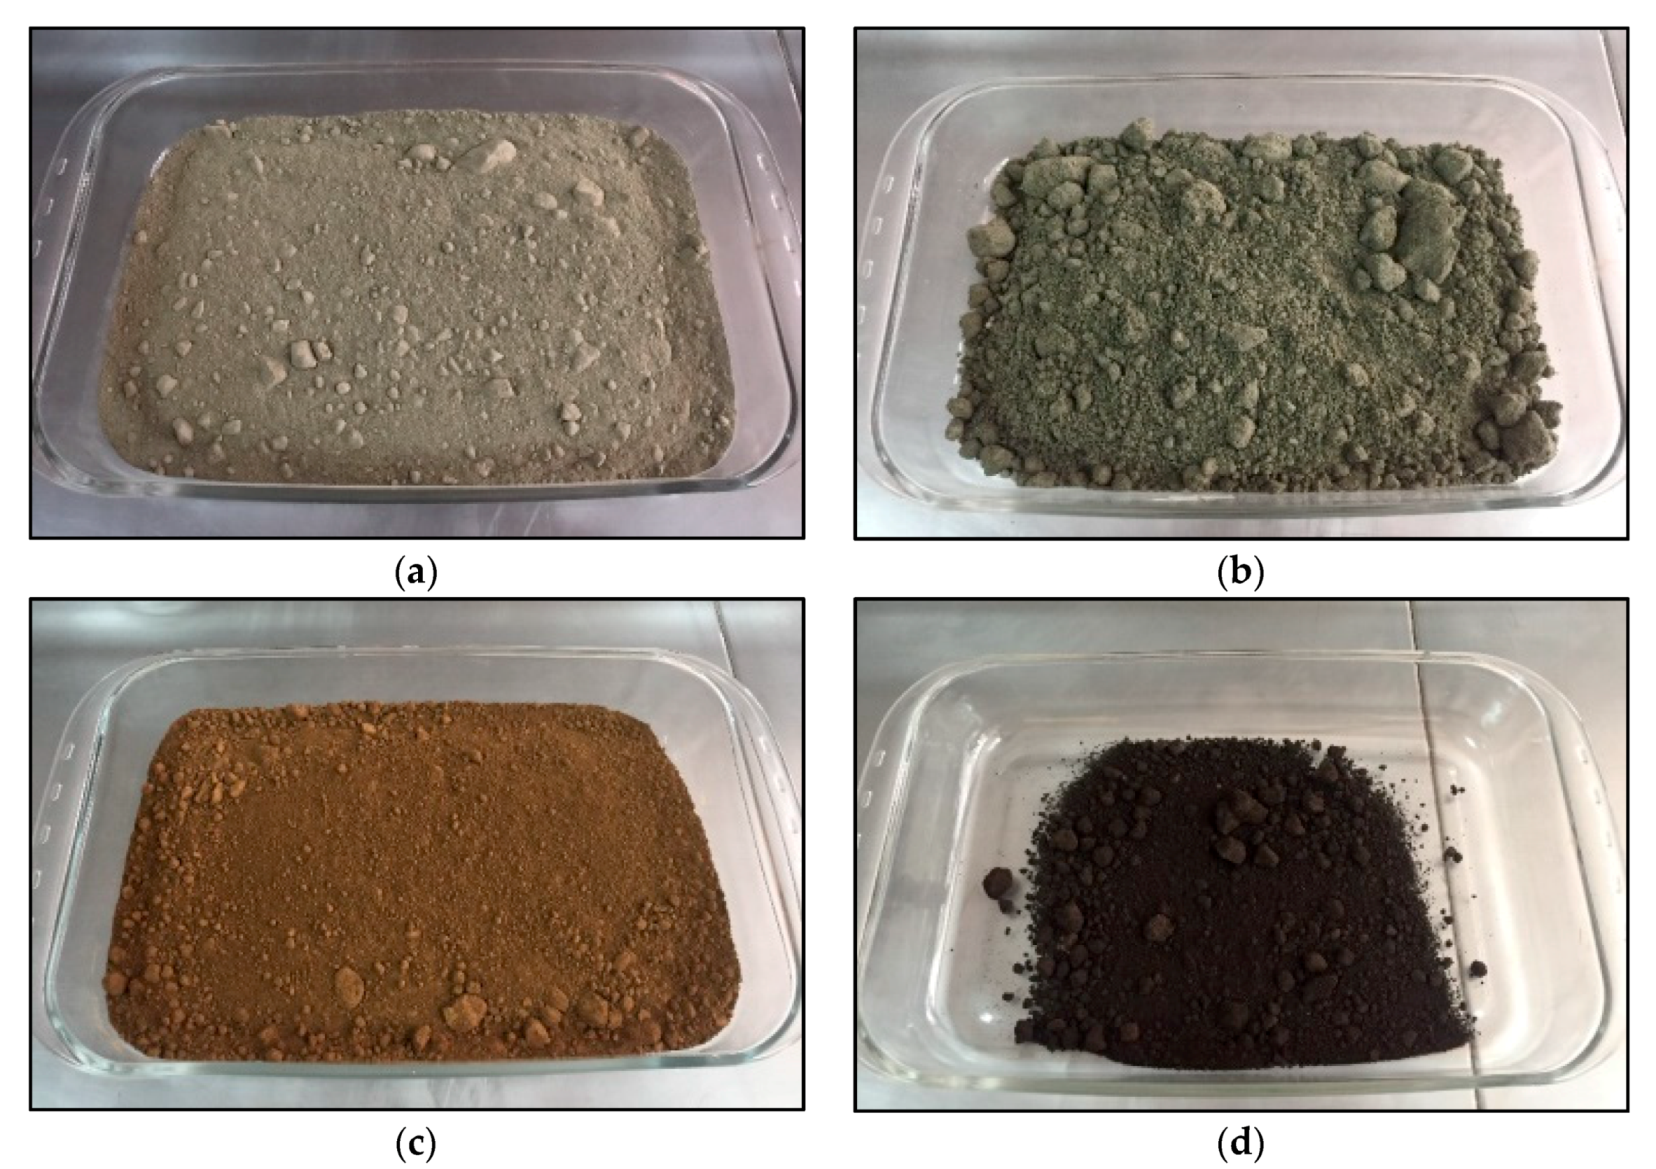
2.1. Samples Identification

The sludge samples were supplied by three different manufacturing companies located in Ecuador (Table 1). Company 1, located in the south of Ecuador, is a mine tailing deposit where artisanal mining waste is collected. This company generates two types of sludge: aged tailings (S1) and fresh tailings (S2). Company 2, located in the center of Ecuador, is a steelwork facility where the residual sludge comes from its wastewater treatment plant (S3). Company 3 is located in the Amazon region of Ecuador, and the sludge (S4) is bottom waste from petroleum storage tanks. The catalytic materials derived from each of these sludges were identified as C1, C2, C3, and C4 (Figure 1a–d).

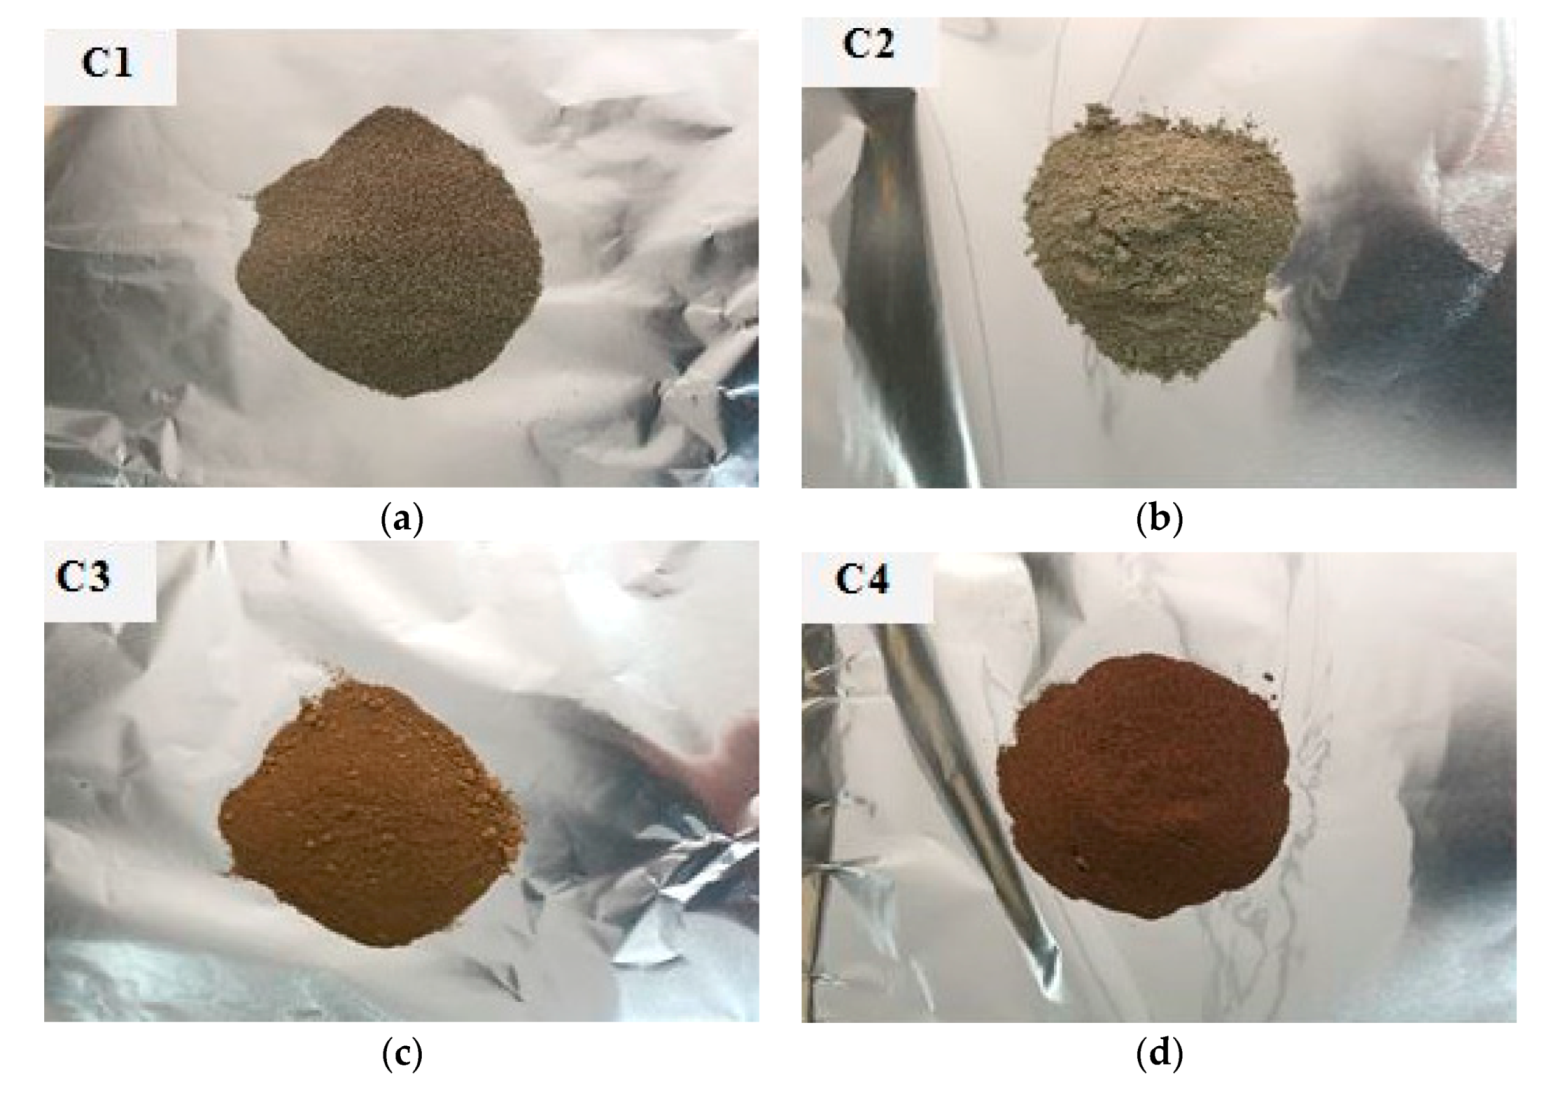
2.2. Catalyst Preparation

The preparation of catalysts has been described in previous works by our research group [21,22]. The samples were gradually dried in order to prevent damage to their porous structure. At the same time, temperatures and calcination times were chosen based on the metals present in the sludge, namely Au [27,28,29], Fe [30,31,32,33], and Cu [29,34,35]. The range of calcination temperatures was selected according to the possible metals contained in the samples to avoid metal sintering due to high temperatures. The conditions for sludge drying and calcination are given in Table 2.
Calcination was performed at three temperatures based on the possible metals present in the sludge, which were above 300 °C to ensure the removal of organic material while being below 600 °C. Additionally, a heating ramp was used to prevent breaking of the porous structure caused by abrupt changes in temperature [36] and to avoid the structural reordering of solid particles, which causes a decrease in the number of active sites. The synthesized catalysts are depicted in Figure 2a–d.

2.3. Characterization of Chemical Properties of Sludge and Catalysts

In order to verify the elimination of elemental components contained in the sludge after drying and calcination, the percentages of carbon, hydrogen, nitrogen, and sulfur (CHNS analysis) were measured in the sludge (S) and catalysts (C). These results, as shown in Table 3, illustrate low nitrogen contents in the samples from the analyzed industries. The sludge from oil storage tanks had residual metals that were impregnated with oil and other hydrocarbons [37]; therefore, the catalysts synthesized from these materials had the highest contents of carbon, hydrogen, and sulfur when compared to the other catalysts. The difference in the storage time of mine tailings sludge did not have a significant impact on the elemental composition; in the case of sludge from wastewater treatment in the steel industry, its carbon content is attributable to the steel formulation itself.
Despite the different nature of the sludges, it was observed that all tend to exhibit a decreased elemental composition after calcination. The elimination of elemental compounds prevents the formation of compounds that can deactivate the catalysts, such as sulfur oxide [38].
The metallic contents of the sludge and catalysts were measured using atomic absorption (AA) tests. Table 4 shows that the four synthesized catalysts are predominantly iron in content, which is characteristic of industrial waste [39]. The residue and catalyst from the steel industry have the highest iron content and traces of chromium and copper, which are probably attributable to the compounds used during the water treatment from which this sludge originates.
Traces of gold and copper, typical of mining activity, could be identified in the tailing sludge. Copper traces were detected in the sludge from the bottoms of hydrocarbon storage tanks. The content of Fe in the catalyst is around 2.5–7.5%, similar to the iron content in the catalyst used by selective catalytic reduction of NOx [40].

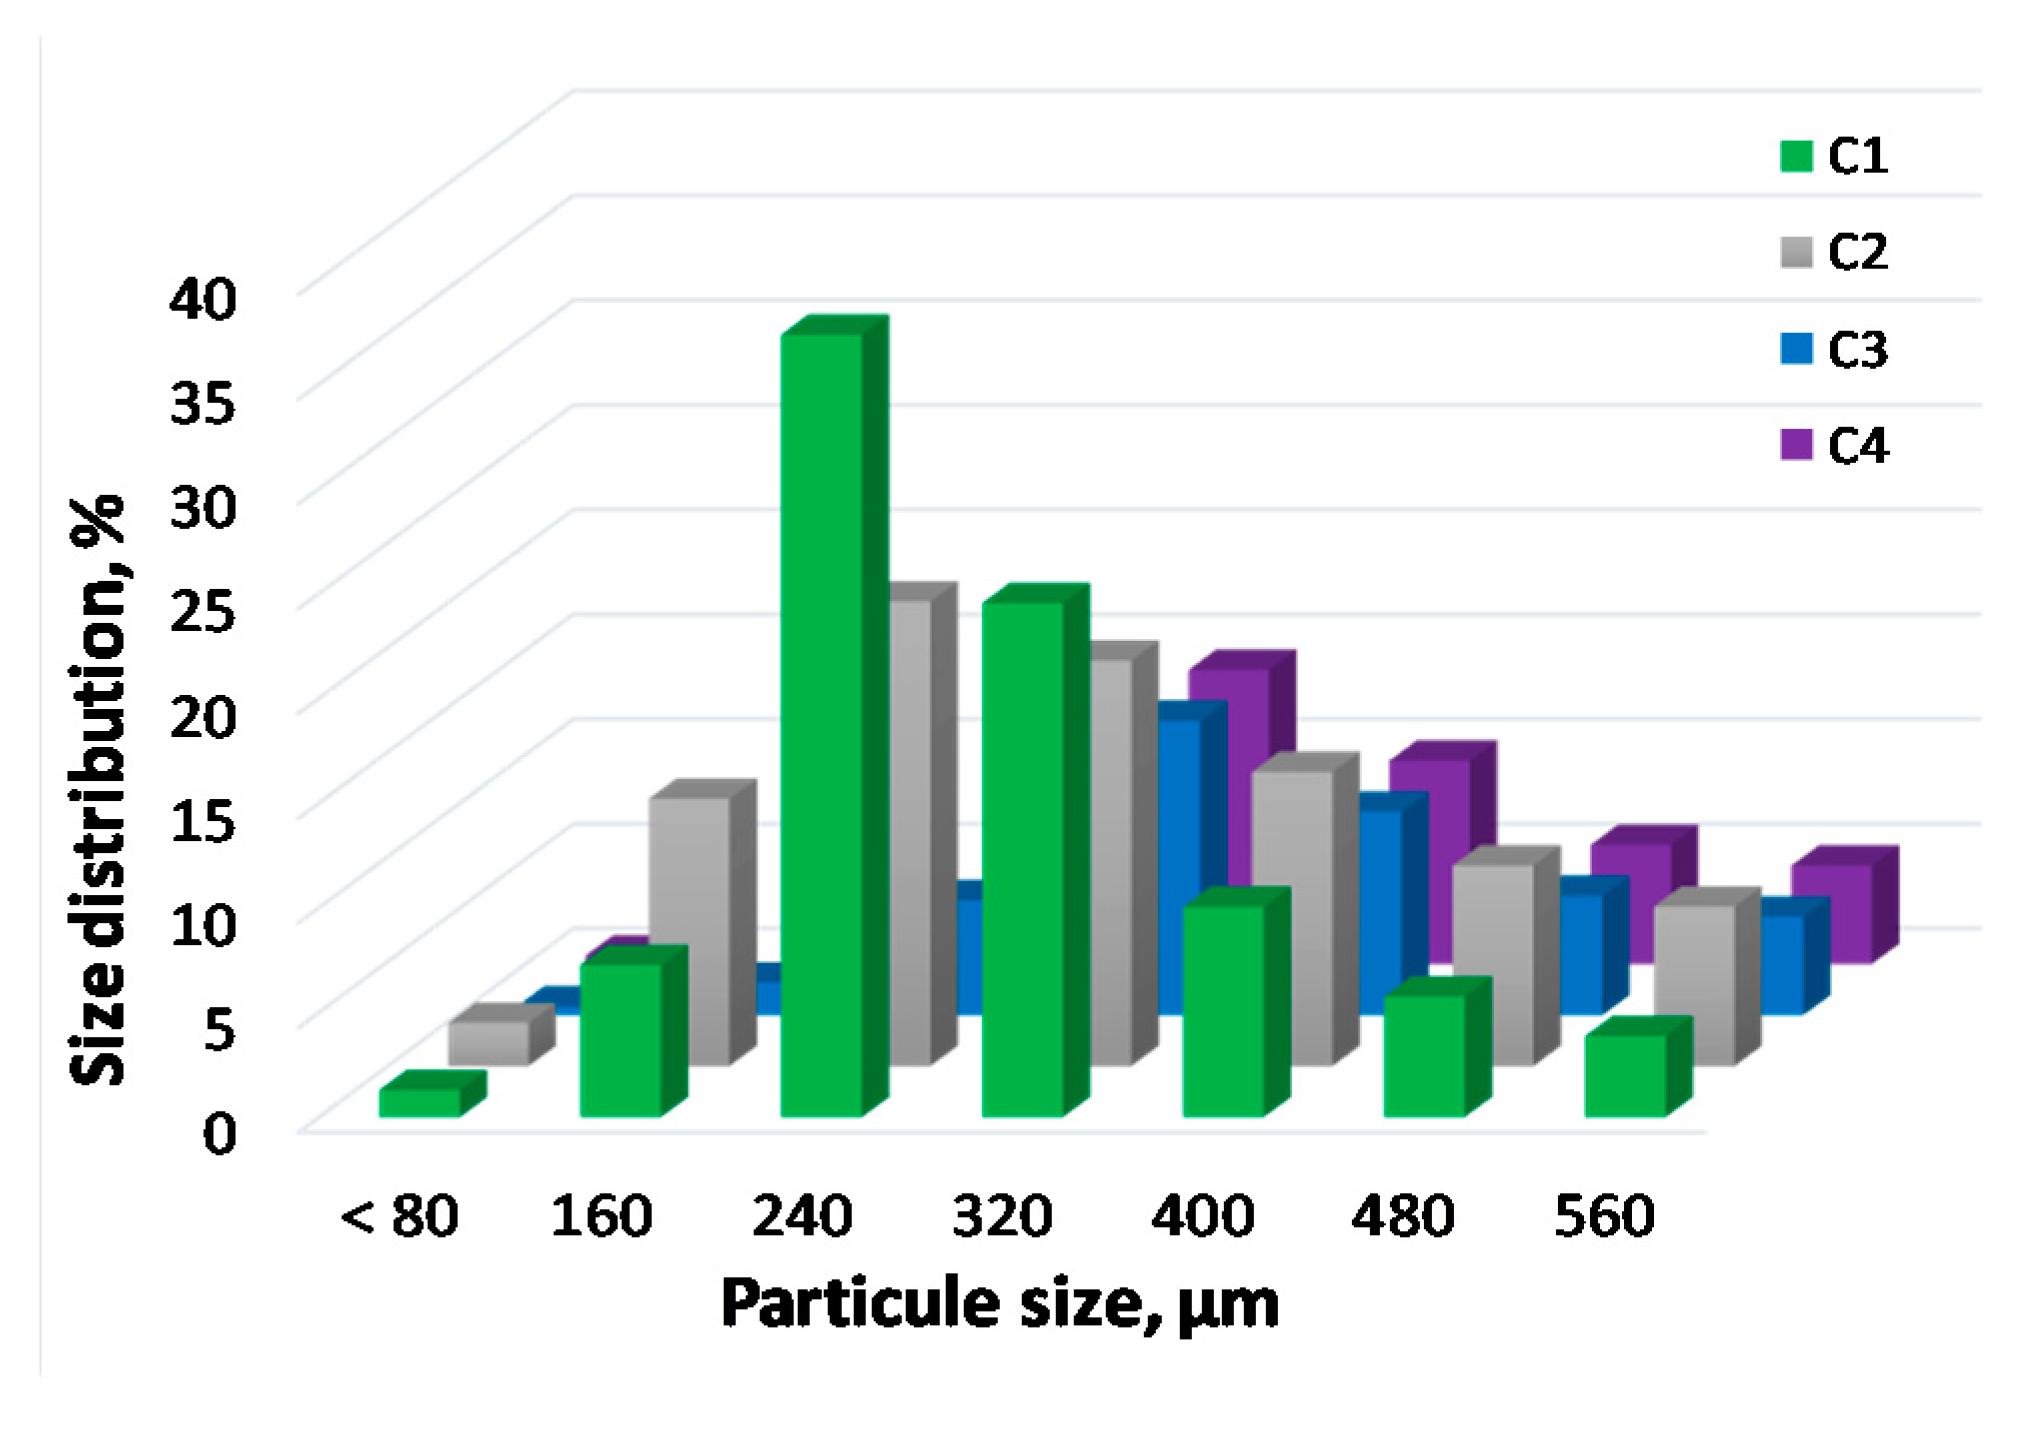
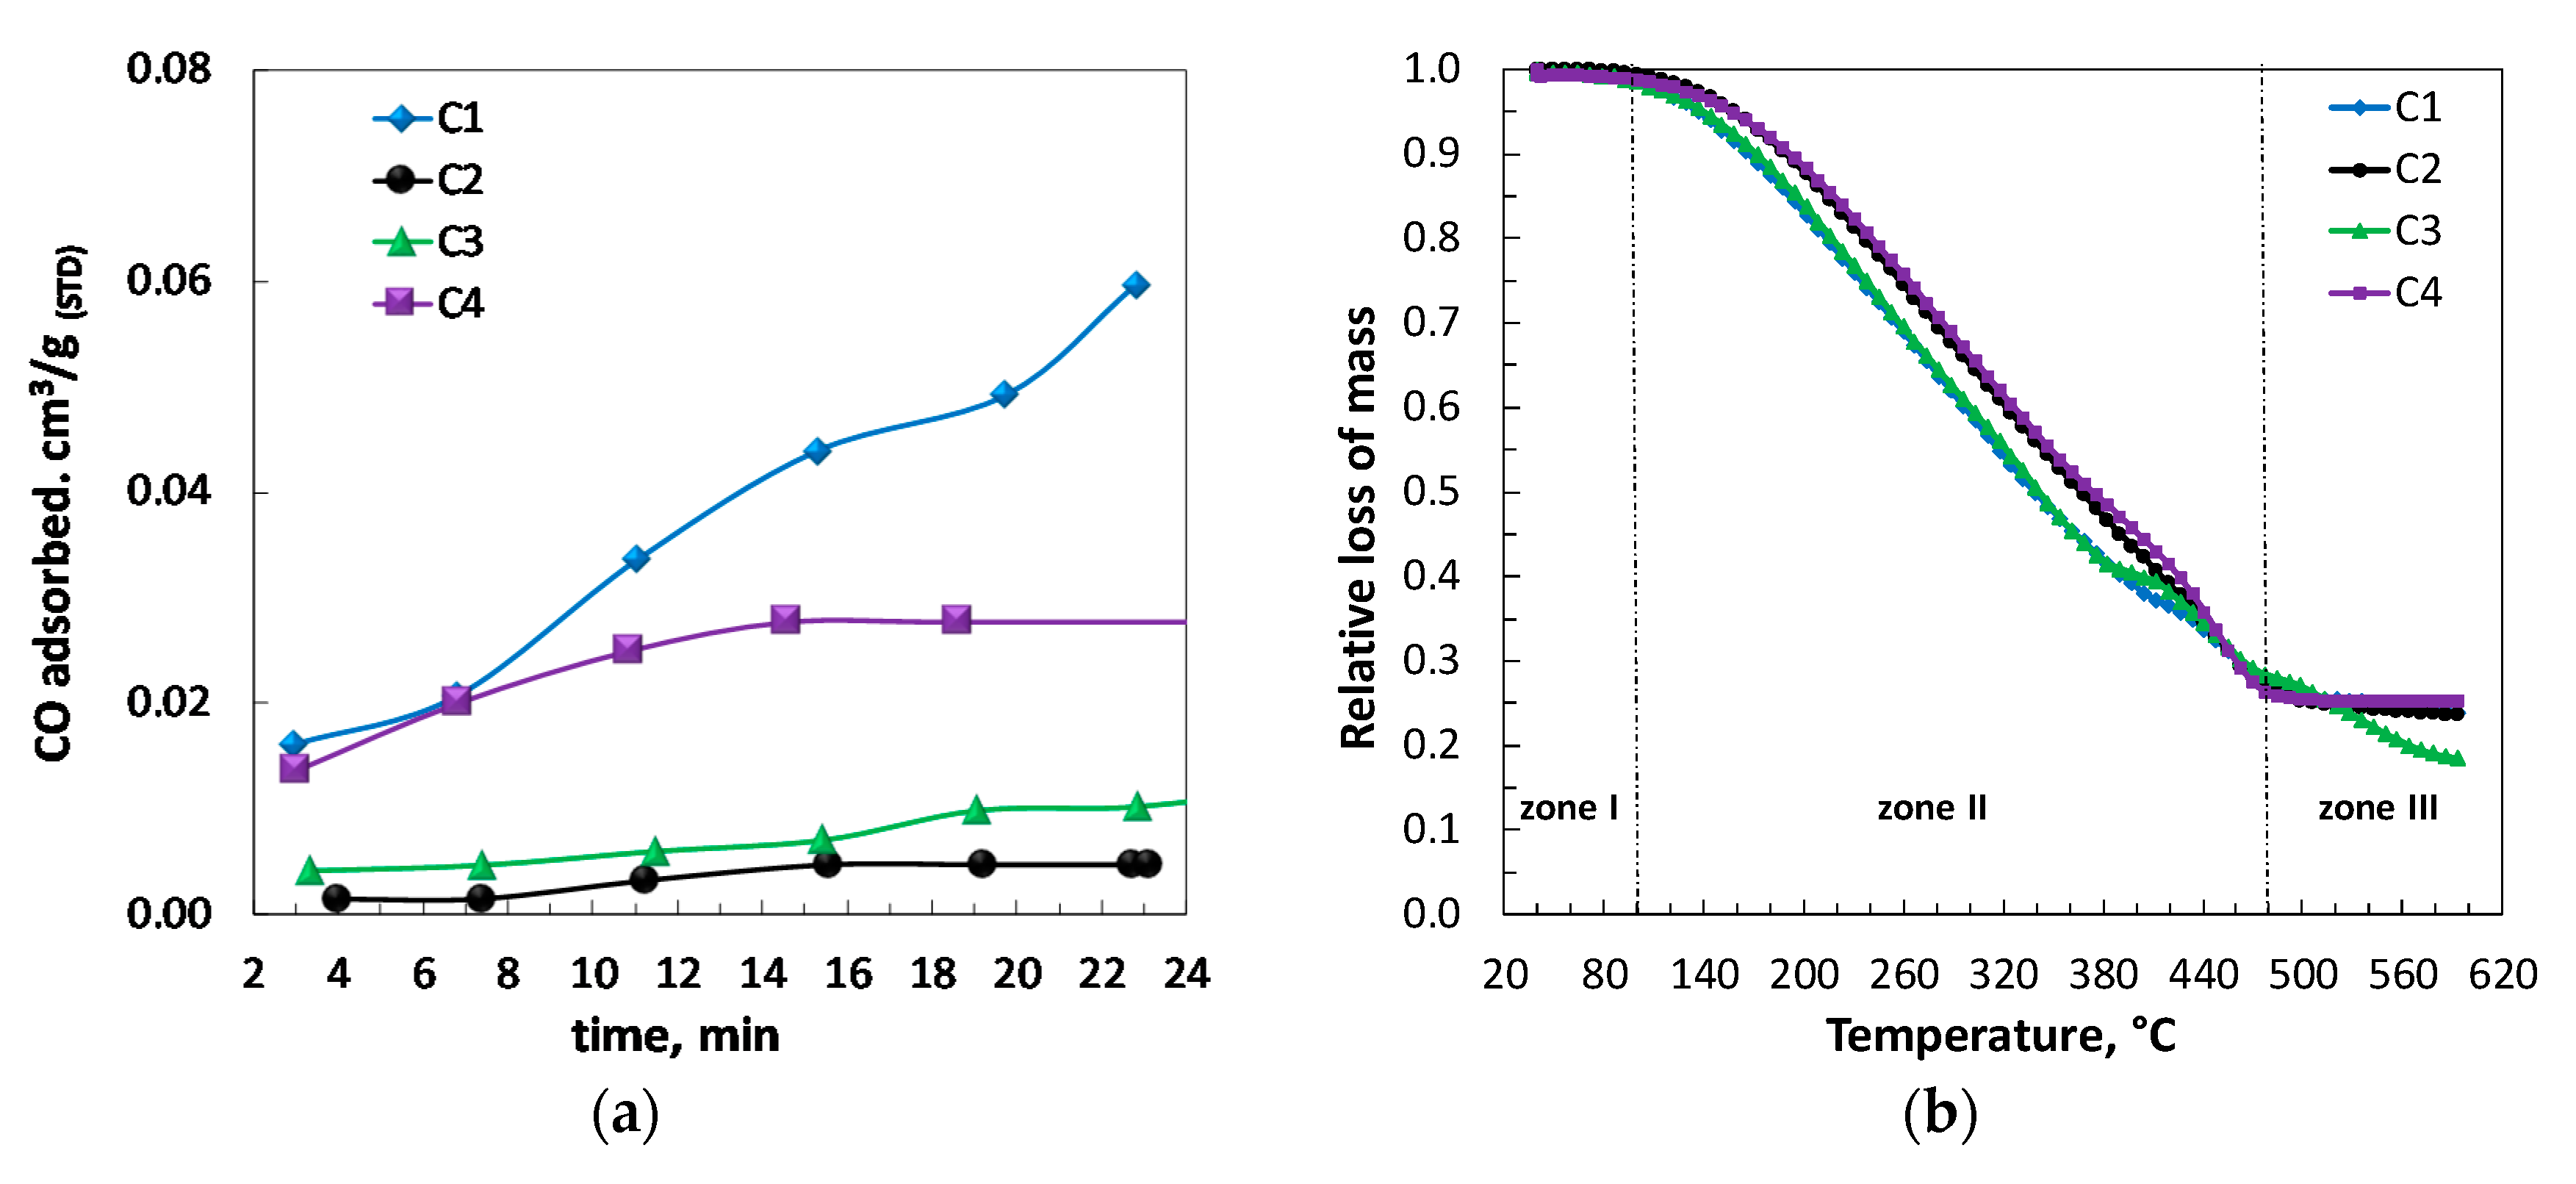
2.4. Physical and Physisorption Properties of Catalysts

The grain size distribution of the catalysts is relevant for evaluating the effects of internal diffusion and determining the minimum fluidization velocity and pressure drop for applications of these catalysts in fixed and fluidized beds.
According to the obtained results (Figure 3), the grain size distribution of catalysts is mostly in the range of 160–320 μm, with C1 grain being the largest (240–320 μm). Usually, in cracking applications, the mean grain size of the catalyst is between 70 and 110 μm or 20 and 90 μm [41].
The study of the specific surface area allows the physisorption capacity of the catalysts to be determined, which is an essential property in catalytic reactions. The measurement was made by applying the single-point BET method, and the results are presented in Table 5.
When the sludges were calcined, their specific surface areas decreased. This process eliminates surface defects, making the solid structure derived from sludge more uniform and compact, causing the size of some pores to decrease, which implies that a smaller amount of gas is adsorbed during the physisorption with nitrogen. The catalysts synthesized in this study present lower specific surface areas than those derived from textile wastewater treatment [22] or sludge and ferric sludge derived from water purification [19].

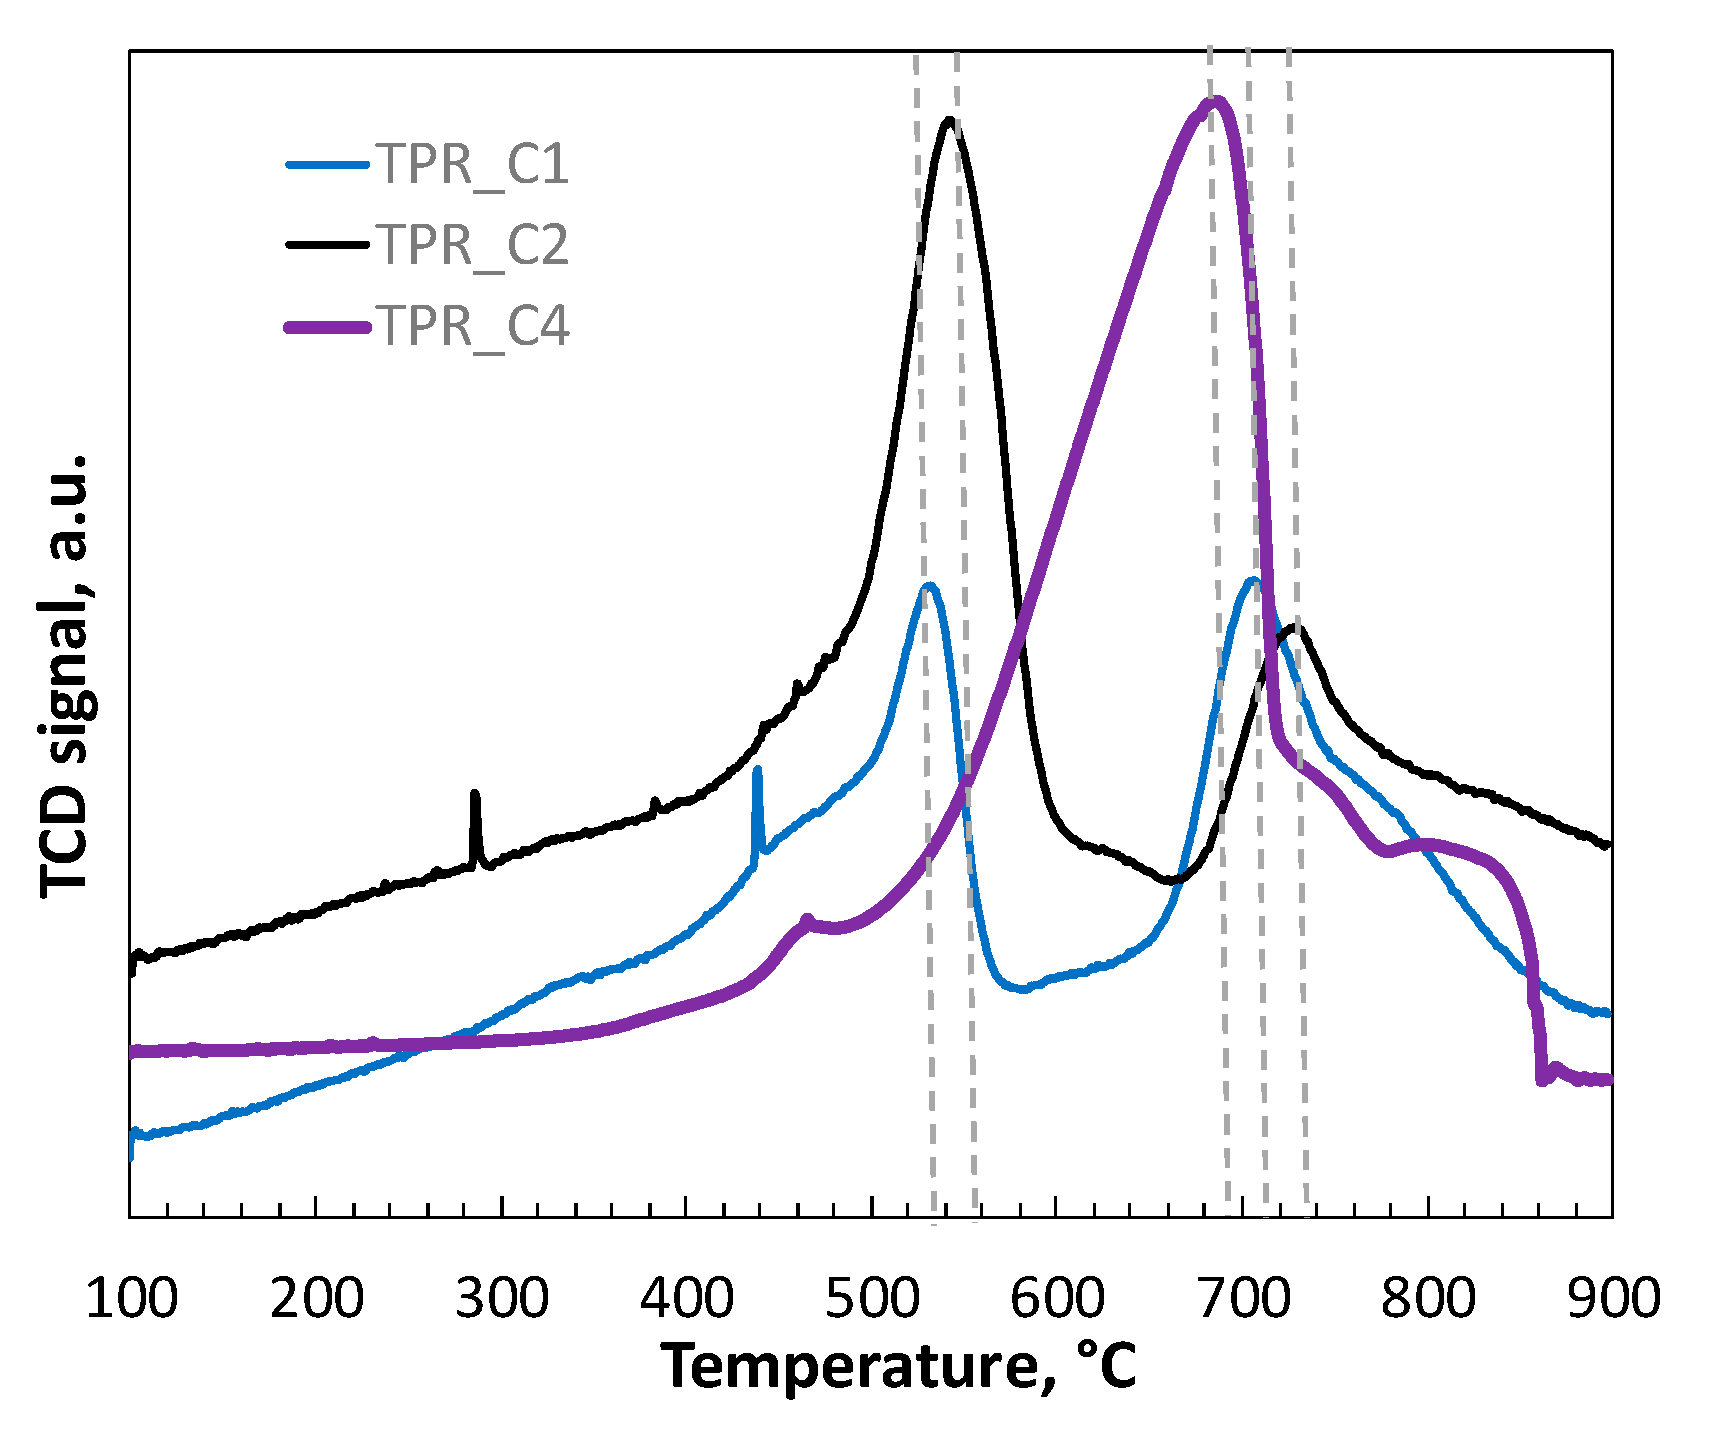
2.5. Temperature-Programmed Reduction (TPR) of Catalysts

Temperature-programmed reduction (TPR) tests were performed, in which catalysts C1, C2, and C4 were exposed to a hydrogen flow and heated to a temperature of 900 °C to identify the reduction peaks (Figure 4). The TPR profiles of the catalysts derived from the sludge of metallic mine tailings (C1 and C2) were shown to have three reduction stages since three defined peaks were observed. However, the presence of a peak at 286 °C in C1 was found, which is attributable to the presence of Cu as observed in other catalysts based on SiO2 [42].
The catalyst C4 shows two reduction stages: the first reduction peak appears at 465 °C. The second reduction peak was at 682 °C, both of which correspond to the reduction of iron species, and mainly reduction from Fe3O4 to FeO [43].
When performing the temperature-programmed reduction assays for catalyst C3, the thermal conductivity detector (TCD) signal was very unstable, probably due to the low thermal stability of the catalyst, which was also observed in catalysts derived from the tannery industry [23].

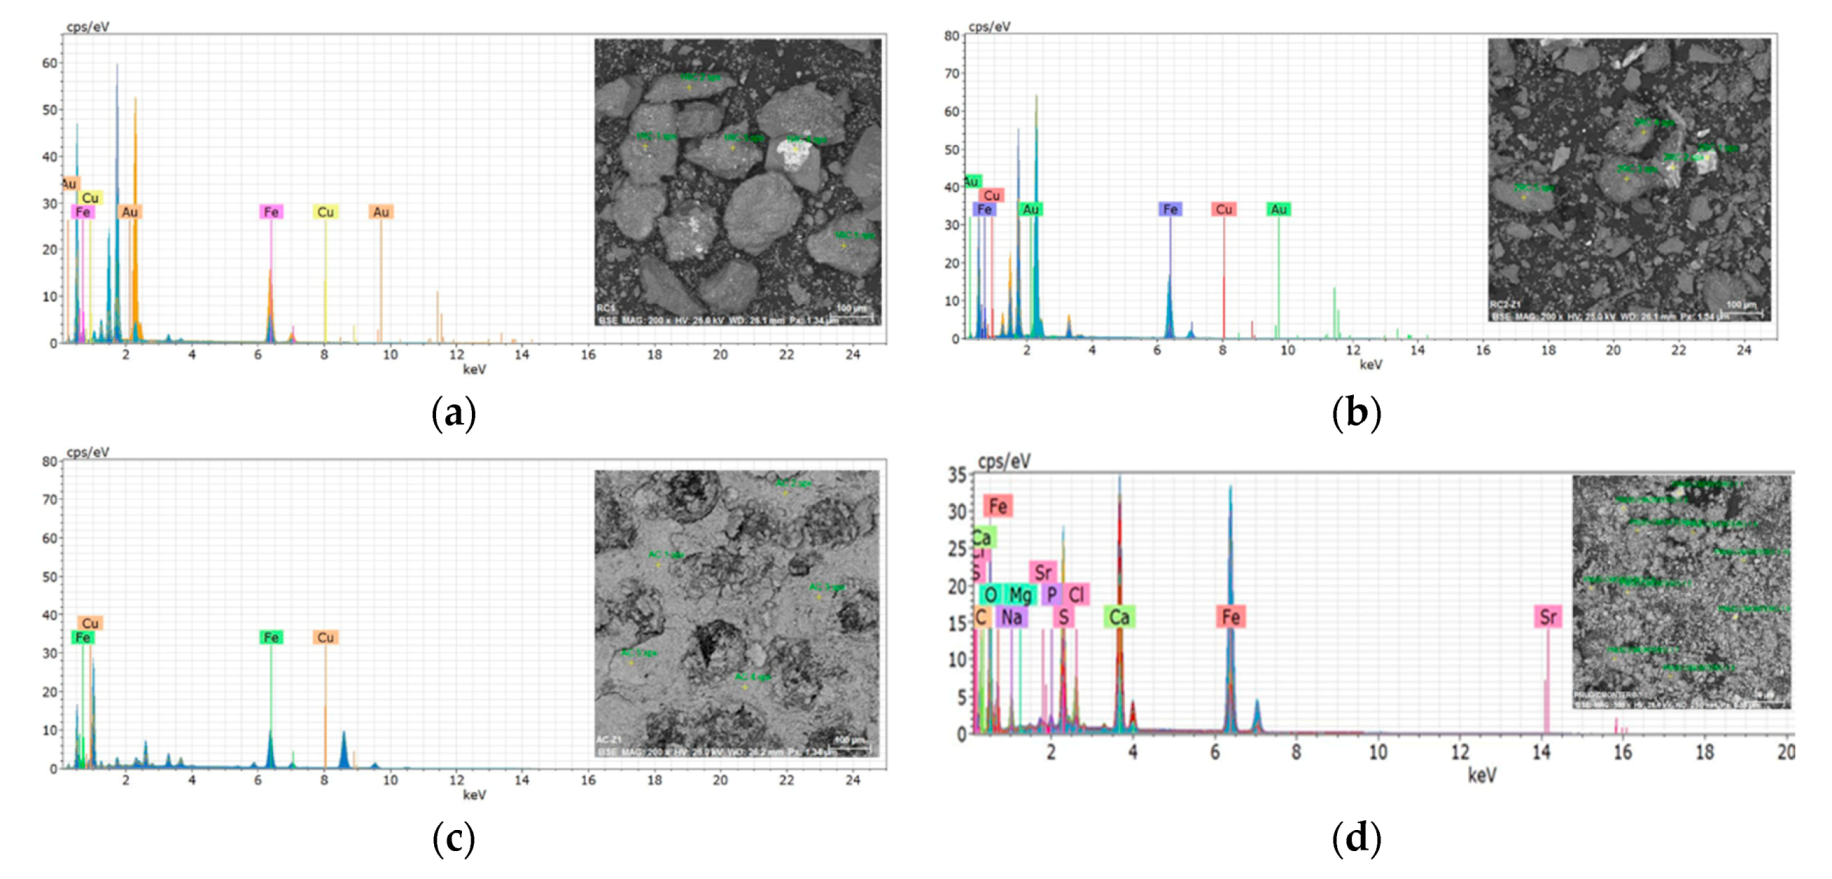
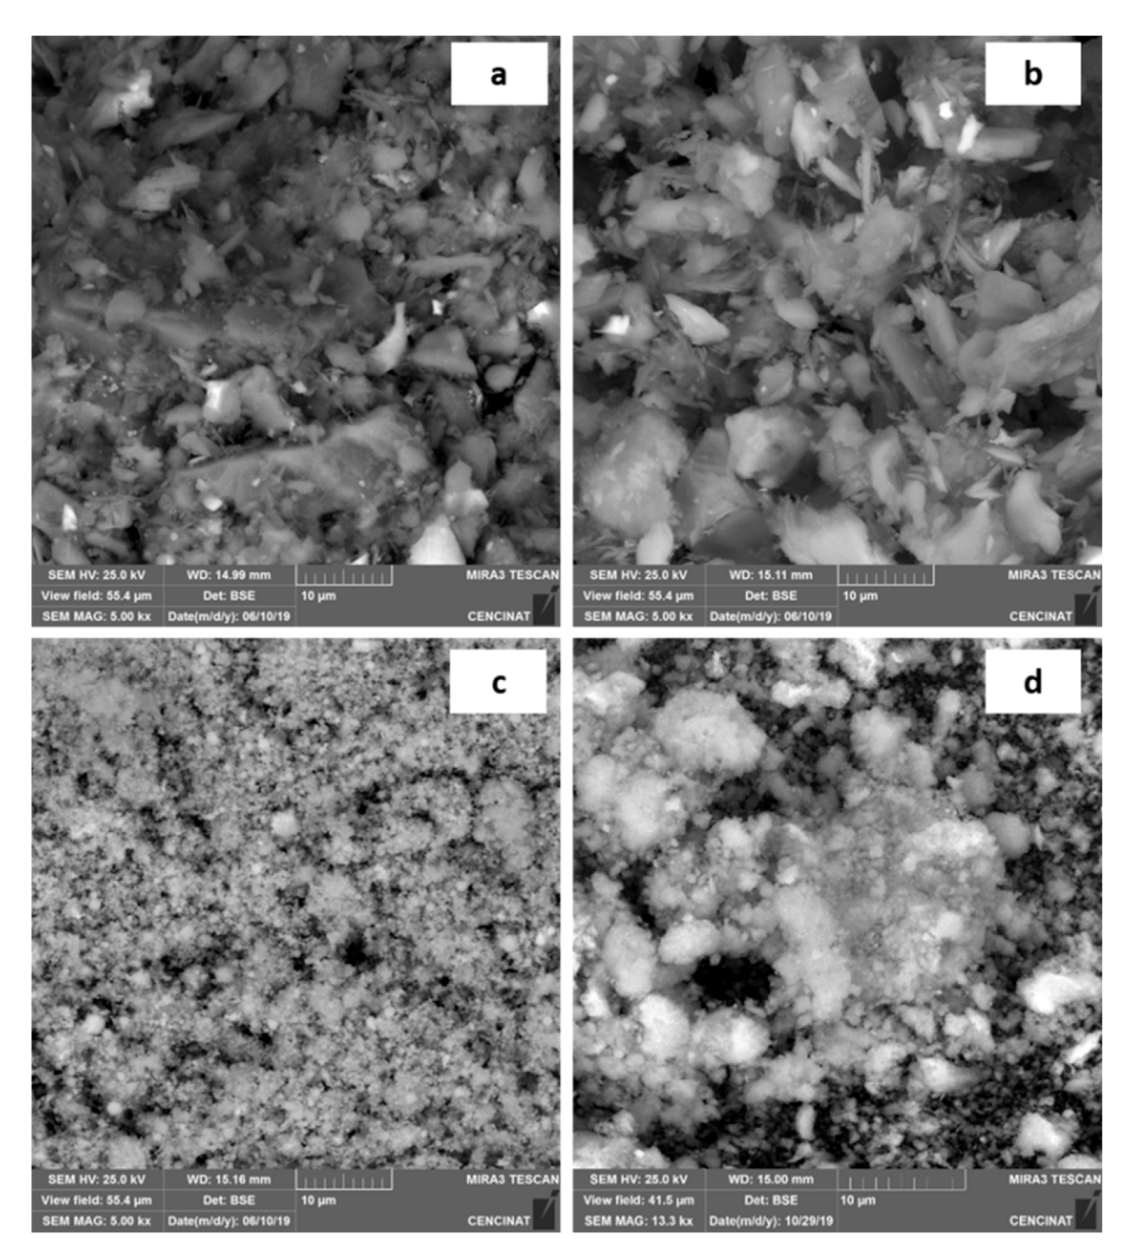
2.6. Scanning Electron Microscope with Energy Dispersive X-ray Spectroscopy (SEM–EDS)

Micrographs of different catalysts are presented in Figure 5 by SEM–EDS, and Figure 6a–d presents SEM surface image at a resolution to 5kx. C1 (Figure 5a) shows a flat and irregular crystalline structure of approximately 100 µm in size; its geometry is better defined than the other catalysts. According to the energy-dispersive X-ray spectroscopy (EDS) analysis, iron (22.4 ± 0.1 wt%), gold, and copper were detected at the surface but less content than the detection limit. In addition, silica (13.9 ± 0.2%) and aluminum (9.9 ± 0.2%) quantified. The results represent the element percentage in the samples.
C2 (Figure 5b) is a material that has a morphology similar to C1 but is smaller in size, presenting a similar surface composition, with iron (28.3 ± 0.1 wt%), gold, and copper being identified, in addition to silica (16.2 ± 0.2%) and aluminum (8.0 ± 0.2%). The presence of sulfur was also identified in some areas, consistent with the results of elemental analysis.
C3 (Figure 5c) appears to comprise spheres with well-defined and uniform surfaces with a lamellar and slightly porous texture. The EDS shows the presence of iron (21.9 ± 0.1 wt%) and copper (0.8 ± 0.1 wt%); in some areas, high content of Zn (36.8 ± 1%) was detected. Additionally, chlorine and potassium were observed, probably due to the sludge originating from wastewater treatment.
C4 (Figure 5d) presents the most irregular texture, and well-dispersed metallic crystals were observed. In the SEM-EDS, iron content (23.6 ± 0.1 wt%) was identified, and calcium (8.3 ± 2%), sulfur, and carbon were also detected in addition to strontium, which is specific to the activities of hydrocarbon storage from which the samples of residual sludge were obtained.

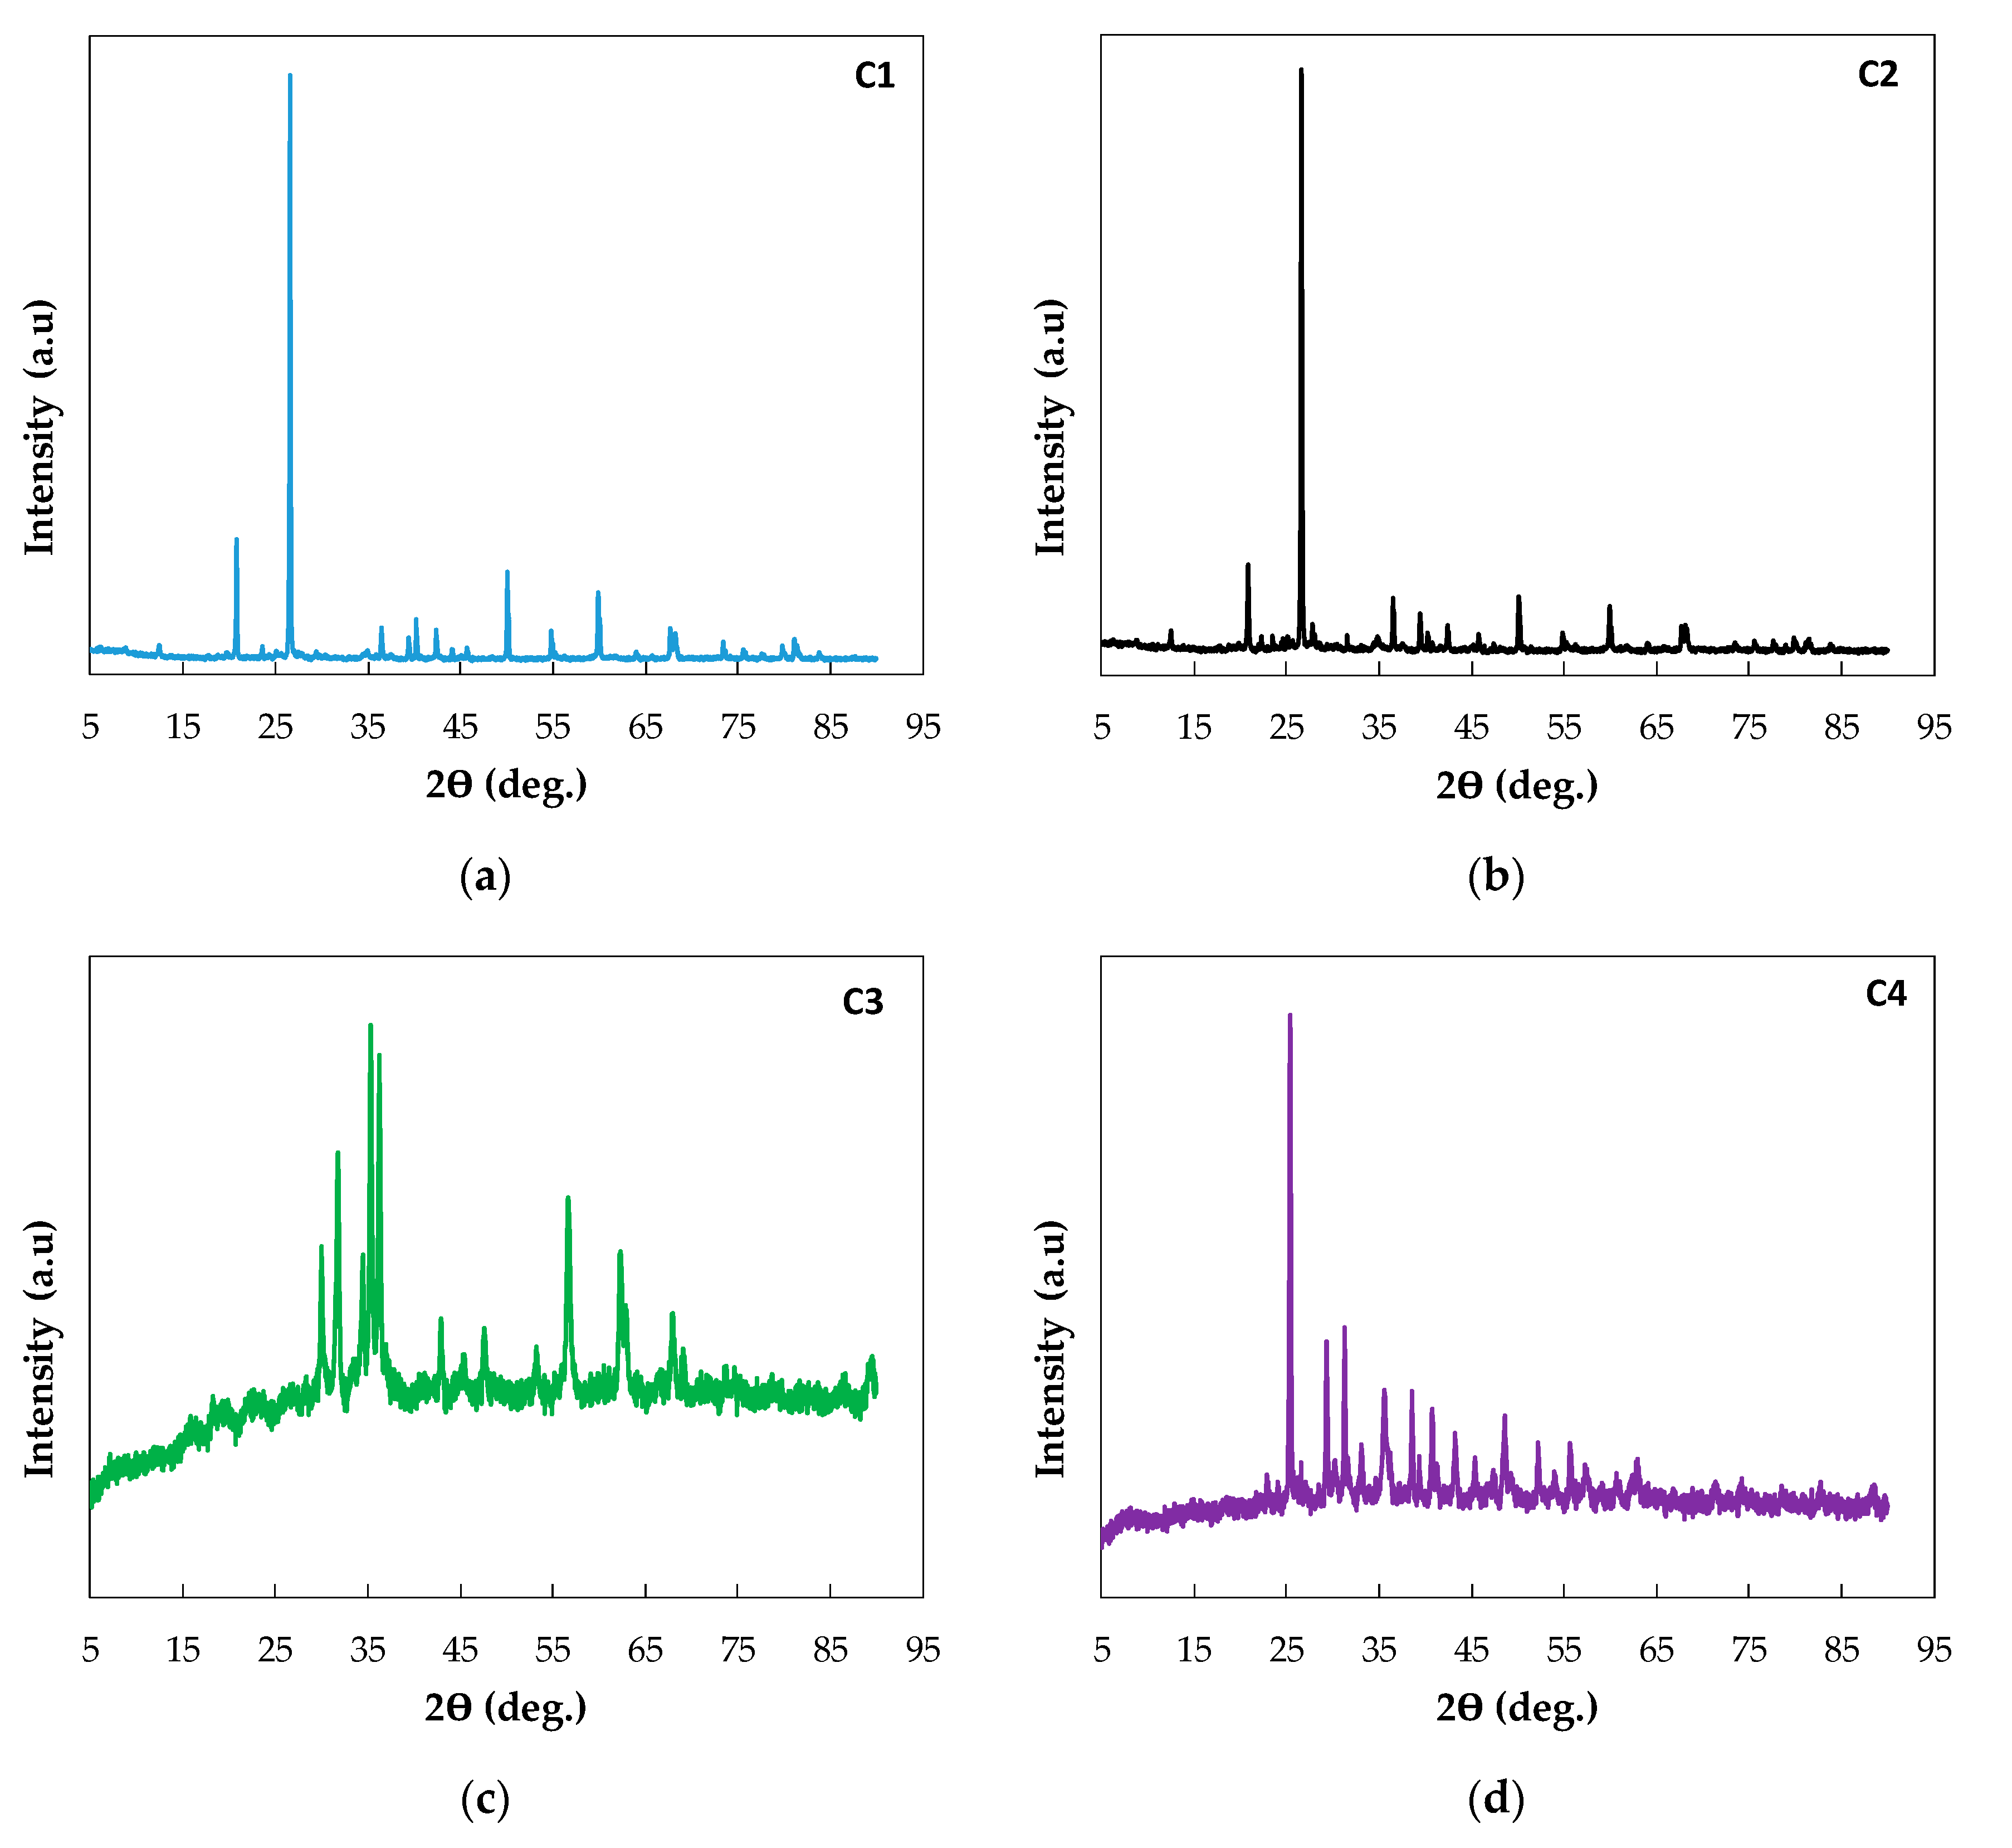
2.7. X-ray Diffraction (XRD)

X-ray diffraction results from the calcined catalyst are presented in Figure 7. The peak identification was be made through platform AtomWork: Inorganic Material Database from NIMS material database [44]. Diffractograms for C1 (Figure 7a) and C2 (Figure 7b) show that peaks are formed at the same diffraction angle of 2θ. Both catalysts show a higher crystallinity compared to catalysts C3 (Figure 7c) and C4 (Figure 7d). The prominent peaks are located around 2θ = 20, 27, 50, and 60°, which correspond to SiO2. Additionally, less prominent peaks occur at 2θ = 12, 54, and 65°, which could be associated with Fe2O3. The presence of other peaks at 2θ = 38, 44, and 82° could be related to the interaction between Fe and Al and 2θ = 44, 65, and 82° to the interaction between Fe Si. In these patterns, thin and well-defined peaks were also determined, serving as evidence of the crystalline nature of these catalysts show in Figure 6a,b.
In the diffractogram for C3 (Figure 7c), diffraction peaks can be observed at 2θ = 33, 50, 53.9, and 63.9° corresponding to Fe2O3. Several strong peaks were observed that diffract at 2θ = 30, 32, 35, 36, 57, and 62.5°, associated with Fe3O4. The peaks at 2θ = 36, 43, and 73° correspond to Zn–Fe interactions. A peak at 2θ = 44.39° can also be observed, which indicates the presence of an alloy of Cu–Cr [43], which is characteristic of sludge from alloy processes. The diffraction patterns show wide peaks and a large amount of noise at the baseline, unlike the other catalysts. This behavior corresponds to particles of low crystallinity, which is evidenced by the SEM results, shown in Figure 6c.
Several peaks were observed for C4 (Figure 7d), namely at 2θ = 29°, which corresponds to calcium sulfate, and at 2θ = 31, 35, 38, 41, 43, 48, 49, and 56°, related to Fe3O4. A peak close to 2θ = 53°, related to iron sulfide, confirms the results of the SEM-EDS test and elemental analysis, indicating the presence of sulfur.

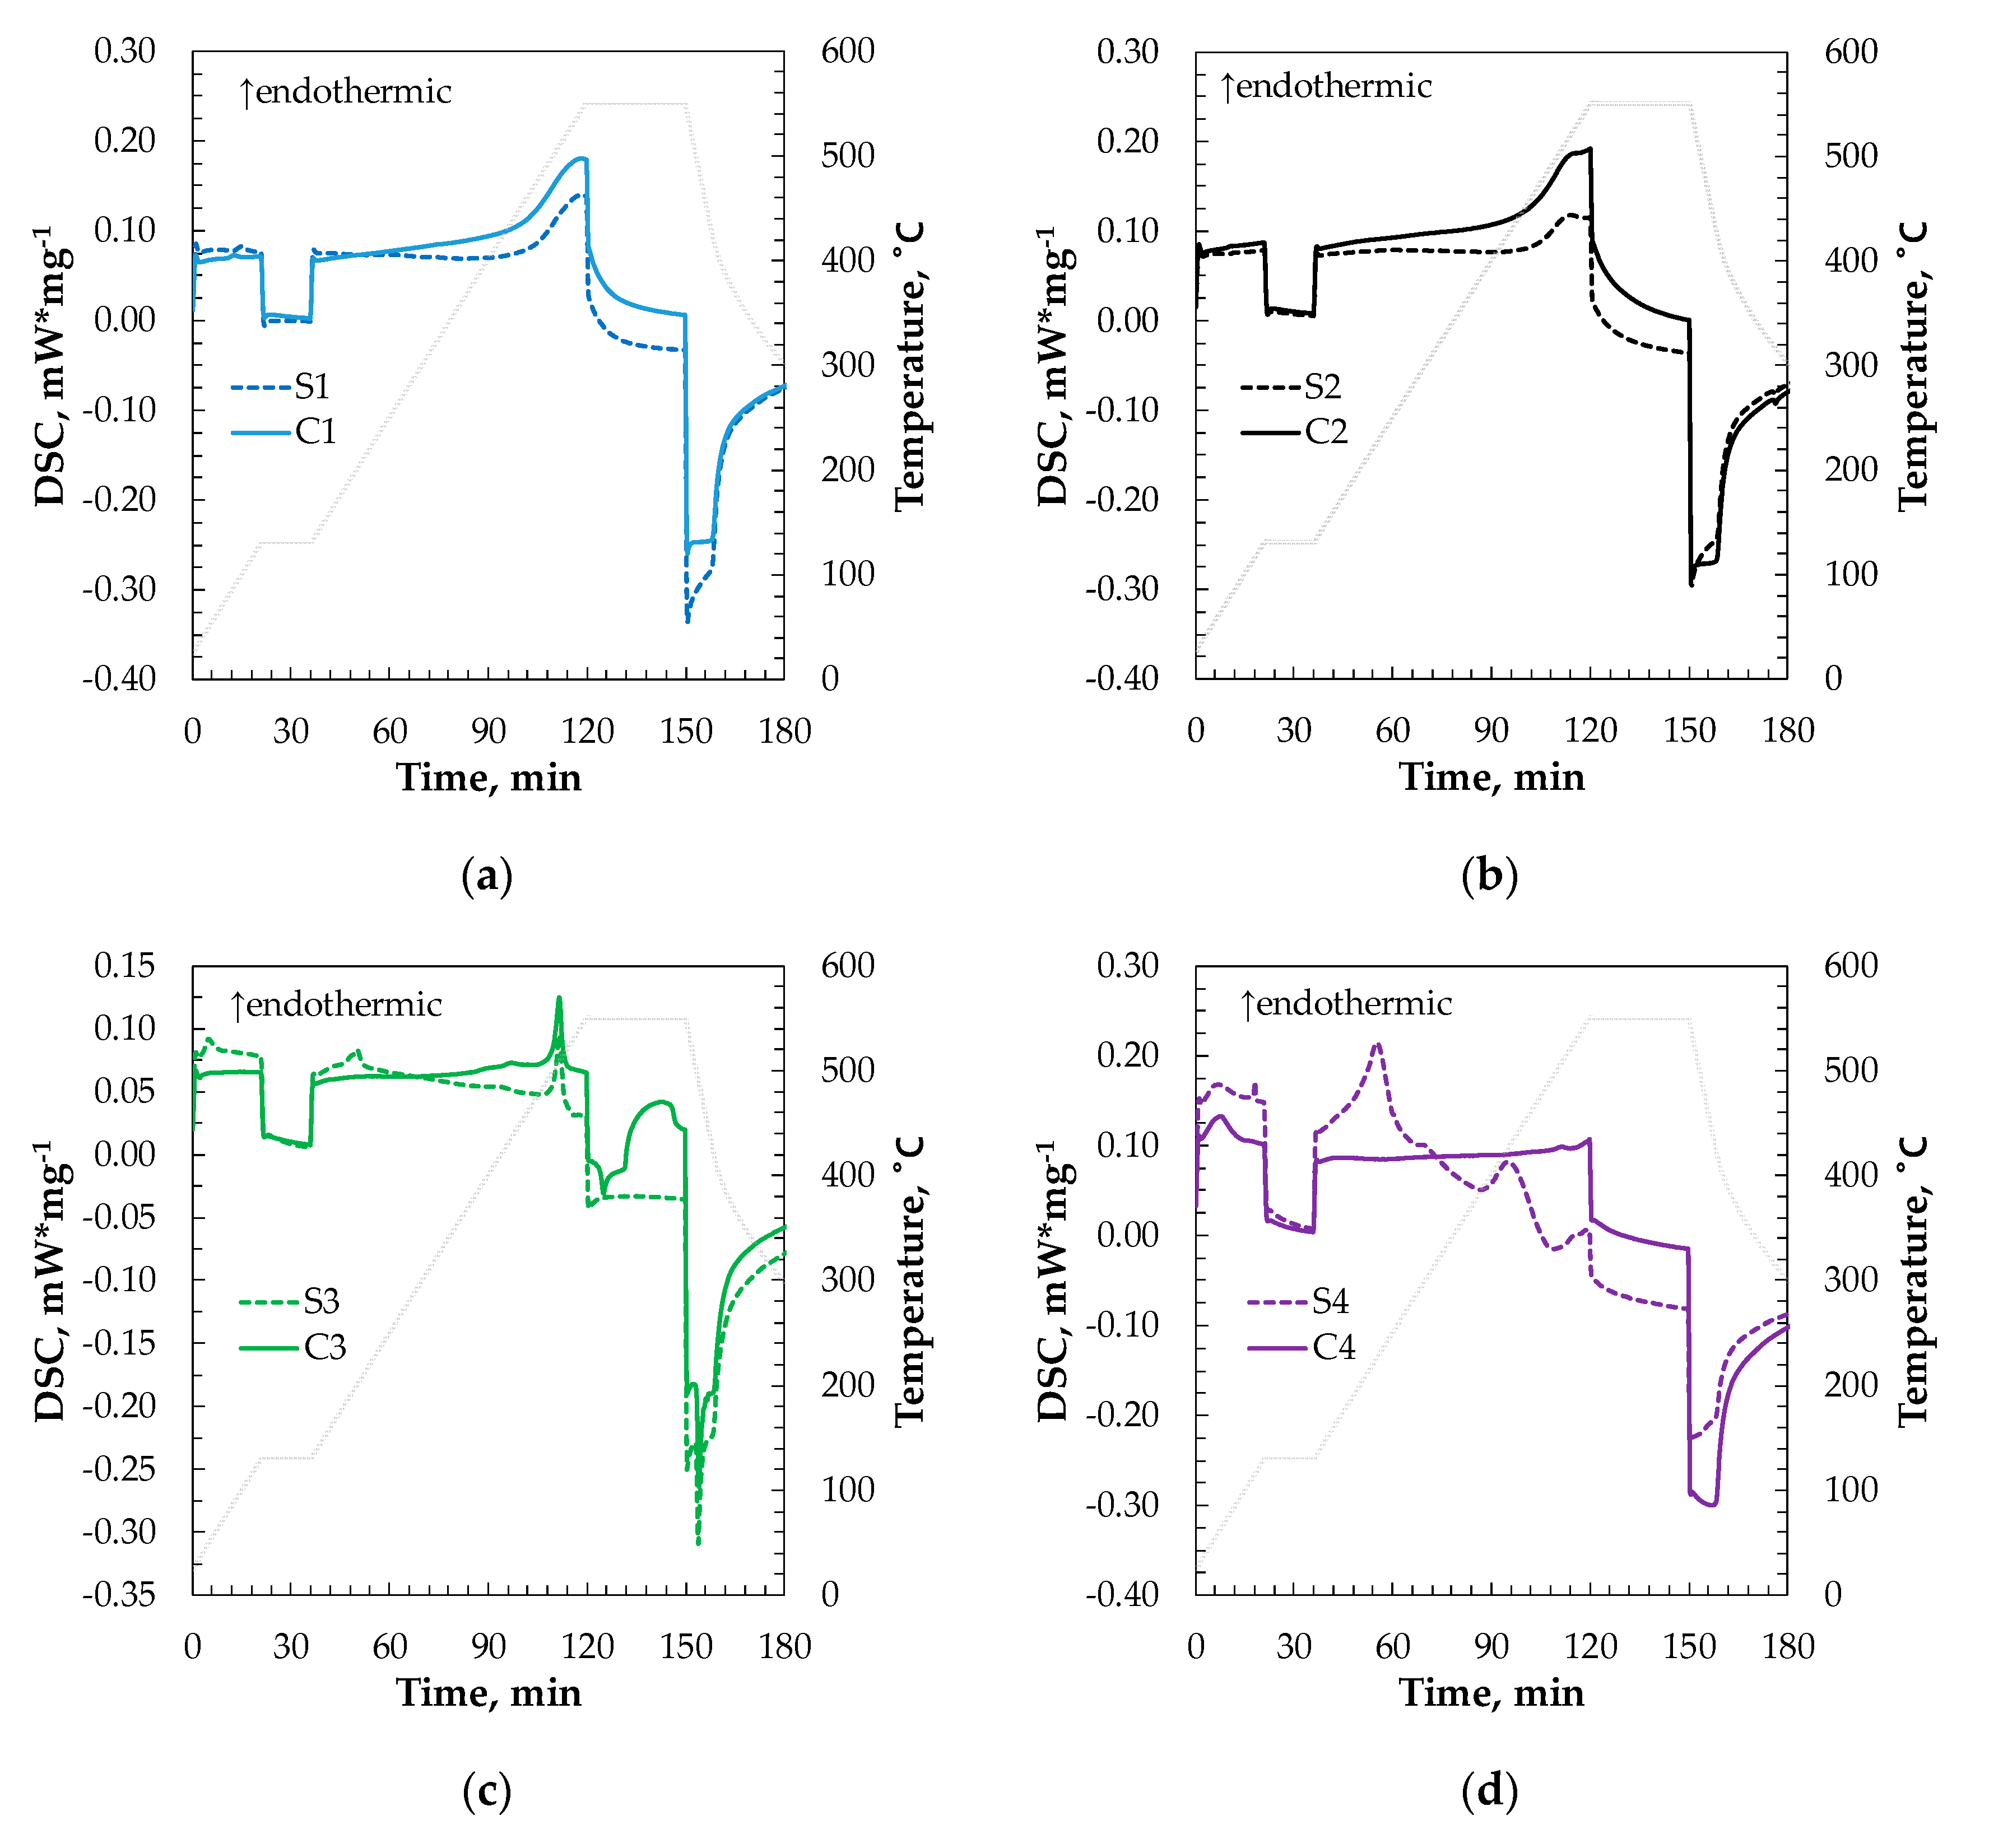
2.8. Characterization Results of Thermoenergetic Properties of Synthesized Materials

In order to study the thermoenergetic stability of the synthesized materials, the samples of sludge and catalysts were analyzed using differential scanning calorimetry, in which the samples were exposed to dynamic changes in temperature. The resulting heat flows are expressed in the thermograms shown in Figure 8a–d. The tests were performed in an inert nitrogen atmosphere at a temperature range of 25–550 °C.
The samples show a peak of endothermic energy in the interval of 25–130 °C (the first 20 min of the test). This corresponds to the decomposition of humidity and low-boiling-point volatiles present in all types of sewage sludge [45], which can be adsorbed on the surface and in the pores of the materials.
S1 (Figure 8a) and S2 (Figure 8b) have curves with similar behaviors because the two sludges come from metal mine tailings, as do the catalysts synthesized from both of these sludges. The initial stability of the sludges may also be the reason that their corresponding synthesized catalysts are also stable. C2 had slightly improved energy capacity than S2, probably because of the higher amount of oxides in S2 because it is an aged sludge.
C3 (Figure 8c), compared to S3, had improved thermal stability because it did not present the endothermic peak that is observed in S3 at 200 °C, which is related to the decomposition of acids used in the steelwork process that accumulate in the sludge from water treatment. The peak at 500 °C present in C3 indicates the change in the iron oxides present from γ-Fe2O3 to α-Fe2O3 [46].
C4 (Figure 8d) noticeably improved its thermal stability compared to S4 due to eliminating the endothermic peaks at 220 and 420 °C that is assigned to the decomposition of high-boiling-point and high-melting-point hydrocarbons of asphaltenes that are adsorbed in the bottom sludge of hydrocarbon storage tanks [37].
Differential scanning calorimetry shows the value of the heat flux rate (W) as a function of dynamic temperature changes, which can be used to obtain the specific heat considering Equation (1),
Cp   =   Φ m Φ 0 m × β
where
  • Cp: specific heat, kJ/kg∙K
  • Φm sample heat flow rate, W
  • Φ0: zero-line heat flow rate, W
  • m: mass of sample, g
  • β: heating rate, K/s
The average Cp values in the temperature range of 130–550 °C are shown in Table 6. The Cp values are important to extrapolate the use of these catalysts in industrial applications, mainly to energy and exergy balance.
There are no significant differences between the average Cp values of the synthesized catalysts, which is consistent because all catalysts have iron in their composition. The average specific heat increases in the catalysts at C1, C2, and C3 compared to the sludge from which they are derived. In C4, an inverse behavior is observed, which is probably due to S4 was impregnated with hydrocarbon residues with a higher specific capacity. C1 and C2 have a higher specific capacity compared to sludge from other industries because these materials have traces of gold, which provides a higher energy capacity.
The values of Cp were similar to those of other catalysts; it can be seen that the specific capacities of C1 and C2 are similar to the mineral modernite (1.22 kJ/kg∙K) [47]. In comparison, C3 and C4 have similar specific capacities to the catalysts Fe3O4/Cr2O3 (0.85 kJ/kg∙K) [48] and Fe2O3 (0.88 kJ/kg∙K) [49].

2.9. Catalytic Activity Evaluation

In order to establish the catalytic activity of the synthesized catalysts, two types of tests were performed: (i) the chemisorption of CO through pulses and (ii) the catalytic cracking reaction of crude oil.
The CO chemisorption phase (Figure 9a) was carried out at 50 °C considering the predominant iron content of the samples. It is showed that the amount of carbon monoxide adsorbed at the operating conditions was minimal for C2 and C3, and slight adsorption was observed after 19 min reaction time. For C4, a rapid saturation of the active centers was shown, demonstrated by the constant trend from 16 min onwards. C1 showed more significant adsorption compared to the other catalysts, and even had an increasing trend over time, which could be attributable to the more considerable amount of copper in this catalyst compared with the others as well as to the capacity for more significant reduction that could be seen in TPR. At the end of the test, it was observed that the catalyst had a black color due to the carbon deposition of CO on the surface.
Following the adsorption of CO, the samples were exposed to controlled combustion in a thermobalance to verify the effect of chemisorption. The results of this test are shown in Figure 9b, in which it can be observed that C1 had a higher amount of carbon on its desorbed surfaces.
Evaluation of the catalytic properties of the four catalysts was carried out using an oil cracking reaction. One reaction without a catalyst and one with a commercial catalyst were performed in order to contrast the catalytic activity. The reactions were carried out by thermogravimetry at 400 °C, in which the loss of mass was produced by the action of the catalysts. The results are reported in Table 7, where it is evident that the catalysts promoted mass loss in the crude oil catalytic cracking reaction since the mass losses were higher than the reaction without the catalyst. It is evident that the C1 catalyst generates the most mass loss due to catalytic activity, while C4 produces the least mass loss; the values obtained are similar to those generated by the commercial catalyst.
Based on the mass-loss data, a kinetic model was done applying the integral method of linearization of kinetic expression 2 m0.5 vs. time. The kinetic order of 0.5 provided the best fit with the experimental data according to the determination coefficient (R2). The experimental data were replaced in the kinetic expression for each time to calculate the average rate of mass loss, considering the Fe mass content. It was observed that C4 and C1 have a greater rate of the reaction; C3 has the worst rate compared with the other synthesized catalysts.

2.10. Synthesized Material Sustainability

In order to quantify the sustainability of the process, the loss of mass in the different steps of the synthesis—drying and calcination—were calculated and are shown in Table 8. The Environmental Factor (E-Factor = mass of waste/mass of the desired product) [50] is included.
The results showed that the synthesis of C1 and C3 has a greater yield of the product than the other catalyst, while C4 has the lesser yield; due to the nature of S4, this sludge was the most difficult to handle in the lab. The ideal E-Factor tends to be zero; in this work, they are less than 0.333; the values ratify the sustainability of the waste valorization to transform sludge in the catalyst.

3. Materials and Methods

3.1. Catalyst Characterization

The characterization of catalysts by surface area and pore volume of catalytic materials, specific surface (BET method), temperature-programmed reduction (TPR), X-ray diffraction (XRD), and scanning electron microscopy (SEM/EDS) was carried out using the equipment and methods described in previous works [21,22].
The physical properties of catalysts, such as grain size and diameter distribution, were determined using a granulometric analysis system with equipment that performs digital image processing (Retsch-Camsizer, Haan, Germany) following the standard ISO 13322-2. For this granulometric analysis, 10 g of sample was used, and the grain size was studied in the range of 80–560 µm.
The metal content was determined in 200 mg of a sample by atomic absorption spectrophotometry (AAS) using an atomic absorption spectrophotometer (PerkinElmer-AAnalyst 400, Waltham, MA, USA) with an atmosphere of ethylene (grade 2.7, INDURA, Quito, Pichincha, Ecuador). For these tests, the calibration of equipment was performed using WinLab32 AATM 6.0 software with Cu, Fe, Cr, Au, and Cd standards (0.5 M/HNO3, Teknokroma, Barcelona, Spain). Before metal determination, the samples were prepared by digestion in a microwave system (Milestone-ETHOS UP, Sorisole, BG, Italy).
The specific heat capacity (Cp) of sludge and catalysts was evaluated through differential scanning calorimetry (DSC) (NETZSCH-DSC 3500 Sirius, Berlin, Germany) using 10–35 mg samples. The heat flux for all materials was determined in the temperature range of 25–550 °C at a heating rate of 5 °C·min−1 under an inert N2 atmosphere (33 mL·min−1, 99.999%, INDURA, Quito, Pichincha, Ecuador). Aluminum crucibles (40 μL) with perforated lids were used in these tests.
Before evaluating the catalytic activity, catalysts were reduced in an atmosphere of 10% H2/Ar (50 mL min−1, 99.999%, INDURA, Quito, Pichincha, Ecuador) with a temperature ramp of 10 °C/min from room temperature to 900 °C using chemisorption equipment (Micromeritics-AutoChem II, 2920, Norcross, GA, USA).
To guarantee representative results, all the characterization analyses in both sludge and catalysts were carried out in triplicate.

3.2. Catalytic Material Evaluation (Catalytic Tests)

The ability of catalysts to adsorb CO was studied by chemisorption using CO pulses (Micromeritics-AutoChem II, 2920, Norcross, GA, USA) in 220 mg catalyst samples. Firstly, catalysts were reduced as previously described, after which purging with He (50 mL·min−1, 99.999%, INDURA, Quito, Pichincha, Ecuador) was carried out until a temperature of 50 °C was reached. Then, chemisorption was done at this temperature, exposing catalysts to a flow of 10% CO/He (50 mL·min−1, 99.999%, INDURA, Quito, Pichincha, Ecuador). Between 6 and 10 pulses of CO were performed, depending on the adsorption capacity of the samples, which was detected by a TCD sensor.
Temperature-programmed oxidation (TPO) tests were conducted using a thermobalance (Mettler Toledo-TGA1 SF/1100, Columbus, OH, USA) to verify the carbon deposition on the catalyst surface after CO chemisorption. Catalyst samples of 70 mg were exposed to an atmosphere of synthetic air (50 mL·min−1, 99.999%, INDURA, Quito, Pichincha, Ecuador) to burn the carbonaceous material. This test was performed with a heating rate of 15 °C·min−1 from 40 to 600 °C.
The catalytic activity of the synthesized materials was evaluated with a thermocatalytic decomposition reaction of crude oil samples (28.4° API, PETROECUADOR, Esmeraldas, Esmeraldas, Ecuador). The thermogravimetric analysis was realized following ASTM E 914, DIN 51006, ISO 711 in a thermobalance (Mettler Toledo-TGA1 SF/1100, Columbus, OH, USA). With this test, it was possible to determine the loss of mass generated by the catalysts synthesized from sludge. Before this study, the catalytic material was reduced in a 10% H2/Ar flow.
The decomposition reaction was performed in an N2 atmosphere (50 mL·min−1, 99.999%, INDURA, Quito, Pichincha, Ecuador) with a space-time of 0.15–0.17 g catalyst·g−1 crude oil, using dynamic ramping at a heating rate of 10 °C·min−1 from room temperature to 400 °C. The reaction took place for one hour time on stream, with the loss in weight recorded every 35 s.
Assays without catalysts and using a commercial FCC (Fluid cracking catalytic) catalyst (GRACE-ResidCrackeR, Columbia, MD, USA) were carried out to allow a comparison of the catalytic performance on crude oil decomposition.

4. Conclusions

The best conditions for synthesis were the drying of sludge between 110 and 130 °C and calcination for C1 and C2 at 300 °C, C3 at 500 °C, and C4 at 450 °C (the higher temperature is due to the higher organic content of S4). The synthesized catalysts showed relatively low specific surface areas (C1: 4253; C2: 3034; C3: 7971; and C4: 16,783 m2·g−1) compared to other catalysts synthesized from sludge. The catalysts were mainly made of iron—between 2.5 and 7.5% wt—and the presence of other metals also corresponded with the production processes from which the waste sludge originated, such as traces of gold and copper in the catalysts derived from mining tailings.
The process of catalyst synthesis from sludge resulted in the improved thermal-energetic stability of these waste materials. C1 and C2 catalysts from the mining industry showed a higher specific capacity and thermal stability than other catalysts and would be the best option for use in high thermoenergy processes.
Evidence was provided for the catalytic activity of the synthesized materials in reactions with CO, mainly for C1. In hydrocarbon cracking tests, it was observed that mine tailings catalysts generated the most significant weight loss, with values comparable to those of commercial catalysts. The rate of reaction based on the iron content reveals that C1 and C4 have similar values, and it can be used as a catalyst in several industrial chemical reactions.
The synthesis of catalysts from waste sludge would be an alternative for the recovery of wastes from the mining and steel industries and the storage of hydrocarbons, with a low E-factor that ratifies the sustainability of the process. This process promotes a circular economy in Ecuador, based on the recovery of industrial wastes that are cataloged as hazardous.

Author Contributions

Conceptualization, C.M.-C., A.D.L.R., J.A., and D.E.M.E.; methodology, C.M.-C., J.A., and D.E.M.E.; validation, C.M.-C., A.D.L.R., and D.E.M.E.; formal analysis, D.E.M.E.; investigation, G.C.-L., E.B.-Q., B.G.L., and J.A.; resources, A.D.L.R. and C.M.-C.; data curation, J.A. and A.D.L.R.; writing—original draft preparation, G.C.-L., E.B.-Q., B.G.L., and A.D.L.R.; writing—review and editing, C.M.-C. and D.E.M.E.; supervision, C.M.-C. and A.D.L.R.; project administration, C.M.-C.; funding acquisition, C.M.-C. All authors have read and agreed to the published version of the manuscript.

Funding

This research was funded by Secretaría Nacional de Educación Superior del Ecuador—SENESCYT and Universidad Central del Ecuador—Research Program Inédita 2018, grant number 20180150 CI.

Acknowledgments

The authors are grateful to the Chemical Engineering Faculty (UCE) for the support and the use of laboratory facilities; to P. Londoño and E. Villamarin from the Laboratory of Catalyst (FIQ-UCE) for their technical assistance; to H. Solís, G. Gordillo, A. Reyes, A. Simbaña, and E. Morales (FIQ UCE) for their research assistance; to Curtiembre La Alborada and other Ecuadorian companies that provide the samples of sludges.

Conflicts of Interest

The authors declare no conflict of interest.

References

  1. IEA World Energy Outlook—Topics. Available online: https://www.iea.org/topics/world-energy-outlook (accessed on 2 August 2020).
  2. Ministerio del Ambiente. Ecuador Acuerdo Ministerial 142 Sustancias Peligrosas; Ministerio del Ambiente: Quito, Ecuador, 2012. (In Spanish) [Google Scholar]
  3. Instituto Nacional de Estadística y Censos-Ecuador (INEC). Módulo Ambiental de la Encuesta Estructural Empresarial (ENESEM), año 2017; Ecuador en cifras: Quito, Ecuador, 2019. (In Spanish) [Google Scholar]
  4. UNACEM. Resumen del Informe Final de la Consultoria Para la Fase 1 del Libro Blanco de Economía Circular; UNACEM: Guayaquil, Ecuador, 2020. (In Spanish) [Google Scholar]
  5. United Nations Educational, Scientific and Cultural Organization. Informe Mundial de Naciones Unidas Sobre el Desarrollo de Los Recursos Hídricos 2019: No Dejar a Nadie Atrás; UN: New York, NY, USA, 2019; ISBN 978-92-1-004594-0. (In Spanish) [Google Scholar]
  6. Suárez-Macías, J.; Terrones-Saeta, J.M.; Iglesias-Godino, F.J.; Corpas-Iglesias, F.A. Retention of Contaminants Elements from Tailings from Lead Mine Washing Plants in Ceramics for Bricks. Minerals 2020, 10, 576. [Google Scholar] [CrossRef]
  7. Ince, C. Reusing gold-mine tailings in cement mortars: Mechanical properties and socio-economic developments for the Lefke-Xeros area of Cyprus. J. Clean. Prod. 2019, 238, 117871. [Google Scholar] [CrossRef]
  8. Yildirim Ozen, M.; Moroydor Derun, E. A comparative study: Effects of different nanoparticles on the properties of gold mine tailings containing cement mortars. Constr. Build. Mater. 2019, 202, 396–405. [Google Scholar] [CrossRef]
  9. Kim, Y.; Lee, Y.; Kim, M.; Park, H. Preparation of high porosity bricks by utilizing red mud and mine tailing. J. Clean. Prod. 2019, 207, 490–497. [Google Scholar] [CrossRef]
  10. Wołowiec, M.; Komorowska-Kaufman, M.; Pruss, A.; Rzepa, G.; Bajda, T. Removal of Heavy Metals and Metalloids from Water Using Drinking Water Treatment Residuals as Adsorbents: A Review. Minerals 2019, 9, 487. [Google Scholar] [CrossRef] [Green Version]
  11. Liu, Y.; Khan, A.; Wang, Z.; Chen, Y.; Zhu, S.; Sun, T.; Liang, D.; Yu, H. Upcycling of Electroplating Sludge to Prepare Erdite-Bearing Nanorods for the Adsorption of Heavy Metals from Electroplating Wastewater Effluent. Water 2020, 12, 1027. [Google Scholar] [CrossRef] [Green Version]
  12. Ouyang, D.; Zhuo, Y.; Hu, L.; Zeng, Q.; Hu, Y.; He, Z. Research on the Adsorption Behavior of Heavy Metal Ions by Porous Material Prepared with Silicate Tailings. Minerals 2019, 9, 291. [Google Scholar] [CrossRef] [Green Version]
  13. Mombelli, D.; Barella, S.; Gruttadauria, A.; Mapelli, C. Iron Recovery from Bauxite Tailings Red Mud by Thermal Reduction with Blast Furnace Sludge. Appl. Sci. 2019, 9, 4902. [Google Scholar] [CrossRef] [Green Version]
  14. Ubaldini, S.; Guglietta, D.; Vegliò, F.; Giuliano, V. Valorization of Mining Waste by Application of Innovative Thiosulphate Leaching for Gold Recovery. Metals 2019, 9, 274. [Google Scholar] [CrossRef] [Green Version]
  15. Carneiro, J.; Tobaldi, D.M.; Capela, M.N.; Seabra, M.P.; Labrincha, J.A. Waste-Based Pigments for Application in Ceramic Glazes and Stoneware Bodies. Materials 2019, 12, 3396. [Google Scholar] [CrossRef] [PubMed] [Green Version]
  16. Chakravarthy, C.; Chalouati, S.; Chai, Y.E.; Fantucci, H.; Santos, R.M. Valorization of Kimberlite Tailings by Carbon Capture and Utilization (CCU) Method. Minerals 2020, 10, 611. [Google Scholar] [CrossRef]
  17. Klose, F.; Scholz, P.; Kreisel, G.; Ondruschka, B.; Kneise, R.; Knopf, U. Catalysts from waste materials. Appl. Catal. B Environ. 2000, 28, 209–221. [Google Scholar] [CrossRef]
  18. Herrera, S.L.; Hoyos, D.Á.; Palacio, L.A.; Pizarro, J.L.; Aguado, R. Synthesis of Industrial Waste Based Metal Catalysts for Oxidative Dehydrogenation of Propane. Ind. Eng. Chem. Res. 2013, 52, 7341–7349. [Google Scholar] [CrossRef]
  19. Sanchis, R.; Dejoz, A.; Vázquez, I.; Vilarrasa-García, E.; Jiménez-Jiménez, J.; Rodríguez-Castellón, E.; López Nieto, J.M.; Solsona, B. Ferric sludge derived from the process of water purification as an efficient catalyst and/or support for the removal of volatile organic compounds. Chemosphere 2019, 219, 286–295. [Google Scholar] [CrossRef]
  20. Yi, X.; Yu, Y.; Huang, F.; Ding, T.; Zhang, Z.; Feng, J.; Baell, J.B.; Huang, H. Turning Waste into Valuable Catalysts: Application of Surface-Modified Sewage Sludge in N–H Insertion Reaction. Ind. Eng. Chem. Res. 2020, 59, 4854–4863. [Google Scholar] [CrossRef]
  21. Montero, C.; Castañeda, K.; Oña, M.; Flores, D.R.; De La Rosa, A. Catalyst Based on Sludge Derived from Wastewater Treatment of Textile Industry. Chem. Eng. Trans. 2018, 70, 931–936. [Google Scholar] [CrossRef]
  22. Villamarin-Barriga, E.; Canacuán, J.; Londoño-Larrea, P.; Solís, H.; De La Rosa, A.; Saldarriaga, J.F.; Montero, C. Catalytic Cracking of Heavy Crude Oil over Iron-Based Catalyst Obtained from Galvanic Industry Wastes. Catalysts 2020, 10, 736. [Google Scholar] [CrossRef]
  23. Colta Ponce, D.X.; Quishpe Bahamontes, L.V. Síntesis de un Material Catalítico a Partir de Lodos Residuales de la Industria de la Curtiembre. Bachelor’s Thesis, Facultad de Ingeniería Química, Universidad Central del Ecuador, Quito, Ecuador, 2017. (In Spanish). [Google Scholar]
  24. Moreno Moyano, S.K. Descomposición Catalítica de CH4 Utilizando Catalizadores Derivados de lodos Residuales de las Industrias: Textil, Galvanoplastia y Curtiembre. Bachelor’s Thesis, Facultad de Ingeniería Química, Universidad Central del Ecuador, Quito, Ecuador, 2020. (In Spanish). [Google Scholar]
  25. Xu, B.; Ding, T.; Zhang, Y.; Wen, Y.; Yang, Z.; Zhang, M. A new efficient visible-light-driven composite photocatalyst comprising ZnFe2O4 nanoparticles and conjugated polymer from the dehydrochlorination of polyvinyl chloride. Mater. Lett. 2017, 187, 123–125. [Google Scholar] [CrossRef]
  26. Gonzalez-Casamachin, D.A.; Rivera De la Rosa, J.; Lucio–Ortiz, C.J.; Sandoval-Rangel, L.; García, C.D. Partial oxidation of 5-hydroxymethylfurfural to 2,5-furandicarboxylic acid using O2 and a photocatalyst of a composite of ZnO/PPy under visible-light: Electrochemical characterization and kinetic analysis. Chem. Eng. J. 2020, 393, 124699. [Google Scholar] [CrossRef]
  27. Halasi, G.; Gazsi, A.; Bánsági, T.; Solymosi, F. Catalytic and photocatalytic reactions of H2+CO2 on supported Au catalysts. Appl. Catal. A Gen. 2015, 506, 85–90. [Google Scholar] [CrossRef]
  28. Zuo, C.; Tian, Y.; Zheng, Y.; Wang, L.; Fu, Z.; Jiao, T.; Wang, M.; Huang, H.; Li, Y. One step oxidative esterification of methacrolein with methanol over Au-CeO2/γ-Al2O3 catalysts. Catal. Commun. 2019, 124, 51–55. [Google Scholar] [CrossRef]
  29. Liao, X.; Chu, W.; Dai, X.; Pitchon, V. Bimetallic Au–Cu supported on ceria for PROX reaction: Effects of Cu/Au atomic ratios and thermal pretreatments. Appl. Catal. B Environ. 2013, 142–143, 25–37. [Google Scholar] [CrossRef]
  30. Torres-Luna, J.A.; Carriazo, J.G.; Sanabria-González, N.R. Calcination Temperature Effect on structural and textural properties of Fe(iii)-TiO2. Rev. Fac. Cienc. Básicas 2014, 10, 186–195. [Google Scholar] [CrossRef]
  31. Guerrero Fajardo, C.A.; Sánchez Castellanos, F.J.; Roger, A.-C.; Courson, C. Síntesis sol-gel de catalizadores de hierro soportados sobre sílice y titania para la oxidación selectiva de metano hasta formaldehído. Ing. Investig. 2008, 28, 72–80. (In Spanish) [Google Scholar]
  32. Junior, S.A.F.; de Sousa, J.F.; Benachour, M.; Rojas, L.O.A. Wet Oxidation of Phenols using Fe-CeO2, K-MnO2/CeO2/Paligorskite and Fe/Palygorskite Catalysts. Inf. Technol. 2011, 22, 55–68. [Google Scholar] [CrossRef]
  33. Guerrero Fajardo, C.A.; Sánchez Castellanos, F.J. Síntesis de catalizadores de Fe-Mo soportados sobre sílice para la oxidación selectiva de metano hasta formaldehído. Ing. Investig. 2009, 29, 53–59. (In Spanish) [Google Scholar]
  34. Santos, J.L.; Reina, T.R.; Ivanov, I.; Penkova, A.; Ivanova, S.; Tabakova, T.; Centeno, M.A.; Idakiev, V.; Odriozola, J.A. Multicomponent Au/Cu-ZnO-Al2O3 catalysts: Robust materials for clean hydrogen production. Appl. Catal. A Gen. 2018, 558, 91–98. [Google Scholar] [CrossRef]
  35. Mierczynski, P.; Vasilev, K.; Mierczynska, A.; Maniukiewicz, W.; Szynkowska, M.I.; Maniecki, T.P. Bimetallic Au–Cu, Au–Ni catalysts supported on MWCNTs for oxy-steam reforming of methanol. Appl. Catal. B Environ. 2016, 185, 281–294. [Google Scholar] [CrossRef]
  36. Sun, Z.-X.; Zheng, T.-T.; Bo, Q.-B.; Du, M.; Forsling, W. Effects of calcination temperature on the pore size and wall crystalline structure of mesoporous alumina. J. Colloid Interface Sci. 2008, 319, 247–251. [Google Scholar] [CrossRef]
  37. Zubaidy, E.A.H.; Abouelnasr, D.M. Fuel recovery from waste oily sludge using solvent extraction. Process Saf. Environ. Prot. 2010, 88, 318–326. [Google Scholar] [CrossRef]
  38. Rostrup-Nielsen, J.R. Sulfur Poisoning. In Progress in Catalyst Deactivation; Figueiredo, J.L., Ed.; Springer: Dordrecht, The Netherlands, 1982; pp. 209–227. [Google Scholar]
  39. Zhu, F.; Jiang, H.; Zhang, Z.; Zhao, L.; Wang, J.; Hu, J.; Zhang, H. Research on Drying Effect of Different Additives on Sewage Sludge. Procedia Environ. Sci. 2012, 16, 357–362. [Google Scholar] [CrossRef] [Green Version]
  40. Xia, Y.; Zhan, W.; Guo, Y.; Guo, Y.; Lu, G. Fe-Beta zeolite for selective catalytic reduction of NOx with NH3: Influence of Fe content. Chin. J. Catal. 2016, 37, 2069–2078. [Google Scholar] [CrossRef]
  41. Issangya, A.; Hays, R.; Cocco, R.; Knowlton, T.; Karry, R.S. An Acoustic Method for the Measurement of Minimum Fluidization and Bubbling Properties of Group a Solids; AIChE: San Francisco, CA, USA, 2013. [Google Scholar]
  42. Chun, D.H.; Park, J.C.; Lee, H.-T.; Yang, J.-I.; Hong, S.; Jung, H. Effects of SiO2 Incorporation Sequence on the Catalytic Properties of Iron-Based Fischer–Tropsch Catalysts Containing Residual Sodium. Catal. Lett. 2013, 143, 1035–1042. [Google Scholar] [CrossRef]
  43. Fakeeha, A.; Khan, W.; Ibrahim, A.; Al-Otaibi, R.; Alfatesh, A.; Soliman, M.; Abasaeed, A. Alumina supported iron catalyst for hydrogen production: Calcination study. Int. J. Adv. Chem. Eng. Biol. Sci. 2015, 2, 139–141. [Google Scholar] [CrossRef]
  44. National Institute for Materials Science NIMS Materials Database (MatNavi). Available online: https://mits.nims.go.jp/index_en.html (accessed on 12 May 2020).
  45. Rojas-Aguilar, A.; Ginez-Carbajal, F.; Orozco-Guareńo, E.; Flores-Segura, H. Measurement of enthalpies of vaporization of volatile heterocyclic compounds by DSC. J. Therm. Anal. Calorim. 2005, 79, 95–100. [Google Scholar] [CrossRef]
  46. Pérez, M.C.R.; Herrera, J.A.P.; Priego, F.J.A. Estudio De La Descomposición Térmica De Los Escombros Lateríticos De Moa. Rev. Cuba. Quím. 2005, 17, 104–110. (In Spanish) [Google Scholar]
  47. Findikakis, A. Heat Capacity Analysis Report; Yucca Mountain Project: Las Vegas, NV, USA, 2004. [Google Scholar]
  48. Twigg, M.V. Catalyst Handbook; Routledge: Abingdon, UK, 2018; ISBN 978-1-315-13886-2. [Google Scholar]
  49. Lemire, R.; Palmer, D.; Taylor, P.; Schlenz, H. Chemical Thermodynamics—Chemical Thermodynamics of Iron Part 2; OECD: Paris, France, 2020; Volume 13b. [Google Scholar]
  50. Dicks, A.P.; Hent, A. The E Factor and Process Mass Intensity. In Green Chemistry Metrics: A Guide to Determining and Evaluating Process Greenness; Dicks, A.P., Hent, A., Eds.; SpringerBriefs in Molecular Science; Springer International Publishing: Cham, Switzerland, 2015; pp. 45–67. ISBN 978-3-319-10500-0. [Google Scholar]
Figure 1. Dried fresh mine tailings S1 (a), aged mine tailings S2 (b), wastewater sludge from a steelwork S3 (c), and bottom sludge from petroleum storage tanks S4 (d).
Sustainability 12 09849 g001
Figure 2. Catalyst derived from fresh mine tailings C1 (a), aged mine tailings C2 (b), wastewater sludge from a steel industry C3 (c), and bottom sludge from petroleum storage tanks C4 (d).
Sustainability 12 09849 g002
Figure 3. Grain size distribution of catalysts C1–C4 determined by granulometry.
Sustainability 12 09849 g003
Figure 4. Temperature-programmed reduction (TPR) profiles for C1, C2, and C4 catalysts in H2 flow.
Sustainability 12 09849 g004
Figure 5. Scanning electron microscope with energy-dispersive X-ray spectroscopy (SEM–EDS) images C1 (a), C2 (b), C3 (c) and C4 (d).
Sustainability 12 09849 g005
Figure 6. Scanning electron microscope (SEM) images C1 (a), C2 (b), C3 (c) and C4 (d).
Sustainability 12 09849 g006
Figure 7. X-ray diffraction (XRD) patterns C1 (a), C2 (b), C3 (c) and C4 (d).
Sustainability 12 09849 g007
Figure 8. Thermograms from differential scanning calorimetry (DSC) for C1 (a), C2 (b), C3 (c) and C4 (d).
Sustainability 12 09849 g008
Figure 9. CO chemisorption (a) and C-burned compounds from the catalytic surface (b).
Sustainability 12 09849 g009
Table 1. Nomenclature used for the different studied sludges.
CompanyType of SludgeSludgeCatalytic Material
1aAged mining tailingsS1C1
1bFresh mining tailingsS2C2
2Wastewater sludge from a steelworkS3C3
3Bottom sludge from petroleum storage tanksS4C4
Table 2. Preparation conditions of the catalysts.
CompanyCatalytic MaterialDrying Temperature, °CDrying Time, hCalcination Temperature, °CCalcination Time, h
1aC11104.53004
1bC21204.53004
2C31204.55004
3C41304.54502
Table 3. Elemental composition of sludge (S) and catalysts (C).
SampleNitrogen, wt%Carbon, wt%Hydrogen, wt%Sulfur, wt%
S10.00.50.13.6
C10.00.30.12.0
S20.00.20.13.4
C20.00.20.12.9
S30.01.00.11.0
C30.00.10.10.9
S40.435.95.07.4
C40.05.20.14.4
Accuracy = ±0.2%, CHNS analysis considering that balance mass is closed with oxygen content.
Table 4. Metallic content for sludge and catalysts measure by atomic absorption.
MetalSamplewt%Samplewt%
FeS13.7 ± 0.5C13.2 ± 0.5
FeS23.5 ± 0.5C23.8 ± 0.5
FeS37.6 ± 0.5C37.5 ± 0.5
FeS42.6 ± 0.5C42.5 ± 0.5
Table 5. Specific surface of synthetized catalysts.
CatalystSpecific Surface, m2 g−1
C14.25 ± 0.04
C23.03 ± 0.04
C37.97 ± 0.04
C416.78 ± 0.04
Table 6. Average Cp (kJ/kg K) of sludges and catalysts.
SludgeCp, kJ/kg KCatalystsCp, kJ/kg K
S10.992C11.155
S21.018C21.192
S30.620C30.700
S41.434C40.951
Table 7. Loss of mass generated by a catalytic cracking reaction with thermogravimetry (heating ramp 10 °C/min and time on stream = 1 h).
SamplesLoss of Mass, %Kinetic ExpressionR2Rate of Reaction (avg), mgoil. (min.mgFe)−1
Reaction without catalyst55.31 d m d t = 0.0015   m A 0.5 0.921--
Reaction + C170.38 d m d t = 0.0018   m A 0.5 0.9480.18
Reaction + C269.13 d m d t = 0.0016   m A 0.5 0.9330.14
Reaction + C369.25 d m d t = 0.0015   m A 0.5 0.9220.07
Reaction + C466.89 d m d t = 0.0017   m A 0.5 0.9190.20
Reaction with commercial catalyst62.29 d m d t = 0.0019   m A 0.5 0.950--
Table 8. Yield of the catalyst synthesized process.
SamplesInitial Sludge Mass, gMoisture and Volatile Loss, wt%Organic Loss, wt%Yield of Catalytic Material, wt%E-Factor
1100.640.000.3299.680.003
299.7710.320.6888.990.124
3100.490.392.1497.470.026
4100.378.9416.0675.000.333
Publisher’s Note: MDPI stays neutral with regard to jurisdictional claims in published maps and institutional affiliations.

