Port Cooperation and Bundling: A Way to Reduce the External Costs of Hinterland Transport


Department TPR, University of Antwerp, Prinsstraat 13, 2000 Antwerp, Belgium
*
Author to whom correspondence should be addressed.
Sustainability 2020, 12(23), 9983; https://0-doi-org.brum.beds.ac.uk/10.3390/su12239983
Submission received: 29 October 2020
/
Revised: 16 November 2020
/
Accepted: 24 November 2020
/
Published: 29 November 2020
(This article belongs to the Special Issue Transport Systems for Sustainability: Policy, Planning and Exploitation)
Abstract
:The present paper studies the bundling of road cargo flows of neighbouring seaports to a common hinterland. In specific cases, some hinterland flows can be too small to make bundling in a sufficient frequency possible. By combining the road freight flows of neighbouring ports, this problem can be solved. However, the additional cost of bundling and the loss of time need to be compensated for by a lower transport cost. The paper presents an empirical model for the 104 core Trans-European Transport Network (TEN-T) ports of the European Union (EU) and their 271 NUTS2 (Nomenclature of Territorial Units for Statistics) hinterland regions that allows identifying opportunities for bundling as well as the direct and external cost effects. By including the value of time (VOT) of each transport mode, the generalised cost is also calculated. The result is a business model that helps port authorities, and other port actors, to identify bundling projects that will lower the direct, generalised and external costs of the hinterland connectivity, thus increasing the port attractiveness for port users as well as lowering potential aversion by the surrounding community to port operations that create hinterland nuisance.
1. Introduction
Seaports, defined as a geographical location where cargo changes transport mode, one of these being a seagoing vessel, are important drivers of the regional economy of which they are part. They serve as nearly inexhaustible sources of raw materials and components and give access to insatiable world markets. Any but the smallest port consists of more than one terminal, where these activities, organised by a diversity of actors, take place [1,2]. They have evolved, with the introduction of the container [3], from destinations to nodes in global supply networks [4]. Thus, seaports have become important links in a global supply network and their success cannot be separated from the success of the supply chain of which they are part [5,6]. The introduction of the container has led to a reduction of the captive hinterland, changing it to a contested hinterland, but increasing the sum of both thus extending the influence of the port [7]. The maritime supply chain is, by definition, a cooperation between at least two ports and, more specifically, many actors in each port [8]. This cooperation can be in a vertical supplier–customer relation but also can be a sharing of resources between competitors or servicing a common customer, without a contractual link between the operating parties. One of these actors is the port authority (PA). In the case of a Hanseatic landlord port authority, as defined by the World Bank [9], being locally owned, not handling cargo and rarely directly profit-motivated, the objective of the PA is to maximise local welfare.
All these economic activities generate not only welfare for the surrounding community, but they also generate external costs that threaten the licence to operate the port. The port actors, and the PA as its embodiment, have every interest in reducing these negative externalities. The most visible externality of port operations for the surrounding community is the nuisance created by the hinterland transport, especially when it is executed by road. Reducing the use of road freight into the hinterland is a priority for many PAs. However, promoting a modal shift for hinterland cargo flows, away from road freight to a more sustainable, bundled, transport mode, i.e., rail or barge, requires sufficient volumes, and the additional bundling costs will act as a disincentive for the forwarder and/or shipper. In some cases, these required volumes will necessitate cooperating with neighbouring ports. This paper shows how, where and if, by cooperating, these volumes can be attained and whether, on a case-by-case basis, the cost of bundling is compensated for by economies of scale of the bundled transport mode as well as the external cost savings that can be made.
In Section 2, the concept model describing the welfare effects of hinterland bundling through cooperation is summarily presented. Section 3 shows through a conceptual break-even analysis of bundling how the costs of bundling can be compensated for by the lower costs of the bundled transport mode. Section 4 describes the data that allow the identification of opportunities for the 104 core Trans-European Transport Network (TEN-T) ports. Section 5 analyses the direct costs and the time effects and presents an empirical methodology to verify whether the break-even point is reached. The external cost aspects and the savings that can be made through bundling are analysed in Section 6. Next, in Section 7, as an example, the theory is empiricalised using the case of the ports of Zeebruges and Dunkirk, the port of Zeebruges being in advanced cooperation talks with its biggest neighbour, the port of Antwerp. Section 8 concludes the paper and suggests further research.
2. Welfare Effects of Port Cooperation in the Hinterland
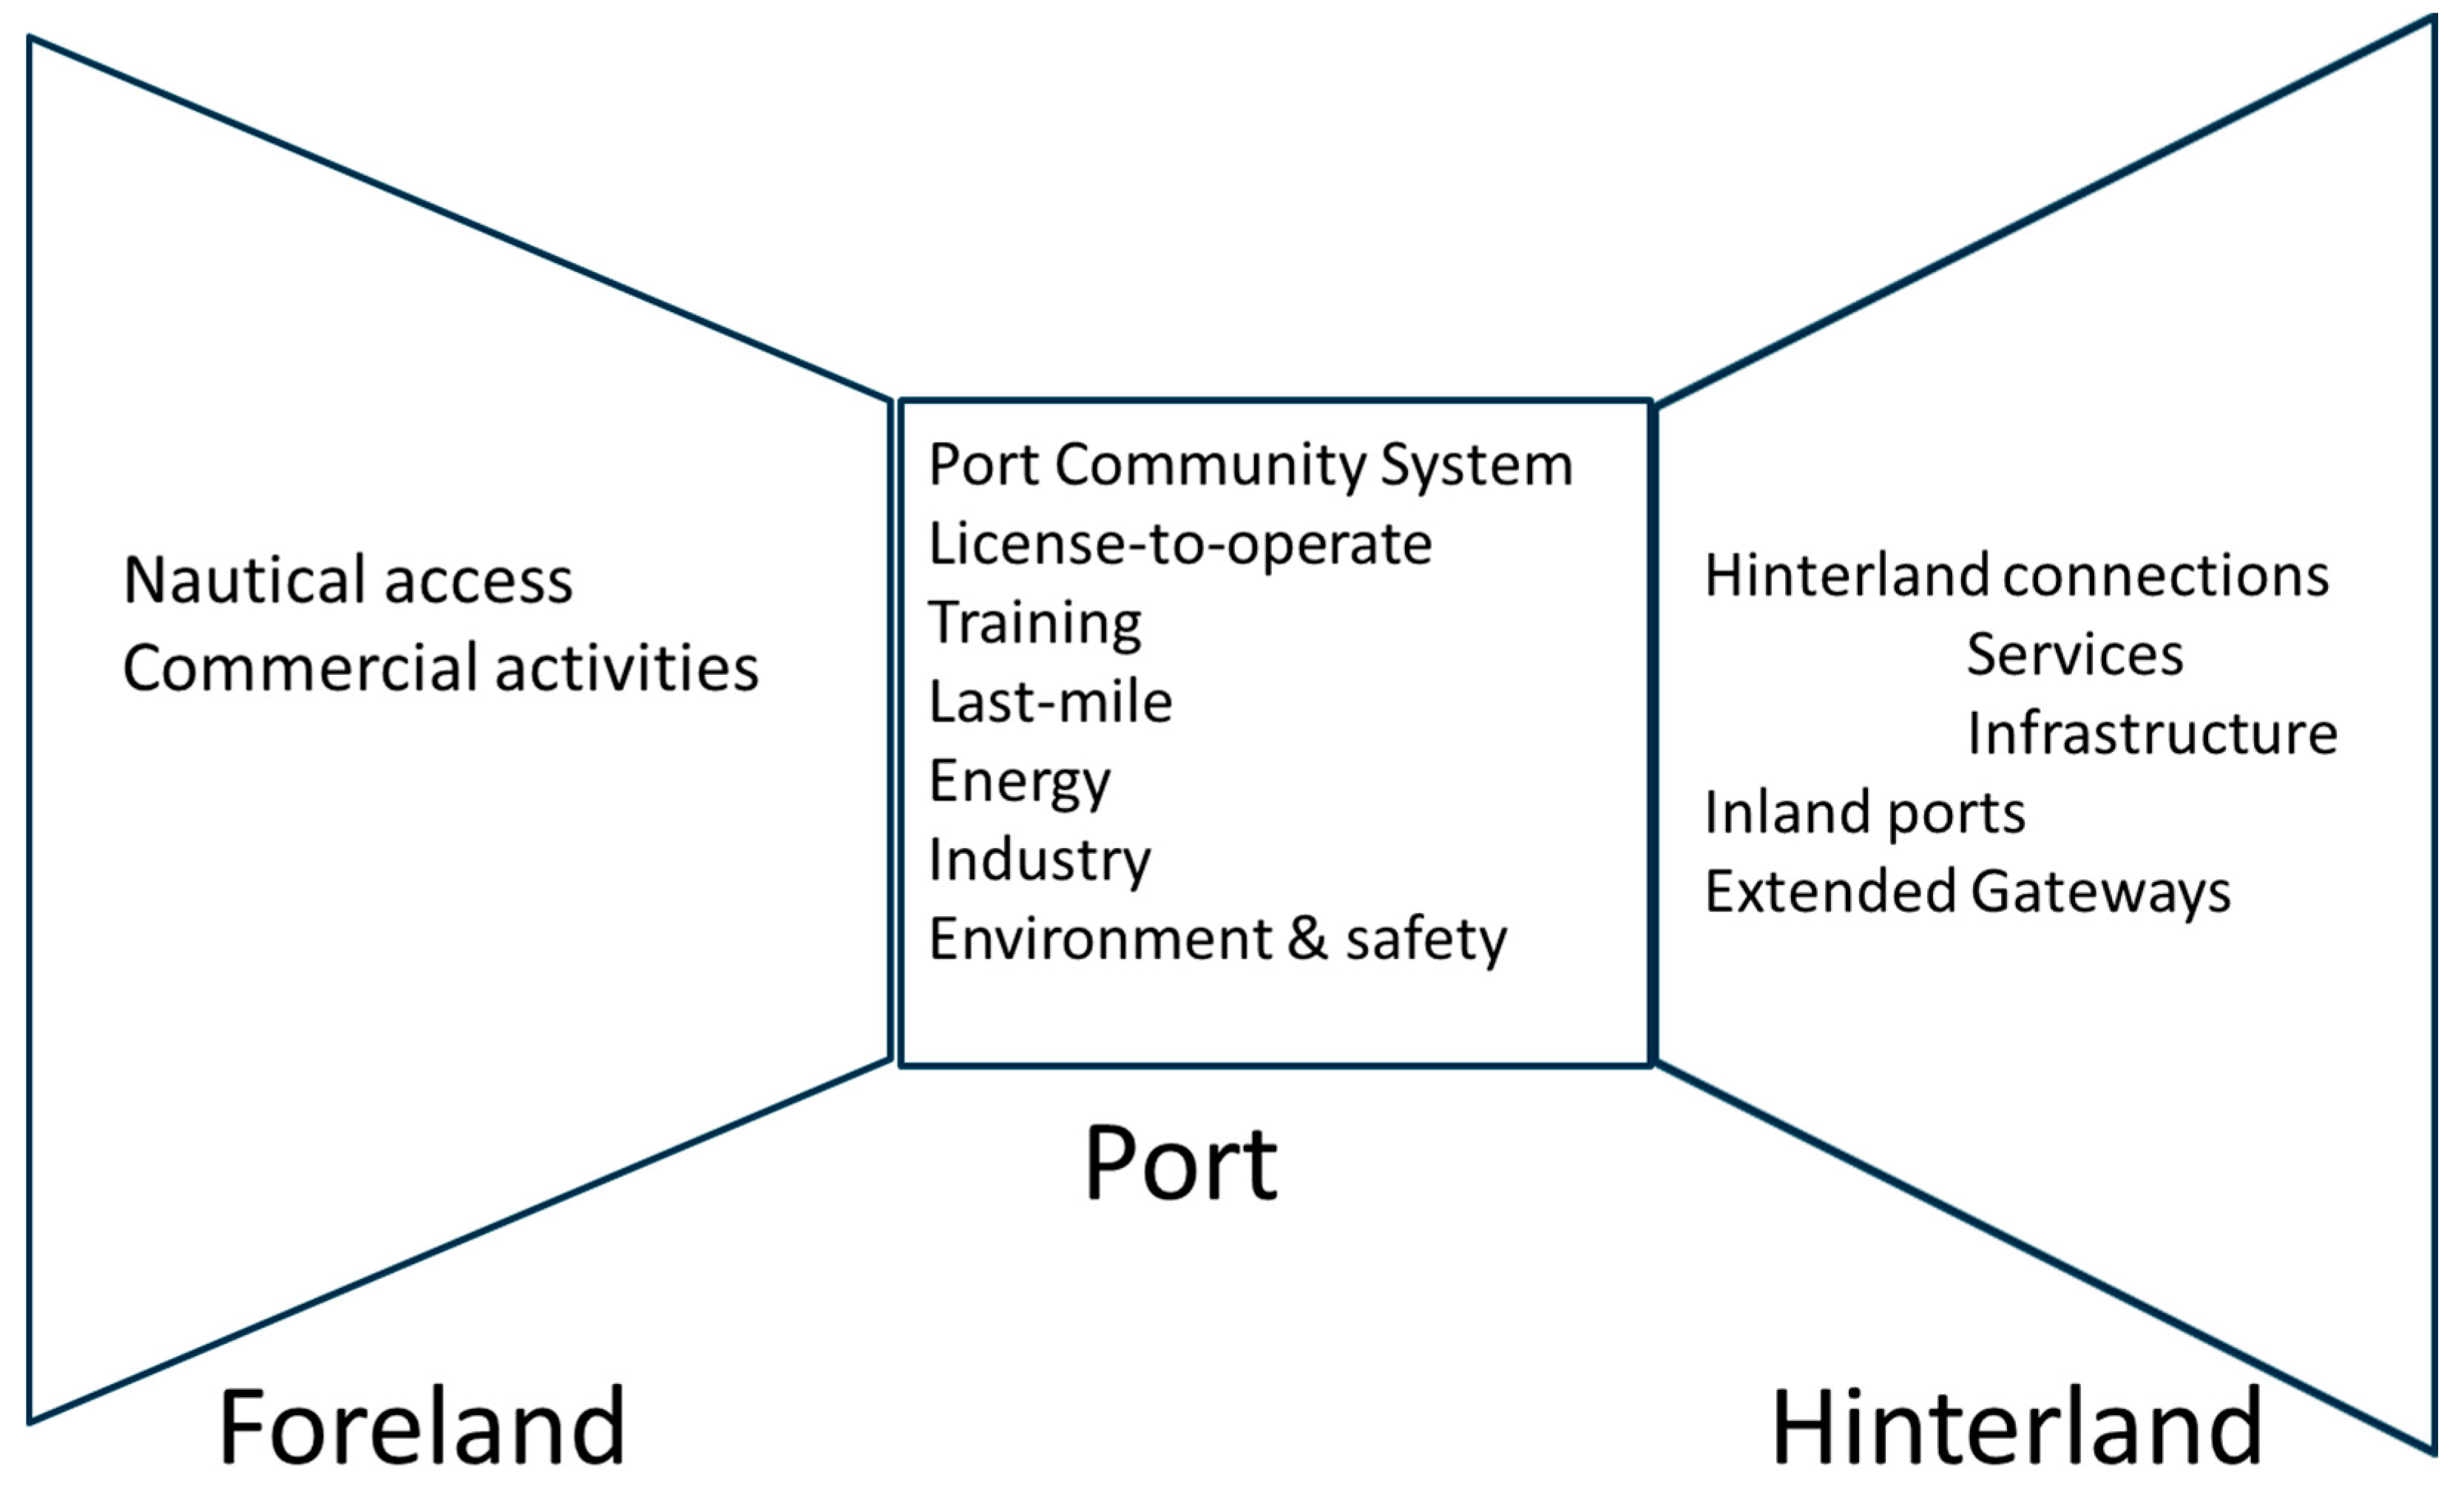
Port cooperation can come in many tastes and flavours [10]. Looking at the triptych that is a port, cooperation can take place on the seaside of the port, the port proper and on the landside [11,12]. Figure 1 gives a non-exhaustive overview of the many possible cooperation opportunities.
Since the hinterland is often the most costly part of the maritime supply chain and the proportional importance of this cost is increasing, cooperation in the hinterland connectivity can have an important impact on the direct and generalised cost of the maritime supply chain [13]. The hinterland accessibility defines in a large part the throughput of a seaport [14]. An improved hinterland accessibility will positively impact on the attractiveness of the ports, thus potentially increasing the port throughput and, as a result, the regional welfare.
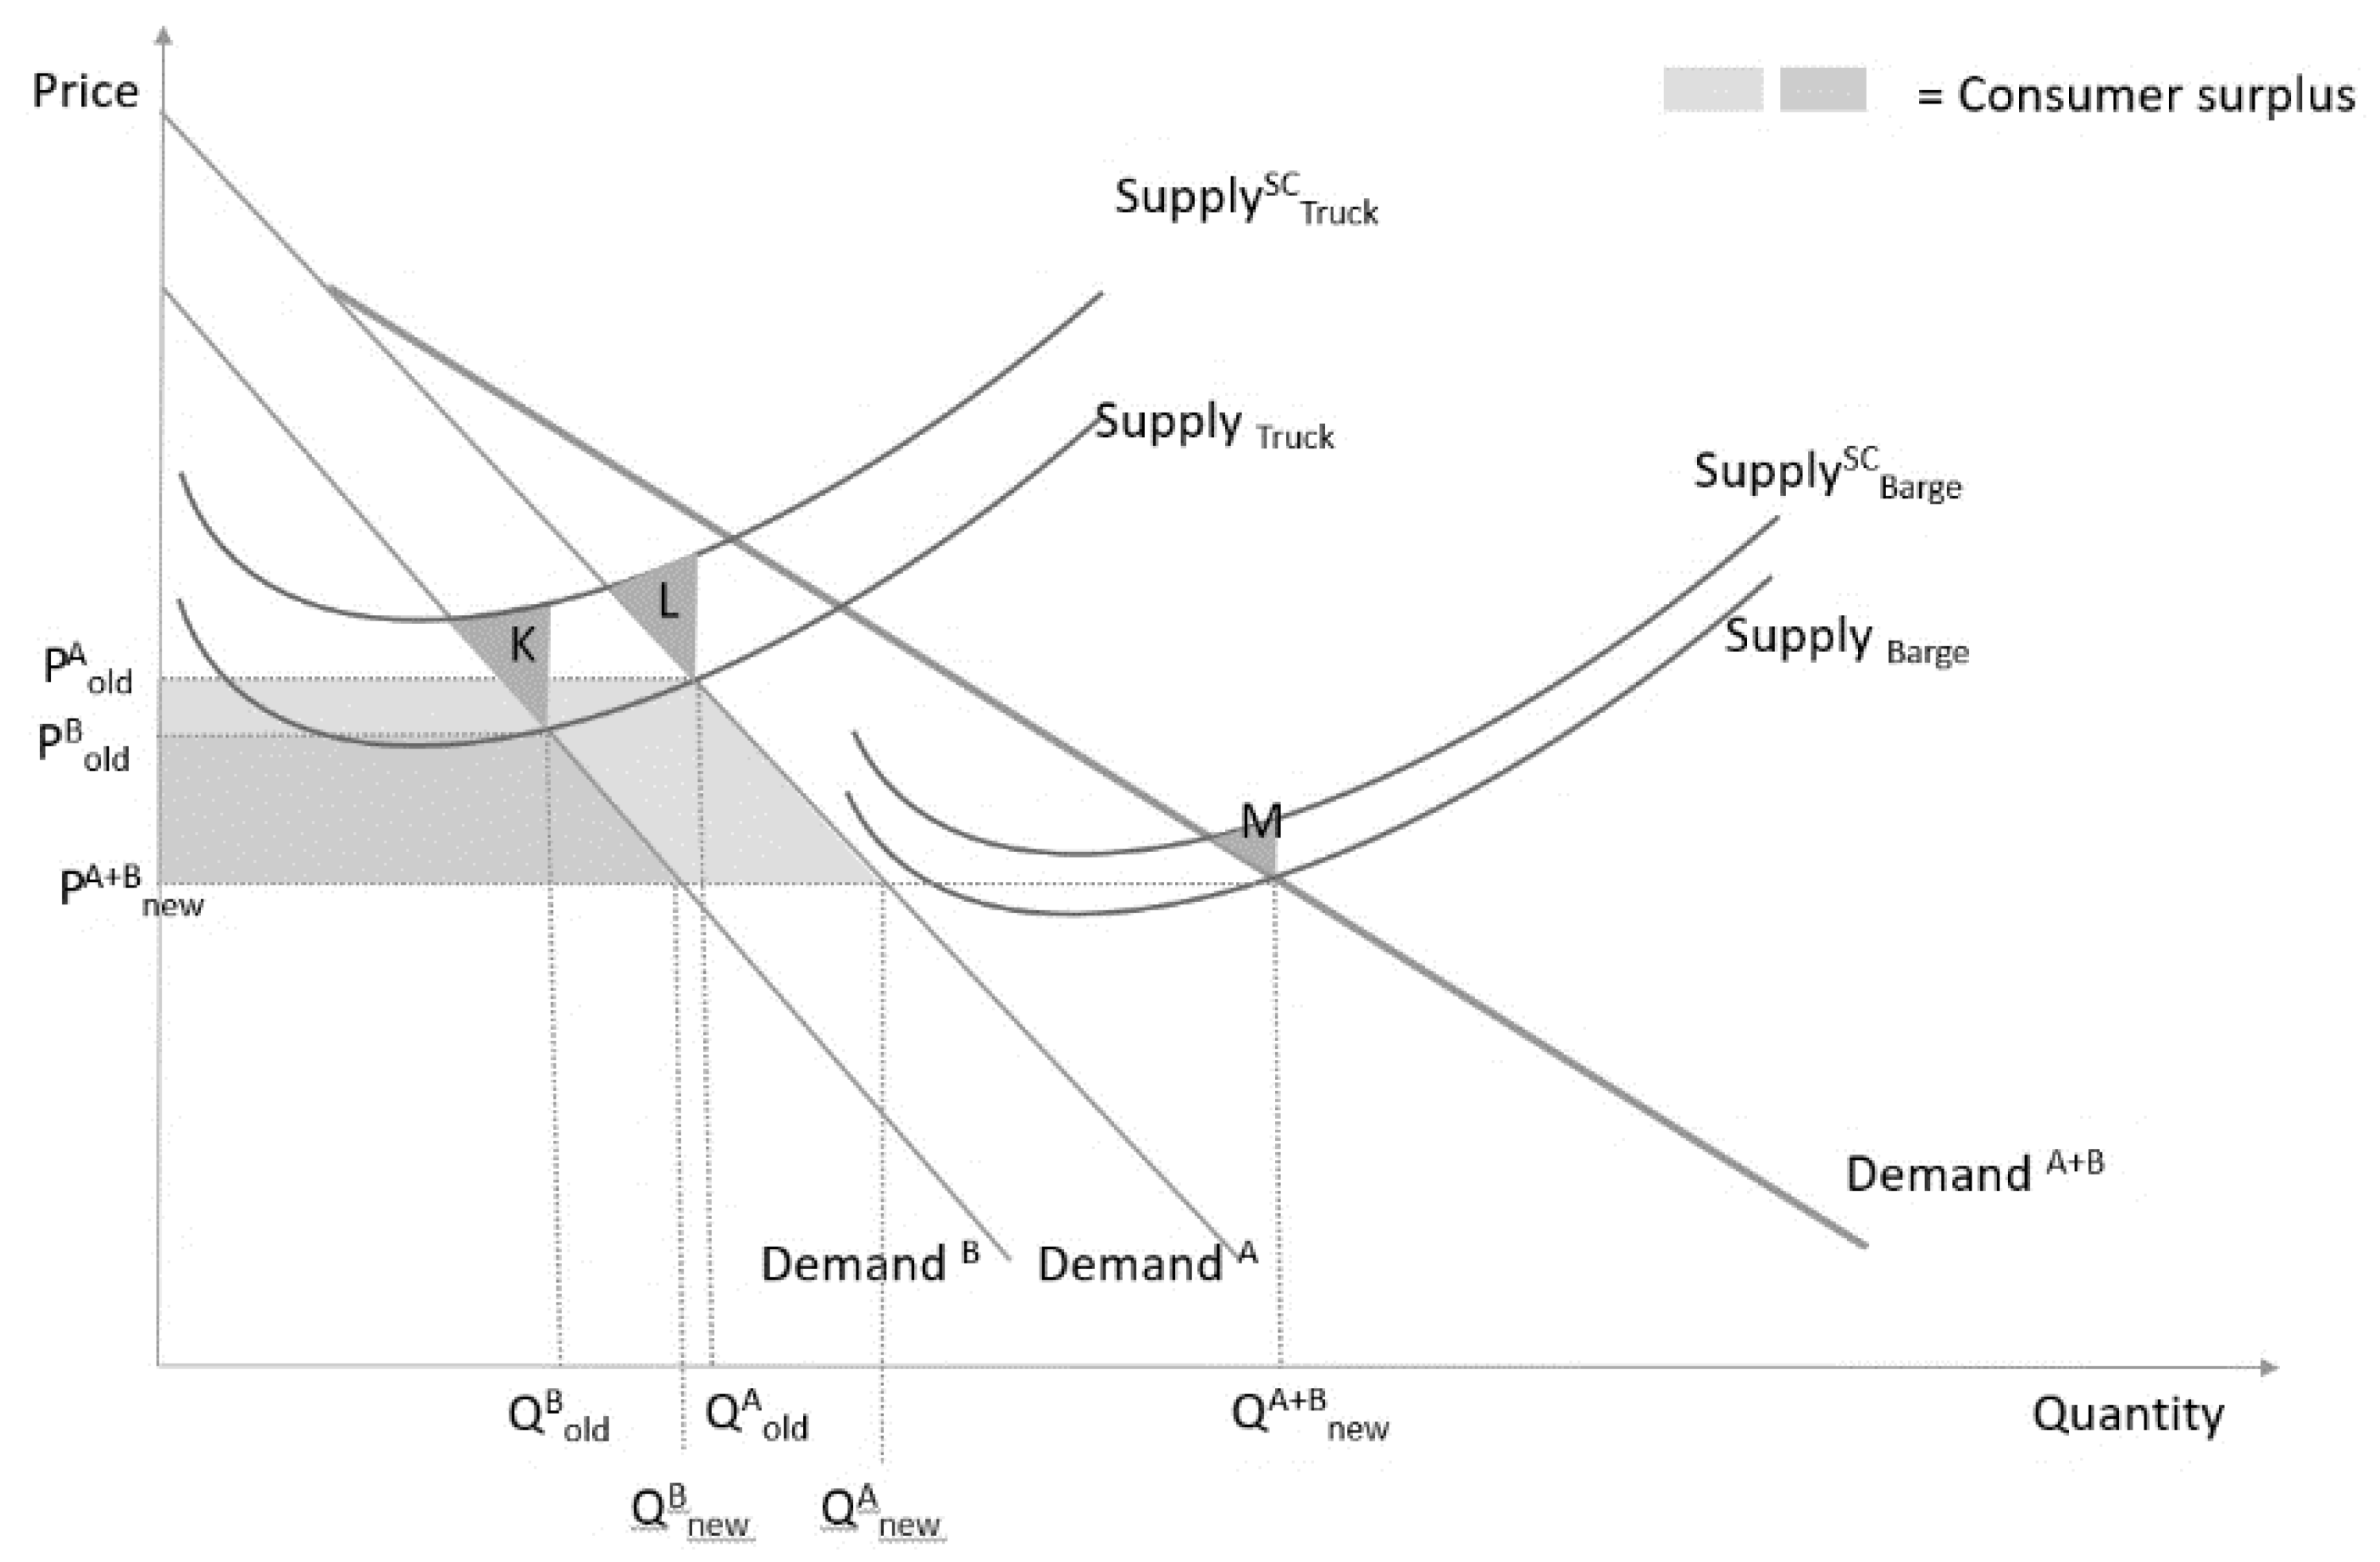
Figure 2 shows how, when two ports (A and B) serve the same hinterland with a small cargo flow, the volumes from each port are too small to facilitate a modal shift. However, when they cooperate and combine the flows, they might reach a volume sufficient to fill a regular, bundled hinterland service. The objective is to lower the generalised cost, represented by the supply curves, for the shipper. The lower cost can be found through the use of a bundled transport mode like a barge (or a train), but this requires a minimal volume. This volume can, in some cases, be found by combining the road cargo of two (or more) neighbouring ports.
The bundled transport mode (barge in the case of the graph, but it could be a train) not only results in a lower direct cost, but this lower cost also results in an increased volume, which increases the value added created by the port activities in the port region. The increased consumer surplus is the sum of the increase in each port. For each port, the surface of the tetragon that represents this increase is calculated by Equation (1) (based on [15]): Equation (1). Increased consumer surplus.
Because the external costs, represented by the social cost curve SupplySCbarge where these costs are added to the marginal private costs, of the bundled transport mode are, per ton-km, lower than those of road transport, there is the additional benefit of a lower total external cost. The external cost M in most cases is lower than the sum of K and L, even with an increased volume, which is further developed in the following sections.
The lower cost leads to a higher demand but, probably more importantly, to a higher market share. Both together lead to a higher throughput and consequently to a higher added value. The market share of a port is the result of the port attractiveness. This can be measured with a discrete choice formula where the likelihood of a port being chosen depends on the generalised total logistics cost of the supply chain of which the port is a part, in proportion to the same cost of all competing ports. This is shown below in Equation (2). Equation (2). Discrete choice probability of port attractiveness. The total generalised cost takes into account the value of time (VOT) and all other costs additional to the direct transport cost, e.g., the transfer cost. When two supply chains have an equal out-of-pocket cost, the faster one has a lower generalised cost because less value is lost because less time is spent during the transport.
This discrete choice probability formula starts from the supply chain perspective of which a port is a part, PA being the probability that port A will be chosen rather than any of the competing ports. The set of all ports serving the same foreland is represented by the i and A is the index representing port A as one port of the set. In the same formula, β is the parameter that gives the effect of the cost on the probability and has to be statistically estimated. As first suggested by Vigarié [16], a port has a foreland, the port proper and a hinterland, each with its own costs. The foreland cost and the port cost of port A are represented together by OCA, and OCi is the identifier for these costs for all gateway ports i, serving the same hinterland; these are considered constant and do not influence the following analysis. The hinterland cost is identified with the term HCA, which relates to the generalised hinterland connection cost from port A to the specific hinterland region, while HCi is the symbol for the hinterland cost for every port i connected to the same region. So, if the hinterland cost of port A is reduced (represented by HCA), the attractiveness of port A increases, mutatis mutandis [17].
The conceptual use of the discrete choice formula has some drawbacks when empirically applied (which this paper does not do). The number of cases affects the probability of the outcomes, known as the independence of irrelevant alternatives (IIA) assumption. When a large port is treated as two (or more) separate ports, intuitively it is obvious that this should not change the probability of the other ports, but the discrete choice formula still leads to a different outcome. This can be avoided by using a nested logit model [18].
3. Break-Even Analysis of Hinterland Bundling and Multimodality
For a bundling opportunity to be economical viable, the lower cost of the bundled hinterland transport must compensate for the cost of bundling and the (potential) increase in time spent on the route. Figure 3 shows how, for a given distance, the road-only solution (a), with a given fixed cost for loading and starting the truck, is more economical, but for another distance (from M1 to M2) the intermodal solution (b) with a higher fixed cost for bundling is more economical. The distance M1 to M2 is dependent on the cost of the bundling; the kilometre cost, based on the operating conditions of the operators, of the different transport modes (ωr and ωi); and the position of the bundling point [19].
Niérat (1997) does not discuss the factor of time, looking at it from an operator viewpoint, but the graphs can be interpreted from a shipper’s viewpoint too and can be seen as representing the generalised costs as well.
This supply side approach, focussing on the costs, ignores the availability of cargo. Even if the bundled generalised cost is lower than the road cost, bundled cargo flows need minimum volumes to be commercially viable. The market area and the optimal location of transfer hubs based on a cost, and thus supply side, approach [20] could lead to a situation where a service would be competitive but not available due to a lack of demand. This is where a port authority (or any other interested port actor) can bring value added by bundling cargo flows of two or more ports, that are geographically near each other, into one volume that would be sufficiently big to create a demand needed to match the supply [12].
To make bundling an economically viable proposition, if sufficient volume can be found through cooperation, then the time and distance costs of the road option, including the VOT, need to be higher than the time and distance costs of the rail option, increased by the transfer and bundling time, also including the VOT. This should be the case for each of the participating ports.
4. Identifying Opportunities for Hinterland Cooperation
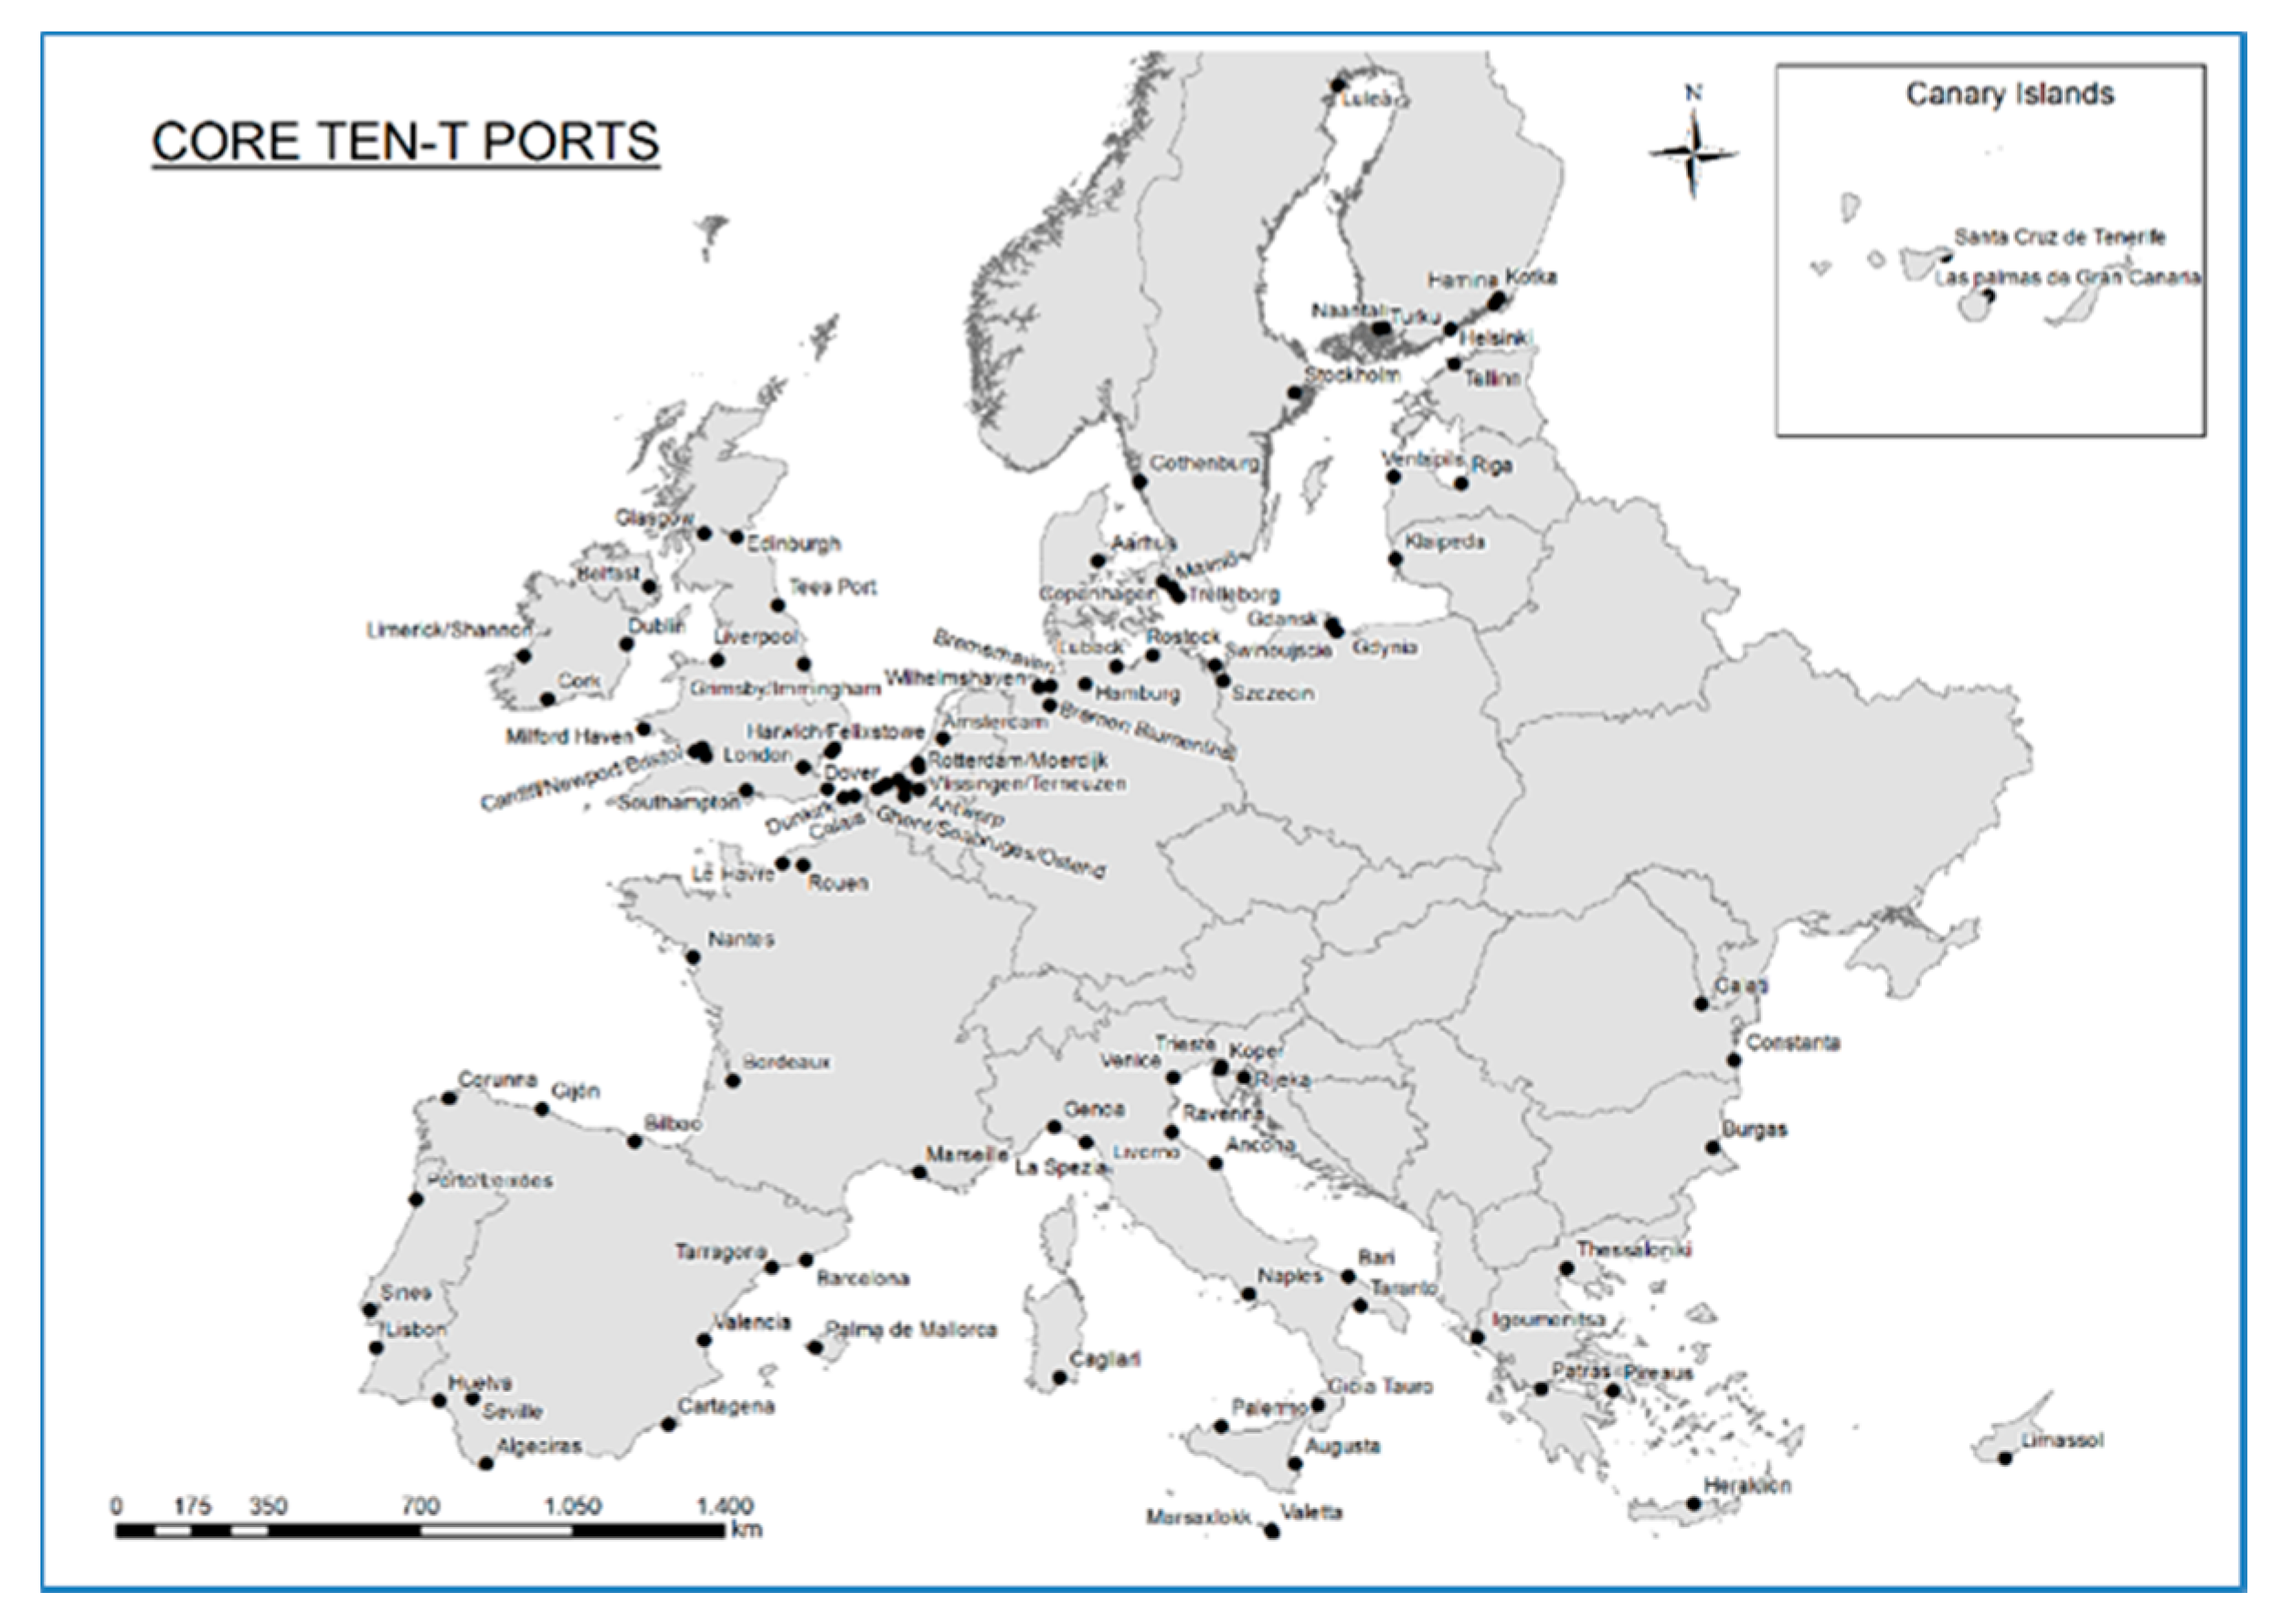
The European Union (EU) has defined nine corridors in its TEN-T network. In this network, 104 ports are considered to be core ports. They service the hinterland of Europe, out of over 300 network ports [21,22] (Figure 4).
Ports ship, or receive, to (or from) some specific regions hinterland cargo in smaller volumes. The further away the hinterland, the more likely the volume is too small for a bundled transport mode. However, there might be cases where adjacent seaports each have a volume too small for bundling but are together big enough to allow a regular rail, or even a barge, service.
Eurostat collects road transport data at a NUTS3 (Nomenclature Of Territorial Units For Statistics) level with information on the origin and destination, the volume but also the type of cargo and the type of goods. The cargo type is given based on a list of ten different types (see Table 1). The list is close but not identical to the five cargo types used in port statistics [23,24].
Of these types, some are containers or could easily be put into one, so this cargo can be considered to be containerable; these are the categories 2, 3, 4 and 5, namely large freight containers, other freight containers, palletized and pre-slung. The other cargo types might be added to a hinterland train with dedicated wagons but are not considered further in the analysis, although they may have a positive impact on marginally positive business cases with only containerable cargo. An analysis at the NUTS3 level leads to an OD matrix of 104 ports by 1348 NUTS3 regions, which would be cumbersome and result in many small cargo flows. For this reason, the hinterland pair element is aggregated at the NUTS2 level, resulting in 281 hinterland regions serviced by 104 core ports, assuming that the port NUTS3 region is a good proxy for the road volumes of the port proper. Considering the small size of a NUTS3 region (between 150,000 and 800,000 inhabitants), this assumption is valid. At the other end, it is assumed that every NUTS2 region has railway access; considering the size of a NUTS2 region, 800,000 to 3,000,000 inhabitants, this is a realistic assumption.
Starting from a European cargo train with a capacity of 80 Twenty feet Equivalent Unit (TEU) containers, a (rather conservative) occupation degree of 80% is used. Every container is counted with an 11 ton load, based on the port statistics of Rotterdam, Antwerp and Hamburg [12]. This leads to a train of (only) 704 tonnes of cargo, not counting the containers themselves and the wagons. A twice-weekly rail service would ship 73,216 tonnes, making this a lower limit of the volume needed to make bundling viable. If a service cannot be organised twice weekly, it will not be commercially viable. In contrast, if an annual volume of 183,040 tonnes is shipped by road between a port and the concerned hinterland, then the port should be able to organise a daily rail connection as a stand-alone.
Summarising, this means that when a port has a road volume to a specific hinterland of less than 183,040 tonnes annually, then it should check with neighbouring ports to see if, by combining their road flows to this common specific hinterland, they can reach, together, a minimum volume of 73,216 tonnes. If such a combination is available, then this may represent an opportunity for modal shift through cooperation. Whether this shift is also economically viable is discussed in the following sections.
When working with the annual data that are available, one needs to be circumspect when using them for detailed operational analysis. It is presumed that there is little fluctuation in the weekly volumes. Analysis by Rashed [25] shows that the difference between the busiest month and the least busy month in container throughput of the port of Antwerp is less than 10%. So, one can assume that the annual data can be used as an approximation for weekly data by simply dividing them by 52.
5. Cost Calculation Aspects of Port Cooperation in Hinterland Bundling
If the analysis of the volumes shows that there is potential for the bundling of road cargo flows of neighbouring seaports, then the question of whether the bundling costs are more than compensated for by the direct and generalised cost savings must still be considered. In the following paragraphs, the detailed costs and cost parameters are described, resulting in a cost model that allows to determine, through a break-even analysis, if the available volumes for bundling lead to cost savings.
5.1. Time and Distance Costs
5.2. Value of time (VOT)
The VOT is the result of the value of cargo. The World Shipping Council reports a total value of shipped containerized cargo of 1.41 trillion euros in 2017, for 60–65 million TEU, resulting in an average value of 23,500 euros/TEU [30]. Seabury reports an average value per TEU for Benelux, France and Germany of 43,080 USD for import and 41,210 USD for export, also in 2017 [31]. A rounded-off average of 35,800 euros per TEU (with an exchange rate of 1.2 EUR/USD) was set. Starting with a depreciation of four years, an annual value loss of 25% was set, and 2.5% annually was added for the financing of the cargo, resulting, with a value per TEU of 35,800 euros, in a VOT of 26.97 euros/day per TEU, rounded off to 27 euros/TEU-day, making 1.12 euros/hour-TEU.
5.3. Time and Distance Parameters
The time spent driving is, of course, dependent on the distance travelled and the travel speed. Eurostat provides what they call flat files, with road distances between NUTS regions [32]. It is assumed that the rail distance equals the road distance; as most cooperation cases will be happening over longer distances, this assumption is therefore valid. The speed and times needed for shunting and loading/offloading were set, based on the same sources as the time and distance costs for the different transport modes. Additionally, a truck driver has to legally respect obligatory resting times. Every 4.5 h, the driver needs to rest 45 min. After 9 h of driving, an 11 h rest is compulsory [33]. The above-mentioned chain model [13] cites a truck speed of 80 km/h, which seems a bit optimistic in today’s congestion; the other sources vary between 52 and 69 km/h. An average of 65 km/h seems realistic. For train speeds, there is much more consensus with a value of 50 km/h; only Grosso (2011) gives 55 km/h. The time needed for loading, unloading and bundling is only mentioned by van Hassel (2018) at a realistic 1.5 h for a truck and 20 h for a train. It is important to note that the time for a truck while waiting to be loaded is at full cost, as the driver is standing nearby. This time for the train is important for the cargo, which is sitting idle, but the train does not have to be paid during this time (See Table 3).
5.4. Transfer and Bundling Costs
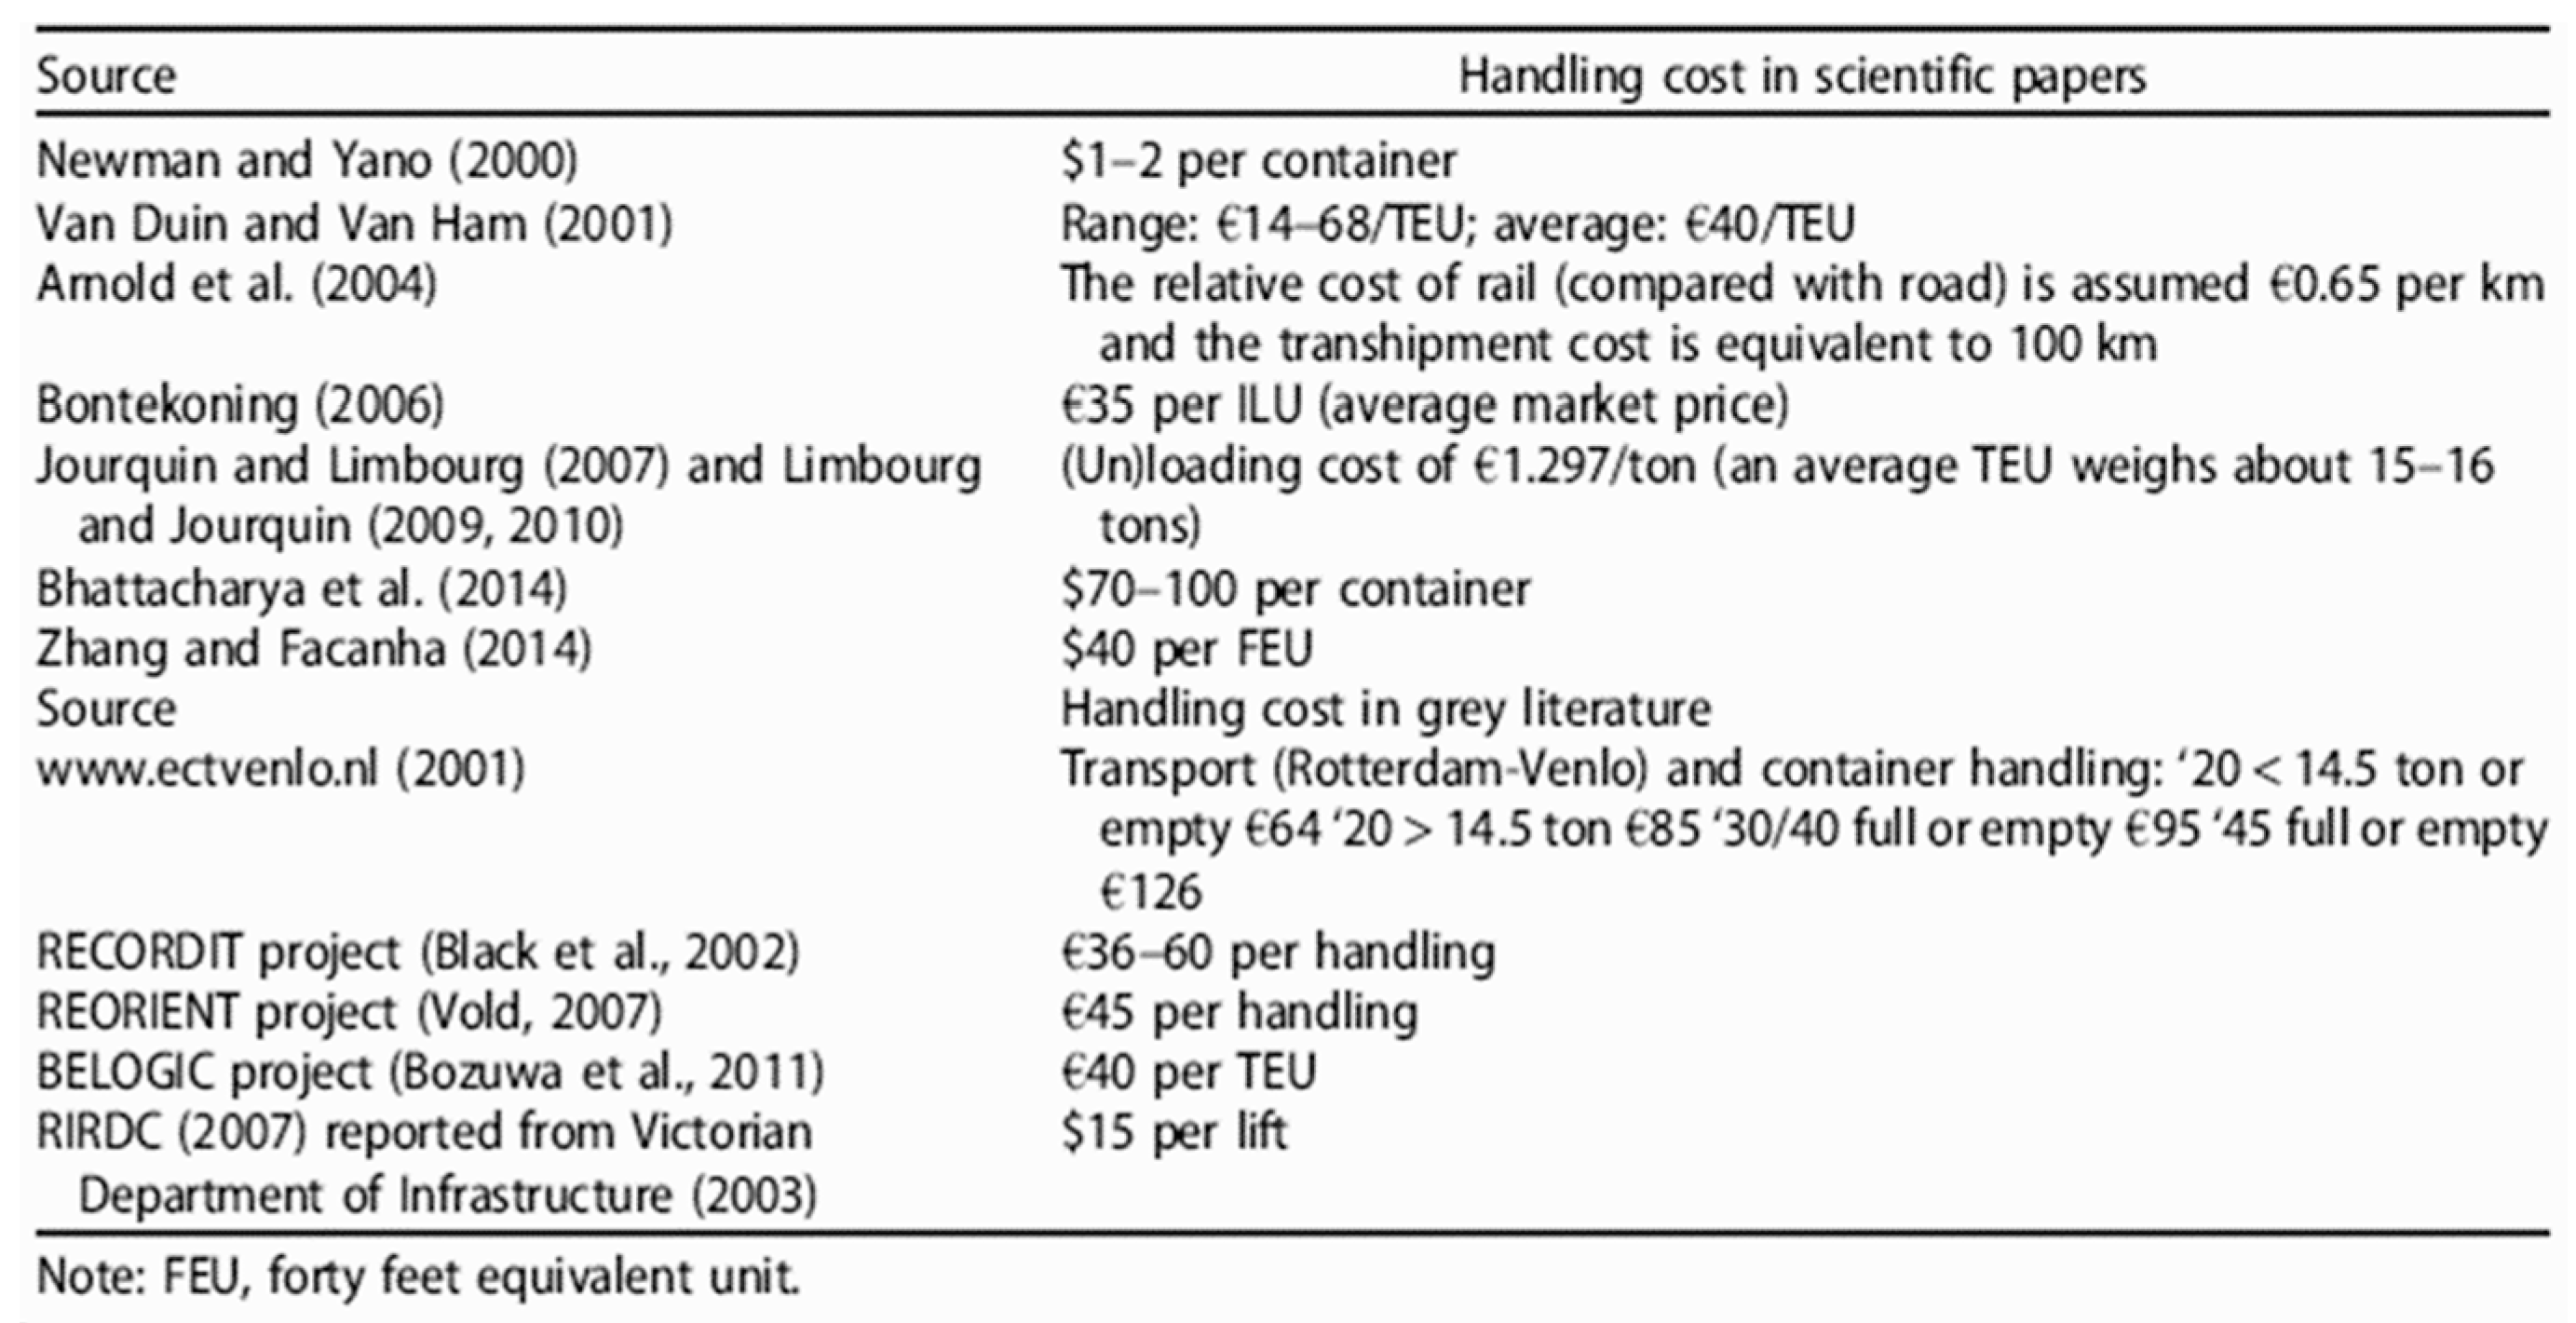
Based on the literature review of Wiegmans and Behdani [34] (see Figure 5) and after validating the data through interviews with several terminal and rail operators, a transfer cost of 50 euros/TEU was set. This cost covers the offloading and loading of a container from a train or barge onto a truck for the last mile. The loading onto the train is considered to generate the same cost as loading onto a truck in a full-road transport scenario.
Another important expenditure in bundling road freight towards a rail service is the cost of the assembly of a train. Van Hassel et al. (2018) estimate it at 1165.21 euros per train. For the present research, after validation with industry experts, it was set at 1000 euros for the calculations in the following section.
Summarising, Table 4 shows a comprehensive overview of all costs for the different transport modes.
6. External Cost Savings through Hinterland Bundling
Research shows that, when cases are studied, a (sometimes large) part of the direct cost savings is lost through an increased VOT [12]. However, in addition, a much larger savings can be made in external costs. The trucks used to cover the distance by road generate an external cost that is substantially higher, per ton-km, than the external costs generated by a train.
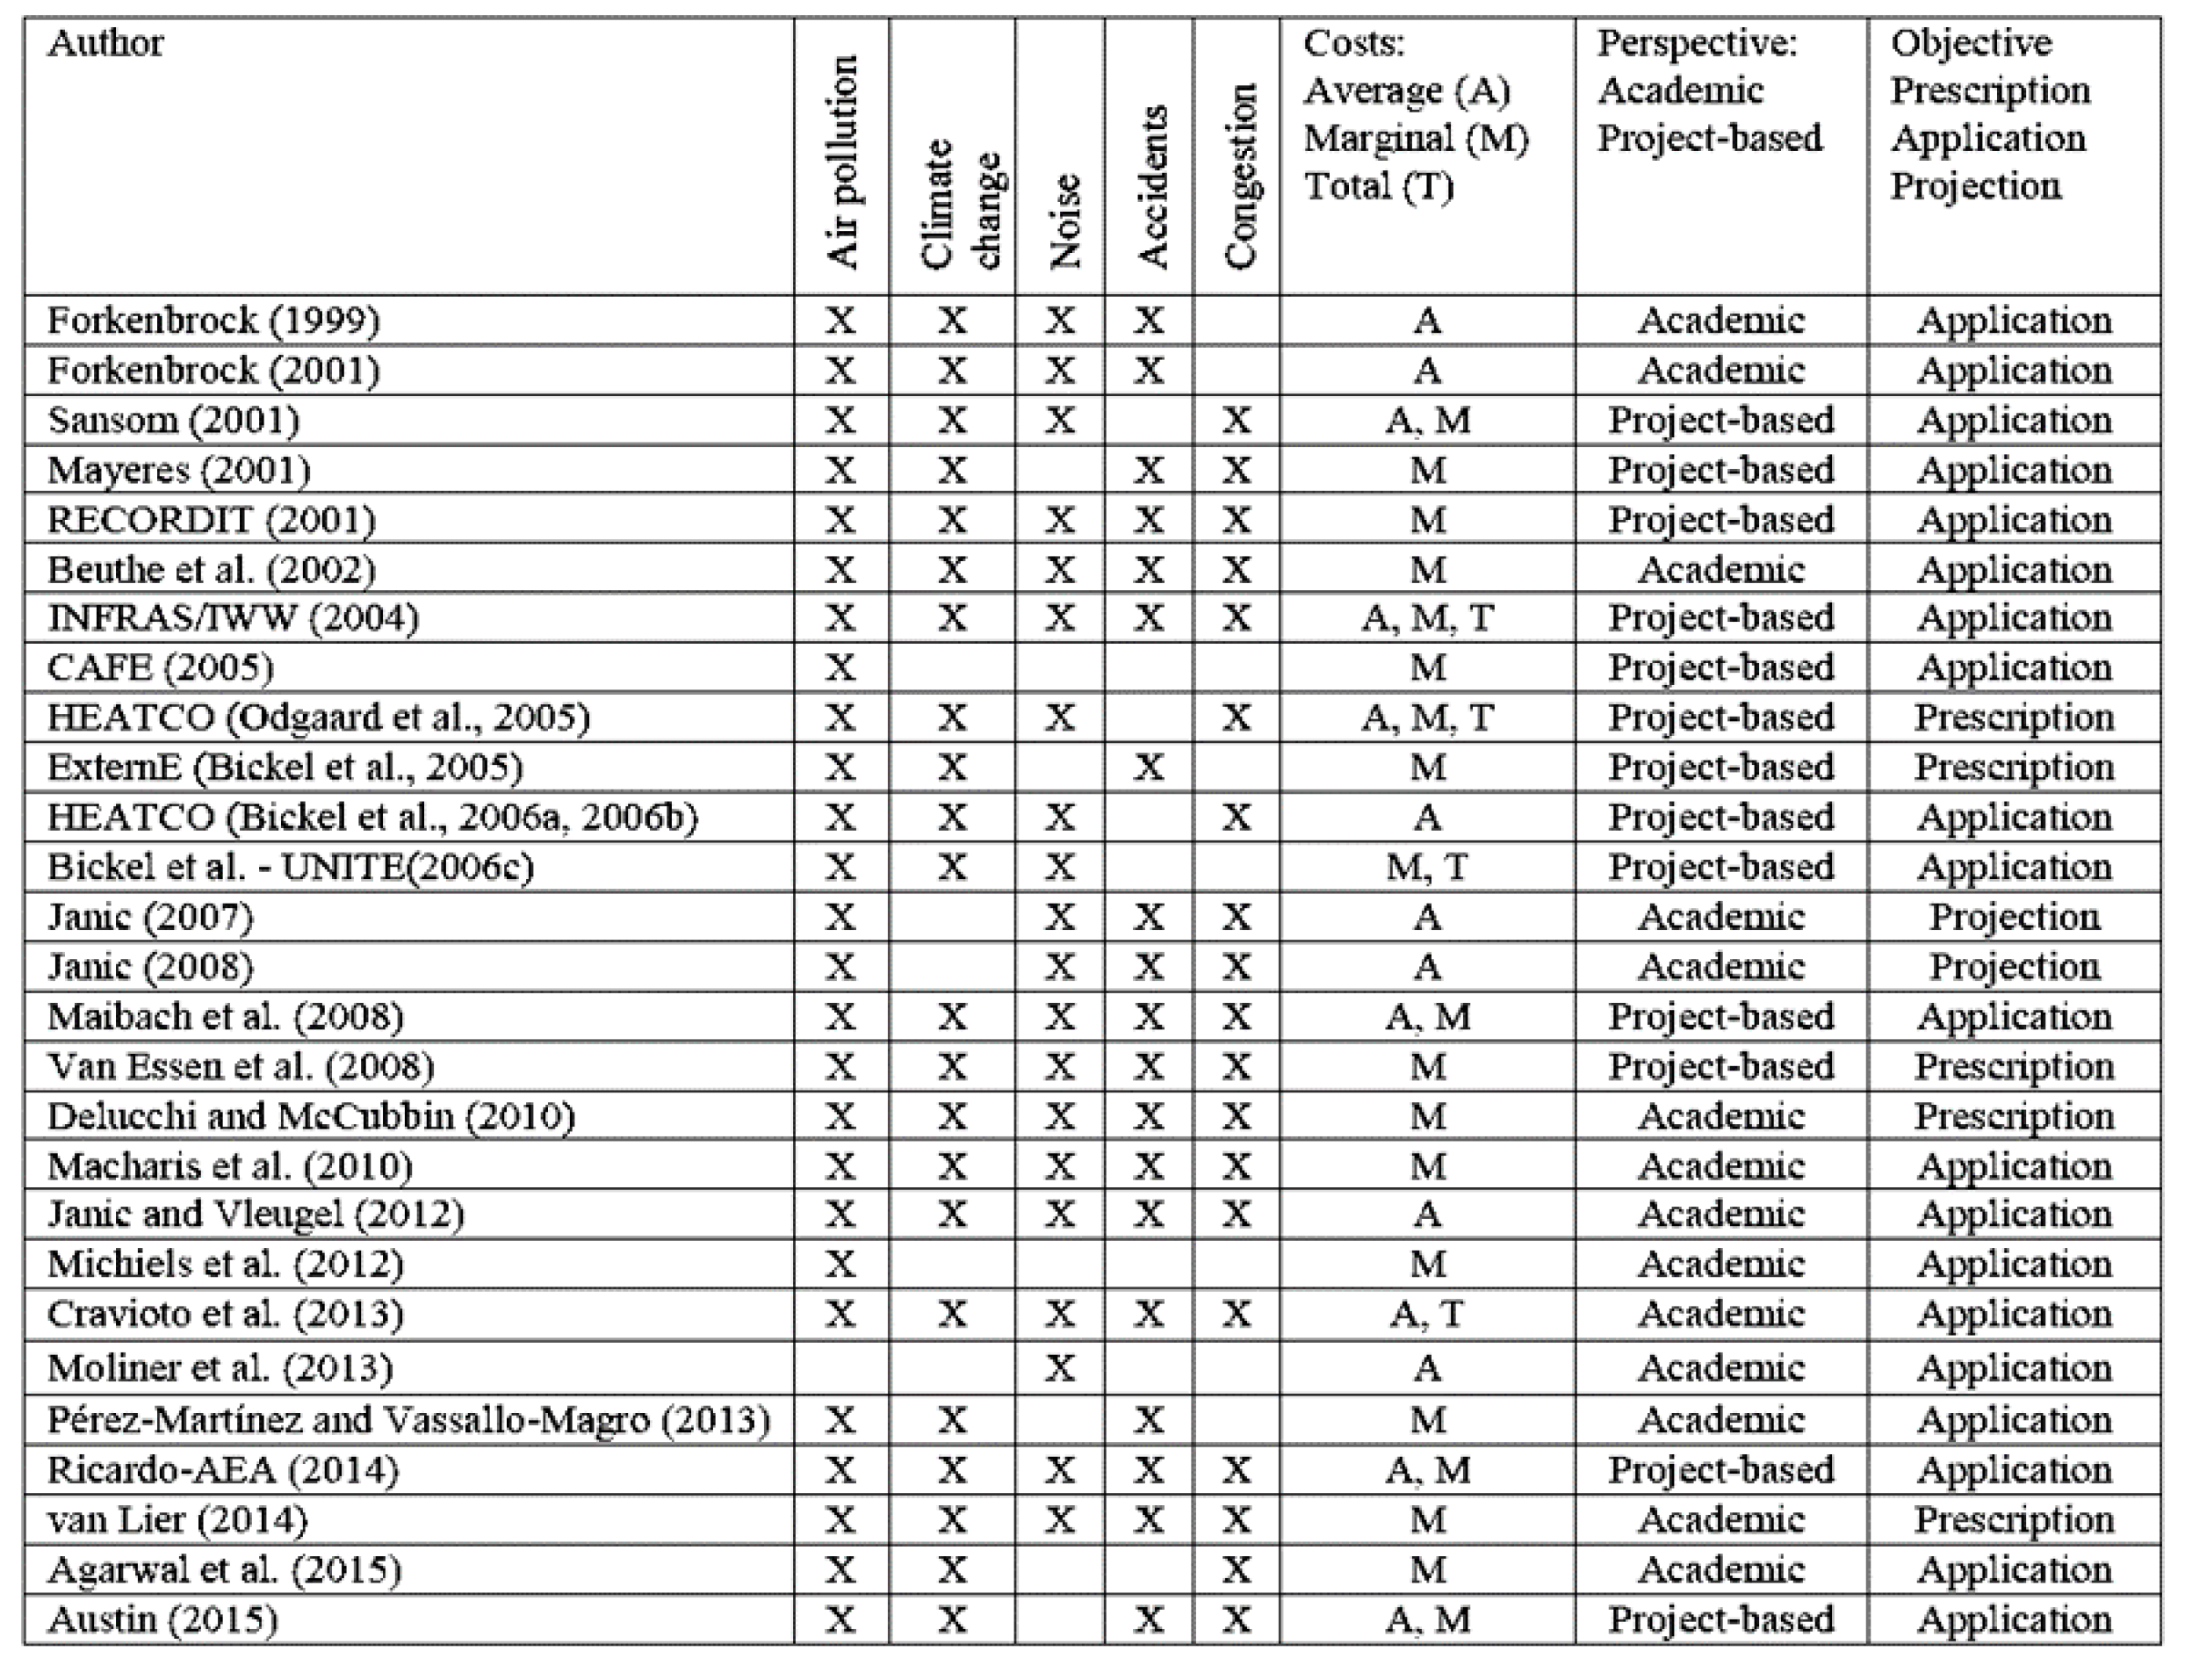
For the external costs, the work published by Ricardo AEA was used [35]. This was supported by the literature review of Mostert and Limbourg [36], which analysed the available studies (see Figure 6). Since a source was needed that covered all the external costs and provided marginal costs, Europewide the Ricardo AEA reference was justified.
These costs are, of course, strongly dependent on the time and place where the transport takes place. The choice for an articulated truck on a rural motorway near capacity is a logical choice since the focus is on long-distance, port-oriented, freight traffic. In contrast, an electric freight train, running at night and with the electricity being produced by the average European technology, is the chosen standard. This results in the values for the different external costs as shown in Table 5.
The external cost savings can be, for longer distances, a multiple of the direct and generalised cost savings. Even in cases where there is a direct cost saving, which can be almost completely lost through an increased VOT, the resulting external cost saving can make the proposition interesting from a social viewpoint [12].
Of course, private operators and shippers are rarely motivated by the social benefits of the bundling. Even when they have a direct cost saving, it needs to be sufficiently substantial to motivate them to modify their habits and to motivate a mental shift. This may very well be the reason that the much-needed modal shift has not happened at the hoped-for level. The generalised cost savings are too small to entice shippers and the external cost savings do not sufficiently motivate forwarders and cargo owners.
This leads to the conclusion that a system needs to be developed to internalise these external cost savings. It is beyond the scope of this paper to develop the details of such a system, but a Hanseatic landlord port authority might be a manager of such a system. Being in the centre of the maritime supply chain and having the interest of the community surrounding the port at heart, such a port authority could well use the external cost savings to facilitate a bundling of private cargo streams together with neighbouring ports.
In the following section, one case is further developed as an example of the different cost savings that bundling of hinterland cargo flows with a neighbouring port could bring.
7. Empiricalisation: The Case of Zeebruges and Dunkirk
The case is chosen because, at the time of writing, talks were being held between the Port of Zeebruges and its much bigger neighbour, the port of Antwerp. The size discrepancies make it difficult to find a corporation structure (there is even talk of a possible merger) where the big partner finds enough benefits to compensate for the partial loss of its governance independence to a junior partner while still giving this junior partner enough power in the governance to satisfy their local governance needs. All aspects of country borders aside, the ports of Dunkirk and Zeebruges are much closer to each other in size, which makes sharing the benefits of a joint project easier. Additionally, the recent merger in 2018 of the Flemish port of Ghent with the Dutch Zeeland Seaports (itself a merger of Terneuzen and Vlissingen (Flushing) since 1998) has shown the potential of a strategic cross-border port authority cooperation.
Based on the Eurostat road freight data of 2016, as described in Section 4, a number of NUTS2 regions can be identified where each port alone does not have enough containerable cargo to allow for a daily bundled rail service, but together they can at least fill a twice-weekly service (see Table 8). The NUTS definitions of 2013 are still used because these were valid when the data were collected.
Only import flows are considered. For a more detailed analysis, the calculations should also be applied to the export flows and a balance between both should be reached to make a viable business case.
Table 6 shows that several opportunities are present, but the cooperation for the hinterland around Düsseldorf (NUTS2: DEA1) is the biggest and the fact that both partners are almost equal in size makes sharing of the benefits easier. Each port would have sufficient volume for a twice-weekly service but together they could organise a daily service that is commercially much more attractive. Table 7 shows the distances. The rail distance is assumed to be equal to the road distance. The model lets the cargo from Dunkirk travel by road to Zeebruges to be bundled on a train. There might be room for an optimisation by having the cargo already travel by train to Zeebruges, especially if both ports bundle more than one hinterland destination and the train from Dunkirk to Zeebruges can be fully used, but that is outside the scope of this case study.
7.1. All-Road Situation from Zeebruges and Dunkirk to NUTS2 Düsseldorf
The direct, generalised and external costs of the present all-road situation are presented in Table 8, and the parameters that were used are also shown.
A resting time for the driver comes into play for the cargo leaving from Dunkirk where the driving time is over 4.5 h. The total direct cost for the whole annual volume amounts to 4,772,448 euros, the VOT to 152,874 euros and the external cost to 1,900,256 euros.
7.2. Multimodal Road/Rail from Zeebruges and Dunkirk to NUTS2 Düsseldorf
If all the cargo from Dunkirk is trucked to Zeebruges (using a train would lower the cost but not all cargo in Dunkirk might be in the port proper) and then joined with the cargo in Zeebruges and shipped by train to Dusseldorf, the following picture emerges (see Table 9).
The direct cost drops to 3,415,183 euros, but the VOT increases to 613,400 euros, and the external cost drops strongly to 511,138 euros. The volume is higher than the needed 183,040 tonnes annually so not all cargo has to make the modal shift. Additionally, there might be some non-containerable cargo that, with the use of dedicated wagons such as those for dry or liquid bulk, might be used to complete the capacity of a train service.
7.3. Results and Analysis
Table 10 shows the cost savings (or losses when negative) that are made through bundling. A direct cost saving of 28% is possible, but this is, unfortunately, for a large part lost through an increased VOT, itself being the result of the time needed to form a train. The result is an 18% savings in generalised cost. The savings in the external cost is an astounding 73%, but this is, of course, only of secondary importance for the decision maker when not internalized. The total cost saving is 33%.
From a societal point of view, the cooperation between the two seaports, resulting in a sufficient volume to allow for bundling and modal shift, is beneficiary, but the saving of 18% in generalised cost might not be sufficient to result in a mental shift by shippers and forwarders. Furthermore, it should be pointed out that it is a cost saving, not necessary a price reduction. It will depend on the market conditions up to which point the savings will end up with the decision maker and not with the service provider.
If, in a future scenario, all external costs are internalised, the decision maker will be directly influenced by the total cost and a cost saving of 33% (including all external costs) compared to a cost savings of 18% (when the external cost savings only benefit society) might make a much more convincing business case. This means that tools need to be developed, while waiting for the internalisation of external costs, that allow sharing the external benefits between society and the decision maker.
A port authority, especially a public one (as is the case of Zeebruges and Dunkirk, as a spider in the logistics net of which the port is the centre), might be well placed to organise and facilitate such a system. They are in contact with the concerned parties, service suppliers, operators, shippers and forwarders and they have an interest in the societal benefits of the bundling and modal shift or cargo. It will increase the attractiveness of the participating ports, as a result of the lower hinterland connection costs, and it will increase its standing with the surrounding community thus facilitating its licence to operate and maybe even its attractiveness for the labour force.
The drawback of a public authority intervening in a commercial market may be that it would distort the normal functioning of this market. However, since the market is not interested in the external benefits, such intervention would only rectify an existing market failure, although there is the risk of distortion taking place through a bad execution, e.g., by paying an amount larger than the external benefits. There is also a risk of reduced competition through a smaller number of independent service suppliers, which then needs to be well regulated.
8. Conclusions and Further Research
Seaports are striving to attract as much cargo as possible, and with better hinterland connections they are more attractive for shippers, operators and service providers. A more attractive port will handle more cargo and create more value added and welfare for the surrounding region. However, port operations, and especially hinterland transport, create external costs that may jeopardise the licence to operate. This motivates ports to push for a modal shift, away from trucks towards trains and barges. Nonetheless, the necessary mental shift has not yet fully reached the forwarders and shippers. Additionally, some hinterland destinations do not have the necessary cargo volume to fill a regular bundled transport mode.
By cooperating with neighbouring ports, it may be possible to merge cargo flows with specific hinterland destinations and thus reach the critical mass necessary to fill a regular rail or barge service with a cargo volume sufficient for at least a twice-weekly frequency. The resulting hinterland connection would have a lower direct cost, but would, in most cases, result in an additional VOT. The lower cost would increase the attractiveness of the participating ports and their market share. The modal shift would, however, also result in a lower external cost. This external cost saving might, in many cases, be substantially higher than the direct and generalised cost savings.
With the cost model presented in the preceding sections, it becomes possible to identify potential hinterland regions in the EU where such a bundling between the 104 core TEN-T ports may be possible. It allows calculating the direct cost, the VOT and the external costs of the different transport modes, unbundled and bundled. This allows examining if bundling is a valid business proposition and how high the potential savings in direct and generalised costs can be. Finally, the cost model also shows the gain in external cost that can be made, which is of interest for the community surrounding the port and being subject to the transit of the hinterland cargo flows.
The gain in external cost can outweigh the gain in generalised cost, but this is of little interest for the shipper and forwarder if not internalized. To motivate the decision maker, a system should be developed to share the external cost savings between society and the shipper. This should be a topic deserving the attention of policy makers. By internalizing external benefits, the lack of modal shift and the limited impact of internalization of external costs could be overcome. Such a system may, indeed, give a new lease on life to the concept of modal shift, which some have qualified as failed so far. Further research should be done to develop the characteristics of such a system in absence of a full internalization of external cost.
Author Contributions
Conceptualization, J.H.; methodology, J.H. and T.V.; validation, T.V. and E.v.H.; formal analysis, J.H.; data curation, J.H.; writing—original draft preparation, J.H.; writing—review and editing, T.V., E.v.H. and E.V.d.V.; supervision, T.V. and E.V.d.V. All authors have read and agreed to the published version of the manuscript.
Funding
This research received no external funding.
Conflicts of Interest
The authors declare no conflict of interest.
References
- Meersman, H.; Van de Voorde, E.; Vanelslander, T. Fighting for Money, Investments and Capacity: Port Governance and Devolution in Belgium. Res. Transp. Econ. 2006, 17, 85–107. [Google Scholar] [CrossRef]
- Olivier, D.; Slack, B. Rethinking the Port. Environ. Plan. A 2006, 38, 1409–1427. [Google Scholar] [CrossRef]
- Levinson, M. The Box: How the Shipping Container Made the World Smaller and The World Economy Bigger; Princeton University Press: Princeton, NJ, USA, 2008; ISBN 978-0-691-13640-0. [Google Scholar]
- Robinson, R. Ports as Elements in Value-Driven Chain Systems: The New Paradigm. Marit. Policy Manag. 2002, 29, 241–255. [Google Scholar] [CrossRef]
- Coppens, F.; Lagneaux, F.; Meersman, H.; Sellekaerts, N.; Van de Voorde, E.; Van Gastel, G.; Vanelslander, T.; Verhetsel, A. Economic Impact of Port Activity: A Disaggregate Analysis: The Case of Antwerp; NBB: Brussels, Belgium, 2007. [Google Scholar]
- Meersman, H.; Van de Voorde, E.; Vanelslander, T. The Industrial Economic Structure of the Port and Maritime Sector: An Attempt at Quantification; Cetena: Palermo, Italy, 2003. [Google Scholar]
- Paardenkooper-Suli, K. The Port of Rotterdam and the Maritime Container: The Rise and Fall of Rotterdam’s Hinterland (1966–2010); Erasmus School of History: Rotterdam, The Netherlands, 2014. [Google Scholar]
- Meersman, H.; Van de Voorde, E.; Vanelslander, T. Zeehavens en Maritiem Transport Cruciale Schakels Voor Logistiek Succes; Steunpunt Goederenstromen: Antwerpen, Belgium, 2007. [Google Scholar]
- The Worldbank. Port Reform Toolkit, 2nd ed.; The Worldbank: Washington, DC, USA, 2007; ISBN 978-0-8213-6607-3. [Google Scholar]
- Wortelboer-Van Donselaar, P.; Kolkman, J. Societal Costs and Benefits of Cooperation between Port Authorities. Marit. Policy Manag. 2010, 37, 271–284. [Google Scholar] [CrossRef]
- Stevens, L.; Sys, C.; Van de Voorde, E.; Vanelslander, T. Port Cooperation: Motives, Forms and Results. In Proceedings of the IAME 2012 Conference, Taipei, Taiwan, 5–8 September 2012. [Google Scholar]
- Hintjens, J. Cooperation between Sea Ports Concerning Hinterland Transport. Ph.D. Thesis, University of Antwerp, Antwerp, Belgium, 2019. [Google Scholar]
- van Hassel, E.; Meersman, H.; Van de Voorde, E.; Vanelslander, T. Impact of Scale Increase of Container Ships on the Generalised Chain Cost. Marit. Policy Manag. 2016, 43, 192–208. [Google Scholar] [CrossRef]
- Guerrero, D.; Laxe, F.G.; Seoane, M.-J.F.; Montes, C.P. A Geographical Analysis of the Relationship between Inland Accessibility and Maritime Transport Supply. Region. Dev. 2015, 41, 33–46. [Google Scholar]
- Blauwens, G.; Van de Voorde, E.; De Baere, P. Transport Economics; De Boeck: Berchem, Belgium, 2016; ISBN 978-90-455-5530-0. [Google Scholar]
- Vigarie, A. Ports de Commerce et vie Littorale; Hachette: Paris, France, 1979; ISBN 2-01-005487-3. [Google Scholar]
- Hintjens, J. A Conceptual Framework for Cooperation in Hinterland Development between Neighbouring Seaport Authorities. Marit. Policy Manag. 2018, 45, 819–836. [Google Scholar] [CrossRef]
- Ben-Akiva, M.; Lerman, S.R. Discrete Choice Analysis: Theory and Application to Travel Demand; MIT Press Series in Transportation Studies: Cambridge, MA, USA, 1985; ISBN 0-262-02217-6. [Google Scholar]
- Niérat, P. Market Area of Rail-Truck Terminals: Pertinence of the Spatial Theory. Transp. Res. Part A Policy Pract. 1997, 31, 109–127. [Google Scholar] [CrossRef]
- Limbourg, S.; Jourquin, B. Market Area of Intermodal Rail-Road Container Terminals Embedded in a Hub-and-Spoke Network. Pap. Reg. Sci. 2010, 89, 135–154. [Google Scholar] [CrossRef]
- European Commission List of Sea Ports in the Core and Comprehensive Networks. Available online: https://ec.europa.eu/transport/sites/transport/files/modes/maritime/ports/doc/2014_list_of_329_ports_june.pdf (accessed on 26 October 2016).
- European Commission Ports 2030 Gateways for the TEN-T Network. Available online: https://ec.europa.eu/transport/infrastructure/tentec/tentec-portal/site/brochures_images/ports2013_brochure_lowres.pdf (accessed on 29 November 2020).
- European Commission. Road Freight Transport Methodology, 2016th ed.; Publications Office: Luxembourg, 2016. [Google Scholar]
- Eurostat Glossary:Standard Goods Classification for Transport Statistics (NST). Available online: http://ec.europa.eu/eurostat/statistics-explained/index.php/Glossary:Standard_goods_classification_for_transport_statistics_(NST) (accessed on 1 May 2017).
- Rashed, Y. Container Throughput Modelling and Forecasting. An Empirical Dynamic Econometric Time Series Approach. Ph.D. Thesis, Universiteit Antwerpen, Antwerp, Belgium, 2016. [Google Scholar]
- van Hassel, E.; Vanelslander, T.; Doll, C. LowCarb RF-European Rail Freight Corridors Going Carbon Neutral; Universiteit Antwerpen, Departement Transport en Ruimtelijke Economie: Antwerp, Belgium, 2018. [Google Scholar]
- Grosso, M. Improving the Competitiveness of Intermodal Transport Applications on European Corridors; Università degli studi di Genova: Genoa, Italy, 2011. [Google Scholar]
- Panteia. Kostencalculaties in Het Beroepsgoederenvervoer over de Weg; Panteia: Zoetermeer, The Netherlands, 2017. [Google Scholar]
- Nea. Factorkosten van Het Goederenvervoer: Een Analyse van de Ontwikkeling in de Tijd; Nea Transportonderzoek en -Opleiding: Rijswijk, The Netherlands, 2004. [Google Scholar]
- World Shipping Council Liner Shipping in the eu Facts. Available online: https://www.worldshipping.org/public-statements/regulatory-comments/european-union (accessed on 29 November 2020).
- Seabury Seabury Ocean Trade Database. Available online: https://www.freightwaves.com/news/seabury-launches-ocean-database (accessed on 29 November 2020).
- Eurostat NUTS Distances. Available online: http://ec.europa.eu/eurostat/tercet/flatfiles.do (accessed on 14 March 2016).
- Regulation (EC) No 561/2006 of the European Parliament and of the Council; European Parliament: Brussels, Belgium, 2006; pp. 183–186.
- Wiegmans, B.; Behdani, B. A Review and Analysis of the Investment in, and Cost Structure of, Intermodal Rail Terminals. Transp. Rev. 2018, 38, 33–51. [Google Scholar] [CrossRef]
- Gibson, G.; Korzhenevych, A.; Bröcker, J. Update of the Handbook on External Costs of Transport; Ricardo AEA: Harwell, UK, 2014. [Google Scholar]
- Mostert, M.; Limbourg, S. External Costs as Competitiveness Factors for Freight Transport—A State of the Art. Transp. Rev. 2016, 36, 692–712. [Google Scholar] [CrossRef]
Figure 1.
Cooperation opportunities in the port triptych. Source: Hintjens (2019).

Figure 2.
Increased consumer surplus through hinterland bundling. Source: Hintjens (2019).

Figure 3.
Intermodal transport market area. Source: Niérat (1997).

Figure 4.
104 core TEN-T ports. Source: Hintjens (2018).

Figure 5.
Handling costs in an intermodal rail terminal. Source: Wiegmans and Behdani (2018).

Figure 6.
Summary of external cost characteristics studied in the literature. Source: Mostert and Limbourg (2016).
Figure 6.
Summary of external cost characteristics studied in the literature. Source: Mostert and Limbourg (2016).


Table 1.
Cargo types.
| 0. | Liquid bulk goods |
| 1 | Solid bulk goods |
| 2 | Large freight containers |
| 3 | Other freight containers |
| 4 | Palletized |
| 5 | Pre-slung |
| 6 | Mobile self-propelled units |
| 7 | Other mobile units |
| 8 | (Reserved) |
| 9 | Other cargo types |
Source: Eurostat (2017).
Table 2.
Actualised transport costs.
| Panteia | Van Hassel, 2018 | Van Hassel, 2016 | Blauwens | Grosso | NEA | Conclusion | ||
|---|---|---|---|---|---|---|---|---|
| Year of data | 2017 | 2015 | 2015 | 2011 | 2010 | 2002 | 2018 | |
| Actualised cost data | 2018 | |||||||
| Annual cost inflation | 2% | |||||||
| # years | 1 | 3 | 3 | 7 | 8 | 16 | ||
| Parameter | Unit | |||||||
| Distance road | €/km | 0.42 | 0.88 | 0.68 | 0.57 | 0.52 | 0.38 | 0.60 |
| Time road | €/h | 43.07 | 37.57 | 44.35 | 33.61 | 46.54 | 50.16 | 43 |
| Distance rail | €/km | - | 5.83 | 5.83 | - | 7.85 | 6.25 | 6 |
| Time rail | €/h | - | 2326.17 | 1273.45 | - | 246.63 | 1031.65 | 1000 |
| Fixed cost rail | € | - | 2069.36 | 981.17 | - | - | - | 1000 |
| Distance inland waterway (IWW) | €/km | - | 12.79 | - | 6.64 | 7.86 | 7.19 | 9 |
| Time IWW | €/km | - | 305.15 | 464.99 | 170.66 | 149.39 | 228.16 | 265 |
| Transshipment | €/TEU | - | 42.45 | 42.45 | - | 58.58 | - | 50 |
Source: Hintjens (2019), based on cited sources.
Table 3.
Time parameters.
| Panteia | Van Hassel, 2018 | Van Hassel, 2016 | Blauwens | Grosso | NEA | Conclusion | ||
|---|---|---|---|---|---|---|---|---|
| Year of data | 2017 | 2015 | 2015 | 2011 | 2010 | 2002 | 2018 | |
| Parameter | Unit | |||||||
| Speed road | km/h | 80 | 80 | 65 | 69 | 52 | 70 | |
| Max. driving time | h | 4.5 | 4.5 | 9 | ||||
| Rest time | h | 0.75 | 1 | |||||
| Max. daily time | h/24h | 9 | 9 | 5 | ||||
| Speed rail | km/h | 50 | 50 | 55 | 41.6 | 55 | ||
| Speed IWW | km/h | 10.5 | 9.22 | 10 | ||||
| Waiting time road | h | 1 | 1 | |||||
| Handling time road | h | 0.5 | 0 | |||||
| Waiting time rail | h | 20 | 20 | |||||
| Handling time rail | h | 20 | 20 | |||||
| Waiting time IWW | h | 7 | 7 | |||||
| Handling time IWW | h | 2.5 | 3 |
Source: Hintjens (2019), based on cited sources.
Table 4.
Summary of costs.
| Title | Unit | HGV | Electric Freight Train | Barge 1000–3000 Tonnes | All |
|---|---|---|---|---|---|
| Distance costs | €/km | 0.6 | 6 | 8.6 | |
| Time costs | €/h | 43 | 1000 | 265 | |
| Fixed costs | €/trip | 0 | 1000 | 0 | |
| Cargo value | €/TEU | 35,800 | |||
| Financing cost | %/year | 2.5 | |||
| Depreciation of cargo | %/year | 25 | |||
| VOT | €/day | 27 | |||
| Transshipment | €/TEU | 50 |
Table 5.
Sources of external costs with their values (actualised for 2018).
| External Costs | Unit | HGV | Electric Freight Train | Barge 1000–3000 tonnes |
|---|---|---|---|---|
| Congestion | €ct/vkm | 45.46 | 0 | 0 |
| Accidents | €ct/vkm | 1.4 | 0 | 0 |
| Noise | €ct/vkm | 0.71 | 11.7 | 0 |
| Air pollution | €ct/vkm | 2.3 | 49.4 | 647 |
| Climate change | €ct/vkm | 6.44 | 0 | 404 |
| Other | €ct/vkm | 2.8 | 212 | 0.94 |
| Wear and tear | €ct/vkm | 2.6 | 0 | 0 |
| Total external costs | €ct/vkm | 61.71 | 273.1 | 1051.94 |
Source: Gibson et al. (2014).
Table 6.
Annual road freight data in tonnes (2016).
| Zeebruges | Dunkirk | Bundled | ||
|---|---|---|---|---|
| BE22 | Prov.Limburg (BE) | 51,413 | 24,631 | 76,044 |
| BE24 | Prov.Vlaams-Brabant | 65,996 | 112,953 | 178,949 |
| BE31 | Prov.BrabantWallon | 28,976 | 68,375 | 97,351 |
| DEA1 | Düsseldorf | 109,674 | 115,875 | 225,549 |
| DEA2 | Köln | 94,457 | 39,496 | 133,953 |
| DEE0 | Sachsen-Anhalt | 15,507 | 63,937 | 79,445 |
| FR25 | Basse-Normandie | 6206 | 126,231 | 132,437 |
| FR26 | Bourgogne | 27,269 | 92,212 | 119,481 |
| FR53 | Poitou-Charentes | 37,505 | 166,981 | 204,486 |
| FR61 | Aquitaine | 2005 | 149,748 | 151,753 |
| NL33 | Zuid-Holland | 73,830 | 76,551 | 150,381 |
| NL41 | Noord-Brabant | 81,648 | 138,687 | 220,335 |
Table 7.
Distances.
| Distance in km | DEA1 Dusseldorf | FR301 | |
|---|---|---|---|
| Zeebruges | BE251 | 287 | 80 |
| Dunkirk | FR301 | 313 |
Source: [32].
Table 8.
Costs for unimodal road transport.
| All Road (Import) towards DEA1 (Düsseldorf) | ||||||||||
|---|---|---|---|---|---|---|---|---|---|---|
| Distance (km) | Driving Time (H) | Volume (Tonnes) | Volume (TEU) | Trucks (Number) | Truck-km | Truck-hours | Direct Cost | VOT | External Cost | |
| Zeebruges | 287 | 4.42 | 109.674 | 9.970 | 4.985 | 1.430.747 | 29.489 | 2.126.487 | 66.277 | 882.914 |
| Dunkirk | 313 | 4.82 | 115.875 | 10.534 | 5.267 | 1.648.585 | 38.530 | 2.645.961 | 86.597 | 1.017.342 |
| Total | 225.549 | 20.504 | 10.252 | 3.079.332 | 68.020 | 4.772.448 | 152.874 | 1.900.256 | ||
| Unit values for road transport | ||||||||||
| Truck speed | km/h | 65 | ||||||||
| Truck waiting time | hour/truck | 1.5 | ||||||||
| Truck direct cost (distance) | €/km | 0.6 | ||||||||
| Truck direct cost (time) | €/h | 43 | ||||||||
| Truck external cost | €ct/km | 61.71 | ||||||||
| VOT | €/TEU-hour | 1.12 | ||||||||
Table 9.
Costs for multimodal road/rail transport.
| Mulimodal Road/Rail (Import) towards DEA1 (Düsseldorf) | ||||||||||
|---|---|---|---|---|---|---|---|---|---|---|
| First Leg (Road) | Distance (km) | Driving Time (H) | Volume (Tonnes) | Volume (TEU) | Trucks (Number) | Truck-km | Truck-hours | Direct Cost | VOT | External Cost |
| Dunkirk | 80 | 1.23 | 115.875 | 10.534 | 5.267 | 421.364 | 14.383 | 871.291 | 32.326 | 260.024 |
| Total (first leg) | 115.875 | 10.534 | 5.267 | 421.364 | 14.383 | 871.291 | 32.326 | 260.024 | ||
| Second leg (rail) | Distance (km) | Driving Time (H) | Volume (tonnes) | Volume (TEU) | Trains (number) | Train.km | Train.hours | Direct cost | VOT | External cost |
| Zeebruges | 287 | 5.22 | 225.549 | 20.504 | 320 | 91.950 | 1.992 | 2.543.892 | 581.074 | 251.115 |
| Grand total | 3.415.183 | 613.400 | 511.138 | |||||||
| Bundling Effect | 1.357.265 | −460.526 | 1.389.118 | |||||||
| Unit values for rail transport | ||||||||||
| Train speed | km/h | 55 | ||||||||
| Train waiting time | hour/train | 20 | ||||||||
| Train direct cost (distance) | €/km | 6 | ||||||||
| Train direct cost (time) | €/h | 1000 | ||||||||
| Train external cost | €ct/km | 273.1 | ||||||||
| Transshipment cost | €/TEU | 50 | ||||||||
Table 10.
Recapitulation of case-relevant costs (in euros).
| Direct Cost (a) | VOT (b) | Generalised Cost (a) + (b) | External Cost (c) | Total Cost (a) + (b) + (c) | |
|---|---|---|---|---|---|
| Road only | 4,772,448 | 152,874 | 1,900,256 | 4,925,322 | 6,825,578 |
| Multimodal rail | 3,415,183 | 613,400 | 4,028,583 | 511,138 | 4,539,721 |
| Effect of rail bundling | 1,357,265 | −460,526 | 896,739 | 1,389,118 | 2,285,857 |
Publisher’s Note: MDPI stays neutral with regard to jurisdictional claims in published maps and institutional affiliations. |
© 2020 by the authors. Licensee MDPI, Basel, Switzerland. This article is an open access article distributed under the terms and conditions of the Creative Commons Attribution (CC BY) license (http://creativecommons.org/licenses/by/4.0/).
Share and Cite
MDPI and ACS Style
Hintjens, J.; van Hassel, E.; Vanelslander, T.; Van de Voorde, E. Port Cooperation and Bundling: A Way to Reduce the External Costs of Hinterland Transport. Sustainability 2020, 12, 9983. https://0-doi-org.brum.beds.ac.uk/10.3390/su12239983
AMA Style
Hintjens J, van Hassel E, Vanelslander T, Van de Voorde E. Port Cooperation and Bundling: A Way to Reduce the External Costs of Hinterland Transport. Sustainability. 2020; 12(23):9983. https://0-doi-org.brum.beds.ac.uk/10.3390/su12239983
Chicago/Turabian StyleHintjens, Joost, Edwin van Hassel, Thierry Vanelslander, and Eddy Van de Voorde. 2020. "Port Cooperation and Bundling: A Way to Reduce the External Costs of Hinterland Transport" Sustainability 12, no. 23: 9983. https://0-doi-org.brum.beds.ac.uk/10.3390/su12239983
Note that from the first issue of 2016, this journal uses article numbers instead of page numbers. See further details here.