Article

The Optimized N, P, and K Fertilization for Bermudagrass Integrated Turf Performance during the Establishment and Its Importance for the Sustainable Management of Urban Green Spaces

1
College of Landscape Architecture, Sichuan Agricultural University, Chengdu 611130, Sichuan, China
2
College of Horticulture, China Agricultural University, Beijing 100083, China
3
College of Management, Sichuan Agricultural University, Chengdu 611130, Sichuan, China
4
Department of Horticulture Science, Shiraz Branch, Islamic Azad University, Shiraz 71987-74731, Iran
5
College of Horticulture, Sichuan Agricultural University, Chengdu 611130, Sichuan, China
6
College of Horticulture and Forestry, Huazhong Agricultural University, Wuhan 430070, Hubei, China
7
Southwest Engineering Technology and Research Center of Landscape Architecture (State Forestry Administration), Southwest Forestry University, Kunming 650224, Yunnan, China
8
College of Forestry, Sichuan Agricultural University, Chengdu 611130, Sichuan, China
*
Authors to whom correspondence should be addressed.
Sustainability 2020, 12(24), 10294; https://0-doi-org.brum.beds.ac.uk/10.3390/su122410294
Submission received: 5 November 2020 / Revised: 25 November 2020 / Accepted: 2 December 2020 / Published: 9 December 2020

Abstract

:
Bermudagrass (Cynodon dactylon (L.) Pers) turf is the most widely used turfgrass in urban landscapes. Large amounts of fertilizer are usually applied for maximum turf performance, while relatively little attention has been paid to efficient nutrient management of bermudagrass turf. The design opted for was a 3-factor and 5-level Central Composite Rotatable Design (CCRD) consisting of 24 experimental runs in the greenhouse with response surface methodology (RSM) and simulated regression modeling. The experiment covered in this study was carried out at Sichuan Agricultural University with the objectives of understanding the interactive effects of nitrogen, (N), phosphorus (P), and potassium (K) fertilization on the bermudagrass integrated turf performance (ITP) and optimizing the amount of N, P, and K required for optimum turf performance during establishment. The qualitative and quantitative relationships between bermudagrass and fertilization significantly affected the ITP. The N, P, and K Fertilization significantly influenced the percent grass cover, turf height, shoot dry weight, root dry weight, and total chlorophyll content. Fertilization with N and P significantly enhanced the tiller length, turf density, color, and total protein levels. Root length was augmented with the application of P and K. We found that 3-D surface plots indicated significant interactive effects of NP, NK, and PK on the ITP. A simulation optimization and frequency analysis indicated that the optimal combined amounts of these nutrients were N: 26.0–27.6 g m−2, P: 24.2–26.4 g m−2, and K: 3.1–5.0 g m−2 during the establishment phase. The results suggest that optimized fertilization is key to sustainable nutrient management of bermudagrass integrated turf performance.

1. Introduction

Urban agriculture can be described as “an industry within or around a city, town or metropolis, that processes, grows/raises, or distributes a variety of food and non-food products, largely (re-)using material and human resources, services and products in that area, and in turn providing human and material resources, products and services to that area” [1,2]. Urban agriculture provides not only food security but also offers social value, aesthetics, and environmental benefits [3,4]. Urban green spaces (public parks, community gardens, walking trails, golf courses, and other open spaces for recreation) have increased globally during the last decade. Turfgrass is an inevitable part of urban agriculture and landscapes because turfgrass plays a pivotal role in the beautification of lawns, gardens, parks, golf courses, and playing surfaces, and also provides recreation. Thus, turfgrass contributes substantially to the well-being of urban dwellers [5,6]. Turfgrass has several other ecological benefits, such as regulating microclimates, air cleansing, and carbon sequestration [5,7]. Additionally, turfgrasses provide bioenergy, food for livestock, fiber products, wildlife habitat, and contribute to both soil and water conservation [8]. However, all of these benefits depend on appropriate management practices.
Macronutrients, especially N, P, and K, are involved in many biological processes and are key nutrients required for plant growth and function [9,10,11]. Hybrid bermudagrasses are highly dependent on nutrient applications [12]. Proper nutrient management of turfgrass is a crucial aspect of turf management as mineral nutrition greatly influences the performance and physiology of turfgrass. Among N, P, and K, N is the most vital macronutrient for turfgrasses [13]. The application of N promotes growth, density, and color in bermudagrass and is often the most limiting nutrient for turfgrass growth and development [14,15,16]. Administering sustainable and optimal supplies of N to promote maximum performance while simultaneously overcoming environmental pollution is a challenge. Over application of N promotes excessive shoot growth and attenuates the development of stolons and roots in bermudagrass turf [17]. Reduced levels of nitrogen lead to decreases in leaf area, chlorophyll content, photosynthesis, and biomass production [18].
P is a vital macronutrient required for energy storage and transfer, cell division, and tissue development in plants including turfgrasses [19,20]. Bermudagrass is often established on high sand content soils that are usually deficient in P, due to relatively low immobility and little root development during establishment [12,21]. Indeed, Fry et al. [22] observed significant P effects on turfgrass quality. Shorter internodes and discolored leaf blades in bermudagrass were observed during P deficiency [17].
K is a major cation in plant cells. Thus, K activates several enzymes and is required by numerous metabolic processes. K deficiency causes large reductions in the growth and productivity of turfgrasses [20]. K is also among the major nutrients that are needed in relatively high amounts for optimal bermudagrass growth and quality [23]. K was also reported to increase the tolerance of turfgrass to cold [24], drought, heat, wear, and disease [25].
Modern turfgrass management requires extremely fine-tuning of N, P, and K fertilization. Turf fertility programs need to drive optimal performance and quality while maintaining environmental and agricultural sustainability. Over-fertilization will increase ecological concerns and management costs while reducing nutrient-use-efficiencies. The goal of turf managers and environmental scientists is to reduce nutrient loss and to increase crop utilization. The best approach for achieving this goal is to optimize fertilization management practices to ensure the development of high-quality turf with reduced amounts of fertilization. Thus, it is a critical need to understand the quantitative relationship between fertilization and turf quality. Indeed, an evaluation of the influence of nutrient management on the morpho-physiological traits and turf quality performance of bermudagrass is essential for properly utilizing bermudagrass in the urban environment.
Nutrient management strategies play a critical role in the attainment of environmental and ecological sustainability while ensuring increased agricultural productivity and performance [26,27]. A major concern is the over-fertilization, which causes harmful ecological and environmental consequences and endangers soil fertility and quality, crop production, and performance. Over-fertilization of inorganic fertilizers (NPK) and their low uptake efficiencies have serious agricultural and environmental concerns, especially N fertilizers that cause ammonia (NH3) volatilization, nitrate (NO−3) and nitrite (NO−2) leaching, nitrification (N2), dissolved organic nitrogen, and nitric oxide emissions [28]. Therefore, developing sustainable nutrient management schemes that can achieve environmental and ecological sustainability is of prime importance. This will require modern nutrient management strategies, for example, nutrient optimization. Such precision nutrient management schemes will lead to sustainable nutrient management that improves nutrient-use efficiencies, provides higher yields/performance, as well as increasing environmental and ecological sustainability [29,30].
Bermudagrass (Cynodon dactylon (L.) Pers) provides a high-quality turf and is the most extensively used warm-season turfgrass on athletic fields, lawns, parks, and urban landscapes due to its high tolerance (heat and drought) and quick recovery [24]. Nutrient management of bermudagrass is indispensable. Indeed, nutrient deficiencies cause growth cessation [31]. Previous studies were limited to one or two nutrients [13,32], and to date, few studies have focused on the combined effects of NPK fertilization on turfgrasses [20]. To the best of our knowledge, no one has documented the qualitative and quantitative relationships between bermudagrass turf performance and NPK fertilization. Moreover, the assessment of interaction and optimization of all the three nutrients on bermudagrass ITP was not previously reported. Therefore, the current study aimed to determine the interactive effects of N, P, and K on morpho-physiological and ITP of bermudagrass ‘Tifway’ during the establishment phase and develop a model equation for the prediction of optimum N, P, and K combination that provides the highest ITP.

2. Materials and Methods

2.1. Study Location and Growth Conditions

A greenhouse experiment was carried out at the landscape plants nursery (103°51′ E–30°42′ N) of Sichuan Agriculture University Wenjiang, Chengdu, China. Bermudagrass plugs were planted in the greenhouse under natural sunlight conditions from May 2019 to August 2019. The average temperature in the greenhouse varied between 35 ± 3 °C during the day and 18 ± 3 °C during the night. The daily maximum photosynthetically active radiation (PAR) levels varied from 900 to 1550 μmol m−2 s−1.

2.2. Crop Husbandry and Management

One-square-inch plugs of hybrid bermudagrass (Cynodon dactylon L. × C. transvaelensis Burtt-Davy) cv. ‘Tifway419’ were obtained from a golf course. The plugs were planted in square containers at the distance of five to six inches between rows and columns, and five inches from the edges. The containers were 1 × 1 × 0.3 m wide, long, and high, respectively, that contained a 1:2; v:v sand and soil. A total of 24 containers were arranged according to the experimental design. The pH of the soil was 6.6, with an organic matter content of 20.10 g kg−1, total N, P, and K contents of 1.49, 0.59 and 4.88 g kg−1, respectively, and available N, P, and K contents of 89.96, 26.66, and 103.34 mg kg−1, respectively.
The plugs were planted in the second week of May, and the experiment lasted for 16 weeks. Containers were hand irrigated immediately after plugging, twice daily in the first week and once daily in the second week, thereafter as needed to maintain high-quality turf. Three weeks after plugging, the fertilization treatments were applied at once. Before treatment application, the grass was clipped to a height of 1.2 cm, and clippings were removed. The N, P, and K (g m−2) combinations applied to bermudagrass are shown in Table 1. N was applied as urea (46.6%), P as super-phosphate (15% ≈ P2O5), and K as potassium sulfate (50% ≈ K2O).

2.3. Experimental Design for Statistical Analysis and Optimization

The experiment was carried out using the methodology of CCRD. The design was set up with 3 factors, i.e., N, P, and K, and 5 levels (0, 6.082, 15, 23.918, and 30) for each factor. The CCRD evaluated the combined effects of N, P, and K on morpho-physiological traits of bermudagrass and their interaction on ITP. The optimum rates of N, P, and K were obtained using the optimization process of the design combined with response surface methodology and frequency analysis.
This design (CCRD) is best for the assessment of numerous treatment factors and levels when a full factorial design is not feasible [33,34]. In comparison with other designs (e.g., complete designs), CCRD avoids the co-relationship of regression coefficients between factors and the effect of non-experimental factors on regression equations, in which the CCRD enhances the fitting rate of the regression equation and more accurately predicts the effects of independent factors on a dependent factor [22]. This design is widely used in agriculture and turfgrass research [20,34,35].
The following Equation (1) was used to code independent variable levels and ranges (Table 2) according to the design of the experiment [33]:
Xi = xi − xi0/∆xi
In Equation (1), Xi = ith variable coded value, xi = ith variable real value, xi0 = ith variable real value at the center point, and ∆xi = step change value.
The actual amount of fertilizer was set to low (0 g m−2), medium low (6.082 g m−2), medium (15 g m−2), medium high (23.918 g m−2), and high (30 g m−2). In CCRD, a complete 2k factorial (Equation (2)) is used to determine the number of total experimental units.
T = 2k + 2k + m0
In Equation (2), T, k, and m0 = the numbers of; experimental units, factors, and replicates of the center point, respectively.
To increase accuracy, the center point must be replicated more than five times [33]. In this experiment, we replicated the center point treatment up to nine times, including one control treatment (total number of units; 23 + 2 × 3 + 9 + 1 = 24). According to Montgomery [33], the treatments other than the center point do not need to be replicated.
The experimental data obtained, including ITP, were fitted to the following second-order polynomial model (presented as an Equation)
Y = a0 + a1x1 + a2x2 + a3x3+ a4x1x2 + a5x1x3 + a6x2x3 + a7x12 + a8x22 + a9x32
In Equation (3), Y = the response variable; a0 = the constant coefficient; a1, a2, and a3 = linear coefficients; a4, a5, and a6 = interaction coefficients; a7, a8, and a9 = quadratic coefficients; x1, x2, x3 = codes for experiment variables.
The Equation (3) was used to perform a linear regression equation for each variable. SPSS (16.0) was used to determine the regression coefficients of individual linear, quadratic, and interaction terms. The significance level of linear and quadratic terms was checked by using the F-test at P < 0.05. The coefficient of determination (R2) was used to evaluate the adequacy of regression equations. For modeling and statistical analysis, SPSS and Microsoft-Excel 2016 were used. Three-dimensional surface plots were generated using Sigma plot (8.0).

2.4. Sampling and Measurements

2.4.1. Morphological Parameters

Percent grass cover was measured four times weekly using the method of line-intersection [20], one week after fertilization. Two weeks after fertilization, we started analyzing turf height, tiller length, turf density, shoot dry weight, root length, and dry weight. Turf height (cm) and tiller length (cm) describe the growth and establishment speed of a turfgrass. Turf height (cm) was measured with the help of a ruler from the ground surface to the tip of vertical tillers, with a total of five times on five randomly selected tillers every week and averaged. Tiller length (cm) was also measured with the help of a ruler on horizontally spreading tillers along the soil surface on five randomly selected tillers with a total of five times on a weekly basis and average is taken. Turf density was calculated on randomly selected five tillers weekly for a total of five times, and average leaf counts per tiller were determined. For shoot dry weight, a 10 cm2 (square decimeter, dm2) grid was constructed and randomly tossed on the turf surface on the sixth, eighth and tenth week after fertilization. The shoots within the grid were collected and oven-dried at 80 °C for 48 h, and average dry weights were determined in grams per square decimeters. Ten-centimeter diameter bermudagrass plugs were taken three times to the depth of 20 cm at the conclusion of the experiment (i.e., twelve weeks after fertilization). Roots were gently separated by removing soil with the help of tap water, and average root lengths (cm) were measured. A similar technique was followed for determining root dry weight (g). In addition, root samples were dried in oven at 80 °C for 48 h before they were weighed.

2.4.2. Relative Greenness (SPAD index), Total protein, and Total Chlorophyll Content (TCC)

Relative greenness was determined using a chlorophyll meter ‘SPAD-502’ (Spectrum Technologies, Inc., Aurora, IL, USA) on a biweekly basis for a total of five times, which started four weeks after fertilization. The fresh bermudagrass leaves were collected and subsequently frozen at −80 °C for 11 weeks after fertilizer application for determination of total chlorophyll and protein content. Total protein and chlorophyll contents were spectrophotometrically measured. For total protein, a commercial assay kit (A045-2) from Nanjing Jiancheng Bioengineering Institute, China was followed, while for TCC a half gram of leaf material was cut into pieces, immersed in 80% acetone, and put on a shaker at dark until the green color turned into yellow. The extract was filtered and measured at 645 and 663 nm and calculated using the formula:
mg Chl/g f.w. = [20.2(OD 645 nm) + 8.02 (OD 663 nm)] × V/(f.w. × 1000)
where: f.w. is tissue fresh weight (g) and V is the volume (mL) of the final solution.

3. Results

3.1. Effects of Nitrogen, Phosphorus, and Potassium Fertilization on Percent Grass Cover and Other Morphological Attributes

For percent grass cover, N (a1), P (a2), and K (a3) coefficients were all positive (Table 4), which indicates increasing effects for all three nutrients. The value of a1 was higher in magnitude than a2, followed by a3. These results indicate that N was highly efficient followed by P, and that K had a relatively minor effect. We observed the highest cover (81.75%) in the center point treatment (T20) and the lowest cover (41.50%) in the control treatment (T24) (Table 3). The positive values of the regression model for a1, a2, and a3 illustrate the increasing effect of all the three factors on bermudagrass turf height. The magnitude of a1 was nearly five times greater than a2 and a3, respectively (Table 4). The highest turf height (15.30 cm) was recorded when N, P, and K were applied at medium-high levels (T1). The lowest turf height, 5.30 cm (Table 3), was detected in the control condition.
During the study, the coefficients of regression model a1 and a2 were positive for the tiller length. Conversely, the model showed a negative value for a3 (Table 4). The highest tiller length (28.50 cm) was achieved when N and P were applied at medium-high levels, and K was applied at a medium-low level (T2). The lowest tiller length (9.80 cm) was found in the control treatment (Table 3). Though the N and P increased turf density, K did not affect turf density. The magnitude of a1 was around 8-fold greater than a2, demonstrating a higher effect of N than P (Table 4). The highest turf density was attained when medium-high amounts of N and P and medium-low amounts of K were applied (T2). The lowest turf density was evident in the control condition (Table 3).
The coefficients of the regression model (i.e., a1, a2, and a3) for shoot dry weight were all positive. Absolute values followed the order a1 > a2 > a3. The relative magnitude of a3 was approximately 22-fold smaller than a1 and a2 (Table 4). The highest shoot dry weight values were obtained when medium-high amounts of N and P and medium-low amounts of K were applied (T2). The lowest shoot dry weight values were observed when no fertilizer was applied (Table 3). The a1 and a2 coefficients were positive for turf relative greenness where a1 > a2, while negative value was recorded for a3. The numerical values (Table 4) represented that a1 was 59 times greater than a2. Thus, we observed the strongest effect of N on turf relative greenness (Table 4). This effect is also noticeable in Table 3, in that the highest turf relative greenness was observed in high N and medium P and K (T9). The lowest turf relative greenness was observed when no nutrients were applied (Table 3).

3.2. Effects of Nitrogen, Phosphorus, and Potassium Fertilization on Total Chlorophyll and Total Protein

We observed that the TCC of bermudagrass was positively affected by all three nutrients. The relative order of the absolute values of the parameter coefficients was a1 > a3 > a2. We observed the maximum chlorophyll content of 1.41 (mg g−1 fresh weight) in the high N and medium P and K treated bermudagrass (T9). We observed the minimum chlorophyll content of 0.47 (mg g−1 fresh weight) when no nutrients were applied (Table 3).
Regression coefficients indicated that total protein content was augmented by a1 and a2 and that a3 had no effect. The absolute values indicated that a1 had the most significant impact on enhancing total protein levels (Table 4). The highest concentration of total protein (3.15 g L−1) was observed in medium high (N and P) and medium low (K) conditions (T2). The lowest concentration of total protein (0.29 g L−1) was observed when no nutrients were applied (Table 3).

3.3. N, P, and K Effects on Bermudagrass ITP

The collected parameters data were transformed with the following equation according to the CCRD (Table 5):
X = x − xmin/xmax − xmin.
In Equation (5), for each parameter, X = coded value, x = measured value, xmin = minimum, and xmax = maximum value.
The ITP of bermudagrass was estimated by taking the average of converted values of all parameters in Table 5. Y (Table 5) represents the ITP of bermudagrass. The best ITP value (0.67) was observed in the medium high (N, P) and medium low (K) condition (T2), followed by an ITP value of 0.56 in the medium high (N) and medium low (P, K) condition (T4) and medium high (NPK) condition (T1). The worst ITP value (0.31) was observed in the low (N) and medium (P, K) (T9) conditions followed by an ITP of 0.33 in the medium low (NPK) condition (T8). These results demonstrate that the fertilizer containing N considerably influence bermudagrass turf performance.

3.4. Model Establishment for ITP

The ITP for 3-factor, 5-level CCRD given in Table 5, was fit to a second-order polynomial model (Equation (3)) using regression analysis, and the following (Equation (6)) quadratic regression model was obtained.
Y = 0.493 + 0.08x1 + 0.022x2 + 0.005x3 − 0.001x1x2 − 0.026x1x3 − 0.024x2x3 − 0.023x12 − 0.005x22 − 0.004x32
here, Y = bermudagrass ITP, x1, x2, x1x3, x2x3, and x12 = high significance level.
The R2 (coefficient of determination) value (0.91) of the regression Equation (6) was significant with p ≤ 0.001. The high value of R2 provides strong evidence that the model is highly significant and precisely predicted bermudagrass ITP, which means that the model explained (approx.) 91% of the variations in the responses. A highly significant regression model is indicated by the lower ‘P’ (probability) value [36].

3.5. N, P, and K Interaction on Bermudagrass ITP

For the investigation of interaction among three variables in CCRD, three-dimensional surface plots were developed using a full second-order model by setting the third variable of Equation (6) to zero. The x and y-axis show two factors interaction with ITP at the z-axis (Figure 1, Figure 2 and Figure 3).

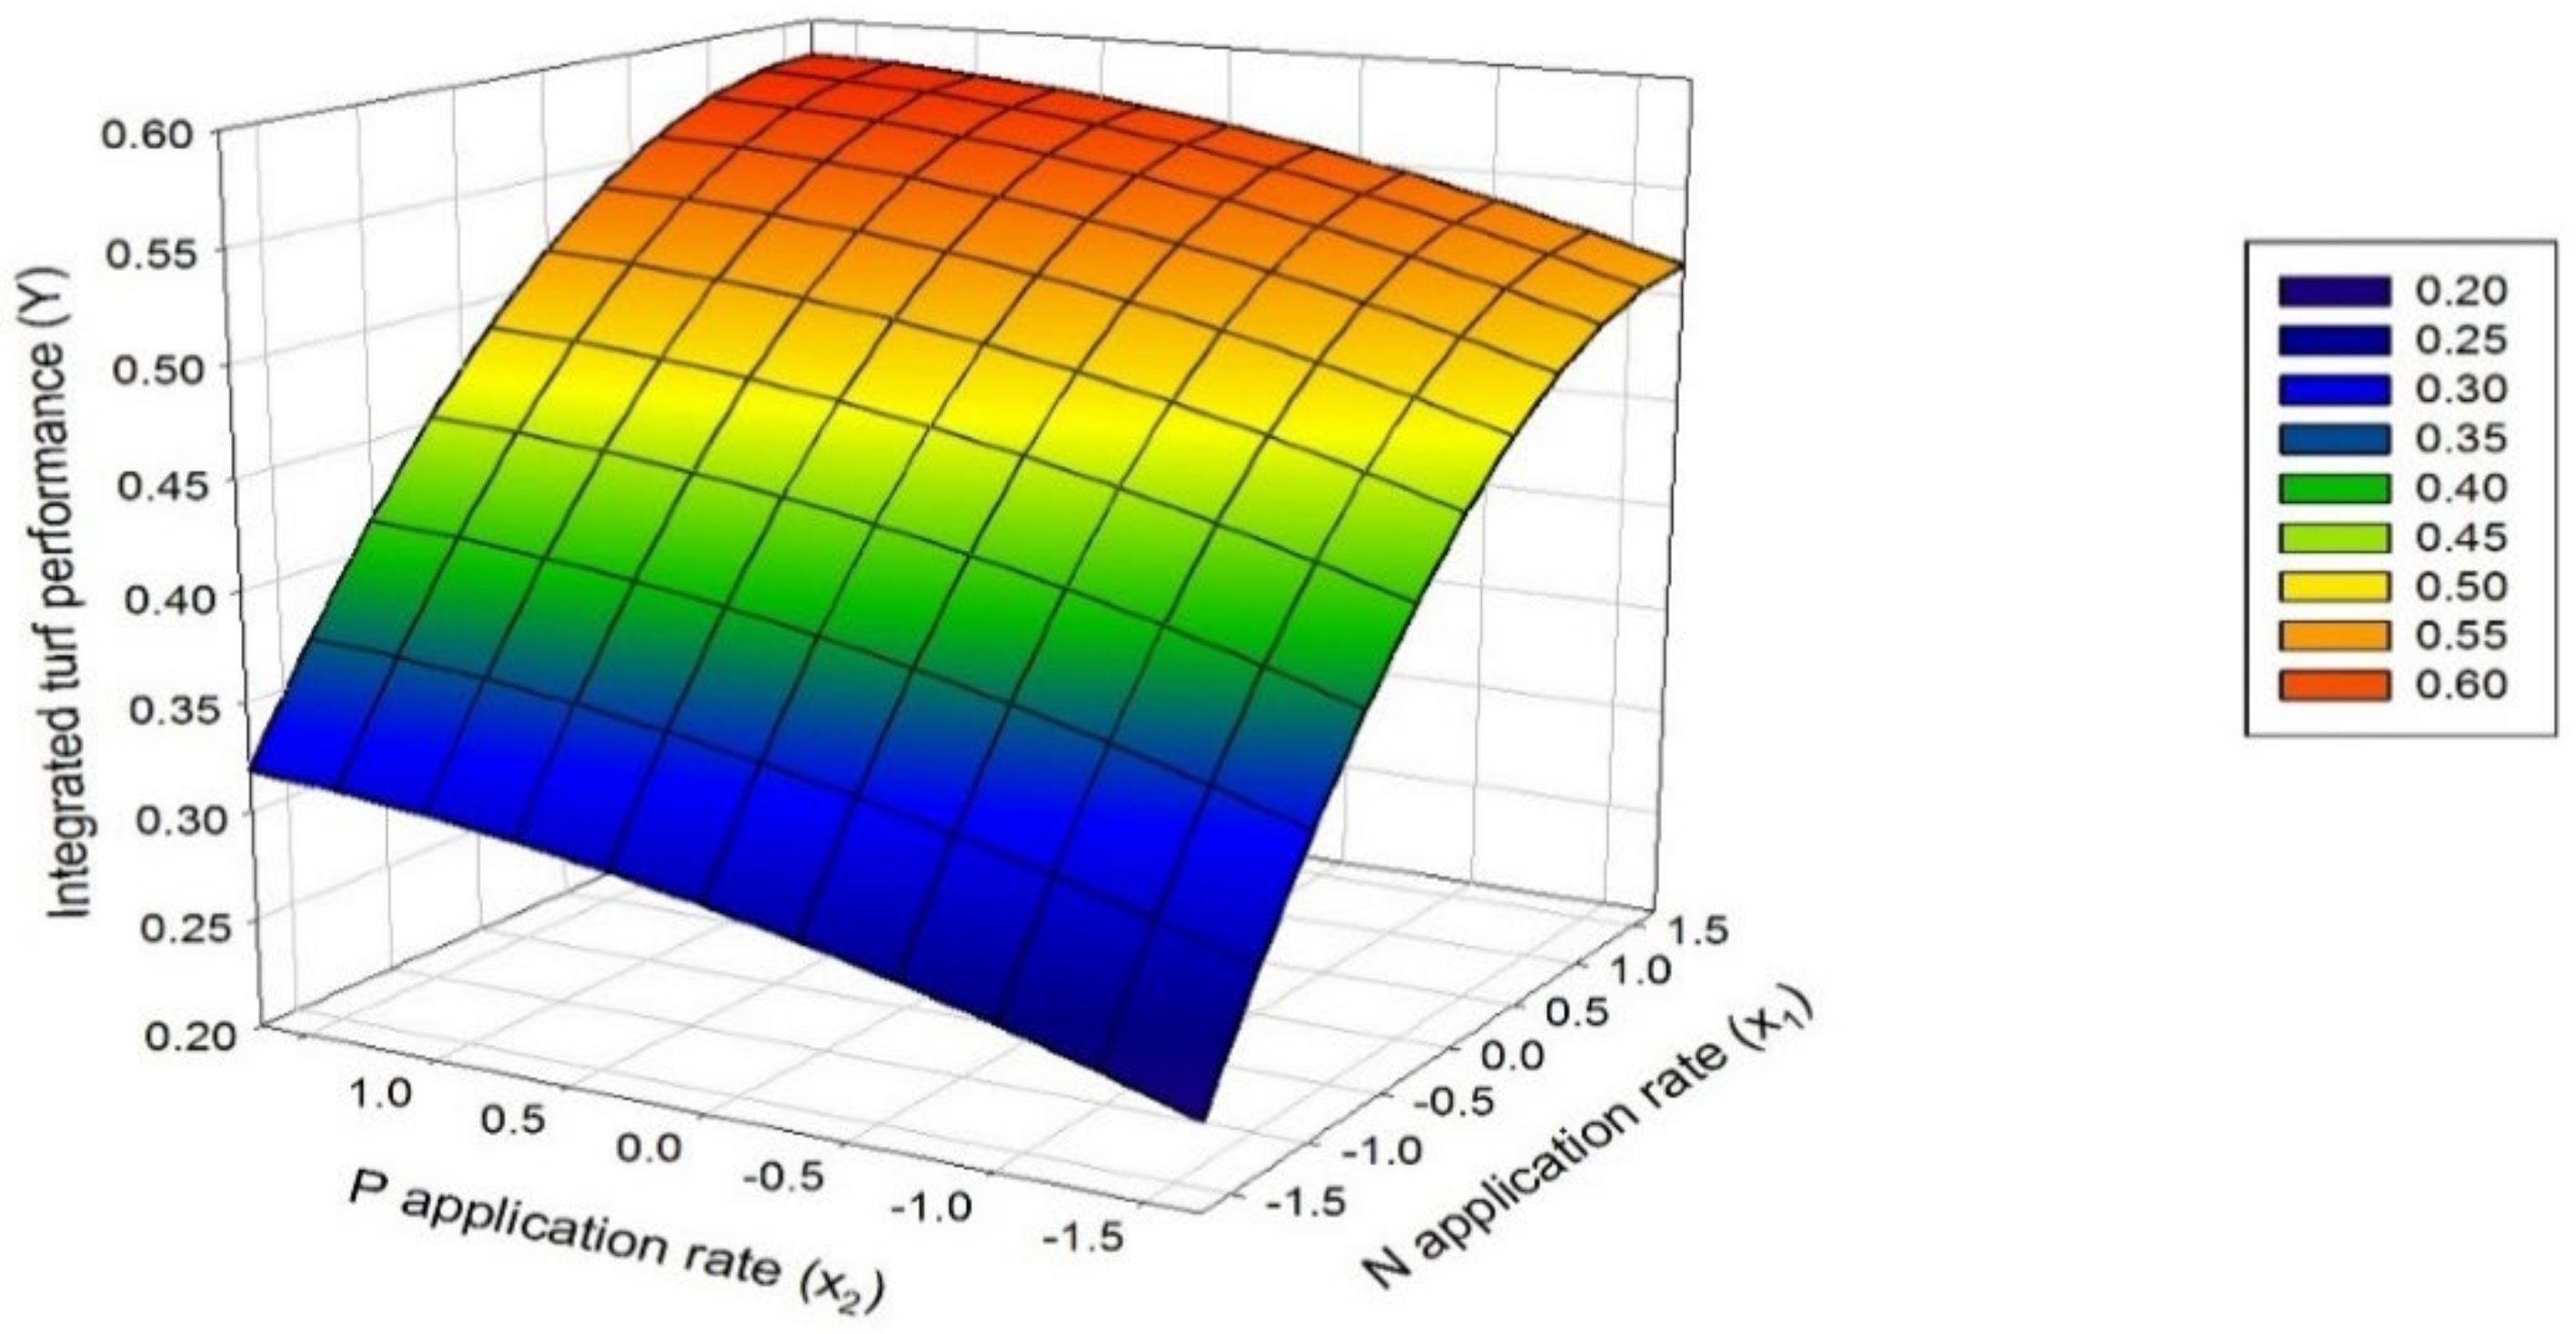
3.5.1. Interaction Between N (x1) and P (x2)

The effect of N and P on the ITP (Figure 1) showed the best response (i.e., ITP rapidly reaching a maximum) when larger amounts were applied. The effect of N was more evident when either lower or higher doses of P were used. In contrast, increasing the amounts of P that were applied when lower quantities of N were used did not distinctly increase the ITP. However, when the amount of N was increased with simultaneous and incremental increases in the amount of P that was applied, the ITP was noticeably increased.

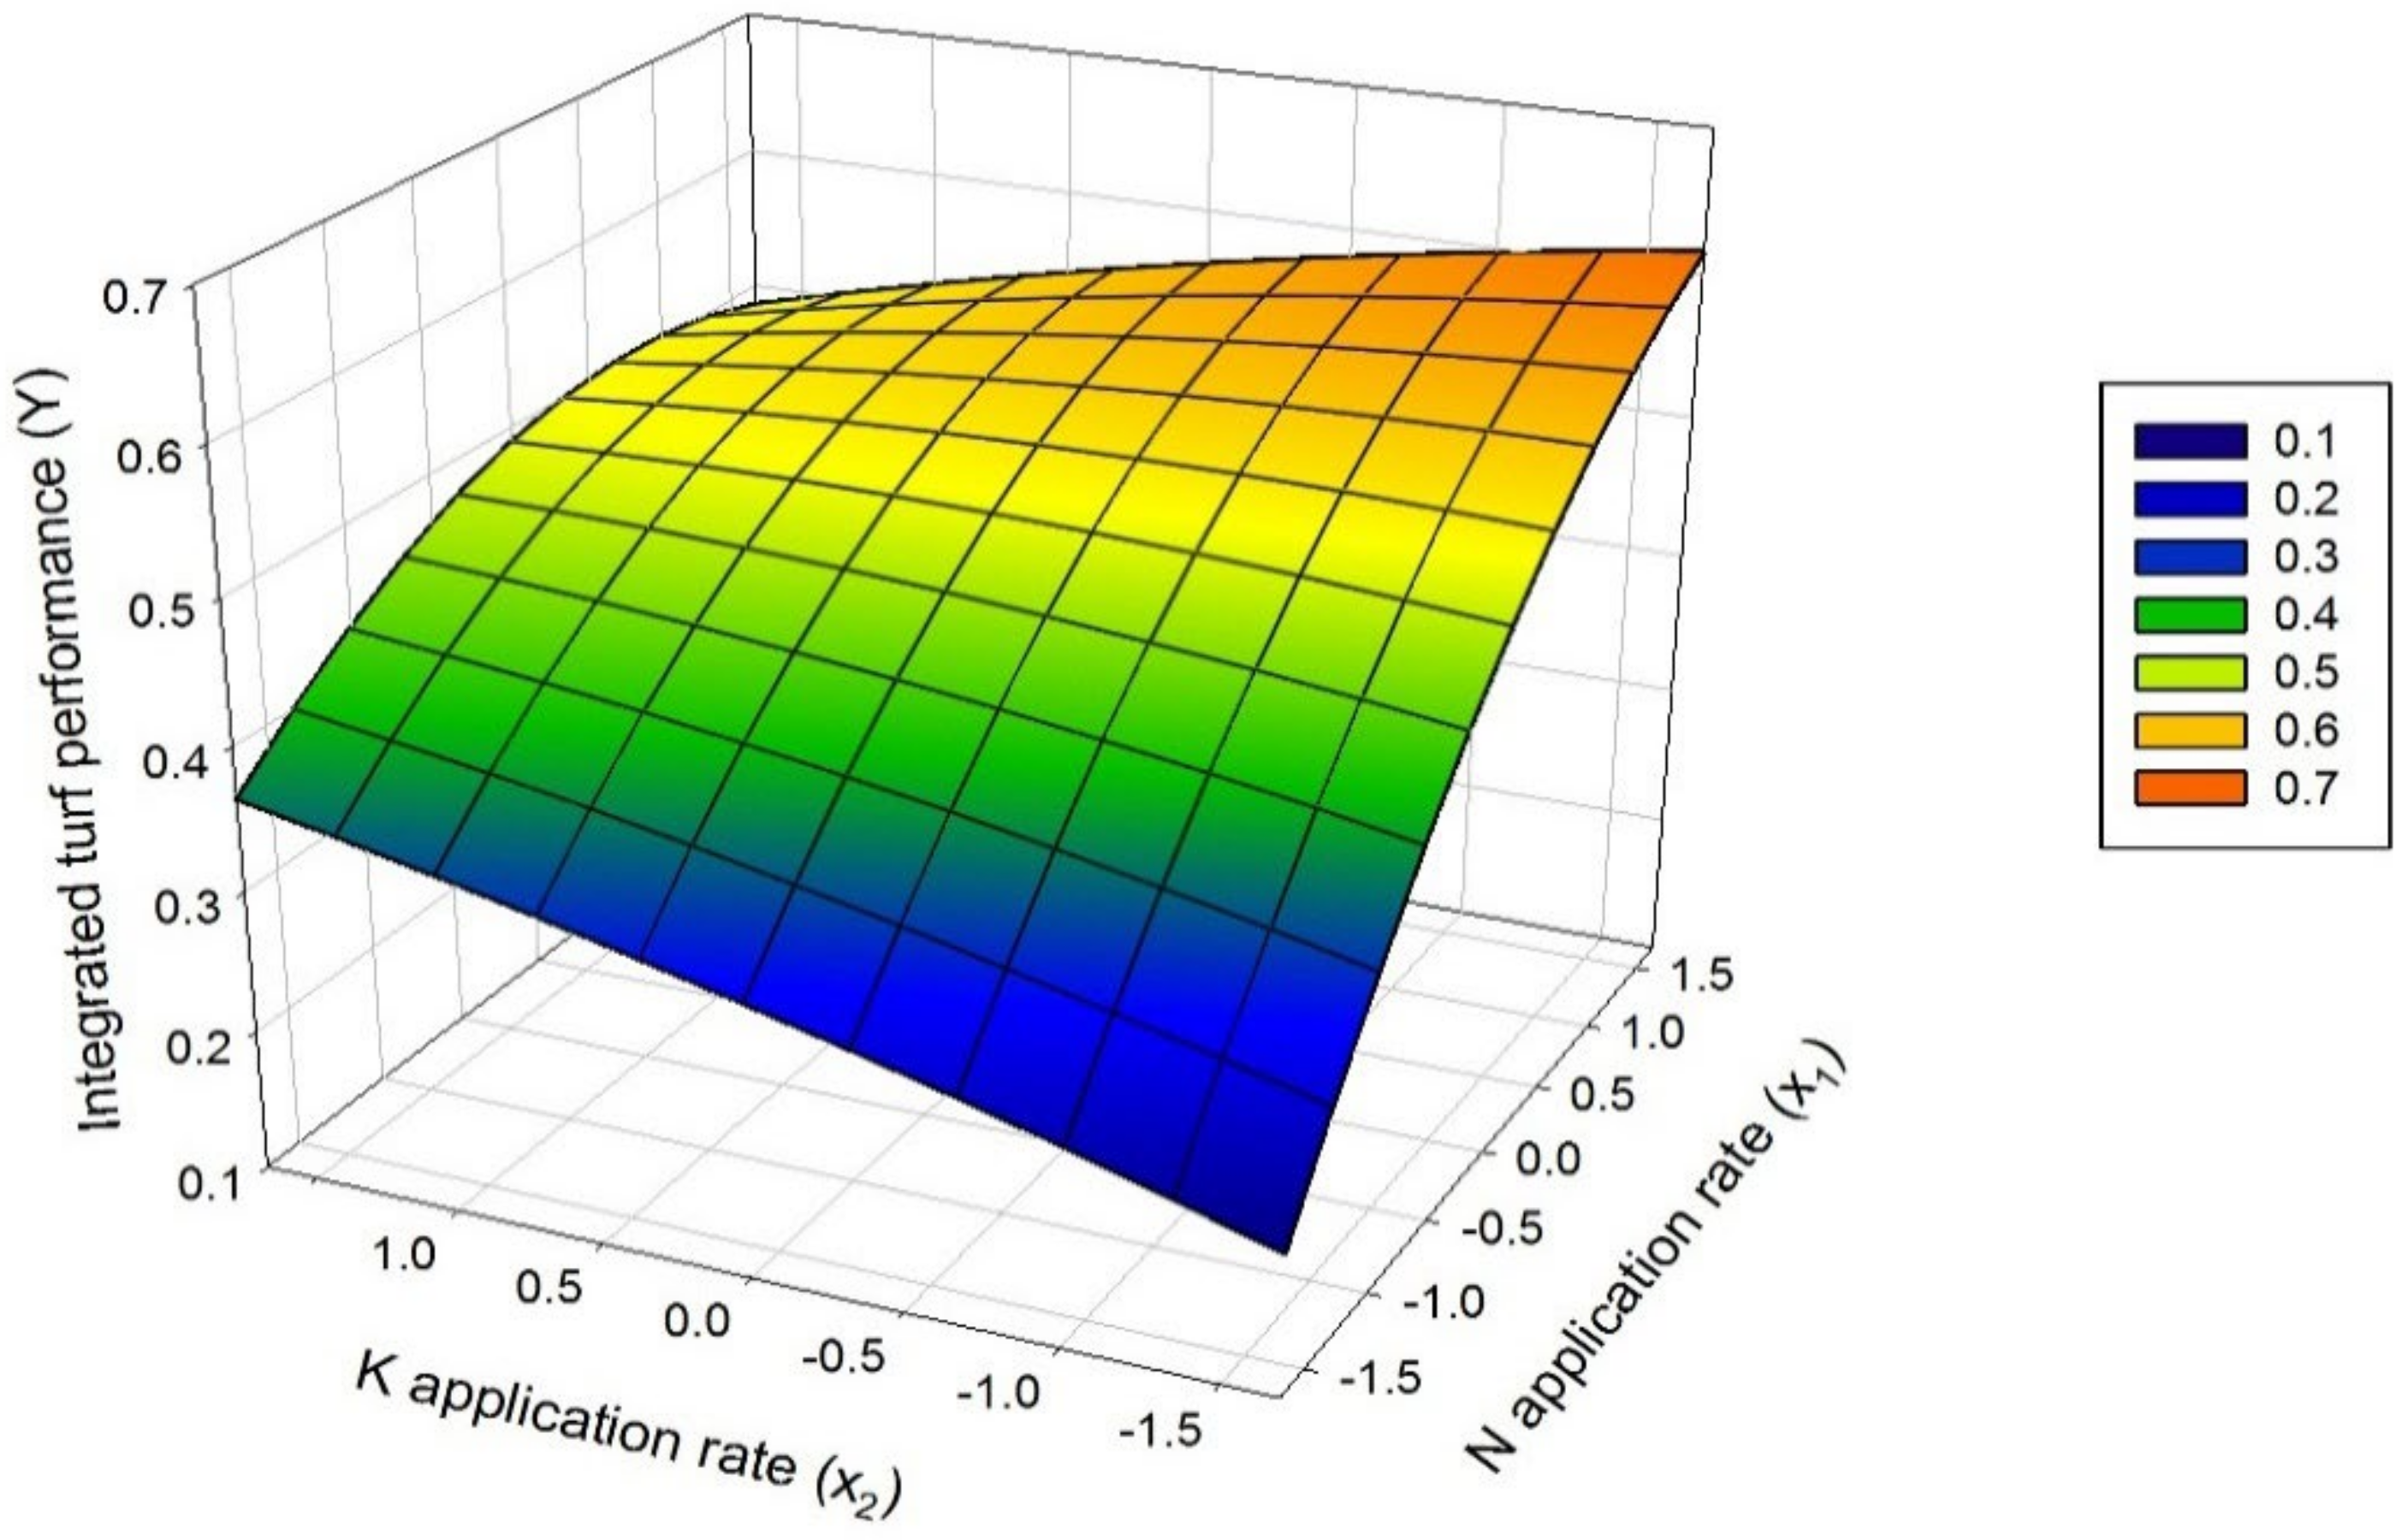
3.5.2. Interaction Between N (x1) and K (x3)

Interactions between N and K (Figure 2) had the most significant impact on ITP when the largest amounts of N and the smallest amounts of K were applied. Additionally, low K levels and incremental increases in N levels markedly enhanced the ITP. In contrast, ITP decreased when higher amounts of K and larger amounts of N were applied. On the other hand, although using either lower or higher amounts of N with increasing amounts of K initially enhanced ITP, subsequent increases in the amount of N and K that was applied decreased the ITP.

3.5.3. Interaction Between P (x2) and K (x3)

The P and K response surface plots (Figure 3) indicate that individually, both the P and K markedly increased ITP. However, interactively, the ITP only increased when lower amounts of P and K were applied and was abruptly decreased when the amount of P and K was enhanced. As both P and K were applied in lower or higher amounts, and the amount of the other nutrient was increased, the ITP improved.
The response surface plots indicate that all the factors (N, P, and K) affected the ITP and that N affected ITP independently and interactively. Based on the qualitative analysis of the above interaction effects, it is obvious that N distinctly increased the ITP of bermudagrass, thereafter P and K, respectively. Therefore, for high bermudagrass turf performance, the application of fertilizer N must be in higher rates, P in lower to medium rates, and K lower than both N and P.

3.6. Optimization

One of the aims of our study was to optimize the amounts of N, P, and K required for maximum bermudagrass turf performance during the establishment phase. Therefore, a simulated optimization of the obtained model (Equation (6)) was performed following regression modeling based on computer simulation of a formula. The respective variable range (−1.682–1.682) was divided into 11 steps, based on the step length of {0.3346}. Overall, 1331 (11 × 11 × 11 = 1331) combinations were obtained along with their corresponding ITP’s. The highest ITP value (0.704) was obtained with a fertilizer combination of N: P: K 30:30:0 g m−2. The minimum ITP (0.078) was obtained when no fertilizer was applied.

3.7. Frequency Analysis

All of the simulated values (1331) along with corresponding ITP’s were divided by an interval length of 0.1 into four sections (<0.4, 0.4–0.5, 0.5–0.6, and >0.6) (Table 6). Each fertilizer application range for the corresponding ITP was calculated. There were 61 values that provided maximum ITP values of >0.6. Frequency analysis of these 61 values (ITP > 0.6) resulted in an optimized amount of N, P, and K. Therefore, the optimized scheme for the amount of N, P, and K per m2 during the establishment stage is N: 26.0 to 27.6 g m−2, P: 24.2 to 26.4 g m−2, K: 3.1 to 5.0 g m−2.

4. Discussion

Among the macronutrients, N is the essential nutrient and is required in the greatest amounts by turfgrasses [37], followed by P and K [38,39]. We also observed the same relative importance of N after that P, and then K.
The results of the present study show that N, P, and K significantly affect the morpho-physiological properties of bermudagrass and that interactions among these nutrients affect the ITP of bermudagrass. Additionally, the combined application of different ratios of N, P, and K significantly improved the percent bermudagrass cover (Table 4), which is in line with earlier studies [12,37]. It was also observed that the application of NPK substantially enhanced turf height and shoot dry weight, which provides measures of the turf establishment speed and aboveground growth production. The findings of increased turf height and shoot dry weight in regards to NPK fertilization are consistent with [17,40]. These findings could be explained by the phenomenon that macronutrients (N, P, and K) are vital for plant development and growth. N is required for the biosynthesis of proteins, nucleic acids, and other important molecules. P is required for the synthesis of nucleic acids and other vital molecules. K in plant cells is an important cation and thus, is essential for homeostasis [41]. Additionally, the higher establishment rates induced by NPK may promote photosynthesis by maximizing leaf area. Indeed, photosynthesis drives the production of aboveground biomass.
Tiller length and turf density of bermudagrass increased with the incremental addition of N and P, with N being the most effective. High tiller growth rates and densities are desirable traits for turfgrass because they improve functionality, aesthetic quality, stand stability, and recovery from stress [42]. The interaction between N and P appeared to increase both their uptake and nutrient use efficiencies and to maximize the transformation of sunlight into biochemical energy by the process of photosynthesis. Photosynthesis is the primary driver of tissue formation and biomass allocation [43]. Similar to our findings, enhanced lateral growth and density with regards to N and P were reported in grasses [39,44]. N and P fertilizer application was reported to increase fresh and dry matter accumulation in turfgrasses [12,17,20]. We found that N and P enhanced bermudagrass relative greenness and that N was a major factor promoting turf color. N is an integral part of chlorophyll and, thus, is required for chlorophyll to accumulate in plant leaves [45]. The slight effect of P on the color formation that we observed is probably due to a secondary mechanism of this macronutrient correlated with overall growth enhancement properties and is consistent with previous reports [17,46].
In this study, the combined application of different ratios of N, P, and K increased root dry weight, while root length was significantly influenced by P and K fertilization. The P and K, especially K, positively affected root length and dry weight. The rationale for N, P, and K promoting root growth in turfgrasses is not fully understood. However, adequate N, P, and K are beneficial for root growth, which is critically essential for rapid turfgrass establishment. Indeed, the immobility of P and slow availability of K contributes to underdeveloped root systems during establishment periods [12,25,47]. In contrast, the variant effect of N may also be contributed to the form of N (e.g., NH4) on root development in bermudagrass [48].
We found that total chlorophyll levels were significantly enhanced by the combined application of different N, P, and K ratios. Chlorophyll concentrations and leaf color are directly correlated with N content [32], which we found are enhanced when N and P are applied together. This increase in chlorophyll content due to N, P, and K could drive photosynthesis because chlorophyll is the major light-harvesting pigment for photosynthesis. Indeed, photosynthetic efficiency was reported to improve when using N [49]. However, P and K may also promote photosynthesis. Carbon assimilation and phosphorylation were reported to encourage by P that increases the Rubisco re-generation [50]. K affects stomatal behavior and osmotic adjustments [51]. Total protein was highly influenced by N and less by P. The enhancement of total protein levels by N is probably related to N serving as an essential component of amino acids. The effect of P on total protein is probably indirect. P is a necessary component of many essential molecules, such as ATP’s, phospholipids, and nucleic acids. P plays a vital role in energy conservation and metabolism [52]. N and P may also enhance total protein levels by promoting increases in the levels of non-enzymatic antioxidants that decreased oxidative damage and allow plants to invest more resources in the development and growth of plants [53].
Ihtisham et al. [20] conducted a similar study for the determination of optimized fertilization rates, who proposed N:P:K (30:24–27:6–9 g m−2) for overseeded perennial ryegrass. Another study [14], on determining optimal N and K fertilization rates for the establishment of warm-season putting greens proposed 2.4 g N m−2 wk−1 during the grow-in period, and increasing N/K above 1:1 has not improved turf quality or quickened the establishment of the studied cultivars.

5. Conclusions

Proper nutrient management is essential for optimum turfgrass performance and maintaining agricultural and environmental sustainability. The impact of N, P, and K fertilization on the morpho-physiological traits of bermudagrass and their interactive effects on ITP was studied using CCRD with regression modeling, response surface methodology (RSM), simulation optimization, and frequency analysis. It is found that among these three nutrients, N contributes the most to bermudagrass turf growth and performance, followed by P and K. The N, P, and K significantly influenced percent grass cover, turf height, shoot dry weight, root dry weight, and TCC. Tiller length, density, turf color, and total protein were remarkedly increased by N and P fertilization. Root length was significantly augmented by P and K fertilization. Regression modeling analysis was performed to establish the relationship between the ITP and these nutrients. Based on a simulation optimization and frequency analysis, the N, P, and K rates were optimized. The optimized amounts for bermudagrass ITP during the establishment phase were N: 26.0 to 27.6 g m−2, P: 24.2 to 26.4 g m−2, and K: 3.1 to 5.0 g m−2. It is concluded that the regression modeling, RSM, and simulation optimization with frequency analysis is a practical approach for optimizing different combinations of treatments or processing conditions and that this approach is useful for establishing nutrient management strategies to maximize yield and performance for the development of sustainable agriculture. Such optimized nutrient management schemes will lead to sustainable nutrient management by enhancing yield and performance, nutrient-use efficiencies, as well as environmental and ecological sustainability.

Author Contributions

Conceptualization, M.I., L.C., and Q.C.; methodology, M.I., L.C., and Q.C.; software, M.O.S., N.K., and M.S.; formal analysis, M.I., M.O.S. and S.A.; investigation, M.I.; and B.L.; resources, Q.C., Y.L., and L.C.; data curation, M.I., S.L., B.L., S.A. and N.K.; writing—original draft preparation, M.I.; writing—review and editing, M.I., and S.L.; funding acquisition, Q.C., Y.L. All authors have read and agreed to the published version of the manuscript.

Funding

This research received no external funding.

Acknowledgments

We thank the anonymous reviewers for their precious time and comments. This research work was partly supported by the Key R&D project of the Sichuan Science and Technology Department (Grant No. 2019YFN0005).

Conflicts of Interest

The authors declare that they have no conflict of interests.

References

  1. Specht, K.; Siebert, R.; Hartmann, I.; Freisinger, U.B.; Sawicka, M.; Werner, A. Urban agriculture of the future: An overview of sustainability aspects of food production in and on buildings. Agric. Hum. Values 2014, 31, 33–51. [Google Scholar] [CrossRef]
  2. Mougeot, L.J. Urban Agriculture: Definition, Presence, Potentials and Risks, and Policy Challenges; Cities Feeding People Series, Report 3; International Development Research Centre (IDRC): Ottawa, ON, Canada, 2000. [Google Scholar]
  3. Grard, B.J.; Chenu, C.; Manouchehri, N.; Houot, S.; Frascaria-Lacoste, N.; Aubry, C. Rooftop farming on urban waste provides many ecosystem services. Agron. Sustain. Dev. 2018, 38, 2. [Google Scholar] [CrossRef] [Green Version]
  4. Orsini, F.; Kahane, R.; Nono-Womdim, R.; Gianquinto, G. Urban agriculture in the developing world: A review. Agron. Sustain. Dev. 2013, 33, 695–720. [Google Scholar] [CrossRef] [Green Version]
  5. Arrobas, M.; Parada, M.J.; Magalhaes, P.; Rodrigues, M.Â. Nitrogen-use efficiency and economic efficiency of slow-release N fertilisers applied to irrigated turfs in a Mediterranean environment. Nutr. Cycl. Agroecosys. 2011, 89, 329–339. [Google Scholar] [CrossRef]
  6. Kurup, S.S.; Abdul, M.A.; Salem, M.; Cheruth, A.J.; Sreeramanan, S.; Purayil, F.T. Changes in Antioxidant Enzyme Activity in Turfgrass Cultivars Under Various Saline Water Irrigation Levels to Suit Landscapes Under Arid Regions. Commun. Soil. Sci. Plant 2017, 48, 1989–2001. [Google Scholar] [CrossRef]
  7. Juraimi, A. Turfgrass: Types, uses and maintenance. Garden Asia 2001, 8, 40–43. [Google Scholar]
  8. Karimi, I.Y.M.; Kurup, S.S.; Salem, M.A.; Cheruth, A.J.; Purayil, F.T.; Subramaniam, S. Evaluation of bermuda and paspalum grass types for urban landscapes under saline water irrigation. J. Plant Nutr. 2018, 41, 888–902. [Google Scholar] [CrossRef]
  9. Adnan, M.; Fahad, S.; Muhammad, Z.; Shahen, S.; Ishaq, A.M.; Subhan, D.; Zafar-ul-Hye, M.; Martin, L.B.; Raja, M.M.N.; Beena, S.; et al. Coupling Phosphate-Solubilizing Bacteria with Phosphorus Supplements Improve Maize Phosphorus Acquisition and Growth under Lime Induced Salinity Stress. Plants 2020, 9, 900. [Google Scholar] [CrossRef]
  10. Turgeon, A. Turfgrass Management; Prentice Hall: Englewood Cliffs, NJ, USA, 2012. [Google Scholar]
  11. Deng, G.; Liu, L.J.; Zhong, X.Y.; Lao, C.Y.; Wang, H.Y.; Wang, B.; Zhu, C.; Shah, F.; Peng, D.X. Comparative proteome analysis of the response of ramie under n, p and k deficiency. Planta 2014, 239, 1175–1186. [Google Scholar] [CrossRef]
  12. Rodriguez, I.R.; Miller, G.L.; McCarty, L. Bermudagrass establishment on high sand-content soils using various npk ratios. HortScience 2002, 37, 208–209. [Google Scholar] [CrossRef]
  13. Saud, S.; Fahad, S.; Cui, G.; Chen, Y.; Anwar, S. Determining nitrogen isotopes discrimination under drought stress on enzymatic activities, nitrogen isotope abundance and water contents of Kentucky bluegrass. Sci. Rep. 2020, 10, 6415. [Google Scholar] [CrossRef] [PubMed] [Green Version]
  14. Rowland, J.; Cisar, J.; Snyder, G.; Sartain, J.; Wright, A. Usga ultradwarf bermudagrass putting green properties as affected by cultural practices. Agron. J. 2009, 101, 1565–1572. [Google Scholar] [CrossRef] [Green Version]
  15. Kopec, D.M.; Walworth, J.L.; Gilbert, J.J.; Sower, G.M.; Pessarakli, M. ‘Seaisle 2000’ paspalum putting surface response to mowing height and nitrogen fertilizer. Agron. J. 2007, 99, 133–140. [Google Scholar] [CrossRef]
  16. Xiong, X.; Bell, G.; Solie, J.; Smith, M.; Martin, B. Bermudagrass seasonal responses to nitrogen fertilization and irrigation detected using optical sensing. Crop Sci. 2007, 47, 1603–1610. [Google Scholar] [CrossRef]
  17. Baldi, A.; Lenzi, A.; Nannicini, M.; Pardini, A.; Tesi, R. Growth and nutrient content of hybrid bermudagrass grown for nursery purposes at different nitrogen, phosphorus, and potassium rates. Horttechnology 2013, 23, 347–355. [Google Scholar] [CrossRef] [Green Version]
  18. Zhao, D.; Reddy, K.R.; Kakani, V.G.; Reddy, V. Nitrogen deficiency effects on plant growth, leaf photosynthesis, and hyperspectral reflectance properties of sorghum. Eur. J. Agron. 2005, 22, 391–403. [Google Scholar] [CrossRef]
  19. Fahad, S.; Hussain, S.; Saud, S.; Hassan, S.; Tanveer, M.; Ihsan, M.Z.; Shah, A.N.; Ullah, A.; Nasrullah, K.F.; Ullah, S.; et al. A combined application of biochar and phosphorus alleviates heat-induced adversities on physiological, agronomical and quality attributes of rice. Plant Physiol. Biochem. 2016, 103, 191–198. [Google Scholar] [CrossRef]
  20. Ihtisham, M.; Fahad, S.; Luo, T.; Robert, M.L.; Shaohua, Y.; Longqing, C. Optimization of Nitrogen, Phosphorus, and Potassium Fertilization Rates for Overseeded Perennial Ryegrass Turf on Dormant Bermudagrass in a Transitional Climate. Front. Plant Sci. 2018, 9, 487. [Google Scholar] [CrossRef] [Green Version]
  21. Carrow, R.N.; Waddington, D.V.; Rieke, P.E. Turfgrass Soil Fertility & Chemical Problems: Assessment and Management; John Wiley & Sons: Hoboken, NJ, USA, 2001. [Google Scholar]
  22. Fry, J.; Harivandi, M.; Minner, D.D. Creeping bentgrass response to p and k on a sand medium. HortScience 1989, 24, 623–624. [Google Scholar]
  23. McCarty, L.B.; Miller, G. Managing Bermudagrass Turf: Selection, Construction, Cultural Practices, and Pest Management Strategies; John Wiley & Sons: Hoboken, NJ, USA, 2002. [Google Scholar]
  24. Beard, J. Turf Management for Golf Courses, 2nd ed.; Ann Arbor Press: Chelsea, MI, USA, 2002. [Google Scholar]
  25. Turner, T.R.; Hummel, N.W. Nutritional requirements and fertilization. Turfgrass 1992, 32, 385–439. [Google Scholar]
  26. Hafiz, M.H.; Farhat, A.; Ashfaq, A.; Hafiz, F.B.; Wajid, F.; Carol Jo, W.; Fahad, S.; Gerrit, H. Predicting Kernel Growth of Maize under Controlled Water and Nitrogen Applications. Int. J. Plant. Prod. 2020, 14, 609–620. [Google Scholar] [CrossRef]
  27. Zhen, L.; Zoebisch, M.A.; Chen, G.; Feng, Z. Sustainability of farmers’ soil fertility management practices: A case study in the North China Plain. J. Environ. Manag. 2006, 79, 409–419. [Google Scholar] [CrossRef] [PubMed]
  28. Miao, Y.; Stewart, B.A.; Zhang, F. Long-term experiments for sustainable nutrient management in China. A review. Agron. Sustain. Dev. 2011, 31, 397–414. [Google Scholar] [CrossRef] [Green Version]
  29. Amin, A.; Nasim, W.; Mubeen, M.; Nadeem, M.; Ali, L.; Hammad, H.M.; Sultana, S.R.; Jabran, K.; ur Rehman, M.H.; Ahmad, S. Optimizing the phosphorus use in cotton by using csm-cropgro-cotton model for semi-arid climate of vehari-punjab, pakistan. Environ. Sci. Pollut. Res. 2017, 24, 5811–5823. [Google Scholar] [CrossRef]
  30. Spiertz, J.H.J. Nitrogen, sustainable agriculture and food security. A review. Agron. Sustain. Dev. 2010, 30, 43–55. [Google Scholar] [CrossRef] [Green Version]
  31. Liu, H.; Baldwin, C.; Luo, H.; Pessarakli, M. Enhancing Turfgrass Nitrogen Use under Stresses. Handbook of Turfgrass Management and Physiology; Taylor and Francis Group: Boca Raton, FL, USA, 2008; pp. 555–599. [Google Scholar]
  32. Saud, S.; Fahad, S.; Yajun, C.; Ihsan, M.Z.; Hammad, H.M.; Nasim, W.; Arif, M.; Alharby, H. Effects of nitrogen supply on water stress and recovery mechanisms in Kentucky bluegrass plants. Front. Plant Sci. 2017, 8, 983. [Google Scholar] [CrossRef] [Green Version]
  33. Montgomery, D.C. Design and Analysis of Experiments; John Wiley & Sons: New York, NY, USA, 2001; pp. 64–65. [Google Scholar]
  34. Han, K.; Zhou, C.; Sheng, H.; Yang, Y.; Zhang, L.; Wang, L. Agronomic improvements in corn by alternating naitrogen and irrigation to various plants densities. Agron. J. 2015, 107, 93–103. [Google Scholar] [CrossRef]
  35. Roy, R.; Wang, J.; Mostofa, M.G.; Fornara, D.; Sikdar, A.; Sarker, T. Fine-tuning of soil water and nutrient fertilizer levels for the ecological restoration of coal-mined spoils using Elaeagnus angustifolia. J. Environ. Manag. 2020, 270, 110855. [Google Scholar] [CrossRef]
  36. Halder, G.; Dhawane, S.; Barai, P.K.; Das, A. Optimizing chromium (vi) adsorption onto superheated steam activated granular carbon through response surface methodology and artificial neural network. Environ. Prog. Sustain. 2015, 34, 638–647. [Google Scholar] [CrossRef]
  37. Trenholm, L.; Dudeck, A.; Sartain, J.; Cisar, J. Cynodon responses to nitrogen, potassium, and day-length during vegetative establishment. Int. Turfgrass Soc. Res. J. 1997, 8, 541–552. [Google Scholar]
  38. Miller, G.L. Potassium application reduces calcium and magnesium levels in bermudagrass leaf tissue and soil. HortScience 1999, 34, 265–268. [Google Scholar] [CrossRef] [Green Version]
  39. Guertal, E. Phosphorus movement and uptake in bermudagrass putting greens. USGA Turfgrass Environ. Res. Online 2006, 5, 1–7. [Google Scholar]
  40. Ullah, S.; Liu, L.; Anwar, S.; Tuo, X.; Khan, S.; Wang, B.; Peng, D. Effects of fertilization on ramie (Boehmeria nivea L.) growth, yield and fiber quality. Sustainability 2016, 8, 887. [Google Scholar] [CrossRef] [Green Version]
  41. Maathuis, F.J. Physiological functions of mineral macronutrients. Curr. Opin. Plant Biol. 2009, 12, 250–258. [Google Scholar] [CrossRef] [PubMed]
  42. Burgess, P.; Huang, B. Growth and physiological responses of creeping bentgrass (Agrostis stolonifera) to elevated carbon dioxide concentrations. Hort. Res. 2014, 1, 14021. [Google Scholar] [CrossRef] [Green Version]
  43. Zlatev, Z.; Lidon, F.C. An overview on drought induced changes in plant growth, water relations and photosynthesis. Emir. J. Food Agric. 2012, 24, 57. [Google Scholar]
  44. Lippke, H.; Haby, V.A.; Provin, T.L. Irrigated annual ryegrass responses to nitrogen and phosphorus on calcareous soil. Agron. J. 2006, 98, 1333–1339. [Google Scholar] [CrossRef]
  45. Din, M.; Wen, Z.; Rashid, M.; Wang, S.; Shi, Z. Evaluating hyperspectral vegetation indices for leaf area index estimation of Oryza sativa L. At diverse phenological stages. Front. Plant Sci. 2017, 8, 820. [Google Scholar] [CrossRef] [Green Version]
  46. Munshaw, G.; Ervin, E.; Parrish, D.; Shang, C.; Askew, S.; Zhang, X.; Lemus, R. Influence of late-season iron, nitrogen, and seaweed extract on fall color retention and cold tolerance of four bermudagrass cultivars. Crop Sci. 2007, 47, 463. [Google Scholar] [CrossRef]
  47. Peacock, C.; Bruneau, A.; Dipaola, J. Response of the cynodon cultivar ‘tifgreen’ to potassium fertilization. Int. Turfgrass Soc. Res. J. 1997, 8, 1308–1314. [Google Scholar]
  48. Glinski, D.; Mills, H.; Karnok, K.; Carrow, R. Nitrogen form influences root growth of sodded creeping bentgrass. HortScience 1990, 25, 932–933. [Google Scholar] [CrossRef] [Green Version]
  49. Dordas, C.A.; Sioulas, C. Safflower yield, chlorophyll content, photosynthesis, and water use efficiency response to nitrogen fertilization under rainfed conditions. Ind. Crops Prod. 2008, 27, 75–85. [Google Scholar] [CrossRef]
  50. Liu, H.; Hu, C.; Sun, X.; Tan, Q.; Nie, Z.; Hu, X. Interactive effects of molybdenum and phosphorus fertilizers on photosynthetic characteristics of seedlings and grain yield of brassica napus. Plant Soil 2010, 326, 345–353. [Google Scholar] [CrossRef]
  51. Tsonev, T.; Velikova, V.; Yildiz-Aktas, L.; Gürel, A.; Edreva, A. Effect of water deficit and potassium fertilization on photosynthetic activity in cotton plants. Plant Biosyst. 2011, 145, 841–847. [Google Scholar] [CrossRef]
  52. Hussain, S.; Khan, F.; Cao, W.; Wu, L.; Geng, M. Seed priming alters the production and detoxification of reactive oxygen intermediates in rice seedlings grown under sub-optimal temperature and nutrient supply. Front. Plant Sci. 2016, 7, 439. [Google Scholar] [CrossRef] [PubMed] [Green Version]
  53. Abid, M.; Tian, Z.; Ata-Ul-Karim, S.T.; Cui, Y.; Liu, Y.; Zahoor, R.; Jiang, D.; Dai, T. Nitrogen nutrition improves the potential of wheat (Triticum aestivum L.) to alleviate the effects of drought stress during vegetative growth periods. Front. Plant Sci. 2016, 7, 981. [Google Scholar] [CrossRef] [Green Version]
Figure 1. Response surface plot showing the interaction effects of N and P fertilization on the ITP of bermudagrass.
Sustainability 12 10294 g001
Figure 2. Response surface plot showing the interaction effects of N and K fertilization on the ITP of bermudagrass.
Sustainability 12 10294 g002
Figure 3. Response surface plot showing the interaction effects of P and K fertilization on the ITP of bermudagrass.
Sustainability 12 10294 g003
Table 1. Experimental scheme (design and treatment combinations) of the central composite rotatable design (CCRD).
TreatmentsCoded ValuesActual Values of Independent Variables
X1X2X3N (g/m2)P (g/m2)K (g/m2)
111123.91823.91823.918
211–123.91823.9186.082
31–1123.9186.08223.918
41–1–123.9186.0826.082
5–1116.08223.91823.918
6–11–16.08223.9186.082
7–1–116.0826.08223.918
8–1–1–16.0826.0826.082
91.68200301515
10–1.6820001515
1101.6820153015
120–1.682015015
13001.682151530
1400–1.68215150
15000151515
16000151515
17000151515
18000151515
19000151515
20000151515
21000151515
22000151515
23000151515
24 000
Note: T1 to T24 indicate total number of treatments and the combined amount of N, P, and K application. X1,2,3 indicate codes for N, P, and K, respectively. T24 represents the control treatment.
Table 2. Experimental variables, codes, and coded levels in central composite rotatable design (CCRD).
Experiment VariablesCodesSymbolsLevels of Coded Variables
−1.682−1011.682
NitrogenX1N06.0821523.91830
PhosphorusX2P06.0821523.91830
PotassiumX3K06.0821523.91830
Note: X1,2,3 indicate codes for N, P, and K, respectively. −1.682 to 1.682 indicate coded levels, and 0, 6.082, 15, 23.918, and 30 indicate N, P, and K actual levels.
Table 3. Average values of morpho-physiological performance of bermudagrass as affected by different treatment combinations of N, P, and K in the central composite rotatable design (CCRD).
Treatments% of Grass CoverTurf Height (cm)Tiller Length (cm)Turf Density (No. Leaves Tiller−1)Shoot Dry Weight (gdm−2)Relative Greenness (SPAD)Root Length (cm)Root Dry Weight (g)TCC (Chl g−1 Fresh Weight)Total Protein (g L−1)
171.5015.3022.3084.806.339.1811.170.291.182.29
278.7514.9028.50118.009.529.5210.700.271.143.15
366.7513.9022.8091.806.379.8810.870.321.321.92
463.2513.1024.10109.604.959.7410.630.241.272.84
566.509.4019.9072.806.005.5212.800.440.841.00
663.008.4020.2089.007.036.7210.630.330.631.61
760.509.0016.1071.405.845.8215.370.480.611.09
850.758.1015.1076.205.285.507.570.230.521.66
964.0010.3022.7083.608.1410.947.500.211.412.67
1055.756.1012.4044.204.525.328.270.321.131.29
1163.009.8020.7071.008.339.029.770.421.221.43
1261.508.5020.0068.206.868.749.270.461.201.18
1377.258.7019.7075.207.015.6015.370.500.652.49
1476.007.0022.7092.205.447.3610.630.260.651.82
1578.009.9020.8099.008.769.1010.230.311.021.34
1678.2511.0023.3088.007.789.4811.770.290.921.27
1778.009.0018.5070.208.406.3811.200.311.031.62
1876.0010.2021.4094.407.329.6411.130.320.951.07
1979.2511.4024.5063.208.547.908.730.401.021.72
2081.758.7020.3087.609.168.5011.900.430.881.24
2179.509.0020.3093.408.779.188.930.280.831.82
2278.009.5018.4090.008.337.687.970.371.031.79
2371.759.5019.4094.208.668.307.900.361.101.65
2441.505.309.8032.804.453.784.500.120.470.29
Table 4. Coefficients for each parameter using regression equation (Y = a0 + a1x1 + a2x2 + a3x3 + a4x1x2 + a5x1x3 + a6x2x3 + a7x12 + a8x22 + a9x32). x1, x2, and x3 indicate coded values for the amounts of N, P, and K.
Ya0a1a2a3a4a5a6a7a8a9R2
% of grass cover70.393.913.000.850.25–2.13–2.13−6.44−5.60−0.510.91 ***
Turf height10.032.150.450.440.31–0.09–0.040.100.43−0.030.60 *
Tiller length20.613.201.02−0.87−0.63–1.03–0.78–0.830.160.460.80 ***
Turf density83.8311.791.49−7.37–1.60–3.75–3.35–4.39−2.372.620.61 *
Shoot dry weight7.280.670.650.030.33–0.16–0.78–0.78−0.33−0.820.84 ***
Relative greenness8.041.770.03–0.30–0.230.09–0.25–0.130.14−0.710.85 ***
Root length10.45–0.310.131.37–0.02–1.16–0.68–0.520.061.290.71 **
Root dry weight0.340.000.000.06–0.01–0.03–0.03–0.040.030.010.81 ***
TCC0.980.200.010.03–0.08–0.030.010.080.06−0.140.82 ***
Total protein1.740.520.07–0.130.10–0.080.000.19−0.050.250.76 ***
Notes: *** Significance at P < 0.001; ** Significance at P < 0.01; * Significance at P < 0.05.
Table 5. Transformed values of obtained data according to the central composite rotatable design (CCRD) and integrated turf performance (ITP) of bermudagrass.
Treatments% of Grass CoverTurf HeightTiller LengthTurf DensityShoot Dry Weight Relative GreennessRoot LengthRoot Dry WeightTCCTotal ProteinIntegrated Turf Performance
(Y)
Max/Min90/3518/235/5130/2012/215/120/11/0.052/0.204/0.10
10.660.830.580.590.430.580.540.250.550.560.56
20.800.810.780.890.750.610.510.240.520.780.67
30.580.740.590.650.440.630.520.290.620.470.55
40.510.690.640.810.300.620.510.200.600.700.56
50.570.460.500.480.400.320.620.410.350.230.44
60.510.400.510.630.500.410.510.290.240.390.44
70.460.440.370.470.380.340.760.450.230.250.42
80.290.380.340.510.330.320.350.190.180.400.33
90.530.520.590.580.610.710.340.170.670.660.54
100.380.260.250.220.250.310.380.280.520.310.31
110.510.490.520.460.630.570.460.390.570.340.49
120.480.410.500.440.490.550.440.430.550.280.46
130.770.420.490.500.500.330.760.470.250.610.51
140.750.310.590.660.340.450.510.220.250.440.45
150.780.490.530.720.680.580.490.270.450.320.53
160.790.560.610.620.580.610.570.250.400.300.53
170.780.440.450.460.640.380.540.270.460.390.48
180.750.510.550.680.530.620.530.280.420.250.51
190.800.590.650.390.650.490.410.370.460.420.52
200.850.420.510.610.720.540.570.400.380.290.53
210.810.440.510.670.680.580.420.240.350.440.51
220.780.470.450.640.630.480.370.340.460.430.50
230.670.470.480.670.670.520.360.320.500.400.51
Table 6. Optimized amounts of N, P, and K and their integrated turf performance.
Integrated Turf Performance (ITP)CountsApplication Amount
N (g m−2)P (g m−2)K (g m−2)
<0.43483.18~3.9512.00~13.9911.54~13.47
0.4~0.544712.93~14.0414.37~16.1717.08~18.86
0.5~0.647522.86~23.7214.10~15.7014.66~16.21
> 0.66125.95~27.5624.20~26.363.12~4.95
Publisher’s Note: MDPI stays neutral with regard to jurisdictional claims in published maps and institutional affiliations.

