Evaluation of the Economic, Environmental, and Social Impacts of the COVID-19 Pandemic on the Japanese Tourism Industry


Abstract
:1. Introduction
2. Materials and Methods
2.1. System Boundaries
2.2. Calculation Method of Economic Analysis
2.3. Calculation Method of Environmental Analysis
2.4. Calculation Method of Social Analysis
3. Results
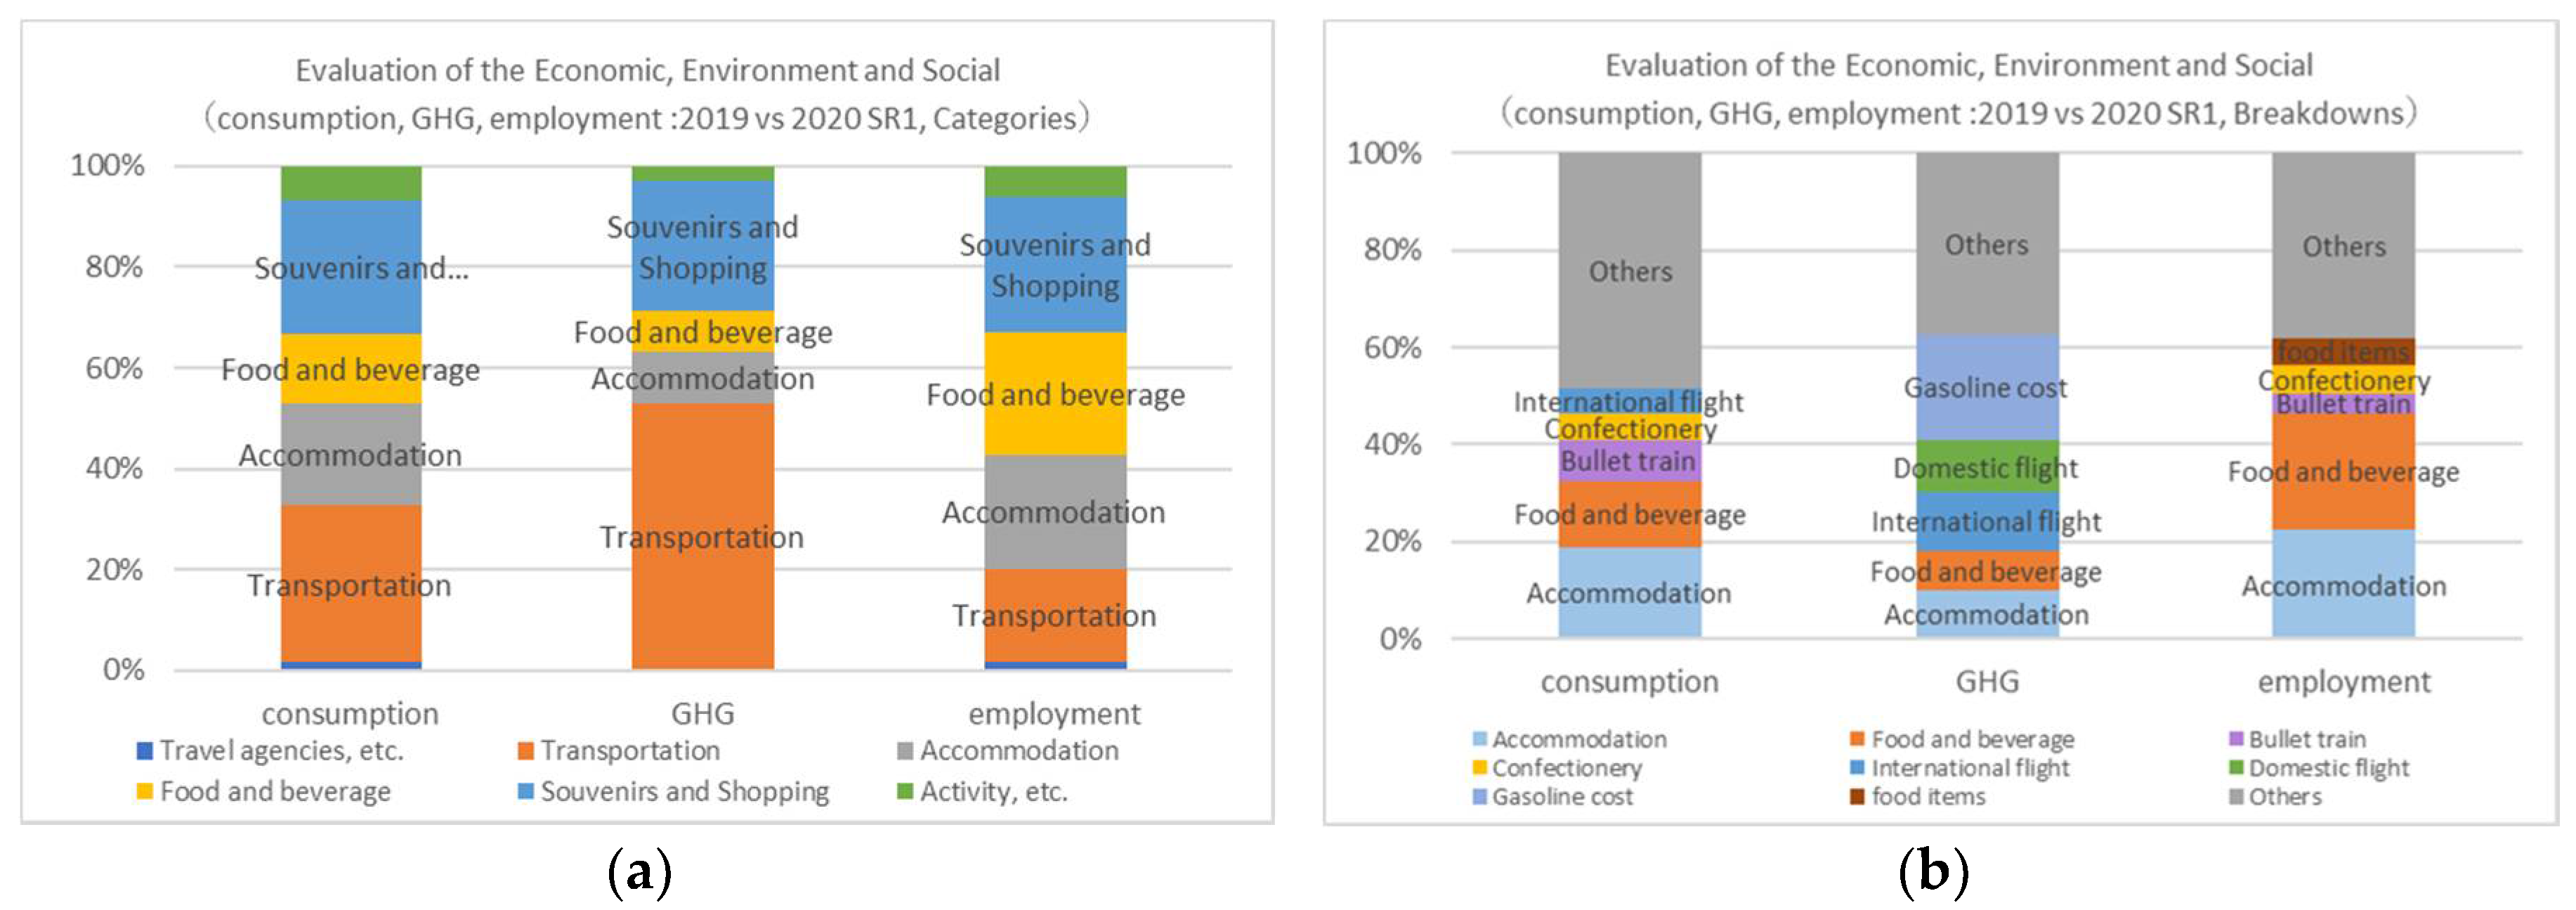
3.1. Economic, Environmental, and Social Evaluation
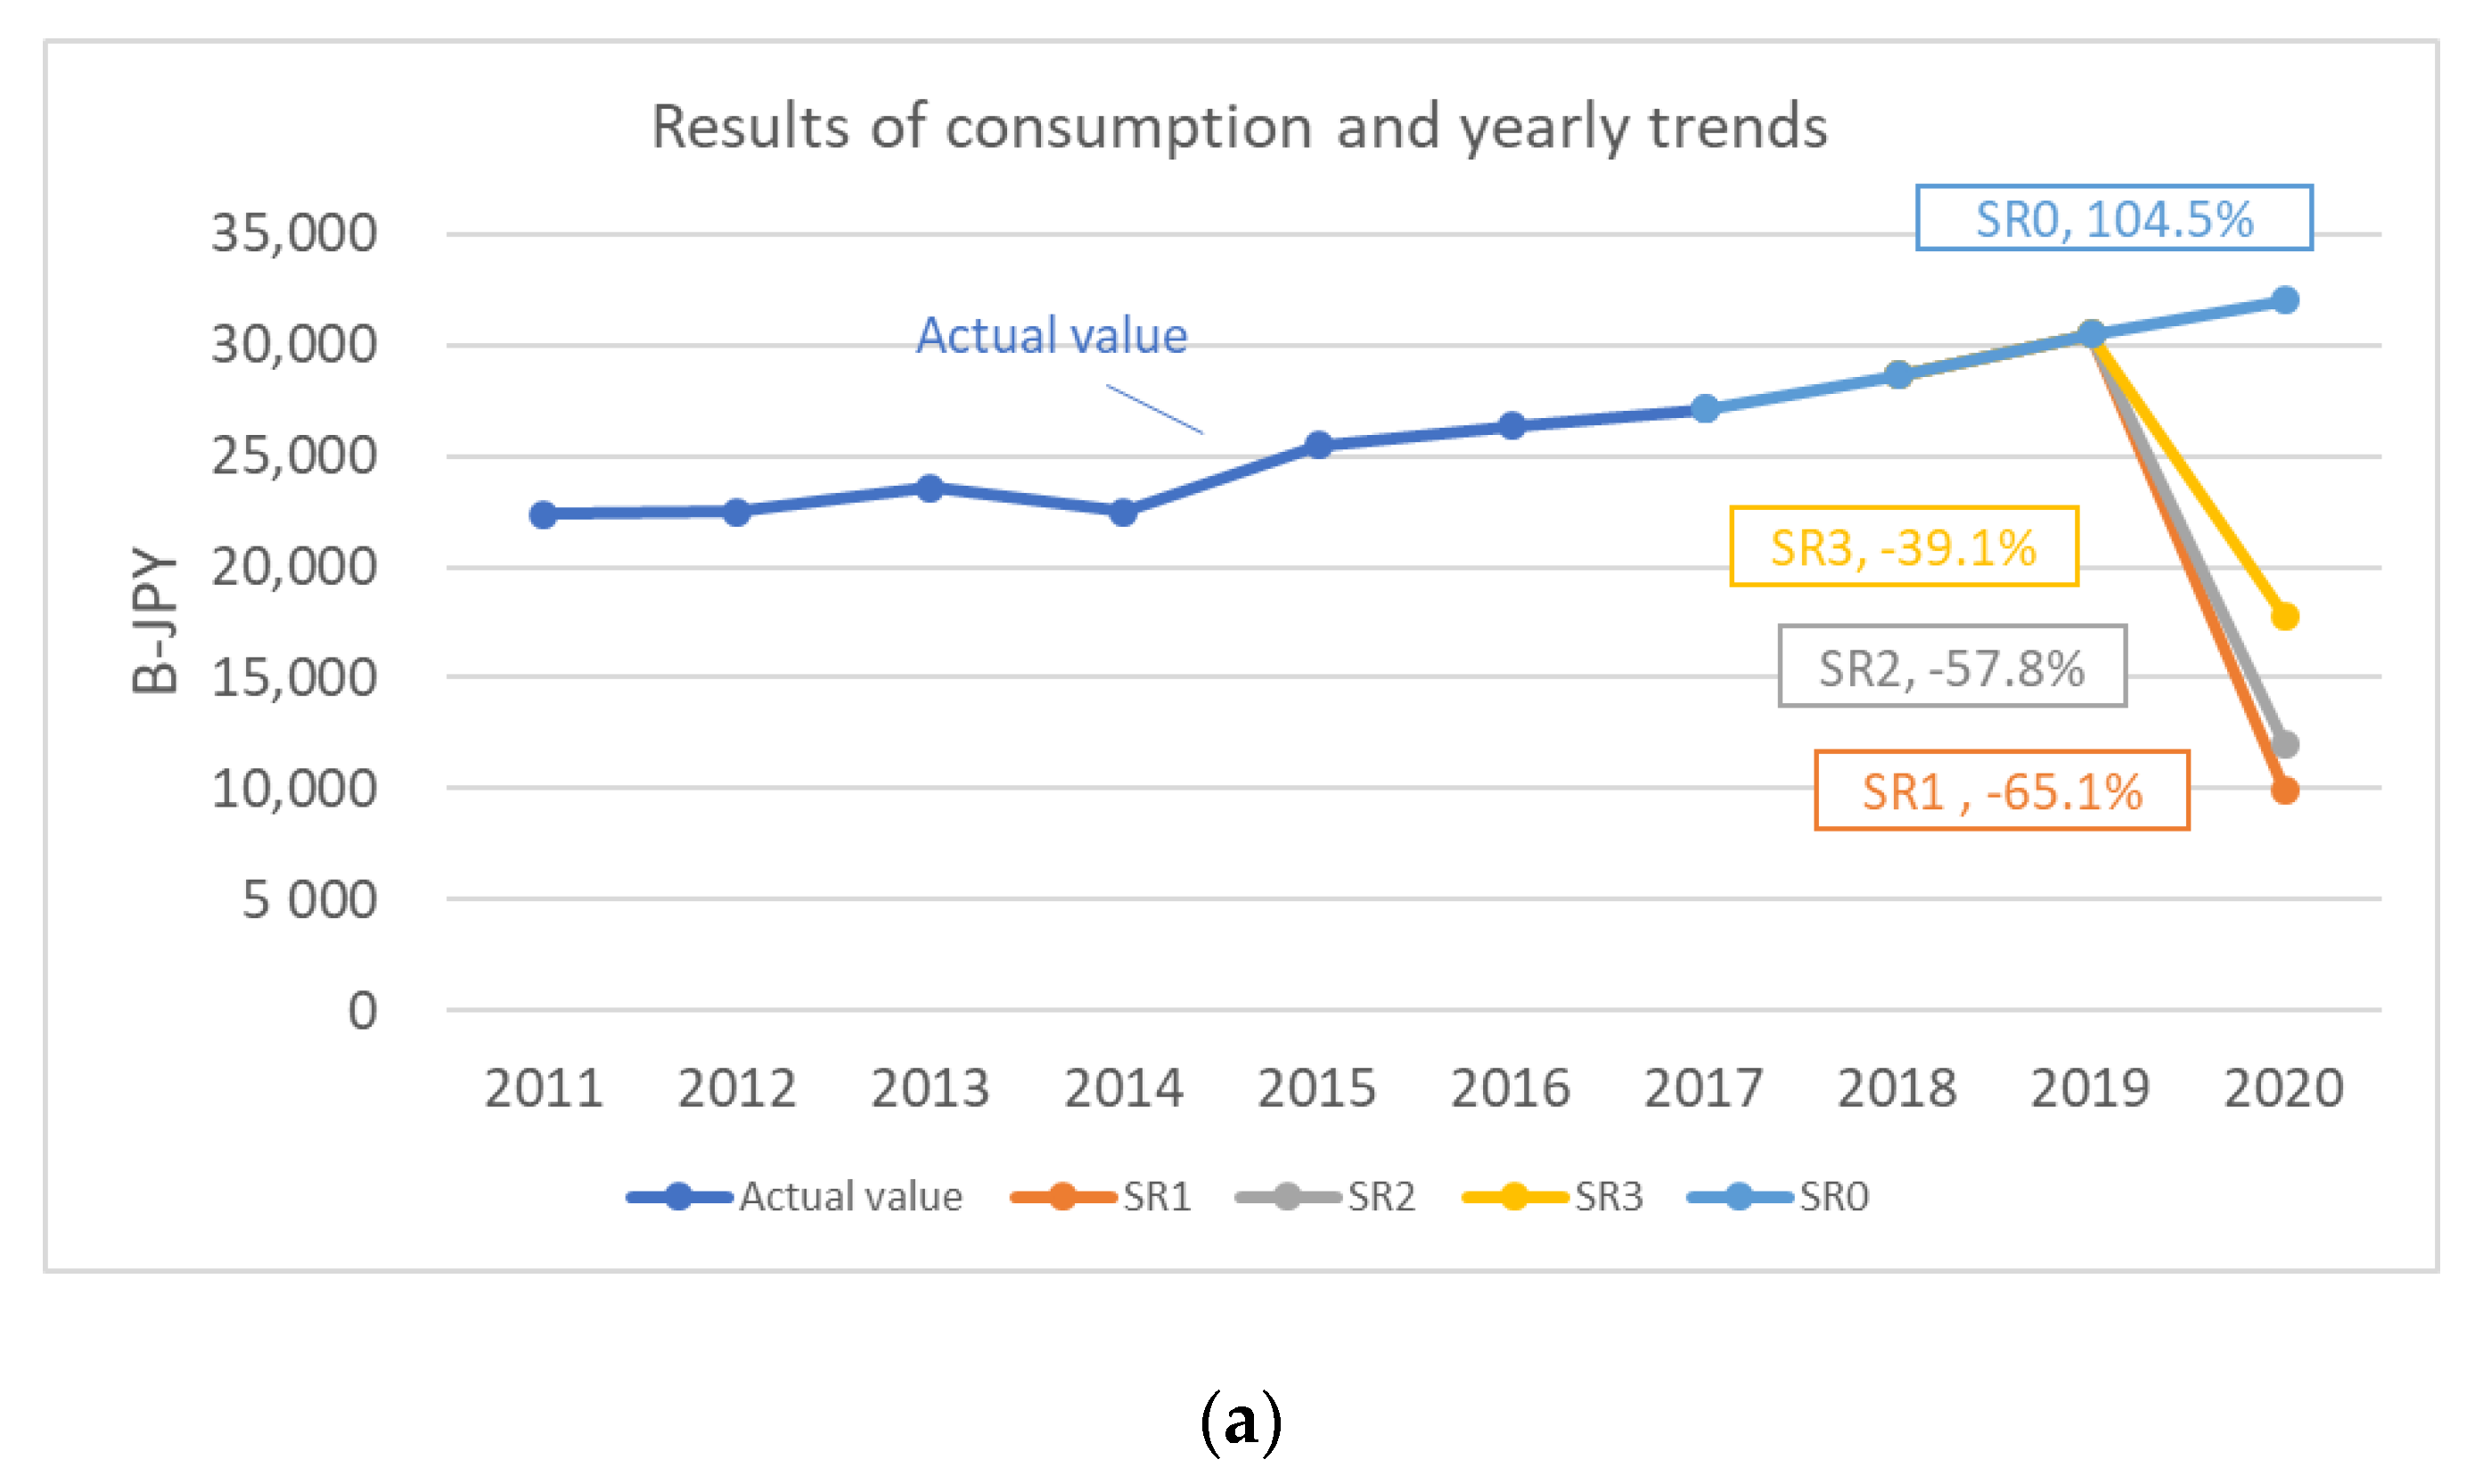
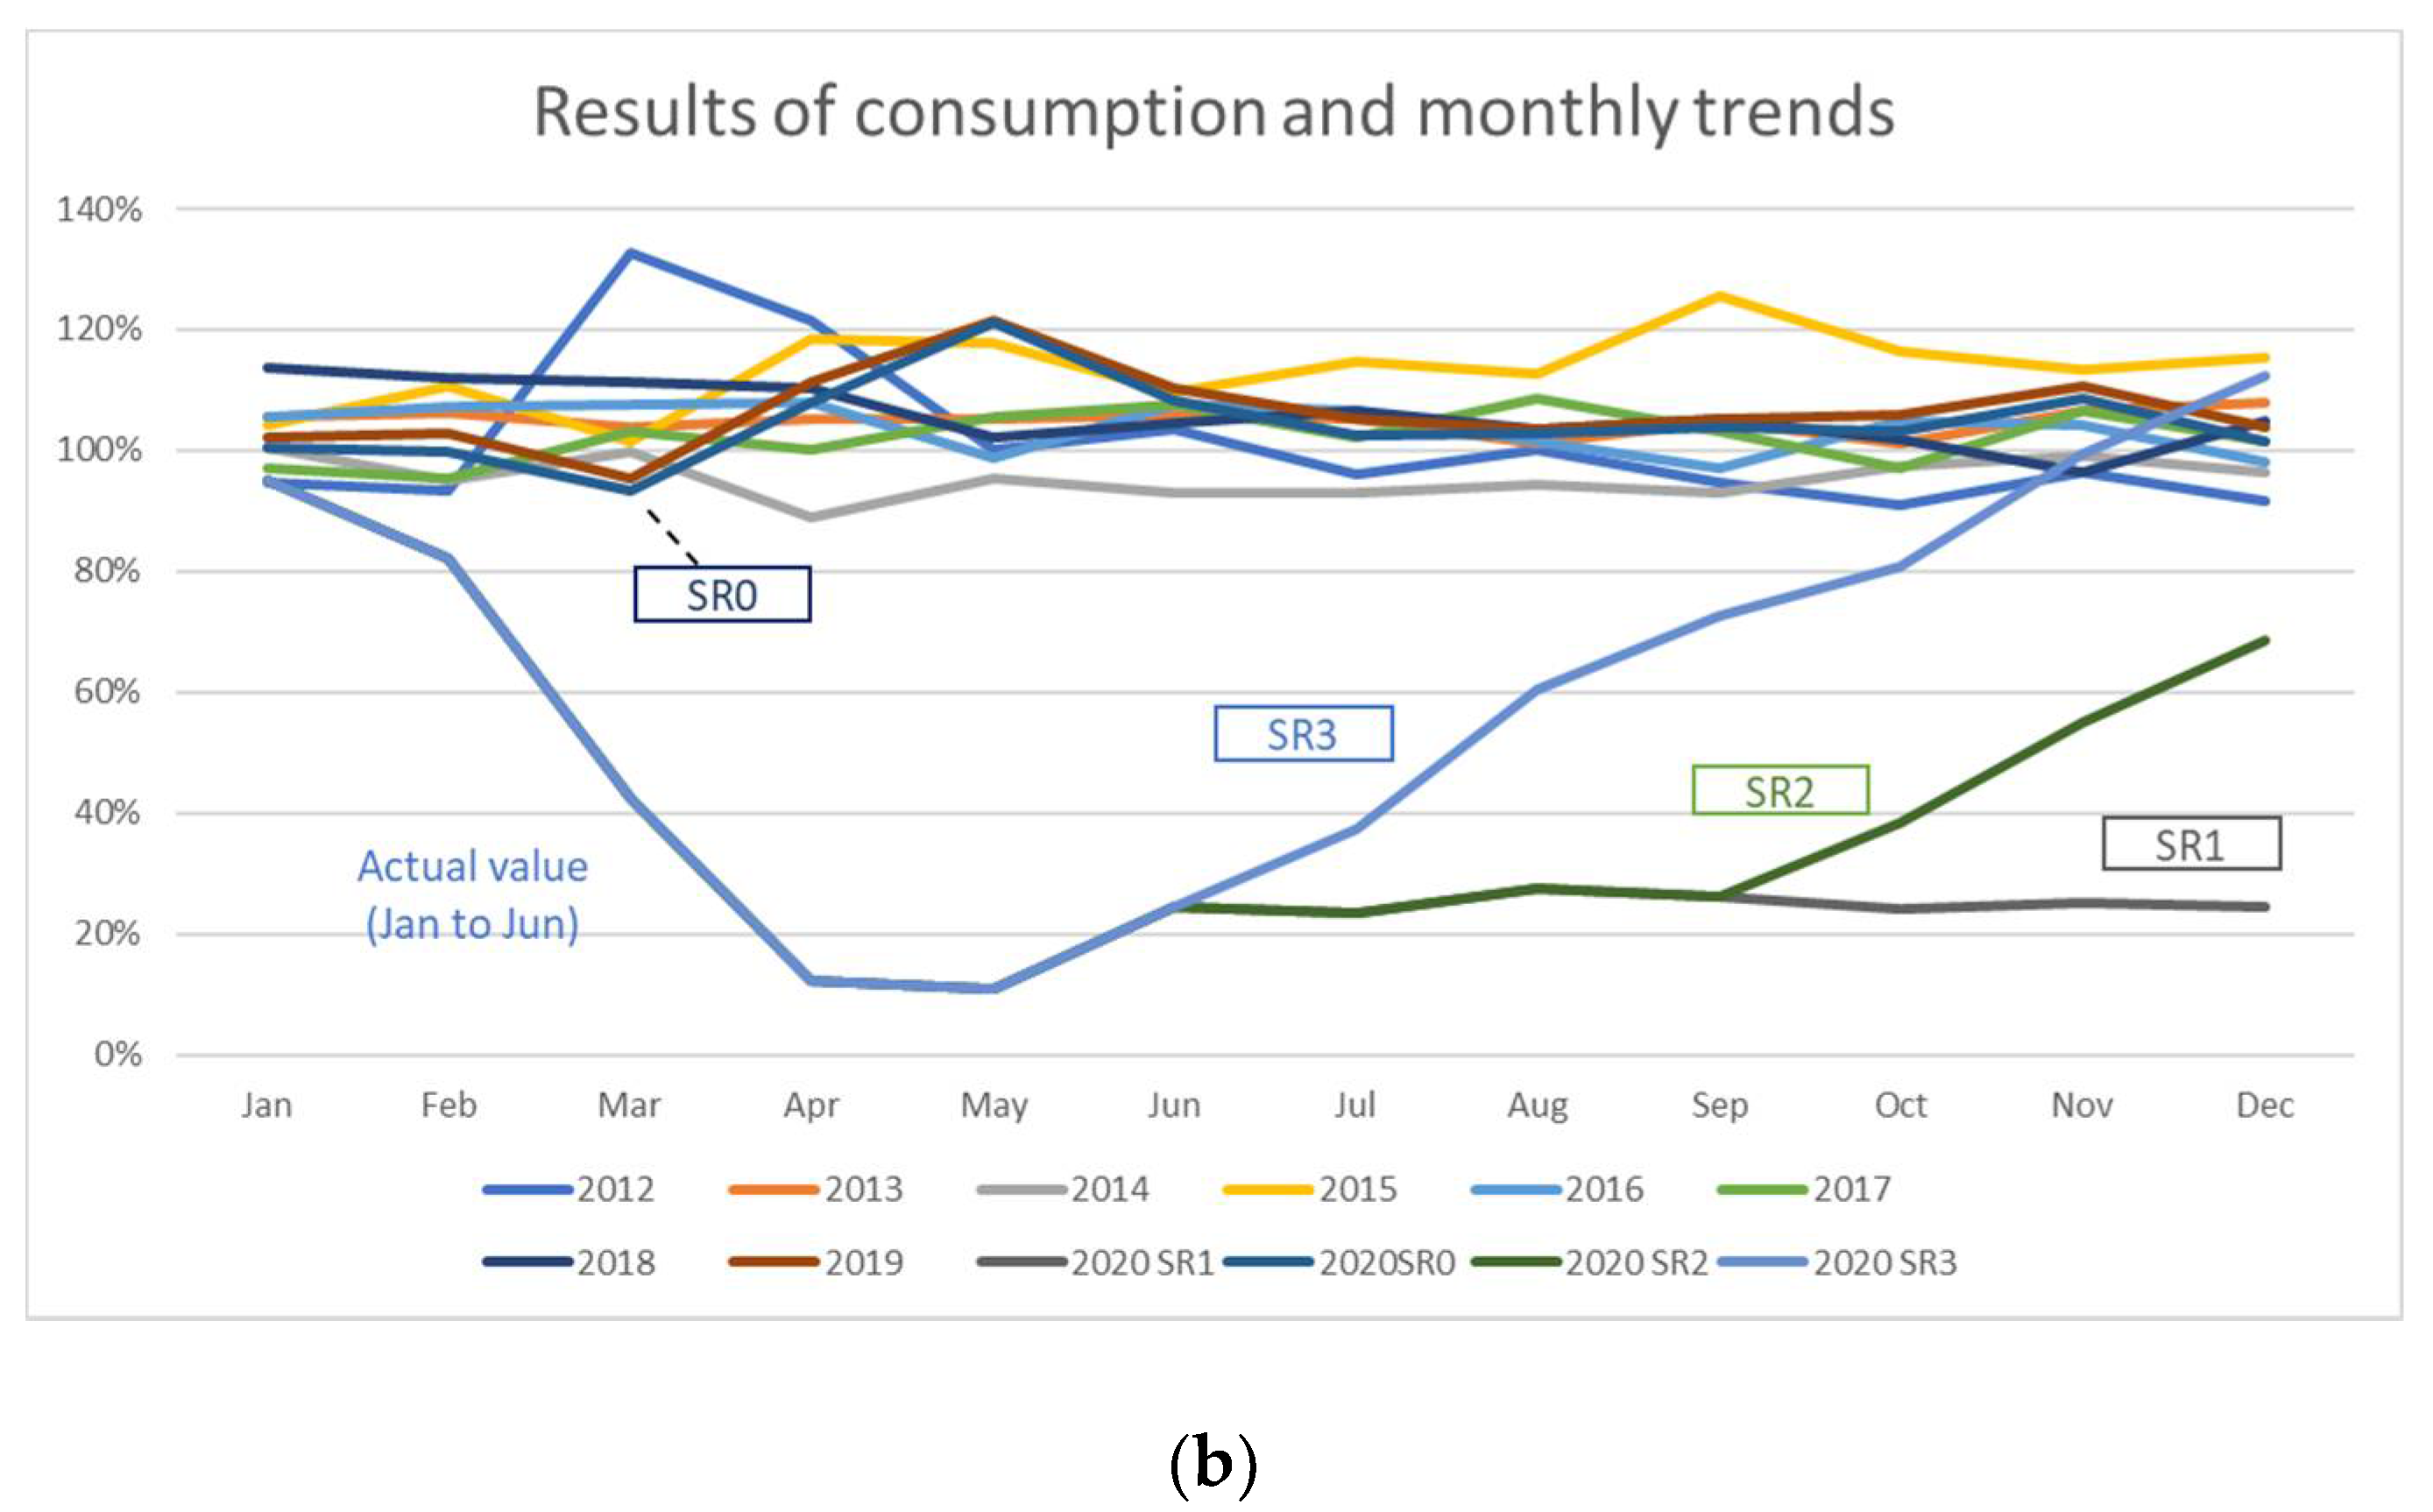
3.2. Economic Analysis
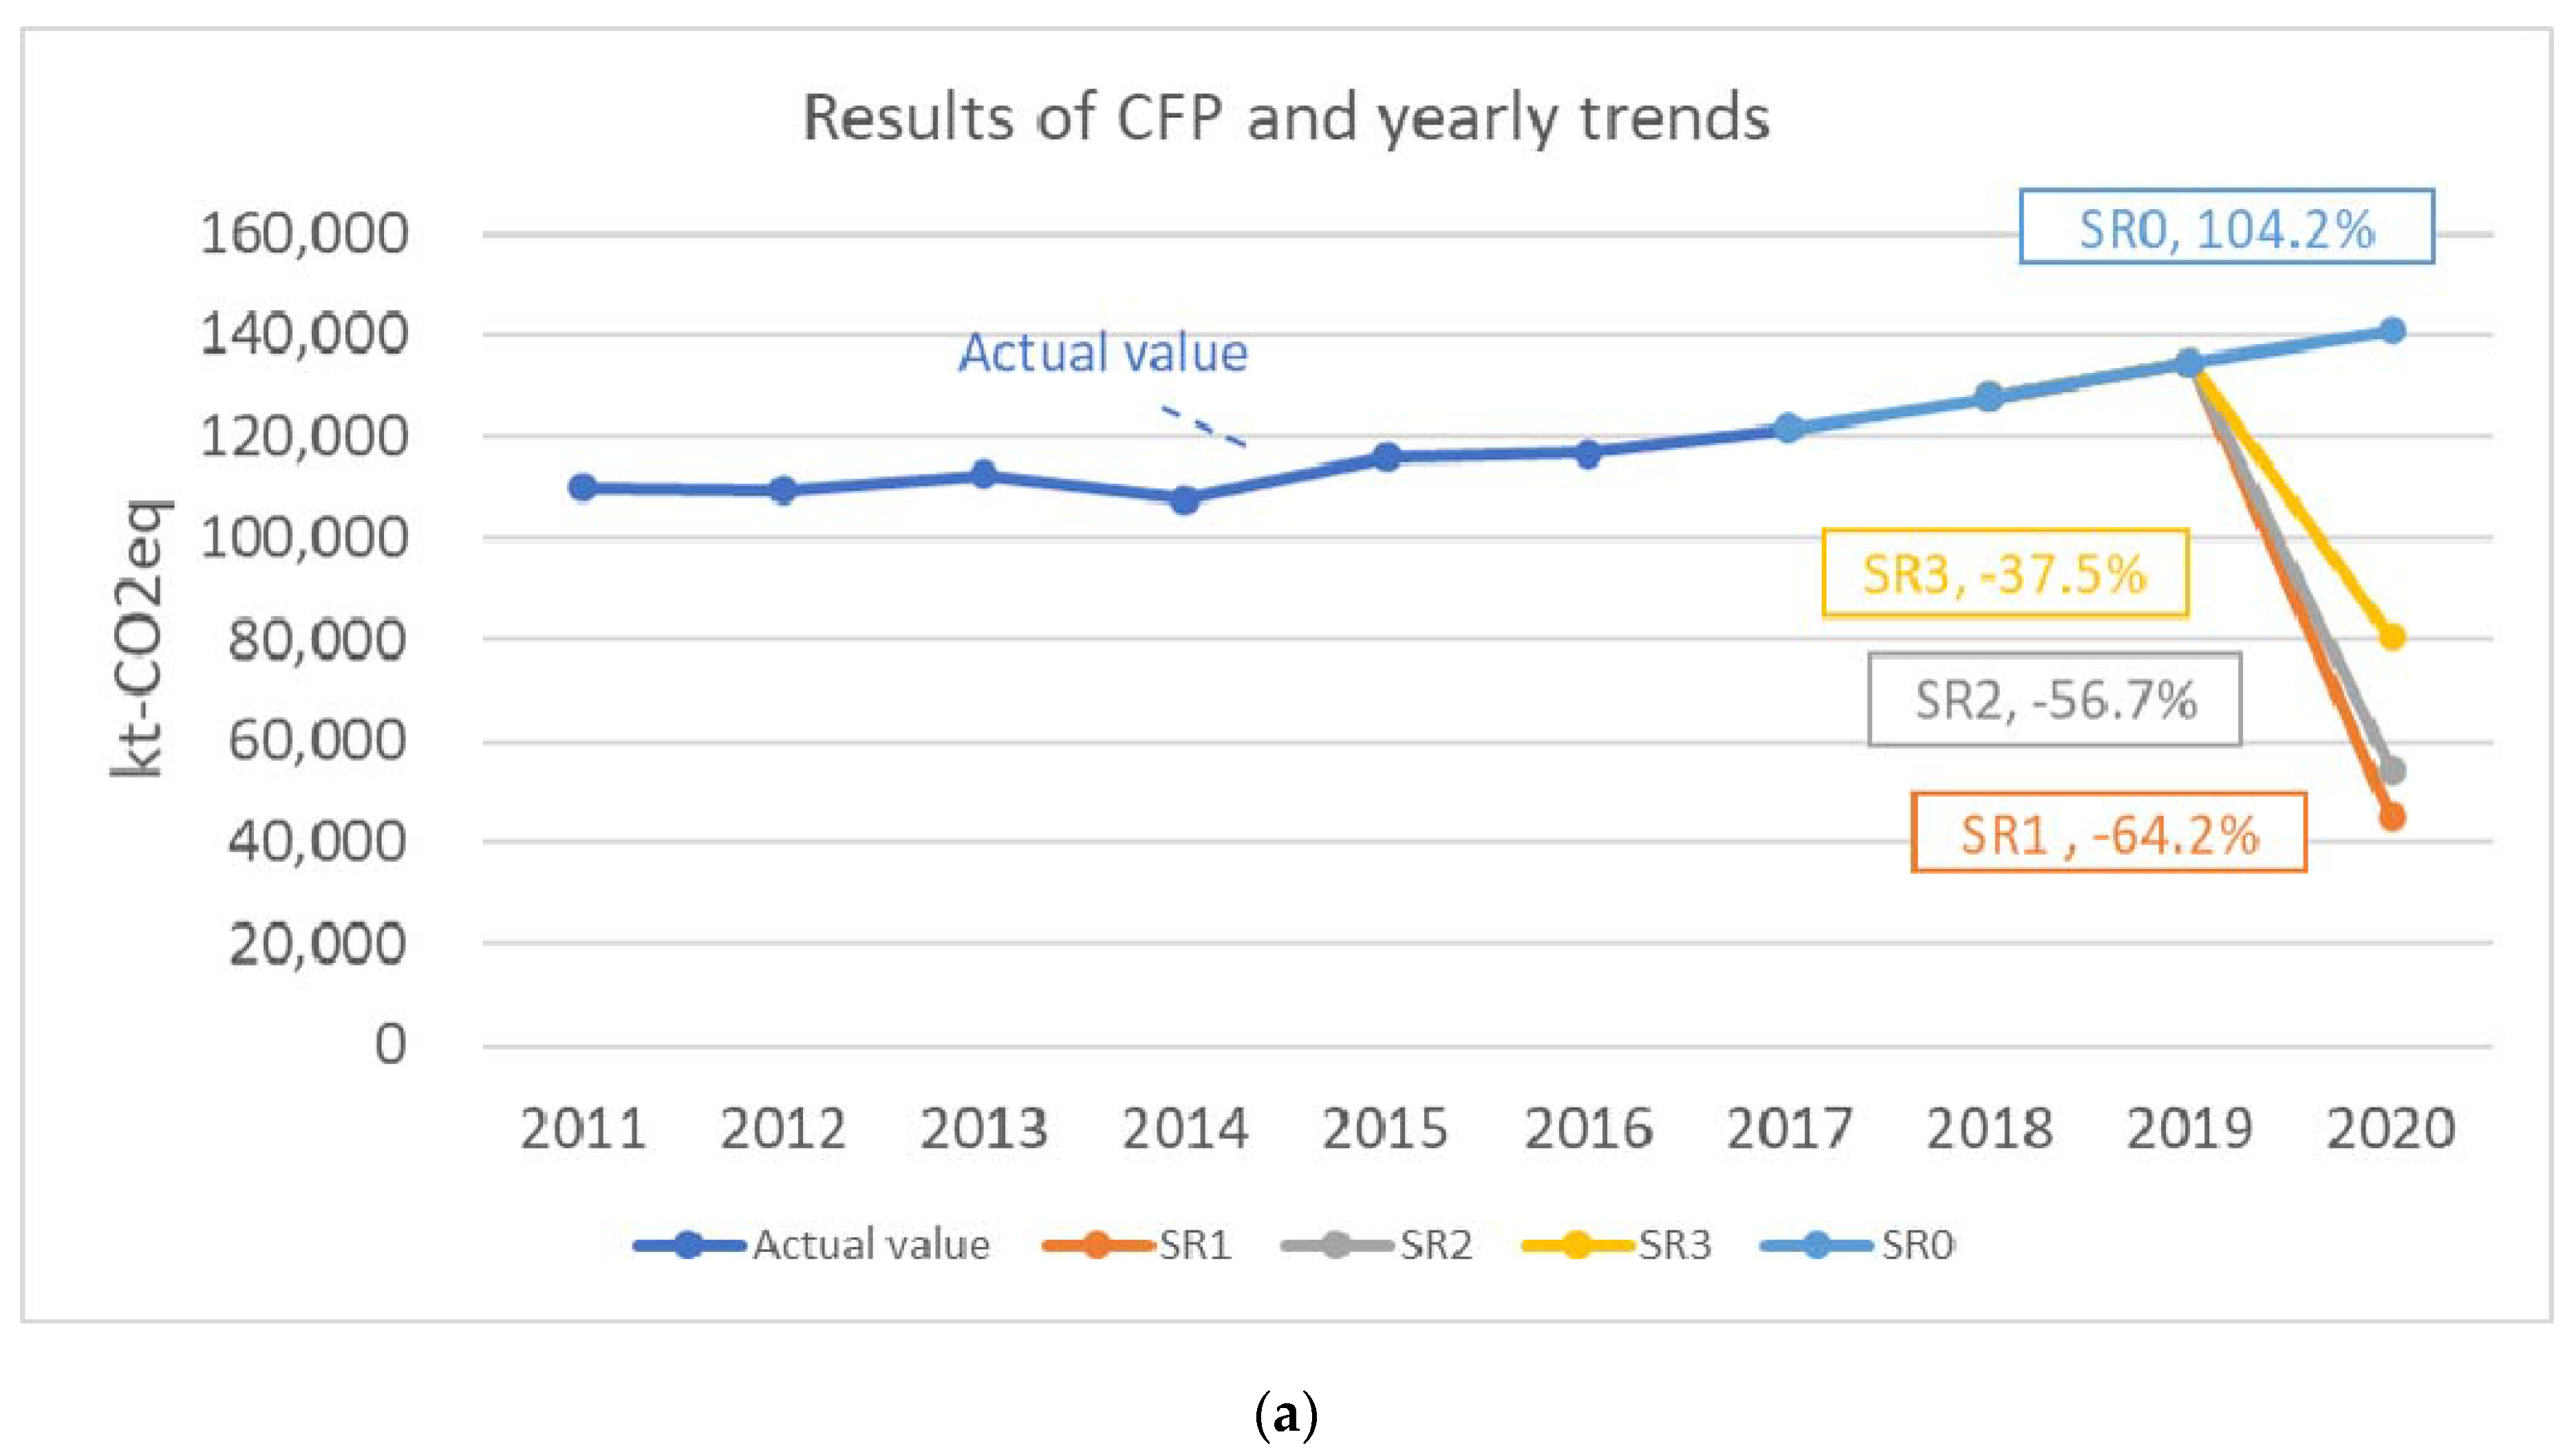
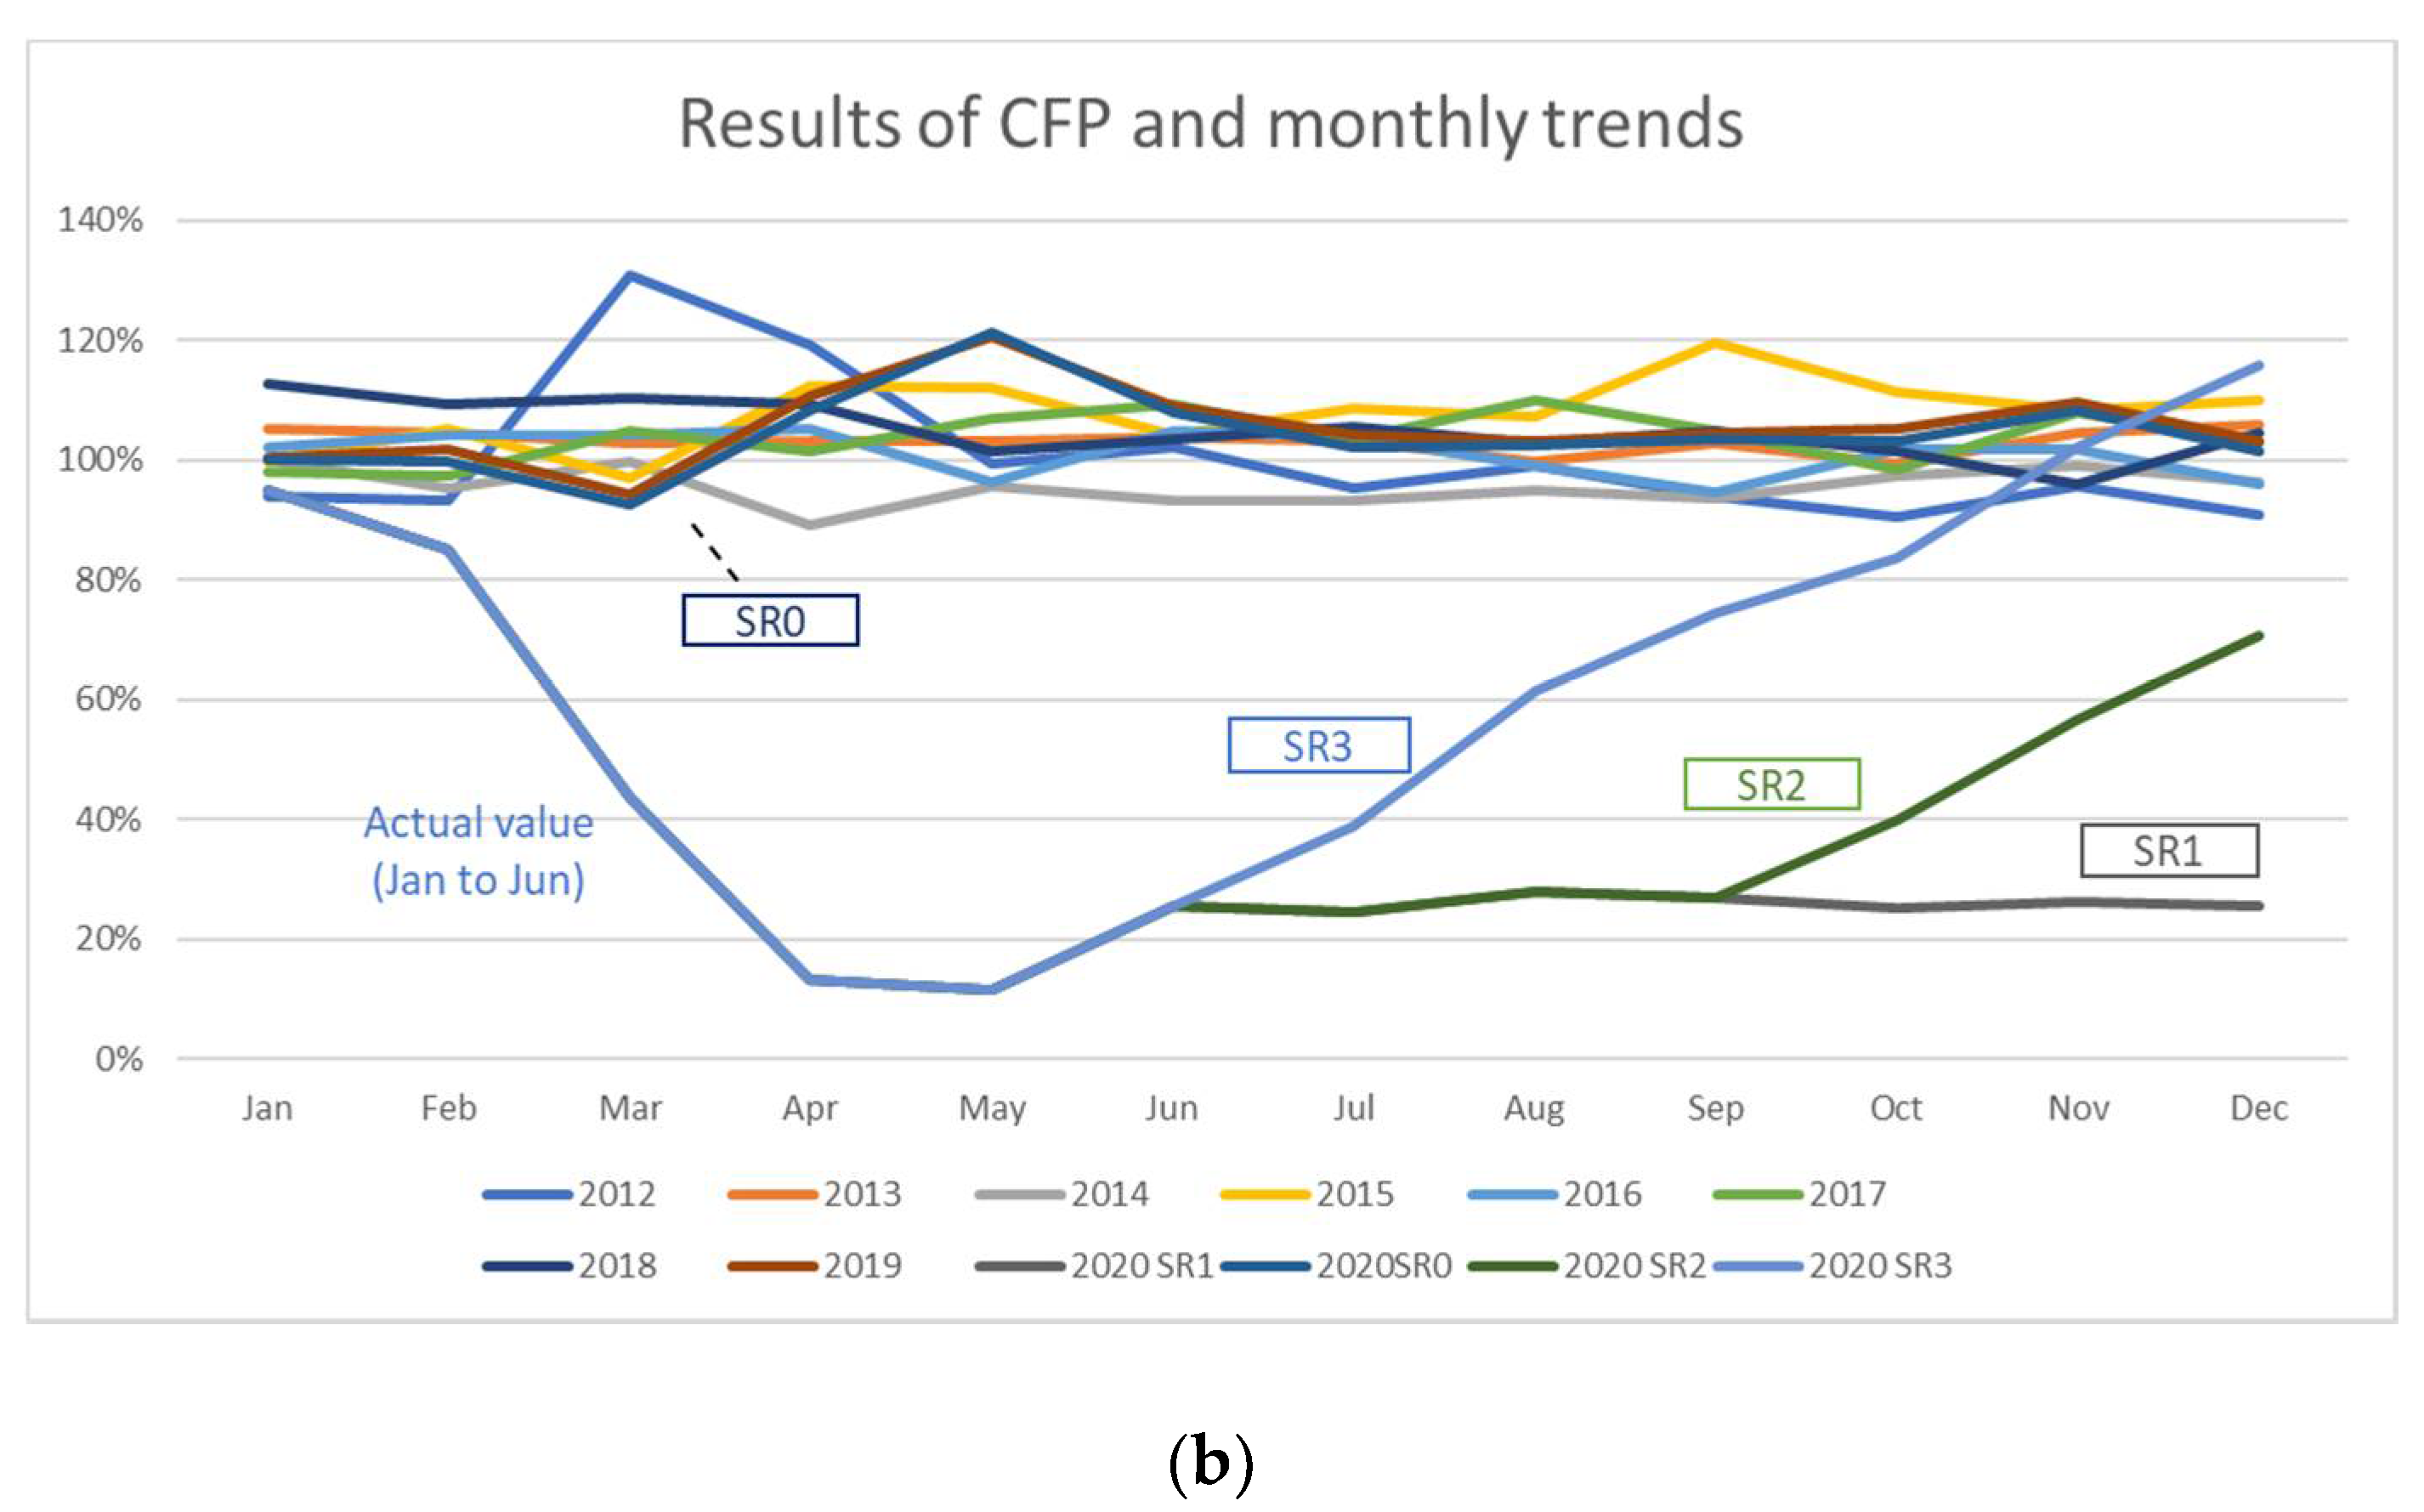
3.3. Environmental Analysis
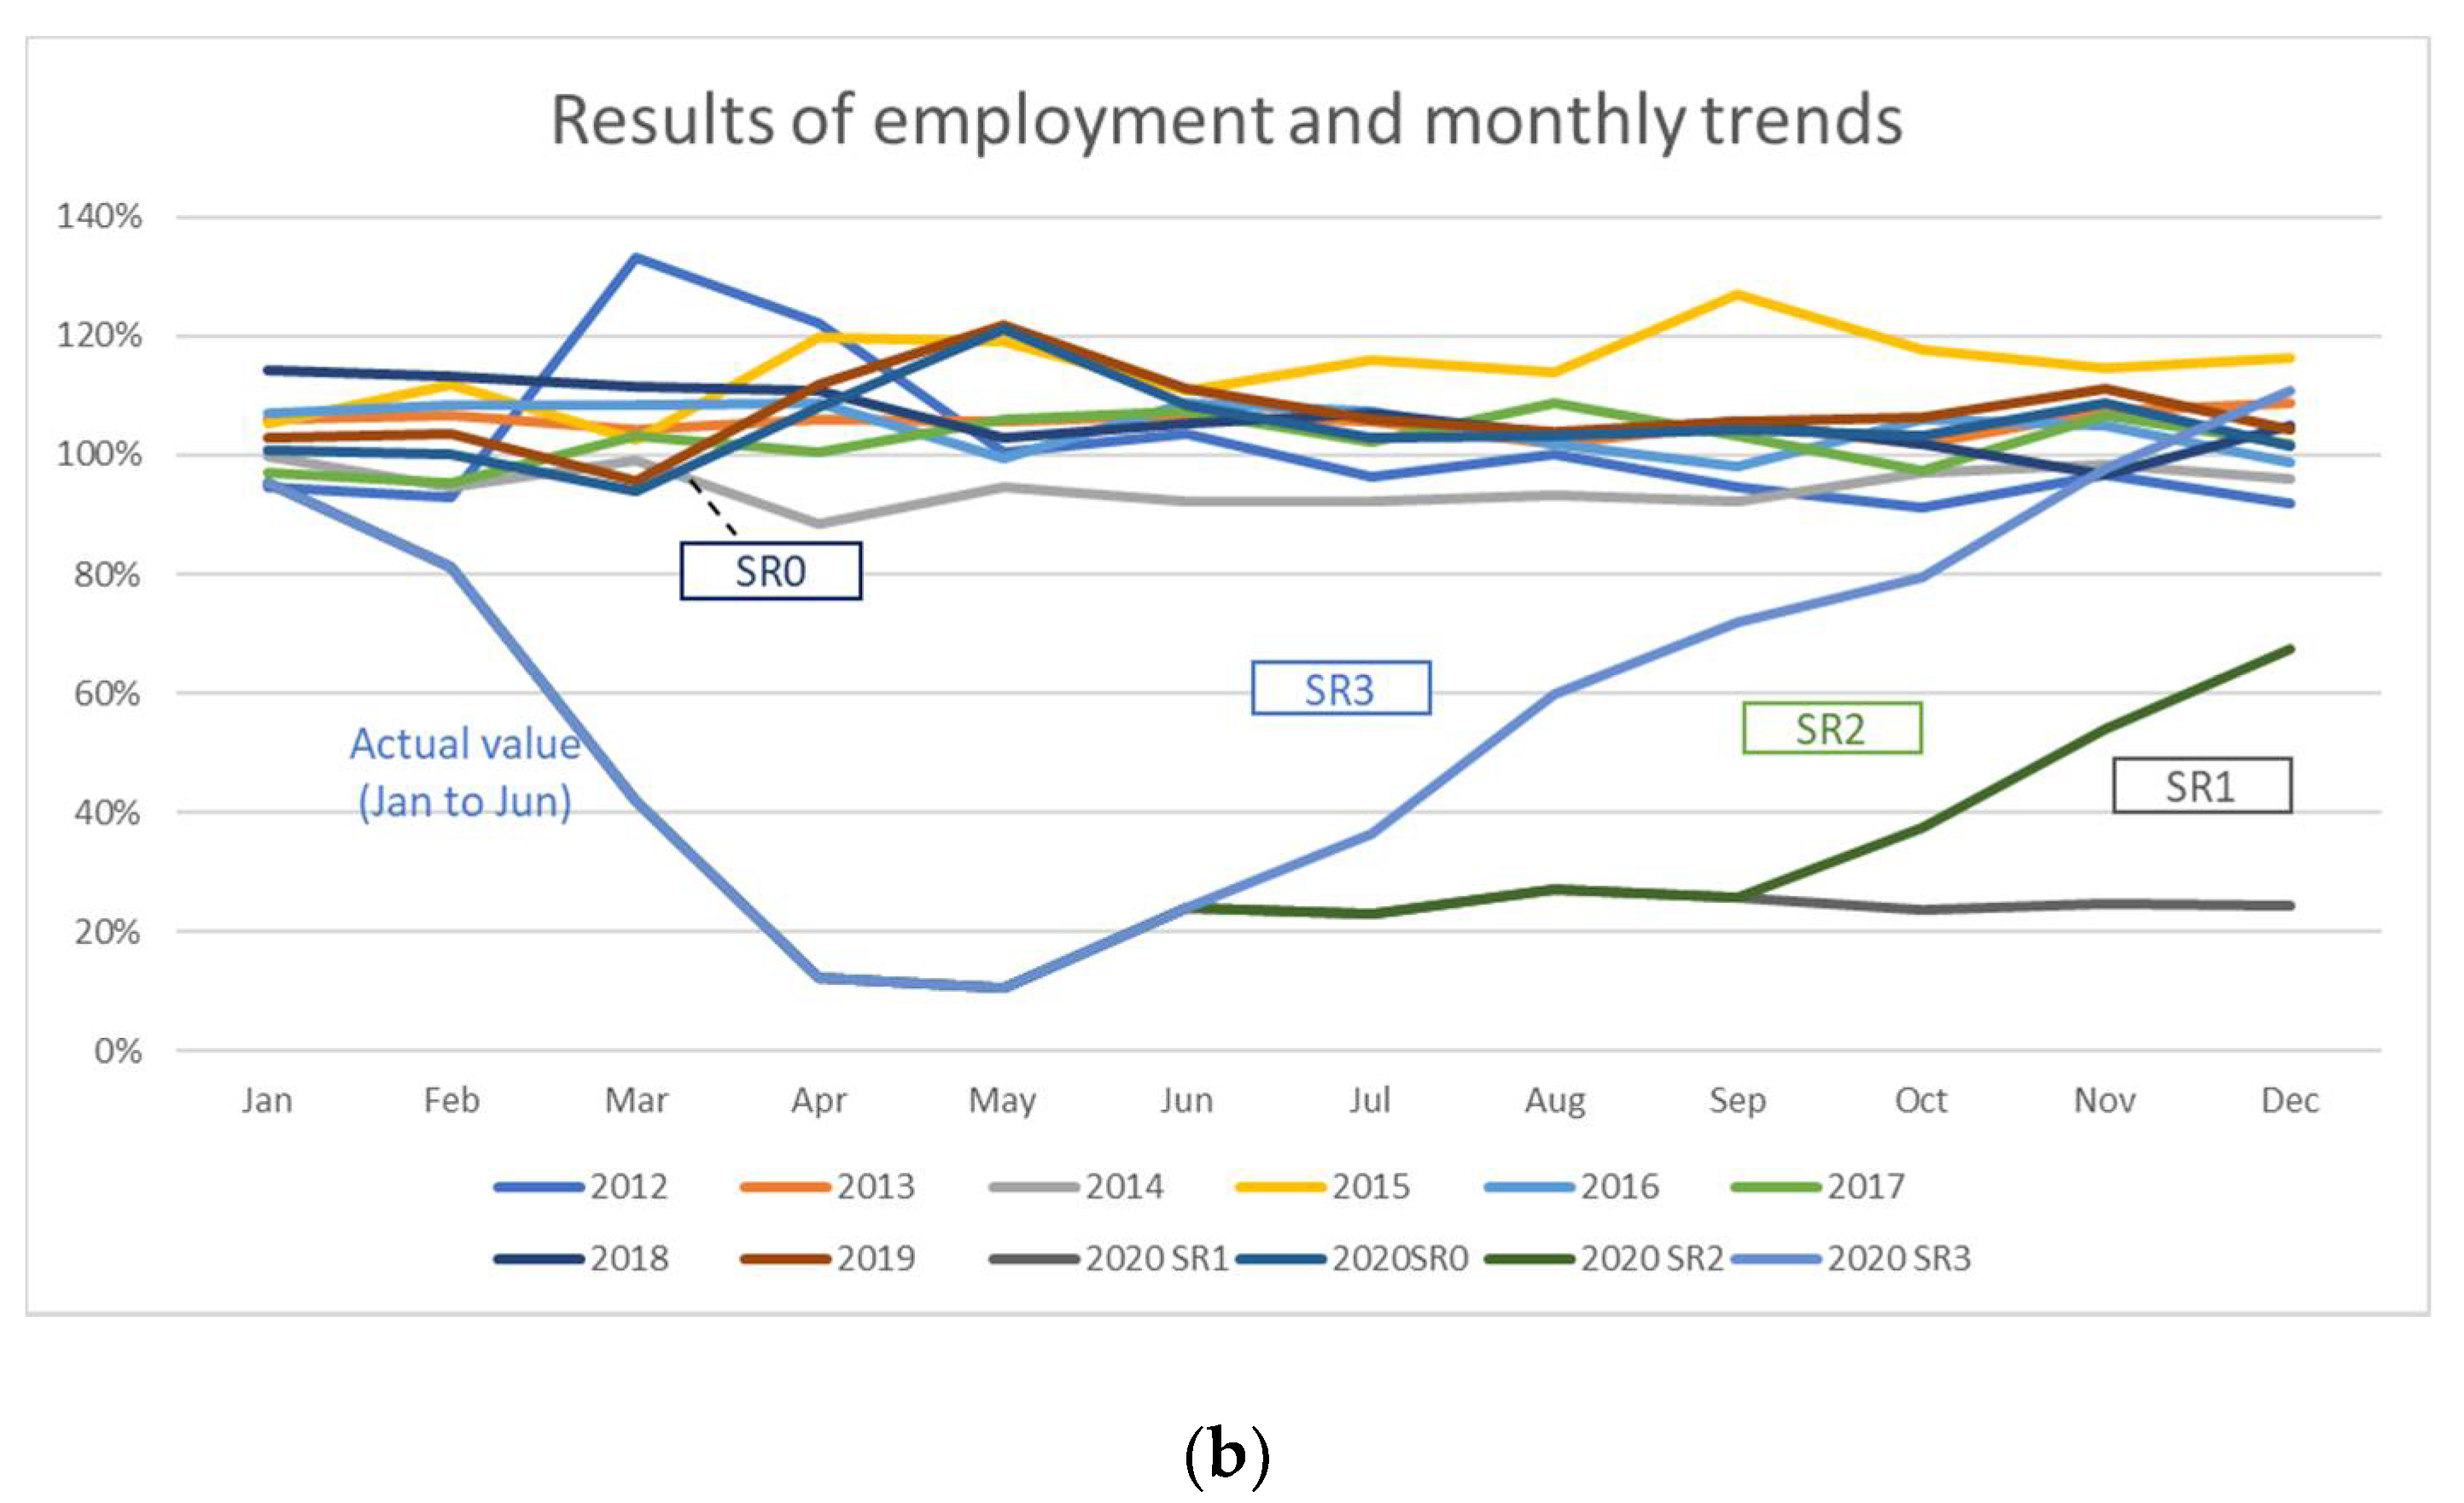
3.4. Social Analysis
4. Discussion
4.1. The current Economic Situation
4.2. The Latest Situation of the Environmental Aspect
4.3. The Latest Situation of Social Aspect
4.4. Limitations and Future Investigations
5. Conclusions
Author Contributions
Funding
Acknowledgments
Conflicts of Interest
Appendix A

| Product and Service | Coefficient | Input–Output Table Items | ||||
|---|---|---|---|---|---|---|
| Social (Employment) | Environment (CFP) | |||||
| (Paid Officer/JPY) | (Permanent Employer/JPY) | Temporary Employer/JPY) | (kg-CO2eq/JPY) | Low Code | Code Name | |
| Travel agencies, tour operators and tourist guide services | ||||||
| Travel agencies, tour operators, and tourist guide services | 7.10 × 10⁻⁹ | 1.25 × 10⁻⁷ | 7.92 × 10⁻⁹ | 6.88 × 10⁻⁴ | 5789090 | Travel and other transportation incidental services |
| Passenger transport | ||||||
| Airplane (domestic, local) | 3.75 × 10⁻⁹ | 7.61 × 10⁻⁸ | 3.53 × 10⁻⁹ | 1.01 × 10⁻² | 5751010 | Air transport |
| Airplane (international flight) | 3.75 × 10⁻⁹ | 7.61 × 10⁻⁸ | 3.53 × 10⁻⁹ | 1.01 × 10⁻² | 5751010 | Air transport |
| Bullet train | 2.36 × 10⁻⁹ | 5.67 × 10⁻⁸ | 2.51 × 10⁻⁹ | 1.64 × 10⁻³ | 5711010 | Railway transport |
| Railways (excluding bullet train) | 2.36 × 10⁻⁹ | 5.67 × 10⁻⁸ | 2.51 × 10⁻⁹ | 1.64 × 10⁻³ | 5711010 | Railway transport |
| Bus | 6.31 × 10⁻⁹ | 1.63 × 10⁻⁷ | 5.34 × 10⁻⁹ | 4.16 × 10⁻³ | 5721010 | Bus |
| Taxi | 9.36 × 10⁻⁹ | 2.08 × 10⁻⁷ | 4.89 × 10⁻⁹ | 4.93 × 10⁻³ | 5721020 | Taxi |
| Ships (inner service, local) | 6.52 × 10⁻⁹ | 8.17 × 10⁻⁸ | 4.20 × 10⁻⁹ | 1.23 × 10⁻² | 5742010 | Marine and inland water |
| Ships (outbound) | 3.71 × 10⁻⁹ | 5.77 × 10⁸ | 2.63 × 10⁻⁹ | 2.57 × 10⁻³ | 5741010 | Ocean |
| Car rental fee | 4.37 × 10⁻⁹ | 5.25 × 10⁻⁸ | 2.05 × 10⁻⁹ | 7.86 × 10⁻⁴ | 6612010 | Car rental |
| Gasoline cost | 2.69 × 10⁻⁹ | 4.20 × 10⁻⁸ | 1.76 × 10⁻⁹ | 7.55 × 10⁻³ | 2111010 | Petrol |
| - | - | - | 2.10 × 10⁻² | - | Petrol (direct) | |
| Parking lot, toll road charge (except for highway charge), highway charge | 6.92 × 10⁻⁹ | 5.83 × 10⁻⁸ | 2.76 × 10⁻⁹ | 8.98 × 10⁻⁴ | 5789010 | Road |
| Highway charge | 6.92 × 10⁻⁹ | 5.83 × 10⁻⁸ | 2.76 × 10⁻⁹ | 8.98 × 10⁻⁴ | 5789010 | Road |
| Accommodation services | ||||||
| Accommodation services | 8.64 × 10⁻⁹ | 1.30 × 10⁻⁷ | 1.64 × 10⁻⁸ | 2.33 × 10⁻³ | 6711010 | Accommodation |
| Vacation home ownership (imputed) | 1.49 × 10⁻⁹ | 1.35 × 10⁻⁸ | 6.17 ×10⁻¹⁰ | 2.37 × 10⁻⁴ | 5531010 | Vacation home ownership (imputed) |
| Food and beverage | ||||||
| Food and beverage serving services | 9.81 × 10⁻⁹ | 1.96 × 10⁻⁷ | 2.41 × 10⁻⁸ | 2.59 × 10⁻³ | 6721010 | Food and beverage |
| Souvenirs and Shopping | ||||||
| Agricultural products | 5.46 × 10⁻⁹ | 3.99 × 10⁻⁸ | 1.99 × 10⁻⁸ | 2.10 × 10⁻³ | 116090 | Other non-food cropping crops |
| Agricultural processed products | 7.93 × 10⁻⁹ | 1.07 × 10⁻⁷ | 1.09 × 10⁻⁸ | 3.12 × 10⁻³ | 1116020 | Agro-preserved food products (except bottles and cans) |
| Marine products | 1.86 × 10⁻⁸ | 1.28 × 10⁻⁷ | 3.49 × 10⁻⁸ | 6.07 × 10⁻³ | 172001 | Inland fishery and aquaculture |
| Fisheries processed products | 8.85 × 10⁻⁹ | 1.10 × 10⁻⁷ | 9.34 × 10⁻⁹ | 5.04 × 10⁻³ | 1113090 | Other seafood |
| Confectionery | 9.41 × 10⁻⁹ | 1.22 × 10⁻⁷ | 1.24 × 10⁻⁸ | 3.66 × 10⁻³ | 1115030 | Confectionery |
| Other food items | 1.27 × 10⁻⁸ | 1.34 × 10⁻⁷ | 1.71 × 10⁻⁸ | 5.54 × 10⁻³ | 1119090 | Food items |
| Fiber products | 1.04 × 10⁻⁸ | 1.29 × 10⁻⁷ | 5.58 × 10⁻⁹ | 6.58 × 10⁻³ | 1519090 | Textile products |
| Shoes, bags | 8.51 × 10⁻⁹ | 1.16 × 10⁻⁷ | 7.23 × 10⁻⁹ | 3.05 × 10⁻³ | 2229010 | Footwear |
| Ceramics and glass products | 1.23 × 10⁻⁸ | 1.55 × 10⁻⁷ | 9.54 × 10⁻⁹ | 2.91 × 10⁻³ | 2312020 | Bags, bags and other leather products |
| Publication | 8.92 × 10⁻⁹ | 9.81 × 10⁻⁸ | 5.41 × 10⁻⁹ | 3.43 × 10⁻³ | 5951030 | Publication |
| Wood products and paper products | 7.33 × 10⁻⁹ | 9.46 × 10⁻⁸ | 3.83 × 10⁻⁹ | 5.62 × 10⁻³ | 1649090 | Other pulp, paper and paper products |
| Medical supplies and Cosmetics | 5.31 × 10⁻⁹ | 8.08 × 10⁻⁸ | 4.08 × 10⁻⁹ | 3.69 × 10⁻³ | 2081020 | Cosmetics |
| Film | 5.48 × 10⁻⁹ | 8.29 × 10⁻⁸ | 2.94 × 10⁻⁹ | 6.18 × 10⁻³ | 2083010 | Photosensitive material |
| Electrical equipment and related products | 5.42 × 10⁻⁹ | 9.09 × 10⁻⁸ | 3.83 × 10⁻⁹ | 3.61 × 10⁻³ | 3321020 | Consumer electrical appliances (except air conditioners) |
| Camera, glasses, watch | 8.57 × 10⁻⁹ | 1.19 × 10⁻⁷ | 6.18 × 10⁻⁹ | 3.26 × 10⁻³ | 3919090 | Other manufactured industrial products |
| Sports equipment · CD · stationery | 8.57 × 10⁻⁹ | 1.19 × 10⁻⁷ | 6.18 × 10⁻⁹ | 3.26 × 10⁻³ | 3919090 | Other manufactured industrial products |
| Other manufactured products | 8.57 × 10⁻⁹ | 1.19 × 10⁻⁷ | 6.18 × 10⁻⁹ | 3.26 × 10⁻³ | 3919090 | Other manufactured industrial products |
| Activity (Cultural services, Recreation and other entertainment services, and other services) | ||||||
| A day spa warm-bathing facility beauty salon | 8.31 × 10⁻⁹ | 1.44 × 10⁻⁷ | 1.63 × 10⁻⁸ | 3.81 × 10⁻³ | 6731040 | Bathing |
| Museums, museums, zoos and gardens, aquariums | 3.12 × 10⁻⁹ | 1.23 × 10⁻⁷ | 2.91 × 10⁻⁸ | 2.30 × 10⁻³ | 6312010 | Social education (public) |
| Watching sports and Art appreciation | 5.52 × 10⁻⁹ | 7.73 × 10⁻⁸ | 1.60 × 10⁻⁸ | 1.01 × 10⁻³ | 6741020 | Office space (except movie theaters) and entertainment companies |
| Amusement parks and expositions | 5.52 × 10⁻⁹ | 7.73 × 10⁻⁸ | 1.60 × 10⁻⁸ | 1.01 × 10⁻³ | 6741020 | Office space (except movie theaters) and entertainment companies |
| Sports Facilities | 5.97 × 10⁻⁹ | 1.29 × 10⁻⁷ | 1.80 × 10⁻⁸ | 1.34 × 10⁻³ | 6741040 | Sports facility offer work, park, amusement park |
| Ski lift fee | 2.36 × 10⁻⁹ | 5.67 × 10⁻⁸ | 2.51 × 10⁻⁹ | 1.64 × 10⁻³ | 5711010 | Railway |
| camp site | 5.97 × 10⁻⁹ | 1.29 × 10⁻⁷ | 1.80 × 10⁻⁸ | 1.34 × 10⁻³ | 6741040 | Sports facility offer work, park, amusement park |
| Exhibition and convention participation fee | 8.48 × 10⁻⁹ | 8.87 × 10⁻⁸ | 7.87 × 10⁻⁹ | 6.27 × 10⁻⁴ | 6699090 | Other business services |
| Tourist farm | 4.05 × 10⁻⁹ | 1.03 × 10⁻⁷ | 2.04 × 10⁻⁸ | 4.56 × 10⁻³ | 131020 | Agricultural services (except for veterinary services) |
| Fishing boat | 6.78 × 10⁻⁹ | 1.27 × 10⁻⁷ | 1.44 × 10⁻⁸ | 1.45 × 10⁻³ | 6741090 | Other entertainment |
| Guide fee | 6.60 × 10⁻⁹ | 8.15 × 10⁻⁸ | 1.37 × 10⁻⁸ | 8.22 × 10⁻⁴ | 6799090 | Other personal services |
| Rental charge | 4.94 × 10⁻⁹ | 5.63 × 10⁻⁸ | 2.72 × 10⁻⁹ | 7.80 × 10⁻⁴ | 6611010 | Goods rental business (excluding rental cars) |
| Massage | 6.28 × 10⁻⁹ | 1.37 × 10⁻⁷ | 9.55 × 10⁻⁹ | 1.06 × 10⁻³ | 6411050 | Medical (other medical services) |
| Photo shoot fee | 1.39 × 10⁻⁸ | 1.11 × 10⁻⁷ | 1.61 × 10⁻⁸ | 1.10 × 10⁻³ | 6799010 | Photography |
| Mail and communication charges | 1.58 × 10⁻⁹ | 2.01 × 10⁻⁷ | 4.28 × 10⁻⁹ | 1.51 × 10⁻³ | 5791010 | Postal and letter mail |
| Home delivery | 8.47 × 10⁻⁹ | 1.42 × 10⁻⁷ | 9.28 × 10⁻⁹ | 1.38 × 10⁻² | 5722010 | Delivery |
| Travel insurance · Credit card admission fee | 3.87 × 10⁻⁹ | 9.13 × 10⁻⁸ | 2.27 × 10⁻⁹ | 6.78 × 10⁻⁴ | 5312010 | Life insurance |
| Passport application fee | 2.34 × 10⁻⁹ | 7.28 × 10⁻⁸ | 3.04 × 10⁻⁹ | 8.16 × 10⁻⁴ | 6112010 | Government (local) |
| Visa application fee | 2.34 × 10⁻⁹ | 7.28 × 10⁻⁸ | 3.04 × 10⁻⁹ | 8.16 × 10⁻⁴ | 6112010 | Government (local) |
| Hairdresser/Barber | 8.45 × 10⁻⁹ | 1.18 × 10⁻⁷ | 1.16 × 10⁻⁸ | 9.50 × 10⁻⁴ | 6731030 | Beauty industry |
| Develop and print photos | 6.60 × 10⁻⁹ | 8.15 × 10⁻⁸ | 1.37 × 10⁻⁸ | 8.22 × 10⁻⁴ | 6799090 | Other personal services |
| laundry service | 6.77 × 10⁻⁹ | 1.42 × 10⁻⁷ | 1.28 × 10⁻⁸ | 1.74 × 10⁻³ | 6731010 | Laundry service |
| Other | 6.60 × 10⁻⁹ | 8.15 × 10⁻⁸ | 1.37 × 10⁻⁸ | 8.22 × 10⁻⁴ | 6799090 | Other personal services |
| Products | 2011 | 2012 | 2013 | 2014 | 2015 | 2016 | 2017 | 2018 | 2019 | 2020 | |||
|---|---|---|---|---|---|---|---|---|---|---|---|---|---|
| SR1 | SR2 | SR3 | SR0 | ||||||||||
| Travel agencies, operators, and guides | |||||||||||||
| Travel agencies, tour operators, and tourist guide services | 415.9 | 436.7 | 457.0 | 424.2 | 454.1 | 438.1 | 439.2 | 450.4 | 463.3 | 135.3 | 160.3 | 230.6 | 470.9 |
| Transport | |||||||||||||
| Airplane (domestic, local) | 1314.0 | 1304.5 | 1319.0 | 1348.1 | 1464.0 | 1395.1 | 1438.9 | 1469.6 | 1502.2 | 576.0 | 708.9 | 1085.9 | 1606.3 |
| Airplane (international flight) | 708.1 | 747.1 | 818.0 | 921.4 | 976.2 | 962.0 | 1052.0 | 1141.6 | 1255.1 | 180.9 | 182.8 | 185.0 | 1210.7 |
| Bullet train | 1743.1 | 1873.6 | 1952.0 | 1981.2 | 2364.6 | 2489.8 | 2352.6 | 2472.2 | 2614.0 | 910.1 | 1104.0 | 1646.8 | 2755.7 |
| Railways (excluding bullet train) | 753.9 | 711.8 | 771.0 | 662.2 | 751.6 | 766.8 | 729.2 | 743.8 | 758.7 | 299.5 | 366.4 | 553.3 | 799.9 |
| Bus | 525.0 | 460.8 | 471.0 | 373.9 | 395.3 | 434.3 | 439.6 | 448.6 | 457.8 | 181.5 | 221.7 | 333.7 | 481.2 |
| Taxi | 157.9 | 150.6 | 161.0 | 181.4 | 194.8 | 233.8 | 211.7 | 230.9 | 254.7 | 73.4 | 87.3 | 126.5 | 266.6 |
| Ships (inner service, local) | 104.5 | 107.2 | 101.0 | 100.5 | 110.8 | 110.5 | 114.0 | 117.6 | 121.6 | 45.2 | 55.5 | 84.7 | 130.1 |
| Ships (outbound) | 4.1 | 3.9 | 3.0 | 4.9 | 5.5 | 4.3 | 4.7 | 4.9 | 5.2 | 0.8 | 0.8 | 0.8 | 4.9 |
| Car rental fee | 260.3 | 274.1 | 322.0 | 259.9 | 302.8 | 361.8 | 344.9 | 362.2 | 382.7 | 132.6 | 161.5 | 243.1 | 406.5 |
| Gasoline cost | 1211.2 | 1189.2 | 1189.0 | 1096.7 | 1047.5 | 1013.2 | 1102.5 | 1125.3 | 1148.5 | 460.6 | 564.1 | 852.8 | 1212.7 |
| Parking lot, toll road charge (except for highway charge) | 378.0 | 260.4 | 260.0 | 314.7 | 279.8 | 279.8 | 291.4 | 297.2 | 303.1 | 118.8 | 145.2 | 218.8 | 318.8 |
| Highway charge | 660.7 | 754.8 | 798.0 | 738.5 | 844.6 | 891.5 | 967.5 | 987.1 | 1007.2 | 402.4 | 493.2 | 746.7 | 1065.1 |
| Accommodation | |||||||||||||
| Accommodation services | 3478.9 | 3681.1 | 3844.0 | 3619.8 | 4305.7 | 4544.7 | 4791.4 | 5147.0 | 5582.5 | 1717.2 | 2074.7 | 3091.2 | 5927.8 |
| Vacation home ownership (imputed) | 407.0 | 405.7 | 404.0 | 437.0 | 441.7 | 446.4 | 451.1 | 459.0 | 467.0 | 182.6 | 226.0 | 349.9 | 504.2 |
| Food and beverage | |||||||||||||
| Food and beverage serving services | 2422.3 | 2488.5 | 2724.0 | 2653.7 | 3142.8 | 3395.0 | 3514.2 | 3774.4 | 4091.7 | 1285.4 | 1545.8 | 2275.6 | 4304.8 |
| Souvenirs | |||||||||||||
| Agricultural products | 157.4 | 147.2 | 173.0 | 144.9 | 157.8 | 166.3 | 179.3 | 183.1 | 187.0 | 75.7 | 92.5 | 139.4 | 196.8 |
| Agricultural processed products | 104.7 | 96.2 | 96.0 | 99.8 | 94.1 | 99.6 | 103.0 | 105.1 | 107.2 | 43.1 | 52.8 | 80.0 | 113.4 |
| Marine products | 191.4 | 191.3 | 181.0 | 143.8 | 159.6 | 169.5 | 134.9 | 137.6 | 140.4 | 56.2 | 69.0 | 104.8 | 149.0 |
| Fisheries processed products | 171.8 | 163.8 | 172.0 | 145.0 | 149.8 | 147.3 | 152.7 | 155.8 | 158.9 | 63.6 | 78.1 | 118.6 | 168.6 |
| Confectionery | 1418.5 | 1418.2 | 1459.0 | 1367.4 | 1456.0 | 1489.9 | 1611.9 | 1677.9 | 1754.4 | 632.3 | 769.3 | 1153.2 | 1850.7 |
| Other food items | 1086.1 | 1093.1 | 1136.0 | 1011.7 | 1193.8 | 1211.1 | 1207.6 | 1272.4 | 1349.4 | 463.2 | 560.5 | 832.1 | 1418.3 |
| Fiber products | 1114.1 | 1059.6 | 1065.0 | 921.1 | 971.2 | 1076.1 | 981.9 | 1008.9 | 1038.7 | 383.6 | 467.7 | 703.9 | 1093.9 |
| Shoes, bags | 523.7 | 490.1 | 650.0 | 592.7 | 784.9 | 712.5 | 708.8 | 786.3 | 882.8 | 225.3 | 263.4 | 369.4 | 914.2 |
| Ceramics and glass products | 58.8 | 64.8 | 46.0 | 52.5 | 50.4 | 46.5 | 42.3 | 43.1 | 44.0 | 17.5 | 21.5 | 32.9 | 46.9 |
| Publication | 104.0 | 107.0 | 111.0 | 94.0 | 106.3 | 107.0 | 101.1 | 107.6 | 115.5 | 35.9 | 43.0 | 62.6 | 120.2 |
| Wood products and paper products | 44.9 | 42.0 | 33.0 | 28.5 | 34.9 | 32.0 | 41.5 | 42.4 | 43.3 | 17.5 | 21.4 | 32.3 | 45.6 |
| Medical supplies and cosmetics | 190.1 | 204.9 | 222.0 | 292.1 | 530.6 | 607.2 | 676.3 | 826.8 | 1017.4 | 158.8 | 170.1 | 200.1 | 1044.9 |
| Film | 12.2 | 14.6 | 11.0 | 5.9 | 8.3 | 8.5 | 7.1 | 7.2 | 7.3 | 2.7 | 3.3 | 5.0 | 7.7 |
| Electrical equipment and related products | 247.7 | 204.2 | 185.0 | 234.8 | 246.4 | 204.8 | 223.5 | 254.4 | 293.2 | 64.5 | 73.8 | 99.5 | 302.1 |
| Camera, glasses, watch | 196.7 | 178.0 | 205.0 | 196.6 | 244.7 | 198.4 | 229.3 | 253.5 | 283.6 | 71.9 | 84.2 | 118.3 | 293.8 |
| Sports equipment · CD · stationery | 101.3 | 100.6 | 100.0 | 92.0 | 157.2 | 204.7 | 237.5 | 242.5 | 247.7 | 99.1 | 121.1 | 181.9 | 259.9 |
| Other manufactured products | 146.1 | 141.2 | 142.0 | 157.5 | 176.2 | 202.5 | 199.2 | 221.3 | 248.6 | 67.9 | 80.0 | 113.7 | 259.0 |
| Activities | |||||||||||||
| A day spa warm-bathing facility beauty salon | 107.4 | 105.8 | 97.0 | 95.3 | 114.1 | 103.5 | 121.4 | 123.9 | 126.4 | 50.6 | 62.1 | 94.3 | 134.1 |
| Museums, museums, zoos and gardens, aquariums | 137.5 | 149.2 | 144.0 | 140.1 | 160.4 | 169.3 | 178.2 | 188.4 | 200.6 | 68.6 | 83.0 | 123.4 | 211.3 |
| Watching sports and art appreciation | 104.6 | 75.5 | 106.0 | 116.9 | 131.3 | 160.6 | 184.3 | 190.6 | 197.7 | 76.3 | 92.8 | 138.2 | 206.8 |
| Amusement parks and expositions | 311.5 | 322.3 | 341.0 | 349.5 | 396.5 | 407.3 | 430.6 | 451.4 | 475.8 | 170.5 | 206.7 | 307.7 | 500.1 |
| Sports Facilities | 121.1 | 124.9 | 163.0 | 129.5 | 136.1 | 137.3 | 132.3 | 135.3 | 138.4 | 56.6 | 68.9 | 103.0 | 144.5 |
| Ski lift fee | 38.2 | 51.8 | 43.0 | 43.2 | 41.9 | 30.6 | 39.9 | 40.7 | 41.5 | 16.6 | 20.4 | 31.0 | 44.1 |
| Camp site | 0.8 | 0.9 | 1.0 | 5.4 | 0.8 | 1.5 | 0.8 | 0.8 | 0.8 | 0.4 | 0.4 | 0.6 | 0.9 |
| Exhibition and convention participation fee | 27.2 | 23.2 | 22.0 | 25.9 | 20.2 | 30.9 | 31.2 | 31.8 | 32.5 | 13.2 | 16.1 | 24.2 | 34.2 |
| Tourist farm | 12.9 | 14.9 | 12.0 | 13.5 | 15.2 | 13.6 | 15.8 | 16.2 | 16.5 | 6.7 | 8.2 | 12.3 | 17.3 |
| Fishing boat | 41.6 | 30.8 | 27.0 | 17.6 | 25.4 | 27.1 | 33.2 | 33.9 | 34.6 | 13.9 | 17.1 | 25.8 | 36.5 |
| Guide fee | 19.9 | 28.9 | 28.0 | 23.3 | 39.7 | 34.3 | 32.4 | 33.1 | 33.8 | 13.6 | 16.6 | 25.2 | 35.7 |
| Rental charge | 43.8 | 53.7 | 42.0 | 49.4 | 70.5 | 66.2 | 97.5 | 101.6 | 106.4 | 34.8 | 42.0 | 62.3 | 111.3 |
| Massage | 50.9 | 45.4 | 47.0 | 41.4 | 30.1 | 30.2 | 34.9 | 35.5 | 36.1 | 14.2 | 17.6 | 27.0 | 38.8 |
| Photo shoot fee | 25.2 | 18.9 | 24.0 | 25.3 | 18.2 | 17.8 | 14.7 | 15.0 | 15.3 | 6.1 | 7.5 | 11.4 | 16.2 |
| Mail and communication charges | 25.2 | 17.3 | 14.0 | 20.0 | 8.6 | 15.8 | 14.2 | 14.5 | 14.8 | 5.6 | 6.8 | 10.3 | 15.6 |
| Home delivery | 111.7 | 106.3 | 111.0 | 108.2 | 108.4 | 93.6 | 96.2 | 97.9 | 99.6 | 37.8 | 46.4 | 70.8 | 105.9 |
| Travel insurance · Credit card admission fee | 54.6 | 56.3 | 52.0 | 37.0 | 39.8 | 63.9 | 60.9 | 61.5 | 62.1 | 17.0 | 19.9 | 27.9 | 61.9 |
| Passport application fee | 43.7 | 47.9 | 44.0 | 43.5 | 38.1 | 42.6 | 41.4 | 41.4 | 41.5 | 6.5 | 6.6 | 6.7 | 38.3 |
| Visa application fee | 0.0 | 0.0 | 0.0 | 0.0 | 0.0 | 0.0 | 0.0 | 0.0 | 0.0 | 0.0 | 0.0 | 0.0 | 0.0 |
| Hairdresser/Barber | 261.2 | 232.9 | 254.0 | 208.7 | 214.0 | 238.9 | 229.1 | 233.5 | 238.0 | 92.5 | 113.2 | 171.3 | 251.3 |
| Develop and print photos | 106.6 | 90.6 | 95.0 | 70.6 | 62.5 | 55.1 | 48.9 | 49.8 | 50.7 | 19.1 | 23.3 | 35.1 | 53.1 |
| Laundry service | 56.3 | 58.4 | 53.0 | 45.7 | 59.5 | 50.9 | 53.5 | 54.5 | 55.5 | 21.5 | 26.4 | 40.0 | 58.7 |
| Other | 267.5 | 269.8 | 259.0 | 192.4 | 145.7 | 130.1 | 143.3 | 151.5 | 161.4 | 51.0 | 60.9 | 88.3 | 166.9 |
| Total | 22,383.8 | 22,492.7 | 23,560.0 | 22,500.9 | 25,481.3 | 26,371.8 | 27,117.4 | 28,660.1 | 30,514.5 | 9974.2 | 12,033.1 | 17,810.2 | 32,034.7 |
| Products | 2011 | 2012 | 2013 | 2014 | 2015 | 2016 | 2017 | 2018 | 2019 | 2020 | |||
|---|---|---|---|---|---|---|---|---|---|---|---|---|---|
| SR1 | SR2 | SR3 | SR0 | ||||||||||
| Travel agencies, operators, and guides | |||||||||||||
| Travel agencies, tour operators, and tourist guide services | 286.1 | 300.3 | 314.3 | 291.7 | 312.3 | 301.3 | 302.1 | 309.8 | 318.6 | 93.1 | 110.3 | 158.6 | 323.9 |
| Transport | |||||||||||||
| Airplane (domestic, local) | 13,244.4 | 13,149.2 | 13,295.0 | 13,588.3 | 14,756.7 | 14,062.1 | 14,503.2 | 14,812.7 | 15,141.4 | 5806.3 | 7145.9 | 10,945.5 | 16,190.6 |
| Airplane (international flight) | 7136.9 | 7530.3 | 8245.1 | 9287.6 | 9839.7 | 9696.5 | 10,604.1 | 11,507.2 | 12,650.6 | 1822.9 | 1842.3 | 1864.9 | 12,203.5 |
| Bullet train | 2866.9 | 3081.6 | 3210.5 | 3258.6 | 3889.0 | 4094.9 | 3869.3 | 4066.1 | 4299.3 | 1496.8 | 1815.8 | 2708.5 | 4532.3 |
| Railways (excluding bullet train) | 1239.9 | 1170.7 | 1268.1 | 1089.1 | 1236.2 | 1261.2 | 1199.3 | 1223.3 | 1247.8 | 492.5 | 602.6 | 910.1 | 1315.6 |
| Bus | 2185.7 | 1918.6 | 1960.9 | 1556.6 | 1645.7 | 1808.3 | 1830.3 | 1867.7 | 1906.0 | 755.4 | 923.0 | 1389.3 | 2003.3 |
| Taxi | 778.8 | 742.9 | 794.1 | 894.6 | 960.8 | 1153.2 | 1043.9 | 1138.9 | 1256.1 | 361.8 | 430.8 | 623.9 | 1315.0 |
| Ships (inner service, local) | 1286.2 | 1319.0 | 1242.8 | 1237.2 | 1363.7 | 1360.0 | 1402.2 | 1446.5 | 1496.7 | 556.2 | 683.0 | 1042.6 | 1600.7 |
| Ships (outbound) | 10.6 | 10.1 | 7.7 | 12.6 | 14.1 | 11.2 | 12.0 | 12.6 | 13.3 | 2.0 | 2.0 | 2.0 | 12.6 |
| Car rental fee | 204.5 | 215.4 | 253.0 | 204.2 | 237.9 | 284.2 | 271.0 | 284.6 | 300.7 | 104.2 | 126.9 | 191.0 | 319.4 |
| Gasoline cost | 34,611.7 | 33,981.5 | 33,976.4 | 31,339.1 | 29,933.6 | 28,953.7 | 31,505.5 | 32,155.9 | 32,820.4 | 13,162.8 | 16,120.9 | 24,368.1 | 34,654.8 |
| Parking lot, toll road charge (except for highway charge) | 339.3 | 233.8 | 233.4 | 282.5 | 251.2 | 251.2 | 261.6 | 266.8 | 272.1 | 106.6 | 130.3 | 196.4 | 286.2 |
| Highway charge | 593.2 | 677.7 | 716.5 | 663.1 | 758.3 | 800.5 | 868.6 | 886.3 | 904.3 | 361.3 | 442.8 | 670.4 | 956.3 |
| Accommodation | |||||||||||||
| Accommodation services | 8111.5 | 8583.1 | 8962.8 | 8440.1 | 10,039.4 | 10,596.6 | 11,171.9 | 12,001.0 | 13,016.5 | 4003.9 | 4837.4 | 7207.5 | 13,821.6 |
| Vacation home ownership (imputed) | 96.6 | 96.3 | 95.9 | 103.7 | 104.8 | 105.9 | 107.1 | 108.9 | 110.8 | 43.3 | 53.6 | 83.0 | 119.6 |
| Food and beverage | |||||||||||||
| Food and beverage serving services | 6262.2 | 6433.3 | 7042.1 | 6860.5 | 8124.8 | 8776.7 | 9084.9 | 9757.6 | 10,577.9 | 3323.1 | 3996.1 | 5882.9 | 11,128.8 |
| Souvenirs | |||||||||||||
| Agricultural products | 330.1 | 308.7 | 362.8 | 303.9 | 330.9 | 348.7 | 375.9 | 384.0 | 392.2 | 158.7 | 194.1 | 292.3 | 412.8 |
| Agricultural processed products | 327.2 | 300.5 | 300.0 | 311.8 | 294.1 | 311.1 | 321.7 | 328.4 | 335.1 | 134.7 | 165.1 | 250.0 | 354.5 |
| Marine products | 1161.6 | 1160.7 | 1098.4 | 872.7 | 968.4 | 1028.8 | 818.8 | 835.2 | 852.0 | 341.0 | 418.7 | 636.1 | 904.2 |
| Fisheries processed products | 865.2 | 824.8 | 866.2 | 730.2 | 754.6 | 741.7 | 769.0 | 784.5 | 800.3 | 320.4 | 393.3 | 597.5 | 849.1 |
| Confectionery | 5198.0 | 5197.2 | 5346.6 | 5010.8 | 5335.7 | 5459.9 | 5907.1 | 6148.7 | 6429.3 | 2317.1 | 2819.3 | 4226.1 | 6782.0 |
| Other food items | 6017.8 | 6057.0 | 6294.5 | 5606.0 | 6614.7 | 6710.7 | 6691.3 | 7050.0 | 7477.0 | 2566.4 | 3105.4 | 4610.7 | 7858.8 |
| Fiber products | 7328.3 | 6969.6 | 7005.0 | 6058.4 | 6387.8 | 7078.1 | 6458.7 | 6635.8 | 6832.0 | 2523.0 | 3076.4 | 4629.8 | 7195.4 |
| Shoes, bags | 1595.7 | 1493.2 | 1980.4 | 1805.9 | 2391.4 | 2170.8 | 2159.5 | 2395.6 | 2689.5 | 686.4 | 802.6 | 1125.3 | 2785.4 |
| Ceramics and glass products | 171.2 | 188.7 | 134.0 | 152.9 | 146.8 | 135.4 | 123.2 | 125.6 | 128.0 | 50.9 | 62.7 | 95.7 | 136.6 |
| Publication | 356.4 | 366.8 | 380.4 | 322.2 | 364.1 | 366.6 | 346.4 | 368.6 | 395.7 | 123.1 | 147.3 | 214.7 | 411.7 |
| Wood products and paper products | 252.2 | 236.1 | 185.5 | 160.4 | 196.4 | 179.9 | 233.3 | 238.3 | 243.4 | 98.3 | 120.3 | 181.4 | 256.4 |
| Medical supplies and Cosmetics | 700.9 | 755.5 | 818.6 | 1077.1 | 1956.6 | 2238.7 | 2493.7 | 3048.5 | 3751.4 | 585.4 | 627.3 | 737.9 | 3852.7 |
| Film | 75.4 | 90.3 | 68.0 | 36.6 | 51.4 | 52.8 | 43.6 | 44.4 | 45.1 | 16.7 | 20.4 | 30.9 | 47.5 |
| Electrical equipment and related products | 893.8 | 737.0 | 667.6 | 847.2 | 889.2 | 739.0 | 806.4 | 918.0 | 1058.0 | 232.9 | 266.4 | 359.0 | 1090.1 |
| Camera, glasses, watch | 642.2 | 580.9 | 669.2 | 641.8 | 798.8 | 647.6 | 748.4 | 827.4 | 925.7 | 234.8 | 274.7 | 386.2 | 959.1 |
| Sports equipment · CD · stationery | 330.7 | 328.5 | 326.4 | 300.3 | 513.0 | 668.1 | 775.4 | 791.7 | 808.4 | 323.6 | 395.2 | 593.8 | 848.5 |
| Other manufactured products | 477.0 | 461.0 | 463.5 | 514.0 | 575.3 | 661.0 | 650.3 | 722.2 | 811.5 | 221.6 | 261.3 | 371.2 | 845.5 |
| Activities | |||||||||||||
| A day spa warm-bathing facility beauty salon | 408.9 | 402.7 | 369.2 | 362.7 | 434.1 | 393.7 | 462.1 | 471.5 | 481.0 | 192.7 | 236.4 | 359.1 | 510.2 |
| Museums, museums, zoos and gardens, aquariums | 315.7 | 342.7 | 330.7 | 321.7 | 368.4 | 388.7 | 409.3 | 432.7 | 460.7 | 157.5 | 190.7 | 283.3 | 485.2 |
| Watching sports and art appreciation | 105.5 | 76.2 | 106.9 | 118.0 | 132.5 | 162.0 | 186.0 | 192.3 | 199.4 | 77.0 | 93.6 | 139.5 | 208.7 |
| Amusement parks and expositions | 314.3 | 325.2 | 344.0 | 352.7 | 400.0 | 410.9 | 434.5 | 455.4 | 480.0 | 172.0 | 208.6 | 310.4 | 504.5 |
| Sports facilities | 161.9 | 166.8 | 217.8 | 173.1 | 181.9 | 183.5 | 176.8 | 180.8 | 184.9 | 75.6 | 92.1 | 137.6 | 193.1 |
| Ski lift fee | 62.9 | 85.2 | 70.7 | 71.1 | 68.9 | 50.3 | 65.6 | 67.0 | 68.3 | 27.4 | 33.6 | 51.0 | 72.5 |
| Camp site | 1.1 | 1.2 | 1.3 | 7.2 | 1.1 | 2.0 | 1.1 | 1.1 | 1.1 | 0.5 | 0.6 | 0.8 | 1.2 |
| Exhibition and convention participation fee | 17.0 | 14.6 | 13.8 | 16.2 | 12.7 | 19.4 | 19.5 | 20.0 | 20.4 | 8.3 | 10.1 | 15.2 | 21.4 |
| Tourist farm | 58.9 | 68.0 | 54.7 | 61.4 | 69.2 | 61.8 | 72.1 | 73.7 | 75.3 | 30.6 | 37.4 | 56.1 | 78.9 |
| Fishing boat | 60.4 | 44.7 | 39.2 | 25.5 | 36.8 | 39.3 | 48.1 | 49.1 | 50.2 | 20.2 | 24.8 | 37.4 | 52.9 |
| Guide fee | 16.3 | 23.8 | 23.0 | 19.1 | 32.6 | 28.2 | 26.7 | 27.2 | 27.8 | 11.2 | 13.7 | 20.7 | 29.4 |
| Rental charge | 34.2 | 41.9 | 32.8 | 38.6 | 55.0 | 51.6 | 76.0 | 79.2 | 83.0 | 27.1 | 32.8 | 48.6 | 86.8 |
| Massage | 53.8 | 48.0 | 49.6 | 43.7 | 31.8 | 31.9 | 36.8 | 37.5 | 38.2 | 15.0 | 18.5 | 28.6 | 41.0 |
| Photo shoot fee | 27.9 | 20.9 | 26.5 | 27.9 | 20.1 | 19.6 | 16.2 | 16.5 | 16.9 | 6.7 | 8.3 | 12.6 | 17.9 |
| Mail and communication charges | 38.0 | 26.1 | 21.1 | 30.1 | 12.9 | 23.7 | 21.5 | 21.8 | 22.2 | 8.4 | 10.3 | 15.6 | 23.5 |
| Home delivery | 1546.7 | 1471.9 | 1536.5 | 1498.2 | 1501.1 | 1296.2 | 1332.2 | 1355.2 | 1378.6 | 522.9 | 642.3 | 980.6 | 1466.5 |
| Travel insurance · Credit card admission fee | 37.0 | 38.2 | 35.3 | 25.1 | 27.0 | 43.3 | 41.3 | 41.7 | 42.1 | 11.5 | 13.5 | 18.9 | 42.0 |
| Passport application fee | 35.6 | 39.1 | 35.9 | 35.5 | 31.1 | 34.8 | 33.7 | 33.8 | 33.9 | 5.3 | 5.4 | 5.5 | 31.2 |
| Visa application fee | 0.0 | 0.0 | 0.0 | 0.0 | 0.0 | 0.0 | 0.0 | 0.0 | 0.0 | 0.0 | 0.0 | 0.0 | 0.0 |
| Hairdresser/barber | 248.2 | 221.4 | 241.4 | 198.4 | 203.4 | 227.1 | 217.8 | 221.9 | 226.2 | 87.9 | 107.6 | 162.8 | 238.8 |
| 87.6 | 74.5 | 78.1 | 58.0 | 51.4 | 45.3 | 40.2 | 40.9 | 41.7 | 15.7 | 19.2 | 28.8 | 43.7 | |
| Laundry service | 97.8 | 101.5 | 92.1 | 79.4 | 103.5 | 88.5 | 93.0 | 94.7 | 96.5 | 37.4 | 45.9 | 69.5 | 102.1 |
| Other | 220.0 | 221.9 | 213.0 | 158.2 | 119.9 | 107.0 | 117.8 | 124.6 | 132.8 | 41.9 | 50.1 | 72.6 | 137.3 |
| Total | 10,9928.0 | 10,9356.5 | 11,2519.5 | 10,7583.6 | 11,5933.2 | 11,6765.3 | 12,1688.3 | 12,7531.6 | 13,4468.4 | 44,980.5 | 54,309.6 | 80,438.8 | 140,763.2 |
| Products | 2011 | 2012 | 2013 | 2014 | 2015 | 2016 | 2017 | 2018 | 2019 | 2020 | |||
|---|---|---|---|---|---|---|---|---|---|---|---|---|---|
| SR1 | SR2 | SR3 | SR0 | ||||||||||
| Travel agencies, operators, and guides | |||||||||||||
| Travel agencies, tour operators, and tourist guide services | 58.1 | 61.0 | 63.8 | 59.2 | 63.4 | 61.2 | 61.3 | 62.9 | 64.7 | 18.9 | 22.4 | 32.2 | 65.8 |
| Transport | |||||||||||||
| Airplane (domestic, local) | 109.6 | 108.8 | 110.0 | 112.5 | 122.1 | 116.4 | 120.0 | 122.6 | 125.3 | 48.1 | 59.1 | 90.6 | 134.0 |
| Airplane (international flight) | 59.1 | 62.3 | 68.2 | 76.9 | 81.4 | 80.3 | 87.8 | 95.2 | 104.7 | 15.1 | 15.2 | 15.4 | 101.0 |
| Bullet train | 107.2 | 115.3 | 120.1 | 121.9 | 145.5 | 153.2 | 144.7 | 152.1 | 160.8 | 56.0 | 67.9 | 101.3 | 169.5 |
| Railways (excluding bullet train) | 46.4 | 43.8 | 47.4 | 40.7 | 46.2 | 47.2 | 44.9 | 45.8 | 46.7 | 18.4 | 22.5 | 34.0 | 49.2 |
| Bus | 91.5 | 80.4 | 82.1 | 65.2 | 68.9 | 75.7 | 76.7 | 78.2 | 79.8 | 31.6 | 38.7 | 58.2 | 83.9 |
| Taxi | 35.0 | 33.4 | 35.7 | 40.2 | 43.2 | 51.9 | 47.0 | 51.2 | 56.5 | 16.3 | 19.4 | 28.1 | 59.1 |
| Ships (inner service, local) | 9.7 | 9.9 | 9.3 | 9.3 | 10.2 | 10.2 | 10.5 | 10.9 | 11.2 | 4.2 | 5.1 | 7.8 | 12.0 |
| Ships (outbound) | 0.3 | 0.3 | 0.2 | 0.3 | 0.4 | 0.3 | 0.3 | 0.3 | 0.3 | 0.0 | 0.1 | 0.1 | 0.3 |
| Car rental fee | 15.3 | 16.2 | 19.0 | 15.3 | 17.9 | 21.3 | 20.3 | 21.4 | 22.6 | 7.8 | 9.5 | 14.3 | 24.0 |
| Gasoline cost | 56.3 | 55.3 | 55.3 | 51.0 | 48.7 | 47.1 | 51.3 | 52.3 | 53.4 | 21.4 | 26.2 | 39.6 | 56.4 |
| Parking lot, toll road charge (except for highway charge) | 25.7 | 17.7 | 17.7 | 21.4 | 19.0 | 19.0 | 19.8 | 20.2 | 20.6 | 8.1 | 9.9 | 14.9 | 21.7 |
| Highway charge | 44.9 | 51.3 | 54.2 | 50.2 | 57.4 | 60.6 | 65.7 | 67.1 | 68.4 | 27.3 | 33.5 | 50.7 | 72.4 |
| Accommodation | |||||||||||||
| Accommodation services | 539.6 | 570.9 | 596.2 | 561.4 | 667.8 | 704.9 | 743.1 | 798.3 | 865.8 | 266.3 | 321.8 | 479.4 | 919.4 |
| Vacation home ownership (imputed) | 6.4 | 6.3 | 6.3 | 6.8 | 6.9 | 7.0 | 7.0 | 7.2 | 7.3 | 2.9 | 3.5 | 5.5 | 7.9 |
| Food and beverage | |||||||||||||
| Food and beverage serving services | 556.8 | 572.1 | 626.2 | 610.0 | 722.5 | 780.4 | 807.8 | 867.6 | 940.6 | 295.5 | 355.3 | 523.1 | 989.6 |
| Souvenirs | |||||||||||||
| Agricultural products | 10.3 | 9.6 | 11.3 | 9.5 | 10.3 | 10.8 | 11.7 | 11.9 | 12.2 | 4.9 | 6.0 | 9.1 | 12.8 |
| Agricultural processed products | 13.1 | 12.1 | 12.1 | 12.5 | 11.8 | 12.5 | 12.9 | 13.2 | 13.5 | 5.4 | 6.6 | 10.0 | 14.2 |
| Marine products | 34.8 | 34.8 | 32.9 | 26.1 | 29.0 | 30.8 | 24.5 | 25.0 | 25.5 | 10.2 | 12.5 | 19.1 | 27.1 |
| Fisheries processed products | 21.9 | 20.9 | 22.0 | 18.5 | 19.1 | 18.8 | 19.5 | 19.9 | 20.3 | 8.1 | 10.0 | 15.2 | 21.5 |
| Confectionery | 204.1 | 204.0 | 209.9 | 196.7 | 209.5 | 214.3 | 231.9 | 241.4 | 252.4 | 91.0 | 110.7 | 165.9 | 266.2 |
| Other food items | 178.1 | 179.3 | 186.3 | 165.9 | 195.8 | 198.7 | 198.1 | 208.7 | 221.3 | 76.0 | 91.9 | 136.5 | 232.6 |
| Fiber products | 161.5 | 153.6 | 154.4 | 133.5 | 140.8 | 156.0 | 142.3 | 146.3 | 150.6 | 55.6 | 67.8 | 102.0 | 158.6 |
| Shoes, bags | 68.9 | 64.5 | 85.6 | 78.0 | 103.3 | 93.8 | 93.3 | 103.5 | 116.2 | 29.7 | 34.7 | 48.6 | 120.3 |
| Ceramics and glass products | 10.4 | 11.5 | 8.1 | 9.3 | 8.9 | 8.2 | 7.5 | 7.6 | 7.8 | 3.1 | 3.8 | 5.8 | 8.3 |
| Publication | 11.7 | 12.0 | 12.5 | 10.6 | 11.9 | 12.0 | 11.4 | 12.1 | 13.0 | 4.0 | 4.8 | 7.0 | 13.5 |
| Wood products and paper products | 4.7 | 4.4 | 3.5 | 3.0 | 3.7 | 3.4 | 4.4 | 4.5 | 4.6 | 1.9 | 2.3 | 3.4 | 4.8 |
| Medical supplies and cosmetics | 17.1 | 18.5 | 20.0 | 26.3 | 47.8 | 54.7 | 61.0 | 74.5 | 91.7 | 14.3 | 15.3 | 18.0 | 94.2 |
| Film | 1.1 | 1.3 | 1.0 | 0.5 | 0.8 | 0.8 | 0.6 | 0.7 | 0.7 | 0.2 | 0.3 | 0.5 | 0.7 |
| Electrical equipment and related products | 24.8 | 20.5 | 18.5 | 23.5 | 24.7 | 20.5 | 22.4 | 25.5 | 29.4 | 6.5 | 7.4 | 10.0 | 30.3 |
| Camera, glasses, watch | 26.3 | 23.8 | 27.4 | 26.3 | 32.7 | 26.5 | 30.6 | 33.9 | 37.9 | 9.6 | 11.2 | 15.8 | 39.3 |
| Sports equipment · CD · stationery | 13.5 | 13.4 | 13.4 | 12.3 | 21.0 | 27.3 | 31.7 | 32.4 | 33.1 | 13.2 | 16.2 | 24.3 | 34.7 |
| Other manufactured products | 19.5 | 18.9 | 19.0 | 21.0 | 23.5 | 27.1 | 26.6 | 29.6 | 33.2 | 9.1 | 10.7 | 15.2 | 34.6 |
| Activities | |||||||||||||
| A day spa warm-bathing facility beauty salon | 18.1 | 17.8 | 16.3 | 16.1 | 19.2 | 17.4 | 20.5 | 20.9 | 21.3 | 8.5 | 10.5 | 15.9 | 22.6 |
| Museums, museums, zoos and gardens, aquariums | 21.4 | 23.2 | 22.4 | 21.8 | 24.9 | 26.3 | 27.7 | 29.3 | 31.2 | 10.7 | 12.9 | 19.2 | 32.8 |
| Watching sports and art appreciation | 10.3 | 7.5 | 10.5 | 11.6 | 13.0 | 15.9 | 18.2 | 18.8 | 19.5 | 7.5 | 9.2 | 13.7 | 20.5 |
| Amusement parks and expositions | 30.8 | 31.9 | 33.7 | 34.6 | 39.2 | 40.3 | 42.6 | 44.6 | 47.0 | 16.9 | 20.4 | 30.4 | 49.4 |
| Sports Facilities | 18.5 | 19.1 | 24.9 | 19.8 | 20.8 | 21.0 | 20.2 | 20.7 | 21.2 | 8.7 | 10.5 | 15.7 | 22.1 |
| Ski lift fee | 2.4 | 3.2 | 2.6 | 2.7 | 2.6 | 1.9 | 2.5 | 2.5 | 2.6 | 1.0 | 1.3 | 1.9 | 2.7 |
| Camp site | 0.1 | 0.1 | 0.2 | 0.8 | 0.1 | 0.2 | 0.1 | 0.1 | 0.1 | 0.1 | 0.1 | 0.1 | 0.1 |
| Exhibition and convention participation fee | 2.9 | 2.4 | 2.3 | 2.7 | 2.1 | 3.2 | 3.3 | 3.3 | 3.4 | 1.4 | 1.7 | 2.5 | 3.6 |
| Tourist farm | 1.6 | 1.9 | 1.5 | 1.7 | 1.9 | 1.7 | 2.0 | 2.1 | 2.1 | 0.9 | 1.0 | 1.6 | 2.2 |
| Fishing boat | 6.2 | 4.6 | 4.0 | 2.6 | 3.8 | 4.0 | 4.9 | 5.0 | 5.1 | 2.1 | 2.5 | 3.8 | 5.4 |
| Guide fee | 2.0 | 2.9 | 2.9 | 2.4 | 4.0 | 3.5 | 3.3 | 3.4 | 3.4 | 1.4 | 1.7 | 2.6 | 3.6 |
| Rental charge | 2.8 | 3.4 | 2.7 | 3.2 | 4.5 | 4.2 | 6.2 | 6.5 | 6.8 | 2.2 | 2.7 | 4.0 | 7.1 |
| Massage | 7.8 | 7.0 | 7.2 | 6.3 | 4.6 | 4.6 | 5.3 | 5.4 | 5.5 | 2.2 | 2.7 | 4.1 | 5.9 |
| Photo shoot fee | 3.6 | 2.7 | 3.4 | 3.6 | 2.6 | 2.5 | 2.1 | 2.1 | 2.2 | 0.9 | 1.1 | 1.6 | 2.3 |
| Mail and communication charges | 5.2 | 3.6 | 2.9 | 4.1 | 1.8 | 3.3 | 2.9 | 3.0 | 3.0 | 1.2 | 1.4 | 2.1 | 3.2 |
| Home delivery | 17.8 | 17.0 | 17.7 | 17.3 | 17.3 | 15.0 | 15.4 | 15.6 | 15.9 | 6.0 | 7.4 | 11.3 | 16.9 |
| Travel insurance · Credit card admission fee | 5.3 | 5.5 | 5.1 | 3.6 | 3.9 | 6.2 | 5.9 | 6.0 | 6.1 | 1.7 | 1.9 | 2.7 | 6.0 |
| Passport application fee | 3.4 | 3.7 | 3.4 | 3.4 | 3.0 | 3.3 | 3.2 | 3.2 | 3.2 | 0.5 | 0.5 | 0.5 | 3.0 |
| Visa application fee | 0.0 | 0.0 | 0.0 | 0.0 | 0.0 | 0.0 | 0.0 | 0.0 | 0.0 | 0.0 | 0.0 | 0.0 | 0.0 |
| Hairdresser/Barber | 36.1 | 32.2 | 35.1 | 28.8 | 29.6 | 33.0 | 31.6 | 32.2 | 32.9 | 12.8 | 15.6 | 23.6 | 34.7 |
| Develop and print photos | 10.9 | 9.2 | 9.7 | 7.2 | 6.4 | 5.6 | 5.0 | 5.1 | 5.2 | 1.9 | 2.4 | 3.6 | 5.4 |
| Laundry service | 9.1 | 9.4 | 8.6 | 7.4 | 9.6 | 8.2 | 8.6 | 8.8 | 9.0 | 3.5 | 4.3 | 6.5 | 9.5 |
| Other | 27.2 | 27.5 | 26.4 | 19.6 | 14.8 | 13.2 | 14.6 | 15.4 | 16.4 | 5.2 | 6.2 | 9.0 | 17.0 |
| Total | 2827.4 | 2843.7 | 2993.0 | 2837.2 | 3245.9 | 3387.5 | 3485.0 | 3698.0 | 3955.2 | 1277.7 | 1540.5 | 2278.2 | 4156.1 |
References
- United Nations Framework Convention on Climate Change (UNFCCC). The Paris Agreement. Available online: https://unfccc.int/process-and-meetings/the-paris-agreement/the-paris-agreement (accessed on 27 October 2020).
- United Nations Environment Programme. Emissions Gap Report 2019; UNEP: Nairobi, Kenya, 2019; Available online: https://www.unenvironment.org/resources/emissions-gap-report-2019 (accessed on 27 October 2020).
- Ministry of the Environment Government of Japan. Submission of Japan’s Nationally Determined Contribution (NDC). Available online: https://www.env.go.jp/press/files/jp/113675.pdf (accessed on 27 October 2020).
- The Long-Term Strategy under the Paris Agreement; The Government of Japan: Tokyo, Japan. Available online: https://www.env.go.jp/press/111913.pdf (accessed on 27 October 2020).
- Prime Minister Suga’s Statement of Belief at the 203rd Diet Session; The Government of Japan: Tokyo, Japan. Available online: https://www.kantei.go.jp/jp/99_suga/statement/2020/1026shoshinhyomei.html (accessed on 27 October 2020).
- The World Health Organization (WHO). COVID-19 Response Fund. Available online: https://www.who.int/emergencies/diseases/novel-coronavirus-2019/donate (accessed on 27 October 2020).
- The World Health Organization (WHO). Coronavirus Disease 2019. Available online: https://www.who.int/emergencies/diseases/novel-coronavirus-2019 (accessed on 27 October 2020).
- Ministry of Health, Labour and Welfare. About New Coronavirus Infection. Available online: https://www.mhlw.go.jp/stf/seisakunitsuite/bunya/0000164708_00001.html#kokunaihassei (accessed on 27 October 2020).
- Cabinet Public Relations Office, Cabinet Secretariat. New Coronavirus Infectious Disease Control Headquarters. Available online: https://www.kantei.go.jp/jp/98_abe/actions/202005/04corona.html (accessed on 27 October 2020).
- New Coronavirus Infectious Disease Control Headquarters. Basic Countermeasure Policy for New Coronavirus Infection Control. Available online: https://corona.go.jp/expert-meeting/pdf/kihon_h_0504.pdf (accessed on 27 October 2020).
- Kuniya, T. Prediction of the Epidemic Peak of Coronavirus Disease in Japan, 2020. J. Clin. Med. 2020, 9, 789. [Google Scholar] [CrossRef] [PubMed] [Green Version]
- The International Monetary Fund (IMF). World Economic Outlook, April 2020: The Great Lockdown. Available online: https://www.imf.org/en/Publications/WEO/Issues/2020/04/14/weo-april-2020 (accessed on 27 October 2020).
- The World Tourism Organization (UNWTO). COVID-19: Putting People First. Available online: https://www.unwto.org/tourism-covid-19 (accessed on 27 October 2020).
- Japan National Tourism Organization (JNTO). Collection and Announcement of Foreign Visitor Statistics. Available online: https://www.jnto.go.jp/jpn/statistics/data_info_listing/pdf/200415_monthly.pdf (accessed on 27 October 2020).
- The Japan Tourism Agency (JTA). Survey on Consumption Trends for Foreigners Visiting Japan. Available online: https://www.mlit.go.jp/kankocho/siryou/toukei/content/001340596.pdf (accessed on 27 October 2020).
- The Japan Tourism Agency (JTA). Survey of Overnight Travel Statistics. Available online: https://www.mlit.go.jp/kankocho/content/001342343.pdf (accessed on 27 October 2020).
- The World Tourism Organization (UNWTO). Impact Assessment of the COVID-19 Outbreak on International Tourism (Updated May 2020). Available online: https://www.unwto.org/impact-assessment-of-the-covid-19-outbreak-on-international-tourism (accessed on 27 October 2020).
- Nicola, M.; Alsafi, Z.; Sohrabi, C.; Kerwan, A.; Al-Jabir, A.; Iosifidis, C.; Agha, M.; Agha, R. The socio-economic implications of the coronavirus pandemic (COVID-19): A review. Int. J. Surg. 2020, 78, 185–193. [Google Scholar] [CrossRef] [PubMed]
- Mariolis, T.; Rodousakis, N.; Soklis, G. The COVID-19 Multiplier Effects of Tourism on the Greek Economy. Tour. Econ. 2020. [Google Scholar] [CrossRef]
- Sun, X.; Wandelt, S.; Zhang, A. How did COVID-19 impact air transportation? A first peek through the lens of complex networks. J. Air Trans. Manag. 2020, 89, 101928. [Google Scholar] [CrossRef] [PubMed]
- Chang, C.-L.; McAleer, M.; Ramos, V. A Charter for Sustainable Tourism after COVID-19. Sustainability 2020, 12, 3671. [Google Scholar] [CrossRef]
- Lenzen, M.; Sun, Y.; Faturay, F.; Ting, Y.; Geschke, A.; Malik, A. The carbon footprint of global tourism. Nat. Clim. Chang. 2018, 8, 522–528. [Google Scholar] [CrossRef]
- Rosenblum, J.; Horvath, A.; Hendrickson, C. Environmental implications of service industries. Environ. Sci. Technol. 2000, 34, 4669–4676. [Google Scholar] [CrossRef] [Green Version]
- Patterson, M.G.; McDonald, G. How Clean and Green Is New Zealand Tourism? Lifecycle and Future Environmental Impacts; Manaaki Whenua Press: Lincoln, New Zealand, 2004. [Google Scholar]
- Berners-Lee, M.; Howard, D.C.; Moss, J.; Kaivanto, K.; Scott, W.A. Greenhouse gas footprinting for small businesses—The use of input–output data. Sci. Total Environ. 2011, 409, 883–891. [Google Scholar] [CrossRef] [PubMed]
- Scheepens, A.E.; Vogtländer, J.G.; Brezet, J.C. Two life cycle assessment (LCA) based methods to analyse and design complex (regional) circular economy systems. Case: Making water tourism more sustainable. J. Clean. Prod. 2016, 114, 257–268. [Google Scholar] [CrossRef]
- Cadarso, M.-Á.; Gómez, N.; López, L.-A.; Tobarra, M.-Á.; Zafrilla, J.-E. Quantifying Spanish tourism’s carbon footprint: The contributions of residents and visitors: A longitudinal study. J. Sustain. Tour. 2015, 23, 922–946. [Google Scholar] [CrossRef]
- Qin, Y.; Li, X.; Rong, P. Urban tourism carbon accounting based on improved EIO-LCA model: A case study of Kaifeng City in Henan Province. Prog. Geogr. 2015, 34, 132–140. [Google Scholar]
- Kitamura, Y.; Ichisugi, Y.; Karkour, S.; Itsubo, N. Carbon Footprint Evaluation Based on Tourist Consumption toward Sustainable Tourism in Japan. Sustainability 2020, 12, 2219. [Google Scholar] [CrossRef] [Green Version]
- Isaifan, R.J. The dramatic impact of Coronavirus outbreak on air quality: Has it saved as much as it has killed so far? Global J. Environ. Sci. Manag. 2020, 6, 275–288. [Google Scholar] [CrossRef]
- Cooper, J.A.; Alderman, D.H. Cancelling March Madness exposes opportunities for a more sustainable sports tourism economy. Tour. Geogr. 2020. [Google Scholar] [CrossRef]
- Sun, Y.; Higham, J. Overcoming information asymmetry in tourism carbon management: The application of a new reporting architecture to Aotearoa New Zealand. Tour. Manag. 2020, 83, 104231. [Google Scholar] [CrossRef] [PubMed]
- The Japan Tourism Agency (JTA). Economic Ripple Effect. Available online: https://www.mlit.go.jp/kankocho/siryou/toukei/kouka.html (accessed on 27 October 2020).
- Japan Tourism Agency (JTA). Research Study on Economic Impacts of Tourism in Japan (2017 Edition). 2019. Available online: http://www.mlit.go.jp/kankocho/siryou/toukei/shouhidoukou.html#cp3 (accessed on 27 October 2020).
- Internal Revenue Service (IRS). Yearly Average Currency Exchange Rates. Available online: https://www.irs.gov/individuals/international-taxpayers/yearly-average-currency-exchange-rates (accessed on 27 October 2020).
- Japan National Tourism Organization (JNTO). Collection and Announcement of Foreign Visitor Statistics for 2020. Available online: https://www.jnto.go.jp/jpn/statistics/data_info_listing/index.html (accessed on 14 October 2020).
- The Japan Tourism Agency (JTA). Travel/Tourism Consumption Trend Survey. Available online: https://www.mlit.go.jp/kankocho/siryou/toukei/shouhidoukou.html (accessed on 14 October 2020).
- Leontief, W.W. Input–Output Economics, 2nd ed.; Oxford University Press: New York, NY, USA, 1986. [Google Scholar]
- Tahara, K. Development of Inventory Database for Environmental Hotspot Analysis using IDEA. J. Life Cycle Assess. Jpn. 2019, 15, 22–32. [Google Scholar] [CrossRef]
- Kondo, Y. Estimation of 2011 Waste Input–output Table for Japan. J. Life Cycle Assess. Jpn. 2019, 15, 33–41. [Google Scholar] [CrossRef]
- Ichisugi, Y.; Suguri, S.; Suzuki, H.; Fuji, C.; Tahara, K.; Kondo, Y.; Itsubo, N. Development and Application of Hotspots Analysis Method Considering Environmental Aspects and Social Aspects. In Proceedings of the 12th Meeting of the Institute of Life Cycle Assessment, Tsukuba, Japan, 1–3 March 2017; pp. 214–215. [Google Scholar]
- Foreign Policy. The Tourism Industry Is in Trouble. These Countries Will Suffer the Most. Available online: https://foreignpolicy.com/2020/04/01/coronavirus-tourism-industry-worst-hit-countries-infographic/ (accessed on 27 October 2020).
- Japan Tourism Agency. The Japan Tourism White Paper (2017). (Announcement 12 June 2019). Available online: http://www.mlit.go.jp/common/001237338.pdf (accessed on 28 October 2020).
- Ministry of Land, Infrastructure and Transport. Outline of Supplementary Budget Related to the Ministry of Land, Infrastructure, Transport and Tourism in FY 2020. Available online: https://www.mlit.go.jp/report/press/content/001339698.pdf (accessed on 27 October 2020).
- Japan Tourism Agency. About the Usage Record in the Go to Travel Business (22 July to 15 September). Available online: https://www.mlit.go.jp/kankocho/topics06_000279.html (accessed on 28 October 2020).
- Institute for Global Environmental Strategies (IGES). Implications of COVID-19 for the Environment and Sustainability. Available online: https://www.iges.or.jp/en/publication_documents/pub/policysubmission/en/10841/%231+COVID-19+Position+Paper+Final+%28EN%29.pdf (accessed on 27 October 2020).
- Society of Environmental Toxicology and Chemistry (SETAC). SETAC Europe 30th Annual Meeting Sustainability Initiatives. Available online: https://scicon.setac.org/#topics-tab (accessed on 27 October 2020).
- International Labour Organization (ILO). The Impact of COVID-19 on the Tourism Sector. Available online: https://www.ilo.org/sector/Resources/publications/WCMS_741468/lang--en/index.htm (accessed on 27 October 2020).
- Ministry of Internal Affairs and Communications (MIC). Labor Force Survey. Available online: https://www.stat.go.jp/data/roudou/sokuhou/tsuki/index.html (accessed on 27 October 2020).
- Japan Association of Travel Agents (JATA). Travel Industry 2018. Available online: https://www.jata-net.or.jp/data/stats/2018/pdf/2018_sujryoko.pdf (accessed on 27 October 2020).
- ANA Holdings Inc. ANA Holdings Financial Results for the Six Months Ended 30 September 2020. Available online: https://www.anahd.co.jp/group/en/pr/202010/20201027.html (accessed on 27 October 2020).
- Japan Airlines. Financial Results Announcement (3 August 2020). Available online: http://www.jal.com/cms/en/2020-08-03-financial-results-announcement--august-3--2020-.html (accessed on 27 October 2020).


| Inbound Tourism | Domestic Tourism | Domestic Tourism | Outbound Tourism | Outbound Tourism | ||||||||||||
|---|---|---|---|---|---|---|---|---|---|---|---|---|---|---|---|---|
| Overnight Stay | Day Trip | Domestic Transit | Destination | |||||||||||||
| Life cycle stage | P | W | A | P | W | A | P | W | A | P | W | A | P | W | A 3 | |
| Products and services | Travel agencies, tour operators, and guide | N | ○ | N | N | ○ | N | N | ○ | N | N | ○ | N | N | N | N |
| Transport | N | ○ | N | N | ○ | N | N | ○ | N | N | ○ | N | N | N | N | |
| Accommodation | N | ○ | N | N | ○ | N | N 2 | ○ | N | N | ○ | N | N | N | N | |
| Food and beverage | N | ○ | N | ○ | ○ | N | ○ | ○ | N | ○ | ○ | N | N | N | N | |
| Souvenirs | N | ○ | N | ○ | ○ | N | ○ | ○ | N | ○ | ○ | N | N | N | N | |
| Activities (including others 1) | N | ○ | N | ○ | ○ | ○ | ○ | ○ | ○ | ○ | ○ | ○ | N | N | N | |
| Type of Tourism | Scenario 1 (SR 1) | Scenario 2 (SR 2) | Scenario 3 (SR 3) | Scenario 0 (SR 0) |
|---|---|---|---|---|
| Inbound | August levels continue until December | August level continues until September, and from October it improves at the rate of July to August | From September, the improvement rate from July to August | 2019–2020 will have the same growth rate as 2018–2019 |
| Domestic (Overnight stay) | June levels continue until December | June level continues until September, and from October it improves at the rate of May to June | From July, the improvement rate from May to June | 2019–2020 will have the same growth rate as 2018–2019 |
| Domestic (Day trip) | ||||
| Outbound (Domestic transit) | August levels continue until December | August level continues until September, and from October it improves at the rate of July to August. | From September, the improvement rate from July to August | 2019–2020 will have the same growth rate as 2018–2019 |
| Outbound (Destination) | N | N | N | N |
| 2019 | 2020 | ||||
|---|---|---|---|---|---|
| SR 1 | SR 2 | SR 3 | SR 0 | ||
| Economic (B-JPY) | 30,514.5 | 9974.2 | 12,033.1 | 17,810.2 | 32,034.7 |
| Environment (kt-CO2eq) | 134,468.4 | 44,980.5 | 54,309.6 | 80,438.8 | 140,763.2 |
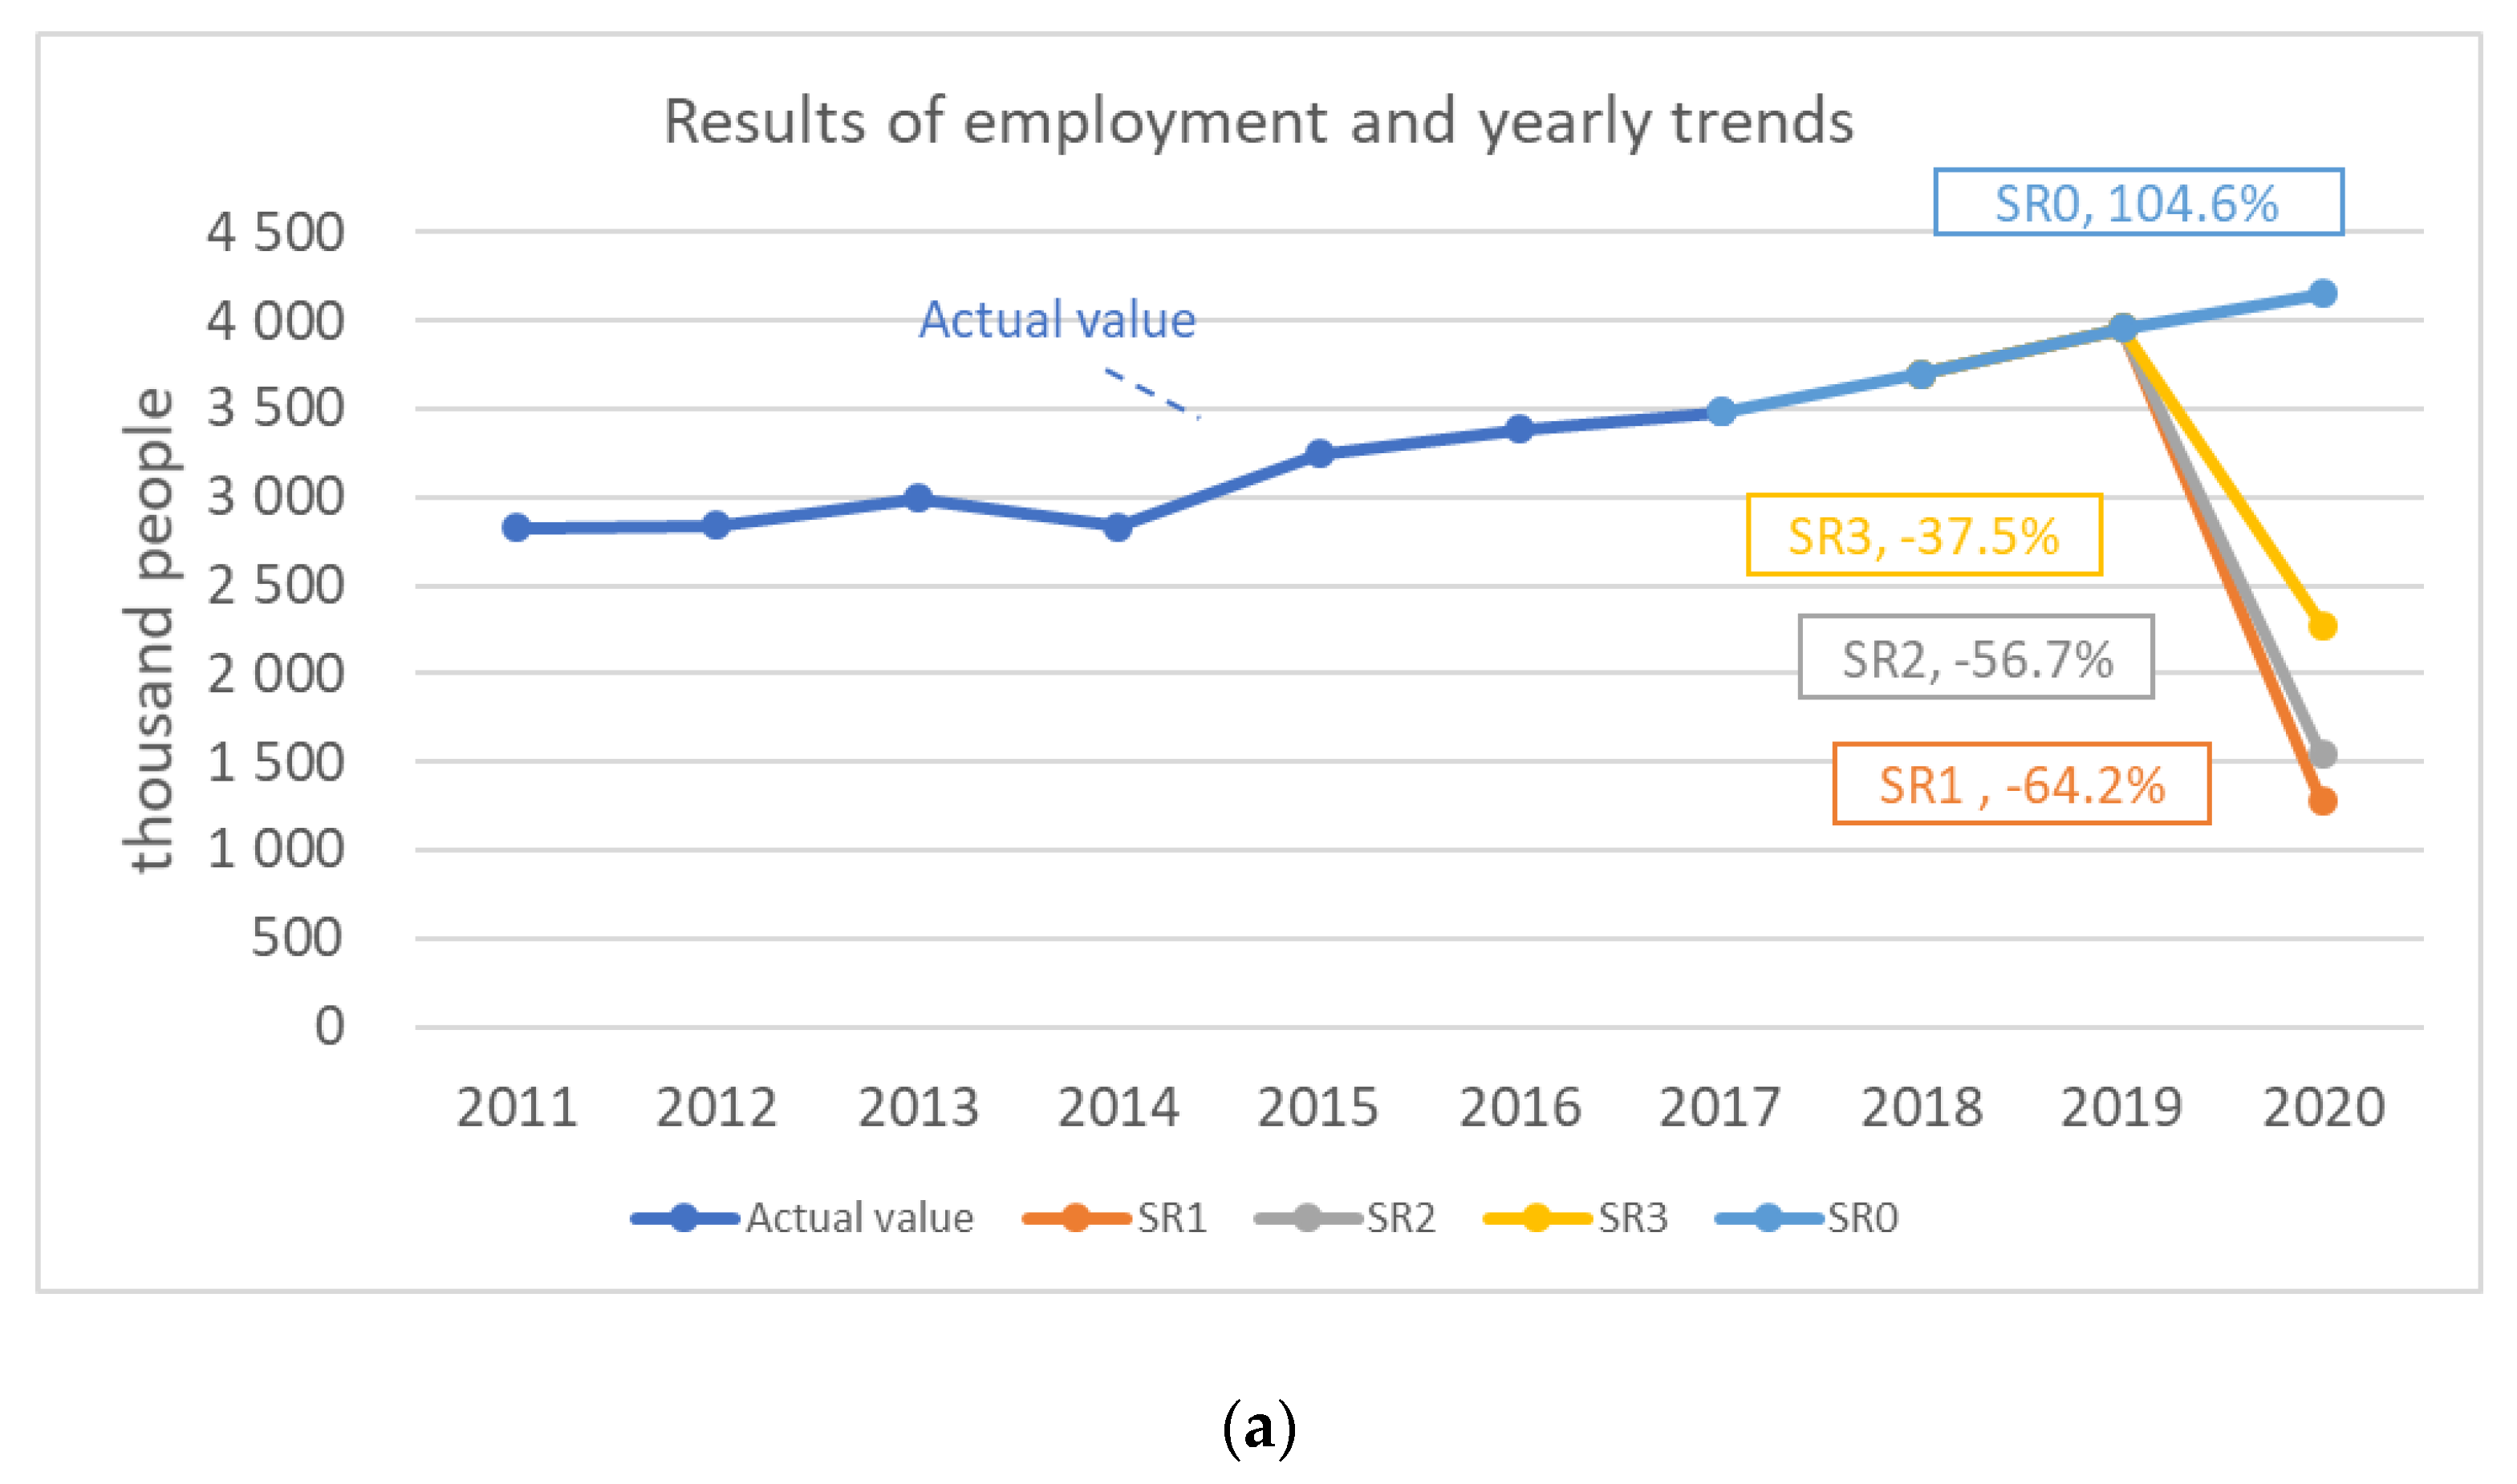
| Social (thousand people) | 3955.2 | 1277.7 | 1540.5 | 2278.2 | 4156.1 |
| 2020 SR 1 vs. 2019 | 2020 SR 2 vs. 2019 | 2020 SR 3 vs. 2019 | 2020 SR 0 vs. 2019 | |||||
|---|---|---|---|---|---|---|---|---|
| Economic (B-JPY) | −20,540 | −65.1% | −18,481 | −57.8% | −12,704 | −39.1% | 1520 | 104.5% |
| Environment (kt-CO2eq) | −89,488 | −64.2% | −80,159 | −56.7% | −54,030 | −37.5% | 6295 | 104.2% |
| Social (thousand people) | −2677 | −64.2% | −2415 | −58.3% | −1678 | −37.5% | 201 | 104.6% |
Publisher’s Note: MDPI stays neutral with regard to jurisdictional claims in published maps and institutional affiliations. |
© 2020 by the authors. Licensee MDPI, Basel, Switzerland. This article is an open access article distributed under the terms and conditions of the Creative Commons Attribution (CC BY) license (http://creativecommons.org/licenses/by/4.0/).
Share and Cite
Kitamura, Y.; Karkour, S.; Ichisugi, Y.; Itsubo, N. Evaluation of the Economic, Environmental, and Social Impacts of the COVID-19 Pandemic on the Japanese Tourism Industry. Sustainability 2020, 12, 10302. https://0-doi-org.brum.beds.ac.uk/10.3390/su122410302
Kitamura Y, Karkour S, Ichisugi Y, Itsubo N. Evaluation of the Economic, Environmental, and Social Impacts of the COVID-19 Pandemic on the Japanese Tourism Industry. Sustainability. 2020; 12(24):10302. https://0-doi-org.brum.beds.ac.uk/10.3390/su122410302
Chicago/Turabian StyleKitamura, Yusuke, Selim Karkour, Yuki Ichisugi, and Norihiro Itsubo. 2020. "Evaluation of the Economic, Environmental, and Social Impacts of the COVID-19 Pandemic on the Japanese Tourism Industry" Sustainability 12, no. 24: 10302. https://0-doi-org.brum.beds.ac.uk/10.3390/su122410302