1. Introduction
The agricultural landscape is the most effected part of the landscape in the world due to climate change and landscape development. Soil reclamation changes the infiltration properties and surface runoff, which affect the groundwater reserves, sediment removal by watercourses and evapotranspiration in the landscape. Landscape and agricultural hydrology represents the elementary analysis of the processes of landscape creation and development. The names of landscape forms have stabilized mainly based on sufficiency and water shortages in the landscape. Ongoing climate change is redistributing the cycle and the amount of water in the landscape. The acceleration of natural hydrological processes is influenced by the economic interests of land users, such as changes in cultivated crops, which can fundamentally change the water consumption in the landscape. Small water reservoirs (SWR) are an integral part of the agricultural landscape and make a significant contribution to the protection and creation of the environment. In addition, SWR significantly contribute to the improvement of water quality in the river basin, they are of extraordinary and irreplaceable importance in areas with small watercourses and a sparse hydrographic network. The positive impact of SWR, mainly in the agricultural landscape, is indisputable. However, the positive role of SWR can be provided only in case of careful and responsible designed and sensitive integration into the landscape to increase water retention and water quality [
1].
In recent decades, the impact of climate change and human activities on the global environment has become more and more obvious. In particular, it has affected the spatial and temporal distribution of surface water resources and various factors in the water cycle (runoff and sediment load) [
2].
Dam construction and operation can have significant impacts on hydrological regimes. If dam construction induces some basic alterations to basin hydrology, dam operation can introduce dynamic alterations in streamflow [
3]. One of their purposes is flood protection of downstream. Waves in the reservoir influence the design process of structural elements, primarily for earthen dams. Extreme high discharges to reservoirs are usually combined with strong winds which are main driver of waves on the inland and lowland reservoirs. This can lead to water level increases and make a reservoir incapable of providing the expected flood protection [
4]. Therefore, the overtopping of the dam may occur in case of higher water level in the reservoir and can cause damages on the dam crest, upstream and downstream face, and the waves themselves can affect shoreline retreat (abrasion), and other structures (e.g., roads, recreational facilities) [
5] and contribute to the reservoir siltation—a process that endangers water reservoirs worldwide [
6]. Based on the wind data (speed and direction) at a steady state it is possible to predict wave properties [
7], what must be considered during the dam design process.
Nowadays, several theories and mathematical methods have been developed to describe the movement of water surface and estimation of wave parameters (wave height and period). The description of wave mechanics is well described by several authors [
8,
9,
10] as well as extended methods of wave modelling [
11,
12]. Most of the wave transformation models were developed for the oceans or large reservoirs and dams [
10,
11,
13]. Only few of them can predict wave parameters on small water bodies, as presented by Ozeren and Wren or Pullen et al. [
8,
9].
The energy-based models assume the wind-driven waves carry the pertinent amount of energy. In the ocean conditions, e.g., the mechanical wave energy may be converted into the form of electricity by various types of devices [
14]. The wind transfers its energy to the waves also in case of small water reservoirs and the mechanical wave energy is big enough to cause the dam deterioration and shoreline erosion resulting in accessory siltation of reservoir.
The dams of large water reservoirs are usually well protected by proper technical stabilization measures supported by appropriate elevation calculations of the dam crest above the designed water levels in the reservoir. The first wave transformation models were developed in the USA (e.g., ACES, NMLONG). As waves spread over the water level, they may continue to grow due to the continued action of the wind or may lose energy due to breaking, bottom friction or percolation. These effects cannot be realistically incorporated through manual calculations. Advanced wave propagation steady-state linear monochromatic or spectral models RCPWAVE, REFDIF, STWAVE were designed for open coast areas in the 1980’ [
10]. Several new wave models (e.g., MIKE21 SW, OVBN, WAVEWATCH III) were developed in the last decades [
11].
The models designated as Shore Protection Manual SPM [
15] and Coastal Engineering Manual CEM [
10] were developed by the U.S. Army Corps of Engineers in conditions of world oceans, seas and large inland water bodies. The model designated as ASABE was developed and verified by the American Society of Agricultural and Biological Engineers in conditions of water reservoirs in the USA [
9]. All models investigated follow similar fundamental presumptions and their essentials are historically connected with research activities in the first half of the 20th century.
In Slovakia and in the Czech Republic, the wave parameters and characteristics should be calculated during the design process of dams and stabilization measures along the water reservoir shoreline according to the Slovak Technical Standards (STN) 75 0255 “Calculation of wave effects on waterworks and weir basins” valid from 1988 [
16], Czech standard specification (CSN) 75 0255 with the last update in 1987, respectively [
17]. The calculation methods advised by STN or CSN, respectively are based on the commonly used principles of regular and irregular wave theories with some modifications following the research in the fetch-limited conditions on dam reservoirs of common Central European size (e.g., determination of the effective fetch, empirical coefficients in the equations of wave parameters, etc.).
The effect of wave regime on earthen dams is considered during the design in two ways, (i) the elevation of the dam crest above the water level in the reservoir with respect to overtopping waves, and (ii) the design of protection measures of the downstream face. Lukáč and Abaffy [
18] examined the protection of several Slovak dams against wind-driven waves and incidental shoreline erosion processes in the 1970s. In the Czech Republic, analogous research into the estimation of wind-driven waves and shoreline stabilization measures was performed e.g., on reservoirs in Brno, Kníničky or Nové Mlýny [
19,
20,
21].
The important decision during the design process consists in the formulation of the protection degree—setting up of the design wave height and design wind speed. Dams and embankments should be protected from the effects of waves of 1% exceedance probability according to the mentioned STN; however, 2% probability of run-up height exceedance is currently recommended for practical use, as a result of expert observations and discussions [
22]. The remaining shoreline of the reservoir should be protected from the effects of characteristic wave with 13% probability of exceedance due to possible high expenses spent on stabilization measures [
16,
17].
Although the recommended calculation methods and models are available nowadays, the estimation of wind-driven waves on inland small water reservoirs and their effects on water reservoir structures are applied rarely [
13]. Additionally, the elevation of the dam crest or embankment reinforcement above the designed water levels in reservoir is not usually verified. The design is performed by rule of thumb with high level of uncertainties which may lead to a serious failure of the earthen dam especially, due to the overtopping waves.
Even though it has been proved that overtopping of the earthen dam crest with the flood wave due to a lack of capacity of the emergency spillway usually causes dam breakage, the effects of the accidental crest overtopping by wind-driven waves in relation to the total resistance of the small reservoir dam have not been sufficiently researched, yet. EUROTOP [
8] presented results of the research focusing on the wave overtopping of sea defence structures, including the resulting recommendations but they were not tested for the small inland reservoirs. Most of the current research related to SWR is focused on the current water volume and siltation of reservoirs [
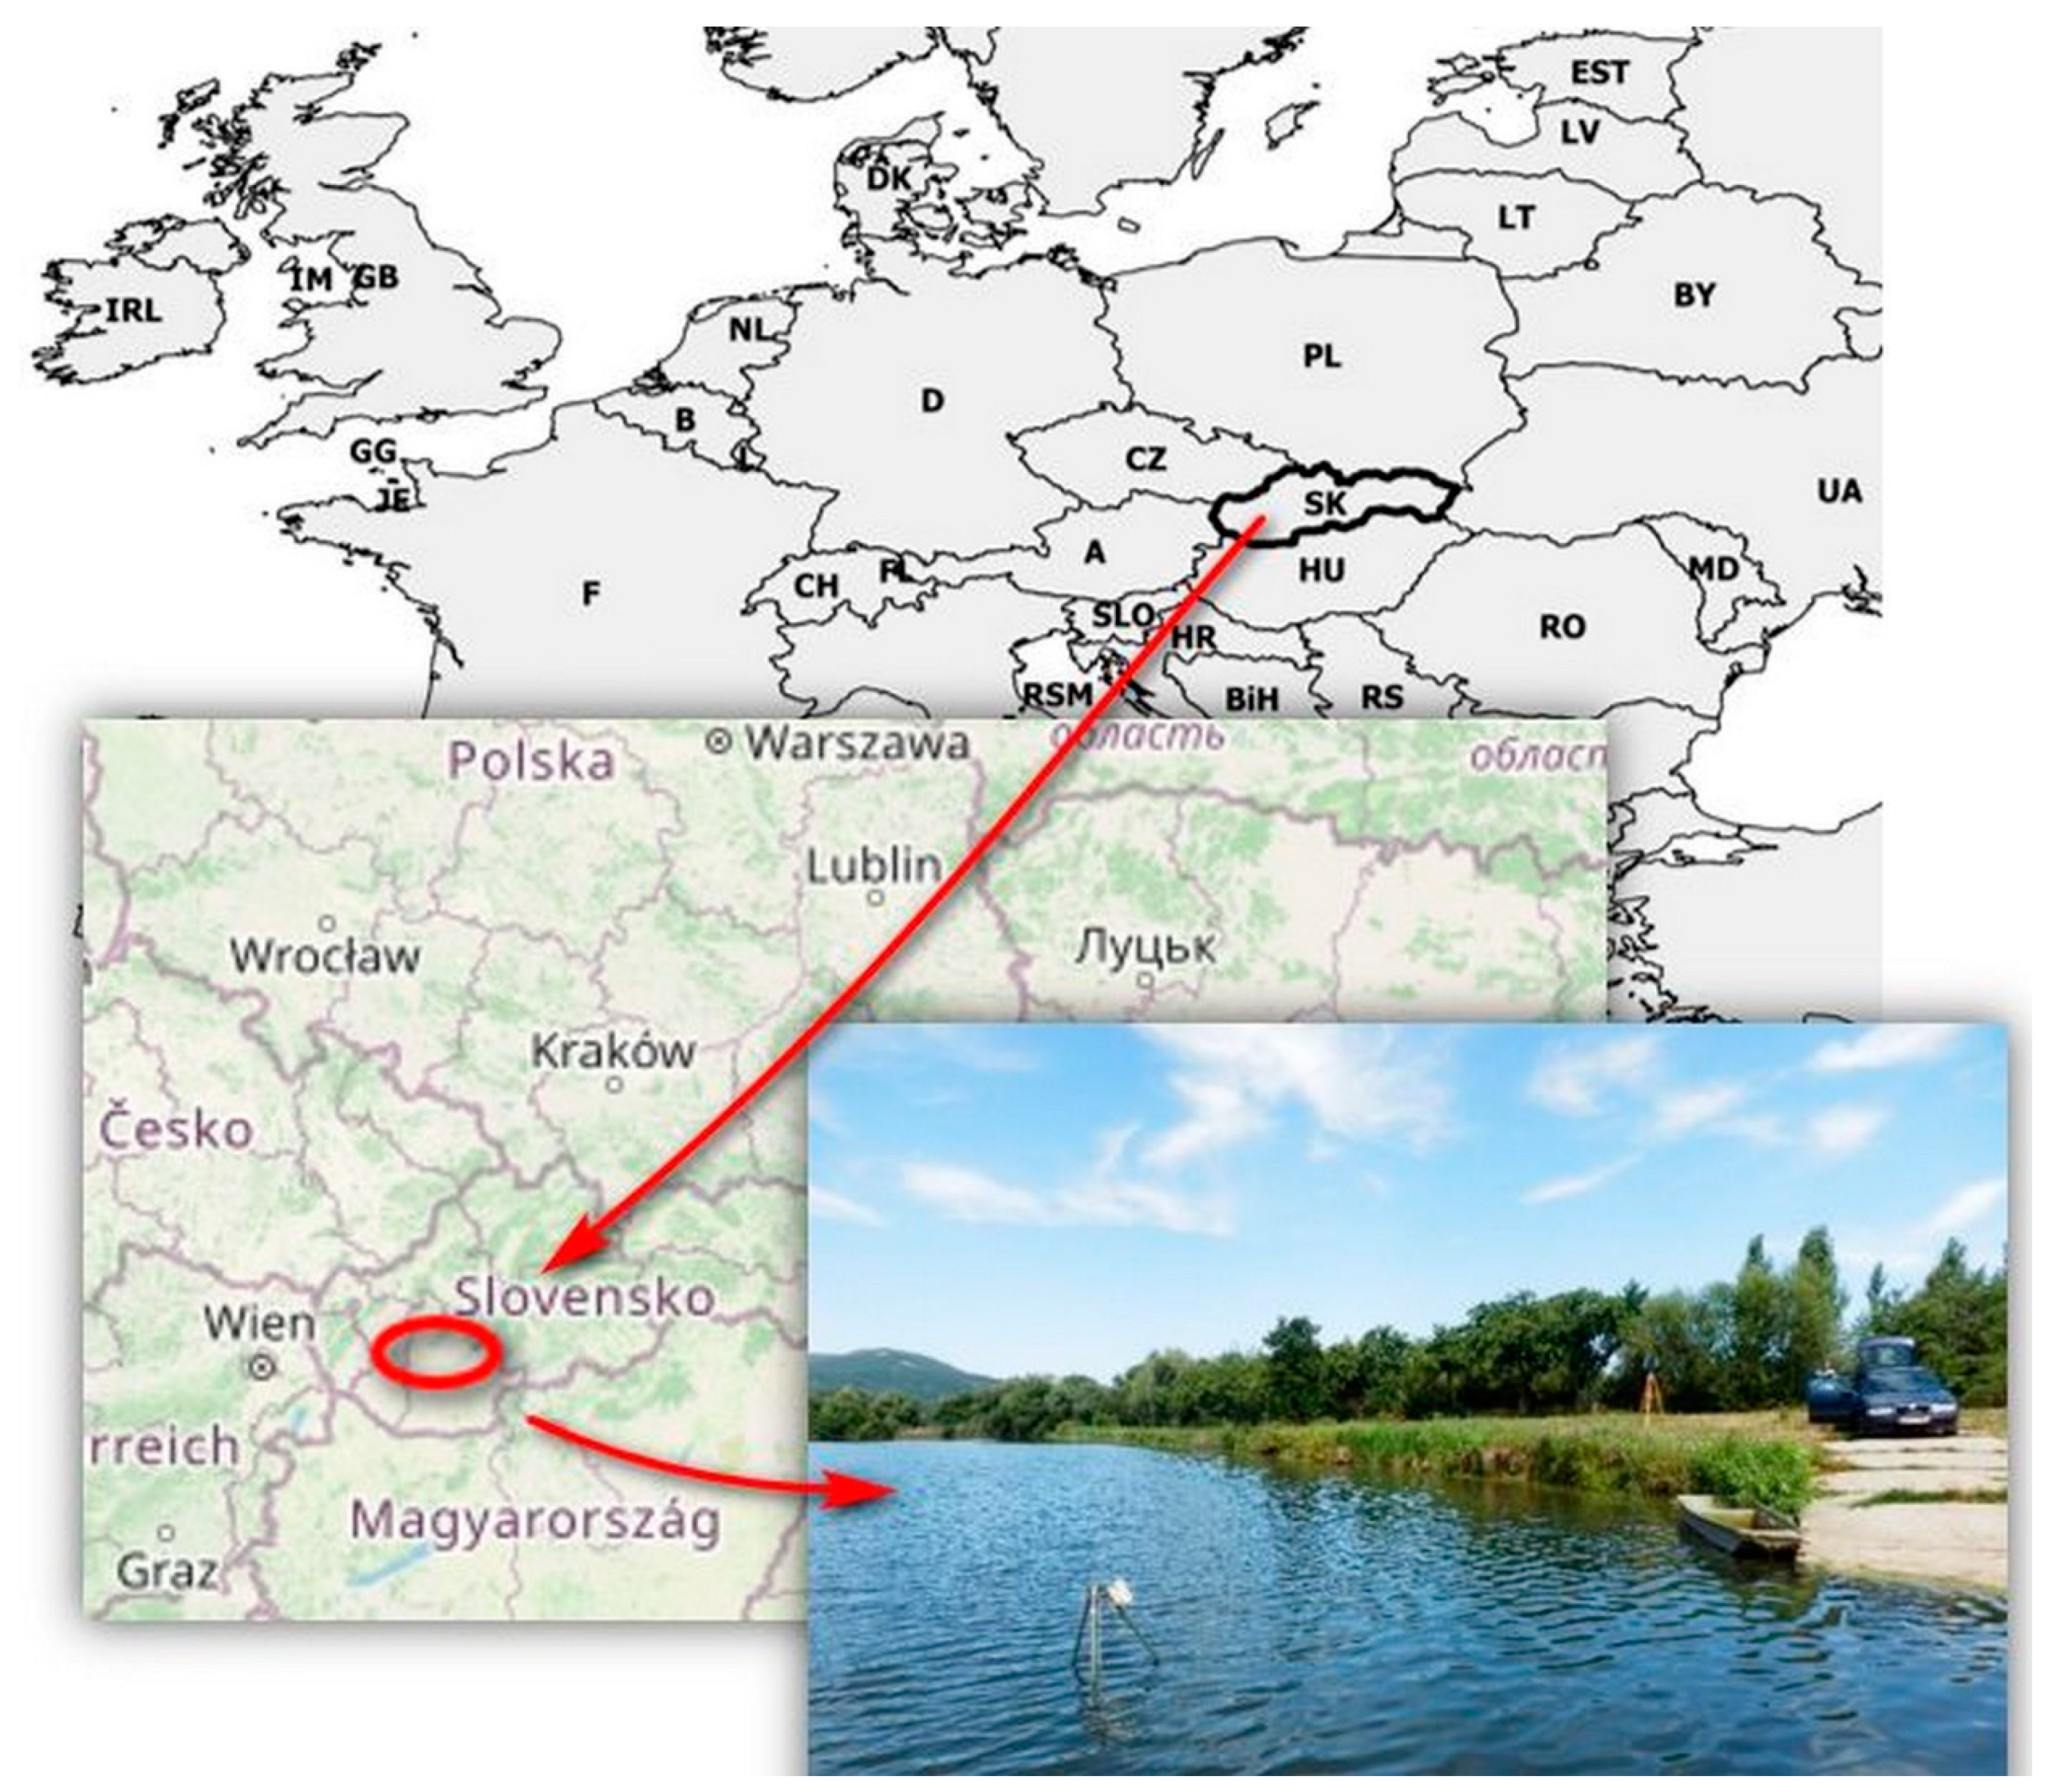
6]. The problems of the dams are not in the focus. Therefore, this study presents the calculation of wave parameters by several models with respect to wave overtopping considering various wind speed scenarios through a case study approach in Slovakia—small water reservoir Kolíňany.
3. Results and Discussion
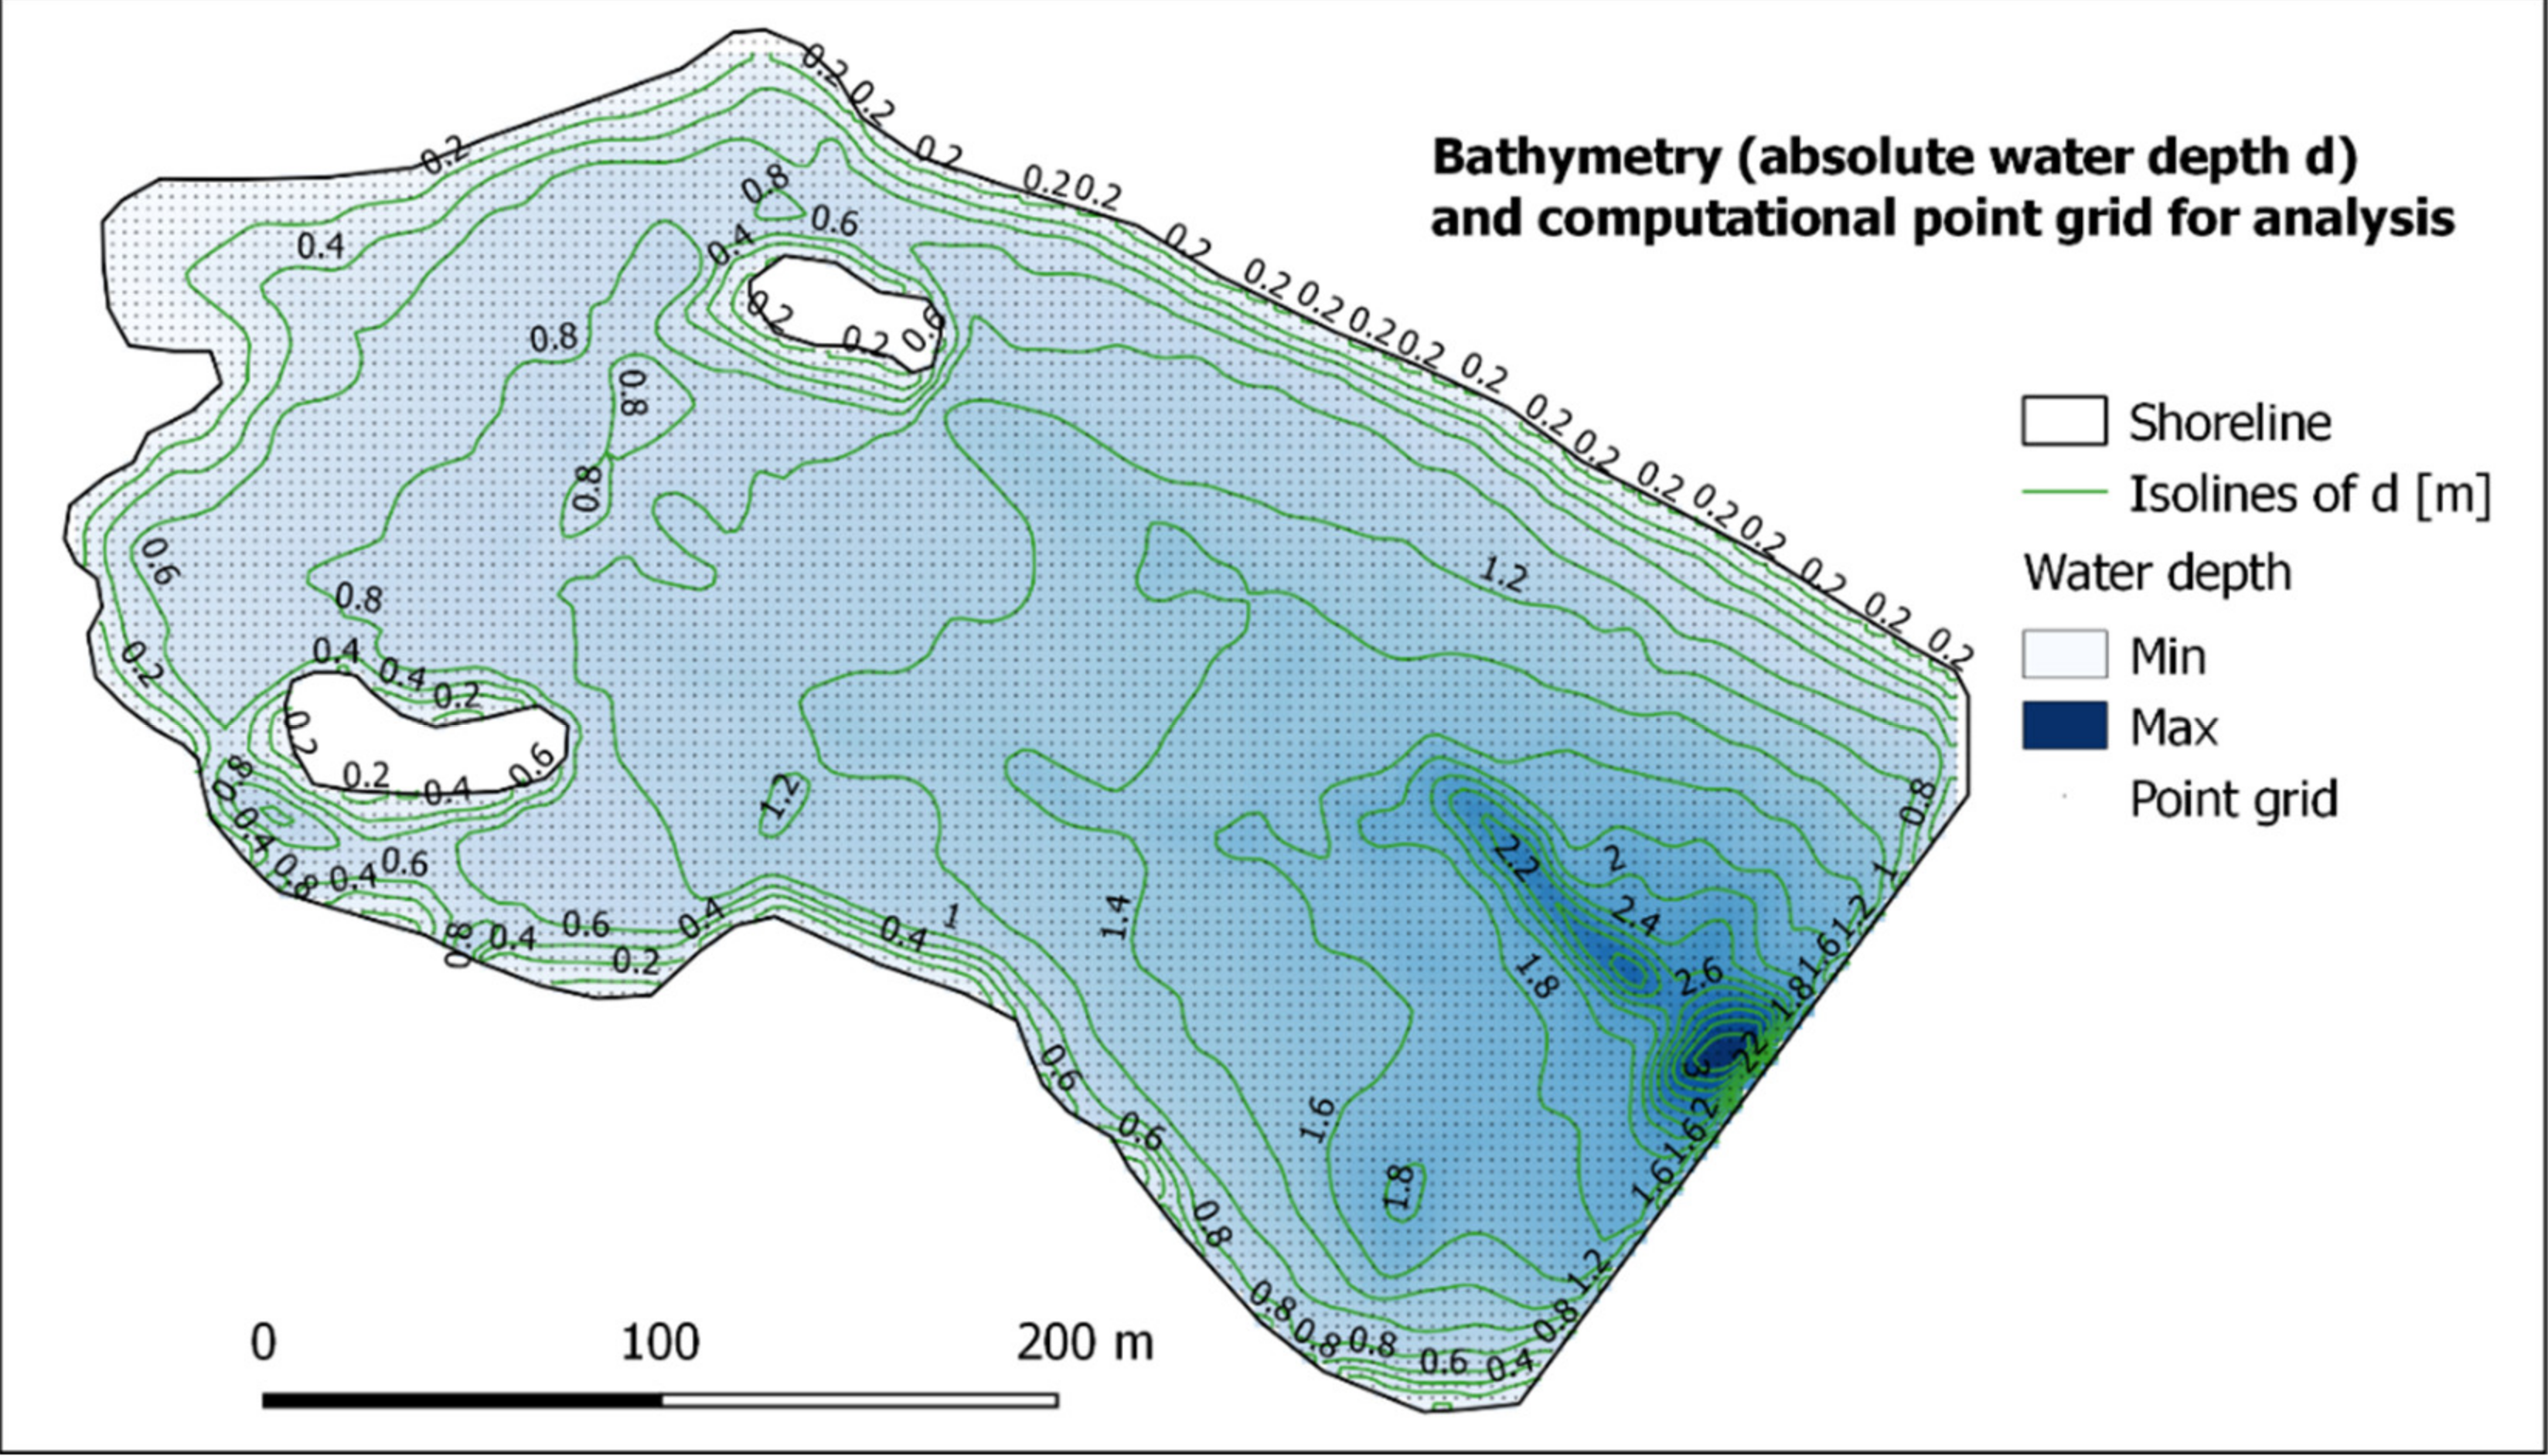
The point for which the water run-up analysis has been conducted is located approximately in the middle of the dam length close to the outlet device. Its location was selected based on the most adverse combination of the theoretical wind fetch length and the lowest dam crest elevation—180.40 m a.s.l.—caused by the construction settlement.
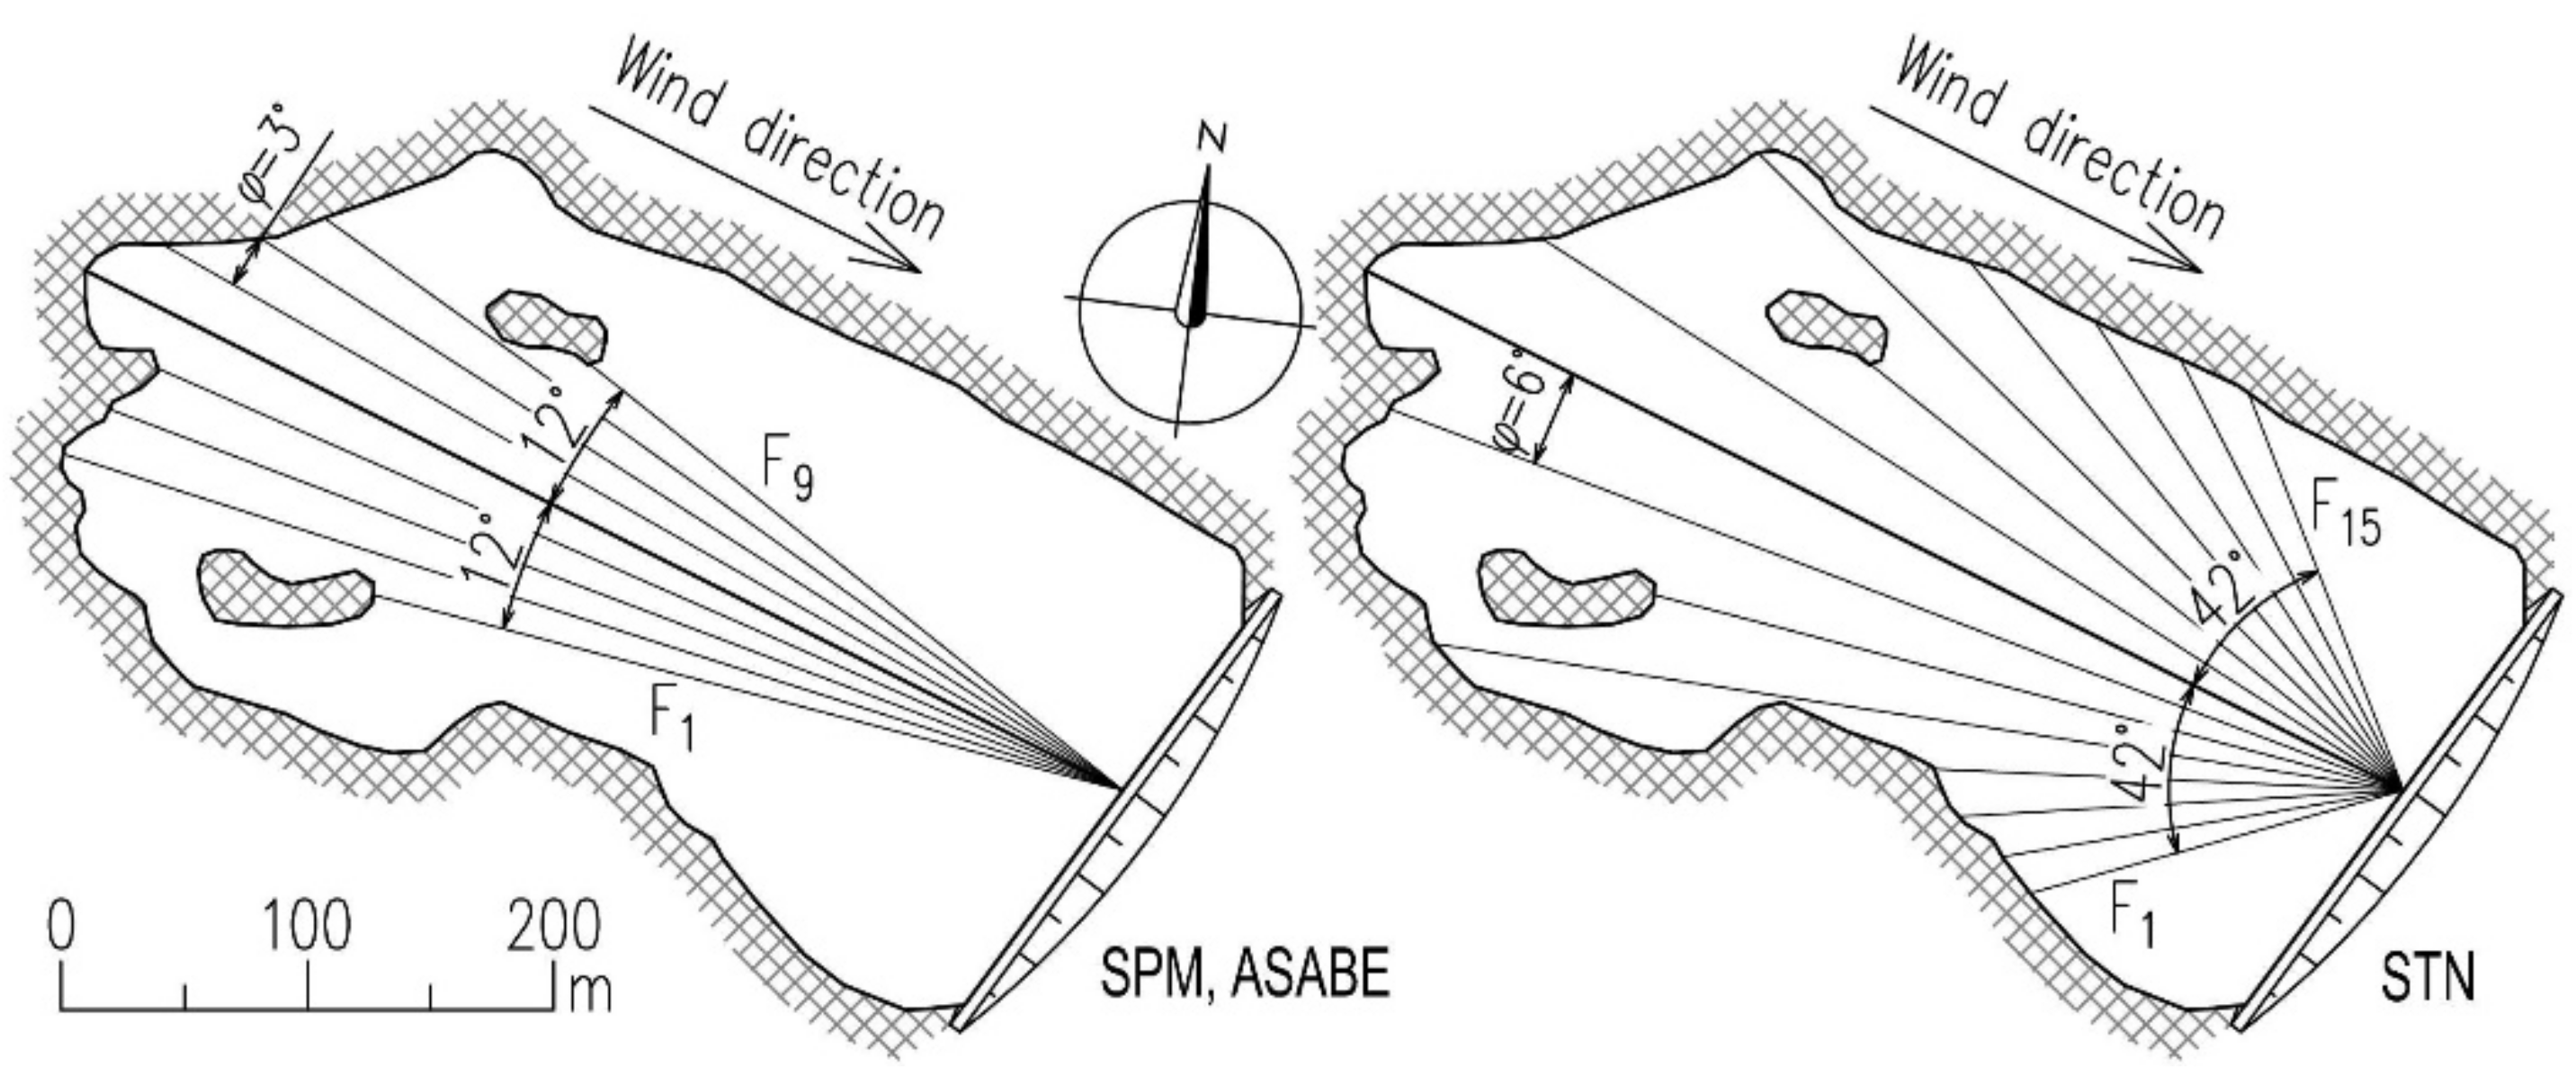
The different methodology of wind and fetch determination in the models induced the difference in assumed fetch length [
29]. Based on the reservoir shape and its orientation, the WNW wind blowing in the 290° direction was determined as the most adverse concerning threat to the dam. The reservoir is situated in the plain without morphological obstacles affecting the wind at the 10m reference level. However, the wind direction, and wind speed over the water surface is affected by the vegetation cover partially surrounding the water reservoir. The right bank (west side) of the reservoir is overgrown with poplars (
Populus nigra), arrows (
Rosa canina), hawthorn (
Crataegus laevigata) and other bushes. Trees and bushes at north and east-north side has lower high. South and east side is without high trees. Thus the most adverse wind direction is not affected notably even by vegetation.
The main fetch ray plotted in the given wind direction φ0 has a length of 471 m. To determine the effective fetch length, eight more rays with 3° angle increments were plotted in compliance with the SPM and ASABE method. Their lengths ranged between 280 m and 451 m, the calculated fetch length has a final value of 405 m. According to the CEM, the fetch length was considered as a linear distance between the point of analysis and the opposite bank in the main wind direction, i.e., 471 m. According to the STN, 14 other rays were plotted with 6° increments and lengths of 157–440 m.
The STN recommends using the greater length of effective fetch length
Fef and the radial line
φ0 to decrease the overtopping of dam crest. Therefore, the length of 471 m instead of
Fef = 273 m, was used for the following calculations. The determination of the fetch length in compliance with the above methods is affected by the two islands in the western part of the reservoir, which represent a wave shadow and thus reduce the wave-forming surface (
Figure 3).
The wave parameters (the characteristic wave height
H13% and the wave period
Tp) were calculated by the equations in
Table 1 and
Table 2 for the appropriate fetch length above the water level. The maximum design wind speed at the reference height of 10 m above the water surface
u10 was considered 25 m·s
−1 according to the STN recommendation.
3.1. Wave Height H13%
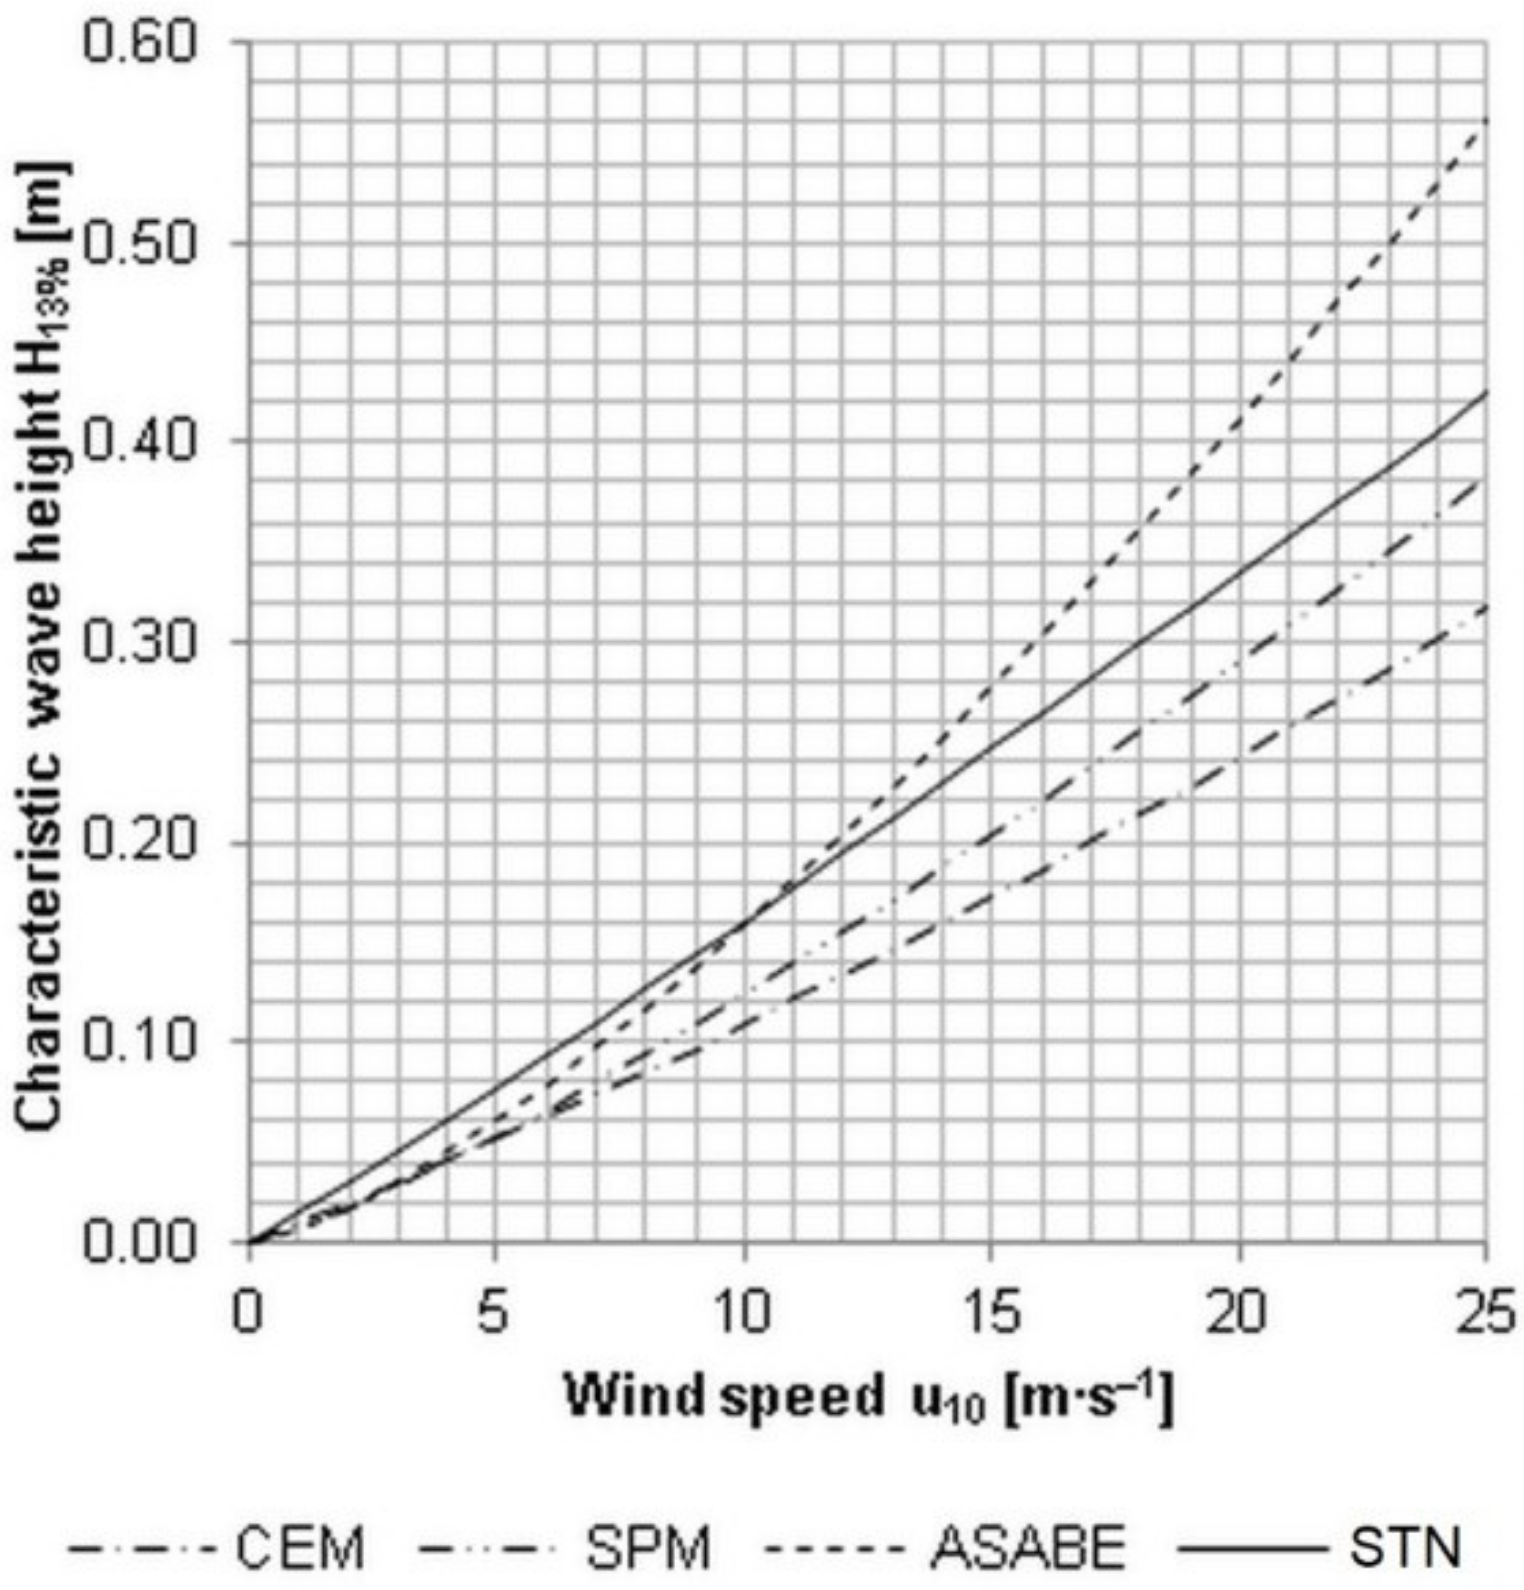
The prediction of the characteristic wave height
H13% was performed by four models (CEM, SPM, ASABE, STN) based on the selected wind speed at the point of analysis. The lowest values of wave height were calculated by the CEM model—0.32 m. In contrast, the highest values of the wave height with the same wind speed are gained using the ASABE model—0.56 m. The estimates of the STN and SPM reach 0.42 m and 0.38 m, respectively (
Figure 4).
The STN method estimates the highest wave heights up to the wind speed of 10 m·s
−1, afterward the values are lower than by ASABE but higher than CEM or SPM, respectively. The models developed for the conditions of the seas and oceans provide lower estimates of the wave heights compared to the models adapted to the conditions of water reservoirs, which was also confirmed by experimental measurements on irrigation reservoirs in the USA by Ozeren and Wren [
9]. Underestimated results of fetch-unlimited model discussed Pelikán and Koutný [
29], comparing the measured data with models.
3.2. Wave Periods Tp and Wavelength L
Similar results of wave periods to wave heights were achieved. The CEM model also predict the lowest values of estimated wave period (1.32 s), and the ASABE model (2.11 s) the highest one. Correlation of results by ASABE and STN model is higher than in case of wave heights, and their values have a similar trend (
Figure 5). The prediction of the wave period according to the STN is the highest up to the wind speed of 18 m·s
−1. The resulting maximum periods of around 2 s correspond to the results of a former study of the gravitational oscillating waves on dams and reservoirs, based on which Lukáč and Abaffy [
18] stated that a wave period of 5 s at maximum can be expected in Central European dams of usual dimensions.
Comparison of measured values in the field and calculation by the same group of models presented by Pelikán and Šlezingr [
21] provides similar results. Furthermore, the results of all three models better correlate to the results of field measurements than values calculated by STN.
The above relations for calculating the wave run-up on the slope use wave parameters height and period in the deep-water conditions. Following wave characteristic—wavelength L—was calculated by Equation (7). It can be used to establish the relative depth based on the assumptions of Airy linear wave theory [
10,
30]:
In the deep water, the wavelength is only a function of their period. The relative depth
d/L is given by the ratio of the current water depth
d at a specified point and the length of the relevant wave
L. If
d/L > 0.5, the condition of the wave in the deep water is satisfied. The values of the period
Tp and wavelength
L increase for a given fetch length and with the increasing wind speed [
10]. Thus, the relative depth
d/L drops below the critical value, and the wave begins to be affected by the reservoir bottom.
The calculation of wavelength was made for the point of analysis at the dam with selected wind speeds and the subsequent determination of relative depths and verifying the conditions of deep water for waves of the resulting parameters. The values of wave characteristics change gradually with constant wind of a given speed along the main wind fetch direction—the wave becomes higher and the period longer. Thus, at every point in the reservoir are waves of different parameters at the same time. From the above mention it results that the relative depth is different for each wave and it cannot be established uniformly for all considered wind speeds. The absolute depth of the reservoir d in the direction of the analysed wind 290° grows towards the dam up to a value of nearly 4 m, thus the conditions of deep water for the considered range of values of wave parameters within the analysis are met.
Based on the current knowledge and research results in the field of wave mechanics and the stabilization of dams [
8,
22], the wave run-up of with 2% exceedance probability
R2% was selected to verify the overtopping of the dam crest.
The wave run-up on the slope for models CEM, SPM, and ASABE was calculated by equation (3). The equation is designed for smooth impermeable slopes [
10], which corresponds to the concrete prefabricated pavement on the upstream slope of the dam. However, the calculation would be appropriate even for a different type of slope armour, with a resulting enough margin to meet the safe conditions. Equation (5) for the determination of the Iribarren number according to Walton [
10] uses the characteristic wave heights and lengths for the individual design wind speeds and the dam upstream slope of 1:1.5 (expressed in degrees α = 33.69°). The Iribarren number for all three models within the analysed range of wind speeds ranged between approximately 1.5 and 3.0, which in terms of the wave breaker criteria corresponds to plunging [
10].
3.3. Wave Run-Up
As Stockdon et al. [
26] state, wave run-up can, in general, be estimated from knowledge of offshore wave height and period (or wave spectra) and nearshore topography, including the slope of the intermittently wet and dry foreshore. The estimate of the wave run-up by the STN method was done by parametric Equation (6), which uses the considered wave height with a 1% exceedance probability as the input value. The conversion from the value of the characteristic wave height is conducted by the relation defined in the standard:
H1% = 1.4
H13%. The value of the coefficient dependent on the roughness of the slope reinforcement was selected
kd = 1.0, whereas the slope is protected by concrete blocks with the smooth surface up to 180.15 m a.s.l. The rest of the slope above the blocks up to the dam crest (180.40 m a.s.l.) is only covered by grass, which can also be considered as smooth surface for the purposes of wave run-up stress. Coefficient
kp dependent on the
L0/H1% ratio achieved values 2.35–2.65 for the considered range of wind speed.
Elevation point 179.50 m a.s.l. corresponds to the still water level in the reservoir (SWL) and the dam crest is at 180.40 m a.s.l. The highest estimates of wave run-up are predicted by the ASABE model, within which the theoretical wave run-up at the maximum wind speed reached the value of
R2% = 1.68 m, followed by the STN model with the value of 1.35 m, SPM 1.05 m and CEM 0.84 m, respectively (
Figure 6). Since the SWL in the reservoir is only 0.90 m below the dam crest, the dam overtopping by wind-driven waves can be expected from the critical wind speed, which will cause wave run-up
R2% > 0.90 m. This critical wind speed is 27 m·s
−1 in the case of the CEM model, 22 m·s
−1 in the case of the SPM model, and only 15 m·s
−1 in the case of the ASABE model.
Figure 7 shows the cross-section of the dam at the point of analysis with a schematic diagram of the wave run-up according to the STN at selected wind speeds. The height of the wave run-up of 0.90 m corresponds to the critical wind speed of 17 m·s
−1, at which the wave parameters are
H0 ≈
H13% = 0.28 m,
T0 = 1.73 s, and the wavelength
L0 = 4.7 m.
3.4. Possible Results Application
The current state of the upstream slope and spillway should be renovated in the next years. The presented results can be a possible source of information needed in the decision making. In Slovakia, the construction of reservoirs and dams’ dates back to the beginning of 16th century. An important position in the development of dam construction in Slovak territory belongs to the first half of the 18th century, which rightfully belongs to the adjective “Golden Age of dam construction”. It was mainly driven by the development of the mining industry in the Banská Štiavnica districts, where gold, silver and other precious metals were mined, especially from 17th to 19th century [
31]. There are currently more than 330 reservoirs and dams in operation in Slovakia. These can be divided into three categories according to age and importance: historic reservoirs and dams with a number of 50 (so far many functional), more than 230 dams of small water reservoirs (local importance), dams and reservoirs in the ICOLD World Register with a number of 50 (regional to national significance). At present, many SWR are silted with sediment and many of them were damaged during floods, so it is necessary to drain the reservoir and reconstruct the damaged parts. For this reason, and also due to changes of the needs and the distribution of water in the landscape impacted by climate change, efficient utilization of capacity and the use of existing knowledge, e.g., use of models, should be consider during the reconstruction design of damaged parts of SWR. These models allow us to quickly compare designs of different variants that could be used in reconstruction or design of a new reservoir. There is intention to build up several new SWR close to the Kolíňany dam [
32].
The assessment of overtopping dam crest is usually implemented during the design process of the reservoir. The computational models correspond to the current state-of-the-art. Reconstruction of the reservoir represents a good opportunity also for redesign hydrotechnical structures and its parameters using recent methods and models.
The resulting values of wave run-up can be used to determine the height of the so-called safe level for the given design wind speed. This level may be considered based on the maximum height of the wave run-up R2% in relation to the dam crest (180.40 m a.s.l.) or in relation to the level of the upstream reinforcement (180.15 m a.s.l.). In case of the design of the maximum wave run-up reach at the wind speed of 25 m·s−1 up to the dam crest, the SWL of the water in the reservoir should be reduced to 179.05 m a.s.l. according to the STN model. If the considered maximum reach of the wave run-up is the top of the upstream armor, the SWL should be 178.80 m a.s.l., which is about 0.70 m below the current general state. Such a quick regulation of the water level in the reservoir without permanent operation staff is not possible. So far, the dam crest of Kolíňany water reservoir has not been overflowed and overtopped, even during the extreme flood situation in 2010 and 2020.
4. Conclusions
The study follows similar research conducted at Czech and Slovak dams from the 1950s [
18,
19,
20], with an added value consisting in the implementation of the current scientific national and foreign knowledge within the field into the conditions of small water reservoirs. The aim of the research was to perform the analysis of wave parameters and wave run-up on the upstream slope of the small water reservoir dam. The calculations were accomplished according to four different models. Although selected models are historically linked and respect similar principles of water wave mechanics, the results differ.
Based on the results of the analysis, we can conclude that CEM and SPM models generally provide lower estimates of wave parameters (height and period) and wave run-up. These models have been developed in the environment of seas and very large water bodies. Regarding to all the calculations of the investigated variables H, T, R, it is valid that with the increasing wind speed the variance of resulting values increases. The standard deviation of the model values of R2% at the wind speed of 25 m·s−1 is 0.37 m, which indicates relatively high level of uncertainty and the selection of suitable calculation model for specific conditions must be considered. STN and ASABE models provide higher estimations of the set boundary conditions. Therefore, they can be used to calculate appropriate dam parameters and design stabilization measures with higher requirements regarding safety. Critical wind speeds have been established by iteration corresponding to each model. Dam crest overtopping by wind-driven waves at the still water level 179.50 m a.s.l. can be expected in case of excess of critical wind speeds.
The investigated specific issues are not sufficiently researched and there is no experience and relevant literature available for small water reservoirs. The benefit of the study lies in the idea of possibility of systematic assessment on water reservoirs in whole catchment areas in advance contributing to complex sustainable water management.


