1. Introduction
The use of renewable energy, such as solar energy, is a suitable measure for coping with the scarcity of fossil fuels and their associated problems, such as the emission of Greenhouse Gases (GHG) and their growing impact on global warming and climate change. The use of off-grid photovoltaic pumping irrigation systems has increased recently not only because of their environmental benefits but also because of their economic profitability because the cost of conventional electrification in isolated rural areas is rising, whereas the price of PV cells has dropped in recent decades.
The possibility of storing both water and energy in an elevated reservoir or in the soil is another valuable feature of photovoltaic irrigation systems, although in some cases, battery banks are used to store the energy [
1]. In addition, in many crops, water consumption is strongly dependent on radiation [
2,
3], thus PV energy production and energy consumption can be synchronized so the design of these systems can be simpler and more economically and environmentally efficient.
Different typologies of PV irrigation systems exist, namely those that pump water to an elevated tank or reservoir and direct pumping irrigation systems that transport water directly to the irrigation pipe distribution system. The latter type is less common and more complex to operate, primarily because energy production and consumption need to be matched perfectly [
4,
5,
6] as the capacity of the soil profile to store water is limited, especially in sand dominant or coarse soils. In addition, the flowrate of these systems is usually constant because it depends on the discharge and number of the emitters of the irrigation units, so adopting strategies to adapt the flowrate to the available energy is much more complicated. Different authors have comprehensively analyzed this kind of system in order to propose operation strategies able to match energy supply and demand and optimize their performance [
7,
8,
9,
10].
The first type of PV irrigation system mentioned is the most common because the bias between the energy supply and demand can be balanced by storing water in an elevated storage tank or reservoir [
11]. Despite their advantages, these systems also feature some drawbacks, such as the reservoir investment costs and higher evaporation losses from the reservoir [
12].
The sizing of these systems must consider the different parts that comprise the system itself, which makes finding an optimal design a difficult task because there are many options to choose from and all the components of the system are interrelated.
Many authors have developed simulation models of the PV irrigation systems and have tried to find an optimal design by performing a sensitivity analysis. The said procedure is simple, but the number of iterations should be very high in order to find a suitable solution. For example, Glasnovic and Margeta [
4] developed a simulation model in order to find the optimal solution by performing a sensitivity analysis. Yahyaoui et al. [
13] developed an algorithm for sizing PV irrigation systems for tomato crops. Campana et al. [
14] followed a similar approach. Bouzidi [
15] also developed a simulation model of the system and used two optimization criteria: The concept of loss of power supply probability (LPSP) for the reliability assessment and the life cycle cost (LCC) for the economic evaluation. Maleki and Askarzadeh [
16] and Maleki and Pourfayaz [
17] also used the LPSP concept for different kinds of hybrid PV systems. Hamidat and Benyoucef [
11] proposed a systematic procedure for sizing PV irrigation systems with storage.
Due to the complexity of the problem, the use of powerful and robust optimization methods is needed for determining an optimal solution, both from an economic and environmental perspective. More specifically, the use of heuristic methods is the most suitable approach for this problem as heuristic approaches can handle complex global optimization problems. Heuristic methods can be defined as a special type of optimization method based on simple rules, which on many occasions mimic some biological or physical processes, capable of finding a “satisfactory” solution. Albeit this solution is not guaranteed to be optimal [
18], it is close enough to the optimum from a practical standpoint.
Several heuristic optimization methods have been applied to optimize the design of different types of PV powered systems. Among them, Maleki et al. [
19] applied different PSOs (particle swarm optimization algorithms) to the optimum design of hybrid (PV/wind/Batt) systems. Maleki and Pourfayaz [
17] also applied three classic heuristic algorithms and four new metaheuristics to the optimal design of a PV/WT/battery hybrid. Sanchez et al. [
20] evaluated the performance of the Particle Swarm Optimizer (PSO) method for the optimal design of a residential hybrid wind–photovoltaic–fuel power plant in Mexico.
Regarding the specific case of stand-alone PV pumping systems with water storage, Bakelli and Kaabeche [
21] proposed different metaheuristics, such as ant lion optimizer (ALO), bat algorithm (BA), cuckoo search algorithm (CSA) and gray wolf optimization algorithm (GWO). They concluded that the GWO algorithm outperformed the other algorithms. Olcan [
22] developed a multi-objective model that considered both the reliability and cost as objectives. On the other hand, EL-Shimy [
23] preferred to apply an efficient non-conventional direct method.
Genetic or evolutionary algorithms are perhaps the most well known and widely used heuristic methods and they have also been applied to the PV pumping design problem. For example, Dufo-López and Bernal-Agustín [
24] and Carroquino et al. [
25] used a Genetic Algorithm (GA) to design a hybrid PV-diesel system. Ma et al. [
26] also used a GA to optimize the design of a solar photovoltaic system with pumped storage. Mérida et al. [
27] proposed a multiobjective approach and developed a model called MOPISS that used a Non-dominated Sorting Genetic Algorithm (NSGA-II) for the optimal sizing of a PV irrigation system.
Despite their valuable advantages, the accuracy of heuristic methods and their convergence speed decrease as the size of the optimization problem increases. This inefficiency occurs because general purpose heuristic algorithms must explore a vast search space, and thereby devote a great effort to evaluating unfeasible solutions. To overcome this drawback, Reca et al. [
28] proposed a new hybrid evolutionary algorithm that was applied to the optimal design of a pipe network. This approach reduced the search space thus increasing both the convergence speed and accuracy of the solution.
In this study, a new heuristic method based on the hybrid approach using search space reduction is developed and adapted to the optimal design of stand-alone PV irrigation pumping systems with a storage tank. The proposed approach is based on iteratively reducing the search space by applying engineering-based rules to the problem with the aim of reducing the number of possible scenarios to analyze. The proposed methodology has been applied to minimize the cost of a benchmark case study. The proposed case study consisted in finding the optimal design of a stand-alone PV irrigation system for an olive orchard farm located in Tabernas (Almería).
2. Materials and Methods
2.1. Overall Description of the Optimal Design Approach
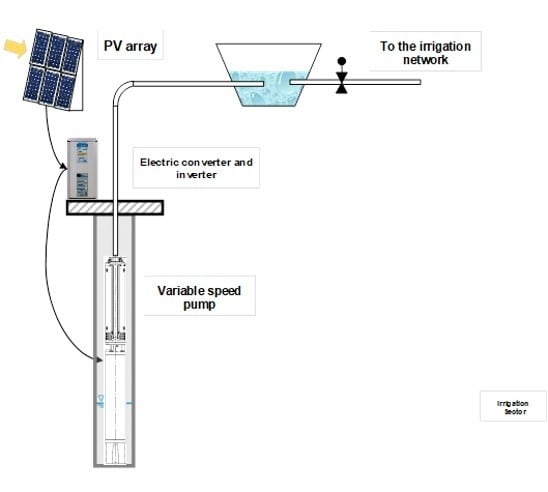
The system is composed of a photovoltaic array, a frequency converter, a variable speed pump and an elevated tank or reservoir that stores water with enough elevation to distribute it to the irrigation system. A scheme of the PV pumping system analyzed in this work is illustrated in
Figure 1.
The decision variables that must be optimized are the following:
The proposed optimal design method is composed of a simulation model of the PV irrigation pumping system and an optimization module based on a heuristic approach. These models are described hereafter.
2.2. Simulation of the PV Pumping System
2.2.1. PV Subsystem
The PV subsystem model estimated the net photovoltaic power provided by the PV generator (
PPV) depending on the calculated incoming irradiance. An isotropic distribution of the diffuse radiation [
29] was supposed in order to calculate the temporal distribution of the irradiance,
I(
t). The model by Collares-Pereira and Rabl [
30] was applied to disaggregate direct and diffuse irradiance from the global daily radiation in MJ m
−2. A detailed description of the calculation procedure is further described in previous works [
7,
31].
2.2.2. Pumping Subsystem
The pumping system can be described by both the performance curves and the system curve. In this work, the Head-Discharge (H-Q) and Power-Discharge (P-Q) performance curves of the pump for its nominal rotational speed are given as the input data of the problem. These curves can be fitted to second degree polynomial functions and are shown in the following set of equations.
where:
H is the pumping head (m),
Q is the pump discharge (m
3 s
−1) and
P is the pumping power. A to C and E to G are regression coefficients.
The performance of the pump depends on not only the type of pump but also on its working speed. The performance of a variable speed pump can be modelled by applying affinity laws that are shown in the following set of equations:
where:
N1 and
N2 are two specific pump speeds (in rpm) 1 and 2,
f1 and
f2 are the electric frequency,
Q1 and
Q2 are the pump discharges,
H1 and
H2 are the pumping heads and
P1 and
P2 are the pumping power for these two specific pump speeds.
λ is the pump speed ratio.
The system curve (H) is given in Equation (3):
where:
Δz is the static head, i.e., elevation change between the water level in the suction of the pump and the water level in the elevated tank (m),
hf is the friction head, i.e., the total head losses in the delivery pipe (m).
Pressure losses were calculated by applying the Darcy–Weisbach equation [
32].
where:
fp is the friction factor of the pipe, which in turn depends on the relative roughness of the pipe and the Reynolds number,
L is the length of the pipe,
D is the diameter and
Q is the total discharge.
The net power transferred to the water by the pump is equal to:
where:
γ is the specific weight of the water (N m
−3).
The total PV power required to drive the pump is estimated by applying Equation (6):
where:
ηFC is the efficiency of the converter,
ηAM is the efficiency of the asynchronous motor and
ηP is the pump efficiency.
2.2.3. Water Balance
The irrigation water demands were calculated using the methodology proposed by FAO [
33]. The crop evapotranspiration (
ETc) was calculated applying Equation (7):
where:
ETo is the reference evapotranspiration and
Kc is the crop coefficient and
Kr is a reduction coefficient for sparse crops with limited canopy cover.
In this study,
ETo was computed applying the Penman–Monteith formula. The net irrigation requirements,
Nn, (mm) can be estimated as the difference between
ETc and the effective precipitation [
34], meaning rainfall that is effectively used by the crop (
Pe).
Finally, the gross irrigation water requirements (
Ng, in mm) can be calculated as a function of the
Nn by applying an irrigation efficiency (
ηa) in order to take into account the water losses in the system (See Equation (8)).
A model to calculate irrigation water requirements previously developed by the authors and applied in previous works was used in this research.
The water volume (
VRi, in m
3) needed to irrigate a farm with an area
S (ha) during a specific period
i can be calculated as a function of the gross irrigation requirements for that period (
Ngi) as shown in Equation (9):
The water volume pumped to the reservoir (
VPi, in m
3) for a specific period
i can be calculated by multiplying the pumping flowrate (
Qi, in m
3/s) by the pumping time (
Ti, in s). The volume of water stored in the tank can be modelled by applying a water balance model:
where:
Vi and
Vi-1 are the volume of water stored in the reservoir in periods
i and
i-1, respectively,
IDi is the irrigation deficit in period
i. The volume stored in the reservoir must be lower than the maximum capacity of the tank.
2.3. Statement of the Optimization Problem
A multistage bounded genetic algorithm module was applied to optimize the design of the PV pumping system. The GA algorithm developed in this work is based on the GENOME (University of Almería, Almería, Spain) software model developed by Reca and Martínez [
35], which was later converted in B-GENOME [
28], an improved bounded version of GENOME that was applied to optimize the cost of a pipe network. This code was modified and adapted with the aim of optimizing the above-mentioned PV pumping design problem (BPV-GENOME). The latter model was developed using the VBA programming language and embedded in an EXCEL
© (Microsoft Corporation, Redmond, Washington, EE.UU) workbook.
B-GENOME used an efficient integer-coding scheme. Each individual (possible solution) is described by a chromosome consisting of a vector of n discrete variables (genes). Genes were codified by an integer value ranging from one to ni (maximum number of possible values assigned to the variable i, i.e., alleles). This coding scheme was also adopted in BPV-GENOME, in which case the chromosome is composed of four genes, one per decision variable. The first gene codifies the diameter of the pipe, the second gene codifies the type of pump, the third one the capacity of the tank and the last one the number of PV modules. The number of alleles per gene depends on the input data of the problem. The number of alleles of the first and second gene depends on the total number of pipe diameters in the input pipe database and the number of pumps in the pump database, respectively. The third and fourth variables have a few alleles that results from a predefined minimum and maximum value of each variable (volume of the tank and number of PV modules, respectively) and a variable step. The bounding strategy used in this work is described hereafter.
2.3.1. Multistage Bounding Strategy
A multistage bounding strategy is proposed in this study with the aim of reducing the search space and improving the efficiency of the GA algorithm. The initial set-up of the limits of the variables is done by applying engineering-based rules. In this initial stage, the aim is to apply relatively wide bounds, so that the resulting reduced search space includes not only the problem solution but also its surroundings, which may provide useful information. Individuals that are clearly beyond the limits and drastically violate the problem’s restrictions are simply discarded to reduce the complexity of the problem. The steps in this initial bounding are described as follows:
(a) Bounding the diameter series:
Maximum and minimum reasonable pipe diameters are estimated depending on the flow range required by the irrigation system. The first step is to calculate the fictitious continuous flow (
q), which is defined as the flowrate required to supply the maximum crop water requirement if the pumping system operates continuously during the whole day. The maximum flow is obtained multiplying the fictitious continuous flow by a degree of freedom (DF), which indicates the number of times that the system would be able to supply the required irrigation water in a day. The higher the selected value of the degree of freedom, the wider the bound for the maximum flow (see Equation (11)).
where:
q (m
3/s) is the continuous flow,
DF is the degree of freedom (dimensionless) and
QM (m
3/s) is the maximum pumped flow.
To calculate the diameter bounds, velocity restrictions are imposed on the flow in the pipes. Excessively high flow velocities in the pipe may produce pipe erosion, loud noise, undesired effects of hydraulic transients and excessive head losses. On the contrary, very low velocities may produce sedimentation and oversizing of the system. Maximum (
DM) and minimum (
Dm) diameter sizes can be calculated by applying these velocity restrictions in the pipe.
DM is limited to the diameter able to supply the maximum flow with the minimum admissible flow velocity in the pipe.
Dm is defined as the size of the pipe that would supply the continuous flow with the maximum admissible velocity in the pipe (see Equation (12)). Diameters in the pipe database out of this range are neglected.
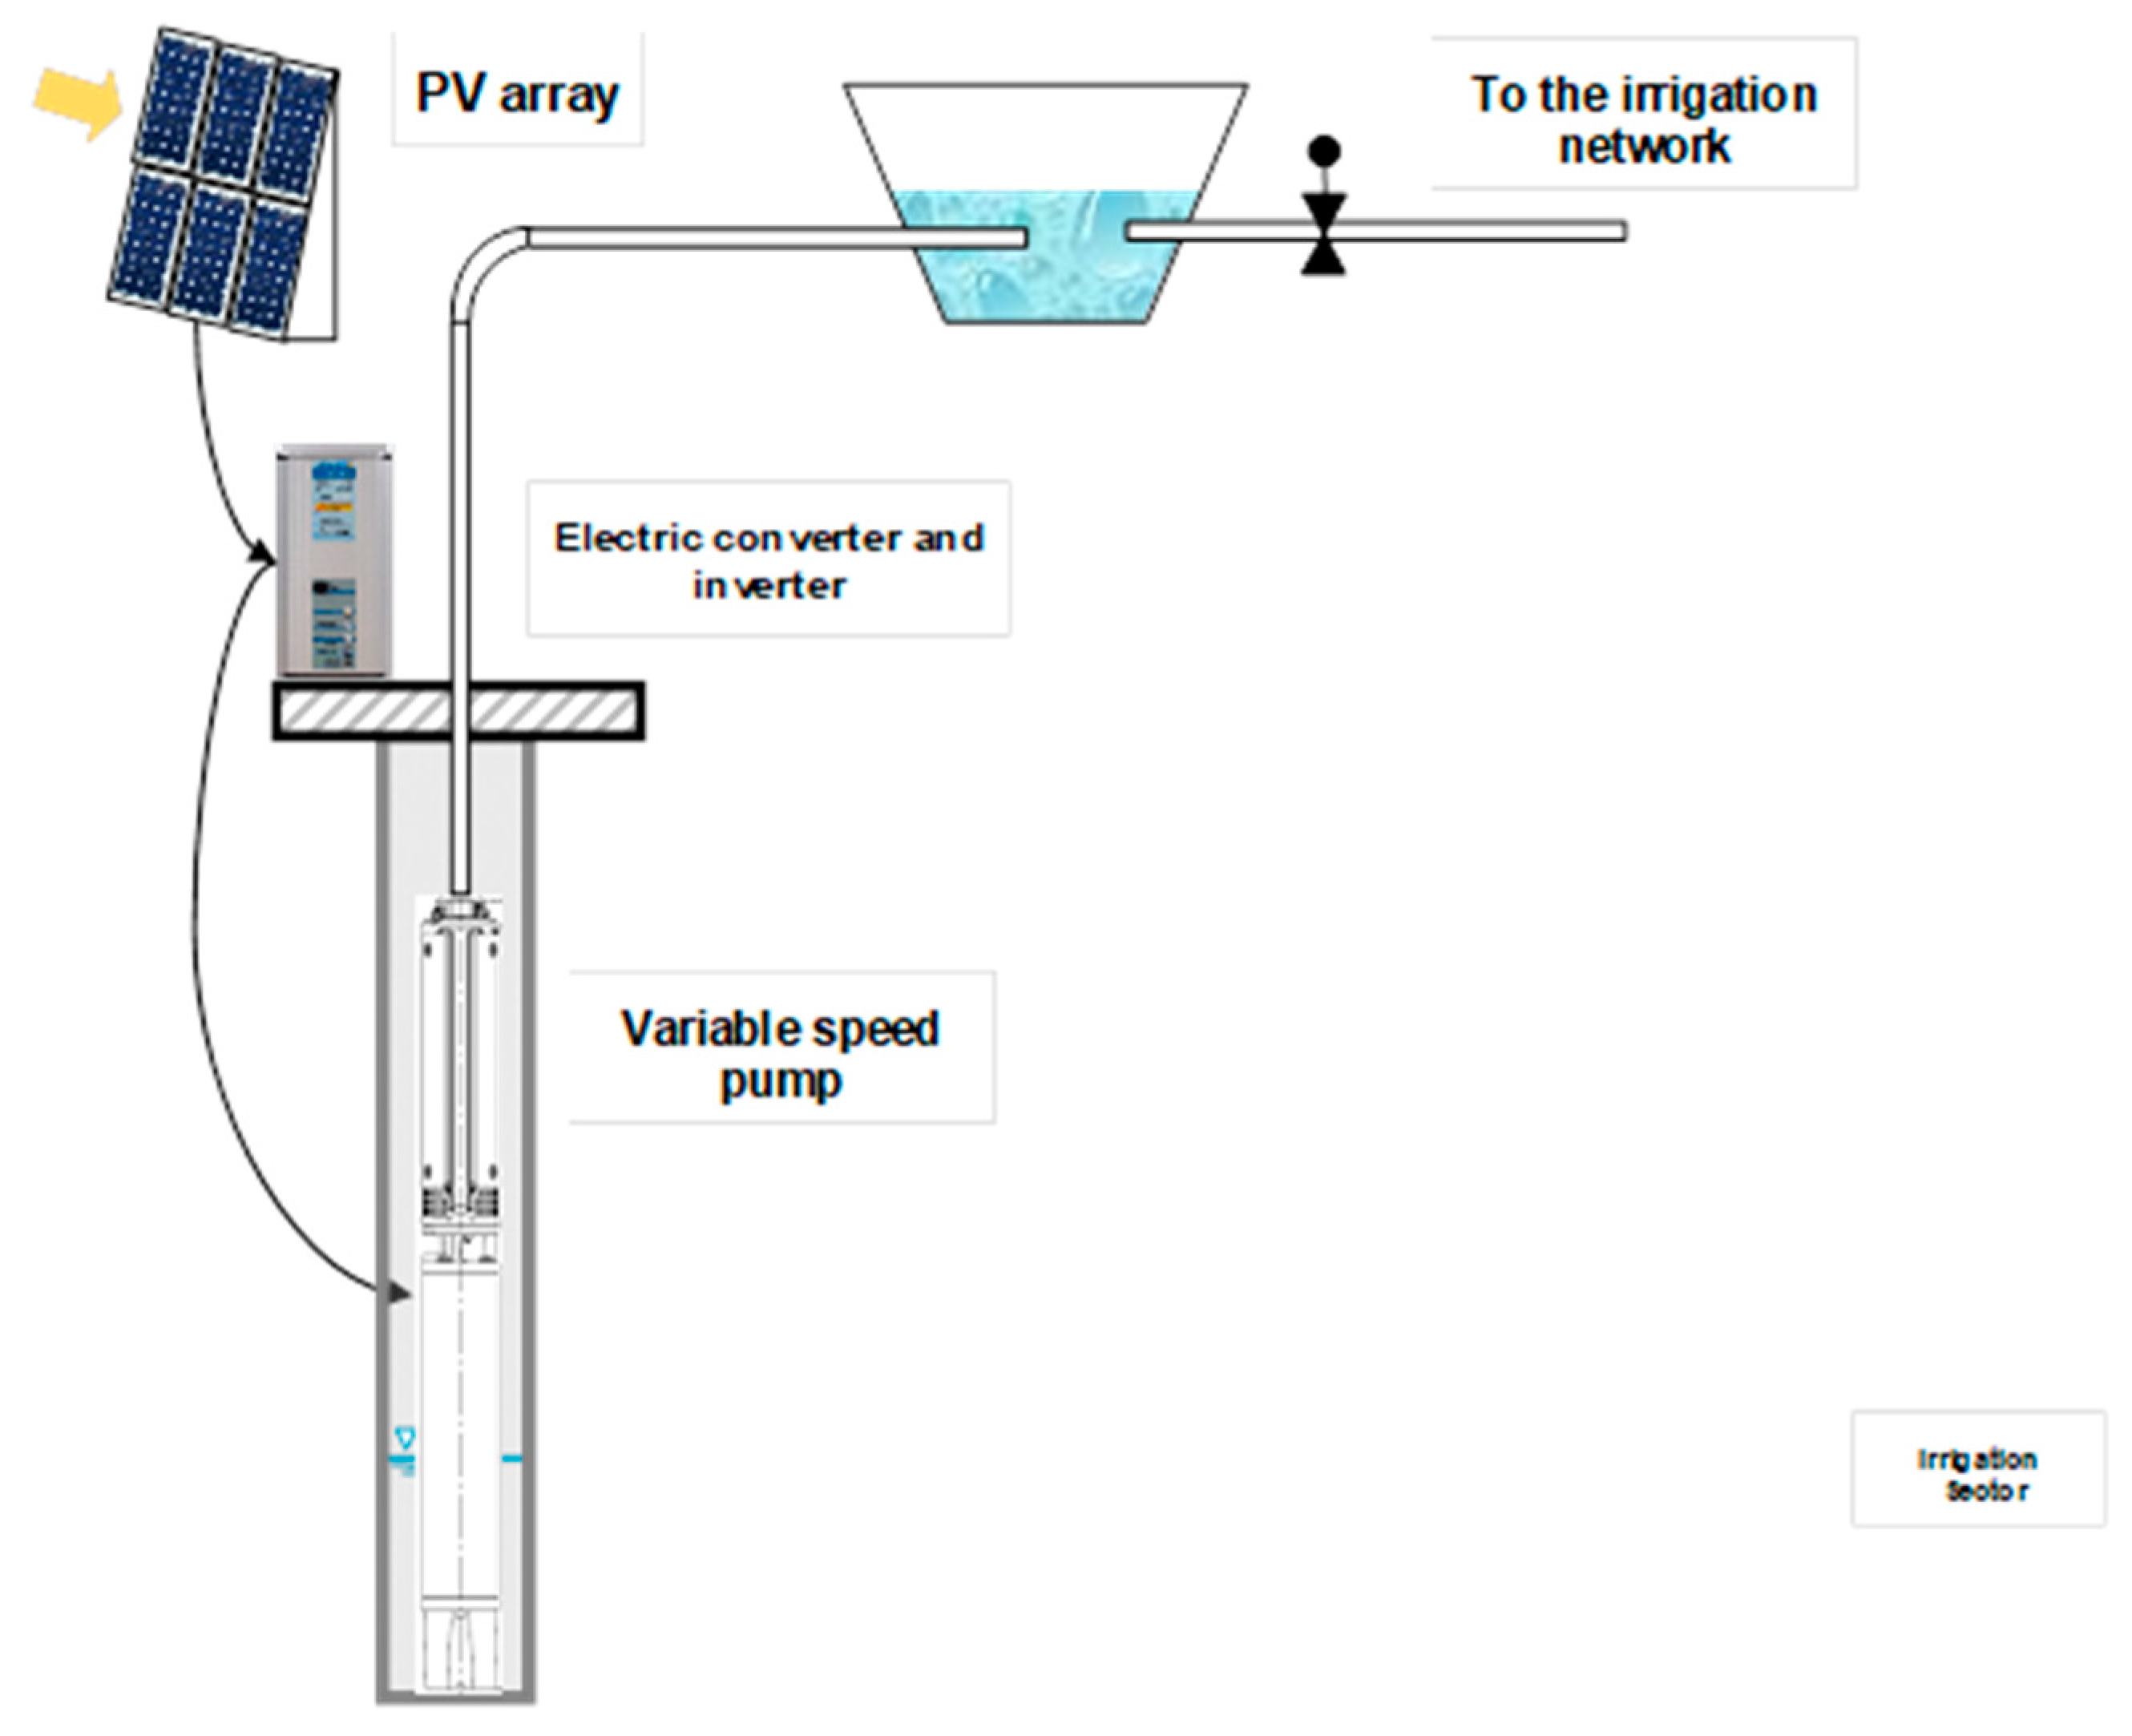
(b) Bounding the pump series:
The admissible pump series are calculated by performing the procedure depicted in
Figure 2 as a function of the bounded pumped flows and pumping heads.
Extreme maximum and minimum system curves are defined for the maximum pumped flow (QM) and continuous flow (q), respectively. These curves were computed by applying Equations (3) and (4). Two extreme operating points, (QM, HM) and (q, Hm), are thus defined. These points are used to limit the range of admissible pumps. Admissible pumps are those whose performance curves lie within two envelopes. The upper envelope requires that the performance H-Q curve of the pump falls below the maximum operating point with the pump operating at the minimum frequency (rotating speed). Pumps above this limit would produce operating points far beyond the upper limit. The lower envelope requires that the pump curve falls above the lower operating point operating at its maximum speed. Pumps with H-Q curves below this limit are clearly unable to supply the flow and energy demands.
(c) Bounding the capacity of the storage tank:
Maximum and minimum capacity levels are defined. The minimum capacity of the tank was set to the volume of water needed to irrigate for one day. This volume makes it possible to have a minimum water storage in case the PV pumping system fails. The maximum capacity was set to the volume equal to 30 days of water consumption. Higher volumes are considered excessive. The volume step is equal to one day of storage so that 30 possible storage volumes (multiple of the minimum volume to store one day of operation) are considered in this initial bounding.
(d) Bounding the PV power:
The maximum and minimum number of PV modules are calculated depending on the power required to drive the most and least powerful pumps in the selected series of admissible pumps. Required PV power for both cases can be calculated by applying the appropriate inverter and motor efficiencies (Equation (6)). If the difference between the maximum and minimum number of modules is lower than 50, the step equals one module. The maximum number of steps was set to 50 so if the difference is higher, the step can be higher than one module.
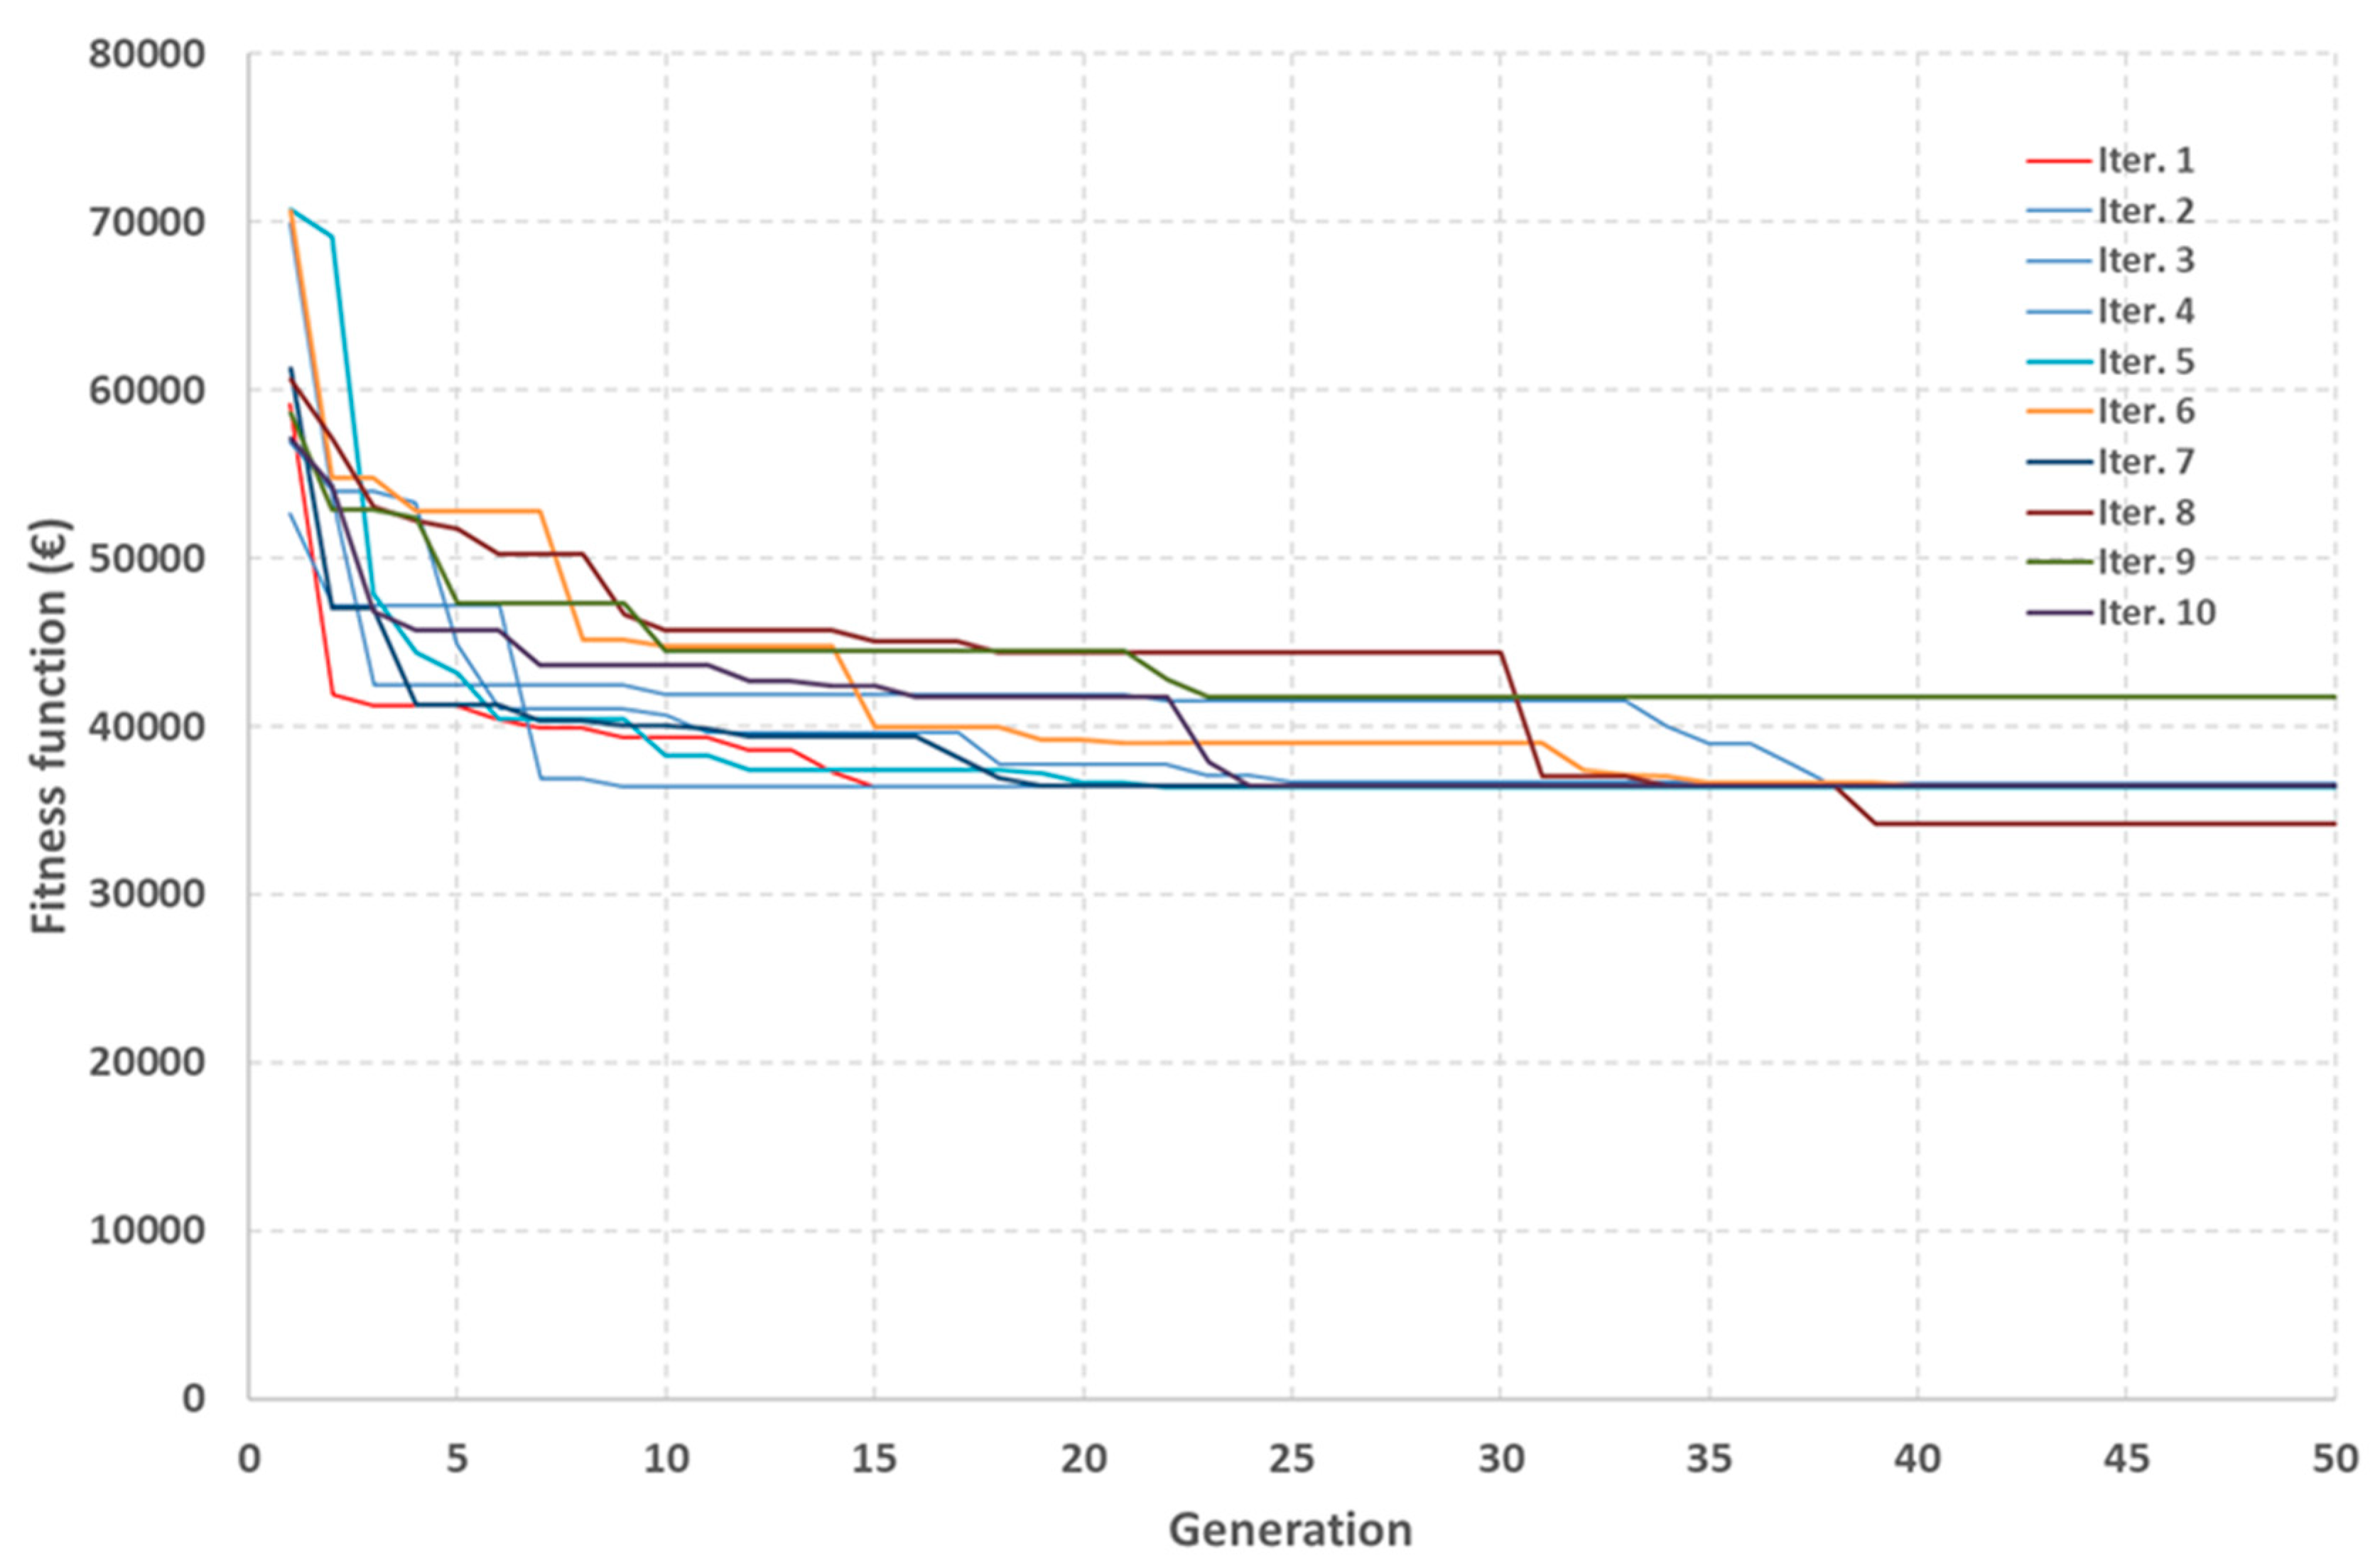
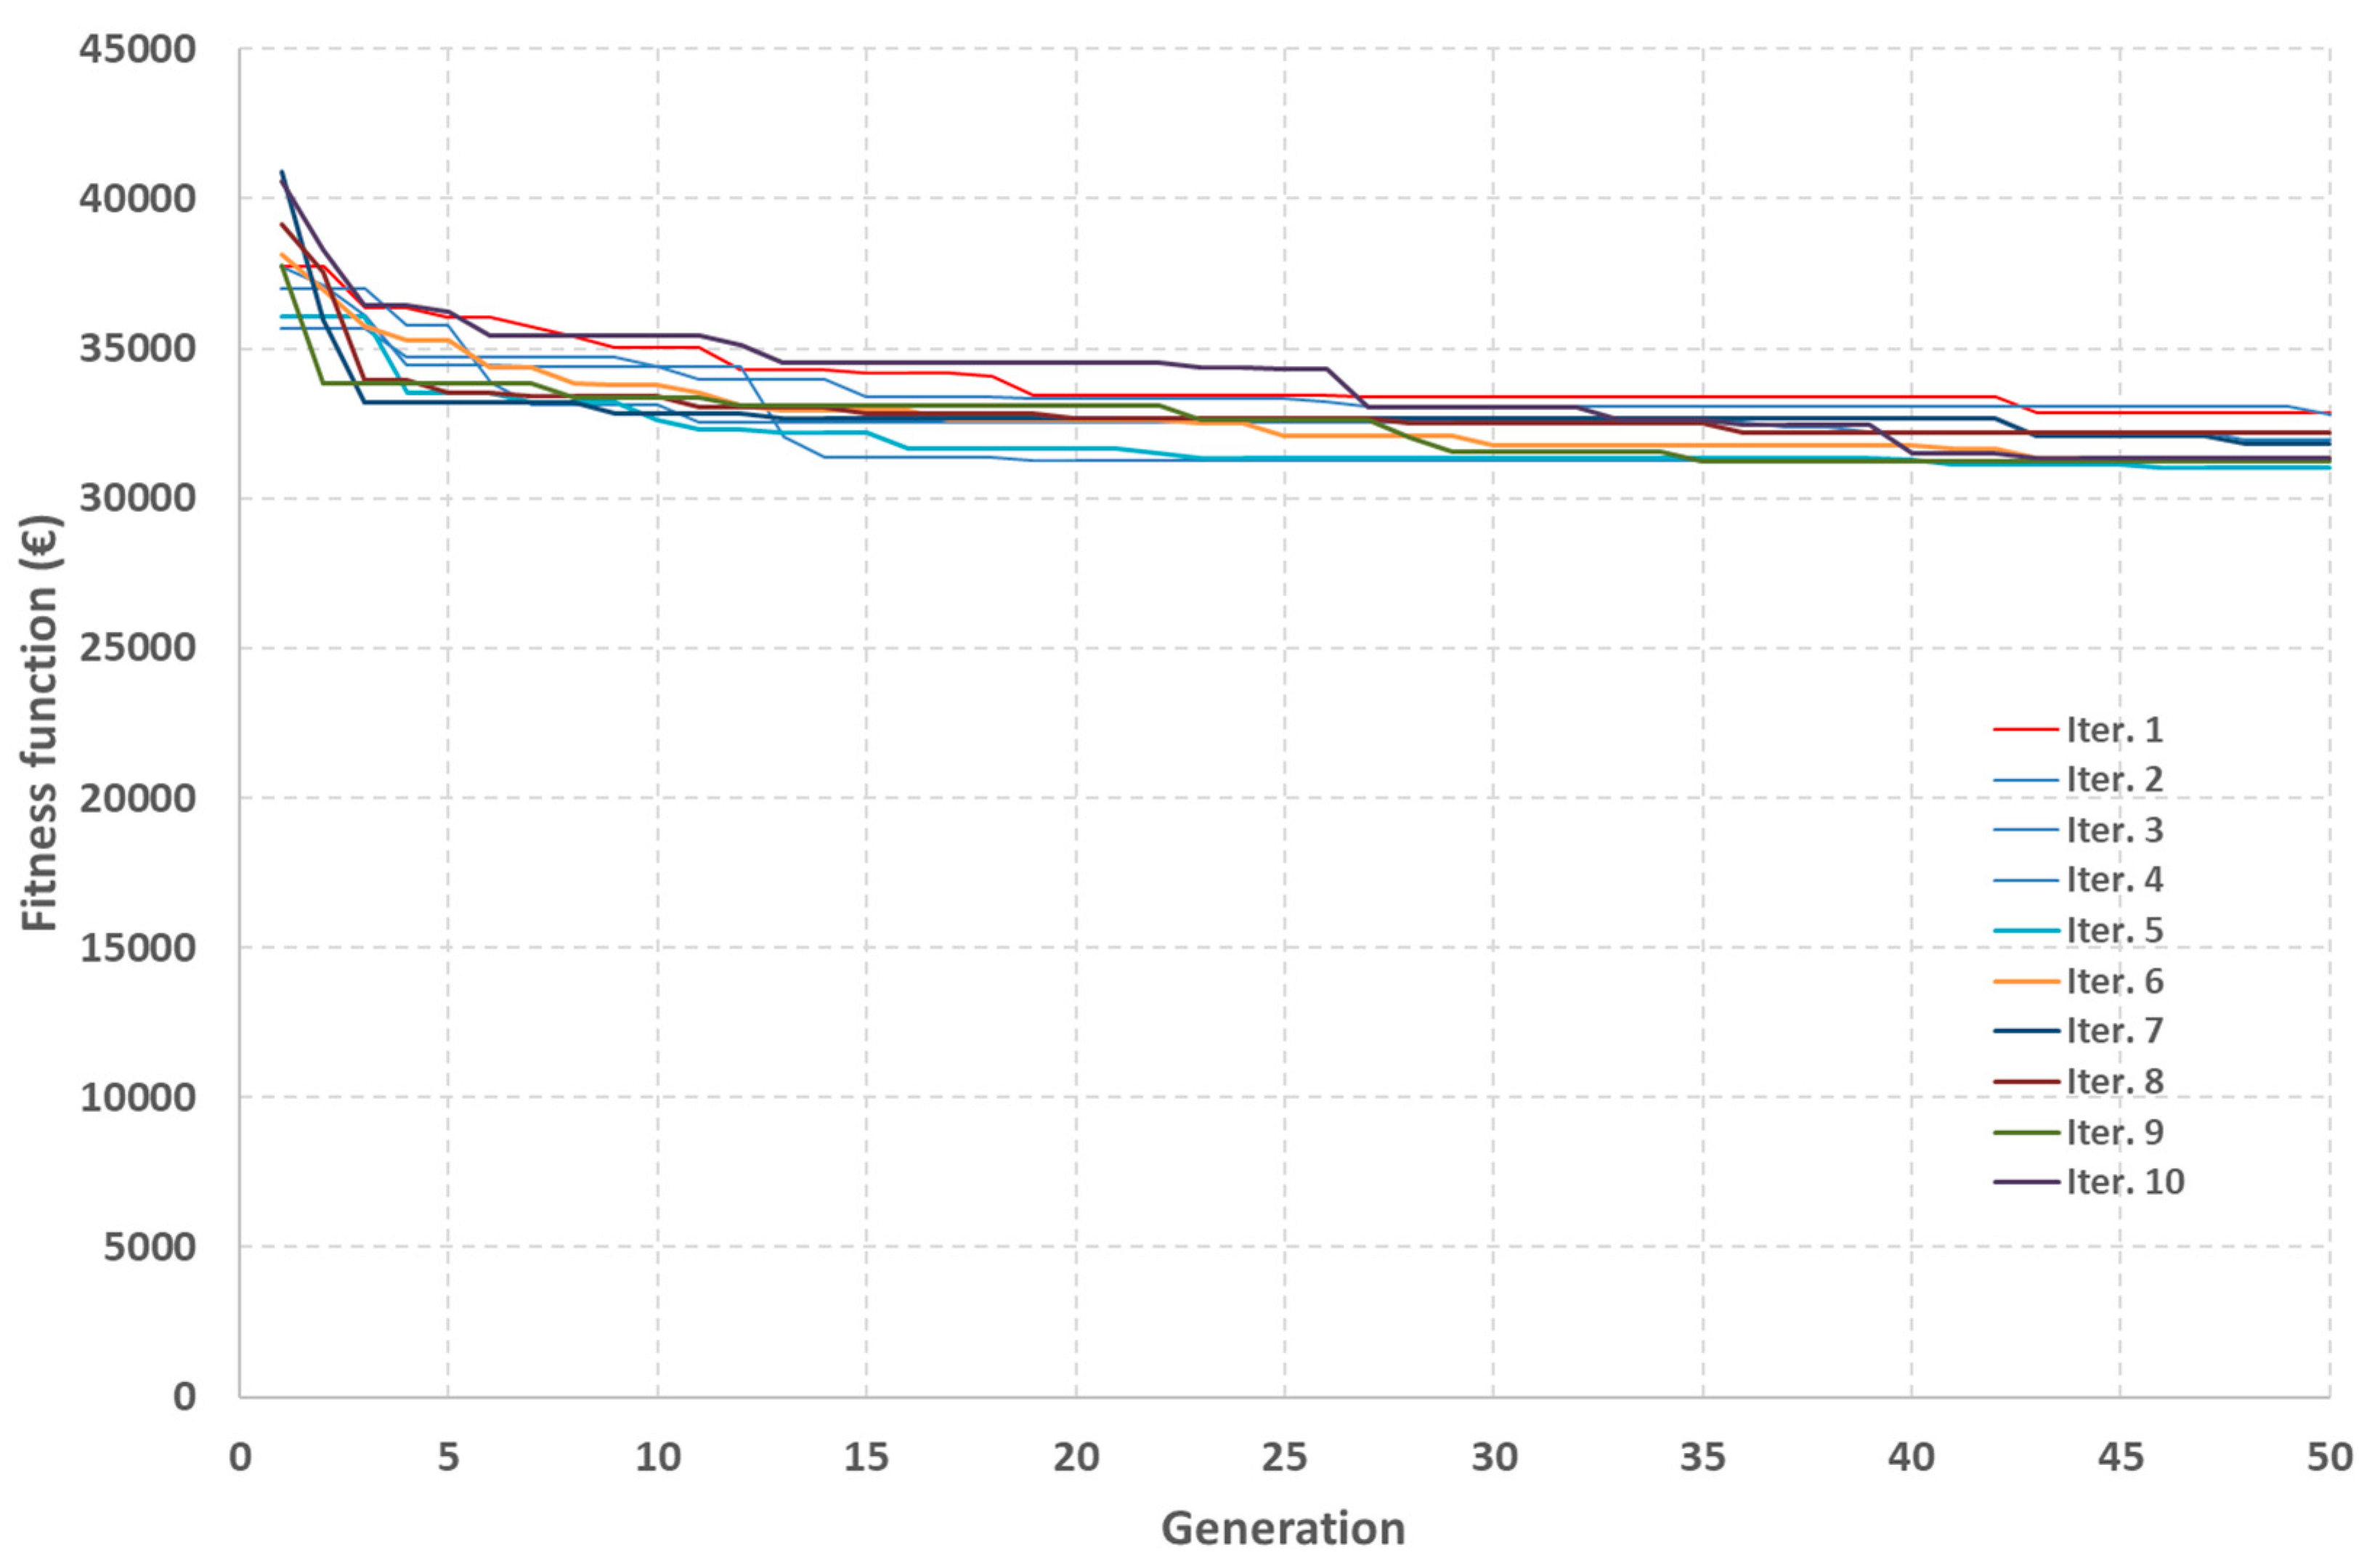
After this initial bounding is performed, the GA algorithm is applied recursively (in this work ten runs of the GA were performed). The solutions of this first GA phase provide the range of solutions that serve to refine the search space and redefine the problem limits in the subsequent stage. Since the solution space is now narrower, the number of PV modules and capacity of the tank steps are now smaller. After a second round of GA analyses, a new more precise solution with higher resolution can be found. In this work, two stages were performed, although more iterative stages can be also conducted.
2.3.2. Genetic Algorithm
Genetic algorithms (GA) are heuristic methods that mimics the evolutionary mechanisms of natural selection and genetics [
18]. Genetic algorithms are based on the effective optimization model that has naturally evolved for dealing with large, highly complex systems.
In the GA formulation, the initial population is obtained randomly. Using a random generator, integer values are generated, ranging from 1 to nj, where nj is the number of alleles of each gene. Then, population evolves by undergoing an iterative reproductive cycle in subsequent generations. This evolutive cycle is composed of three basic operators: Selection, crossover and mutation. There are many possible methods to perform these basic operations: The selection operator used in this work is called steady-state-delete-worst plan. According to this plan, a new individual is inserted in the population if its fitness exceeds that of the least fit member of the parent population. That least fitted individual is consequently removed and replaced by the offspring. The crossover process involves the exchange of information between two parent chromosomes to produce two new offspring chromosomes that inherit their characteristics. This process is controlled by the input parameter pcross, which defines the probability of crossing two chromosomes. In this work, a uniform crossover procedure was applied, meaning that the parents’ chromosomes exchange information gene to gene. A gene crossing rate (rcross) parameter is defined with the aim of defining the probability of exchanging a specific gene. Finally, a mutation probability (Pmut) is defined to specify the mutation rate. The mutation operator swaps the allele of the selected gene with a randomly generated value.
A population size of 50 individuals and 50 generations was selected in this work because it provided a good trade-off between convergence speed and accuracy. The remaining GA parameters and options used in this work are summarized in
Table 1 and were recommended in other works [
28,
35].
2.3.3. Objective Function
For every generation, the fitness of every individual is evaluated. This fitness is defined as the sum of the cost of the system (cost of the delivery pipe, cost of the pump, cost of the tank and cost of the PV plant) plus a penalty function to consider the supply deficit. A supply deficit occurs when one specific induvial (system design) is unable to supply the target water demands for irrigation (see Equation (13)).
where:
FF = fitness function,
CD = cost of the pipe,
CP = cost of the pump,
CS = cost of the storage tank,
CPV = cost of the PV plant,
KP = penalty multiplier and
ID = cumulative water deficit in the system (sum of deficits for every study period).
The penalty multiplier (
KP) may affect the convergence and accuracy of the GA algorithm, so the value of this parameter should be adjusted. Some researchers recommend different constraint-handling techniques, such as the use of variable values or self-adaptive penalty functions [
36]. However, in this work, a high value (10
9 €/m) was selected for this parameter to discard infeasible solutions that imply an insufficient irrigation water supply.
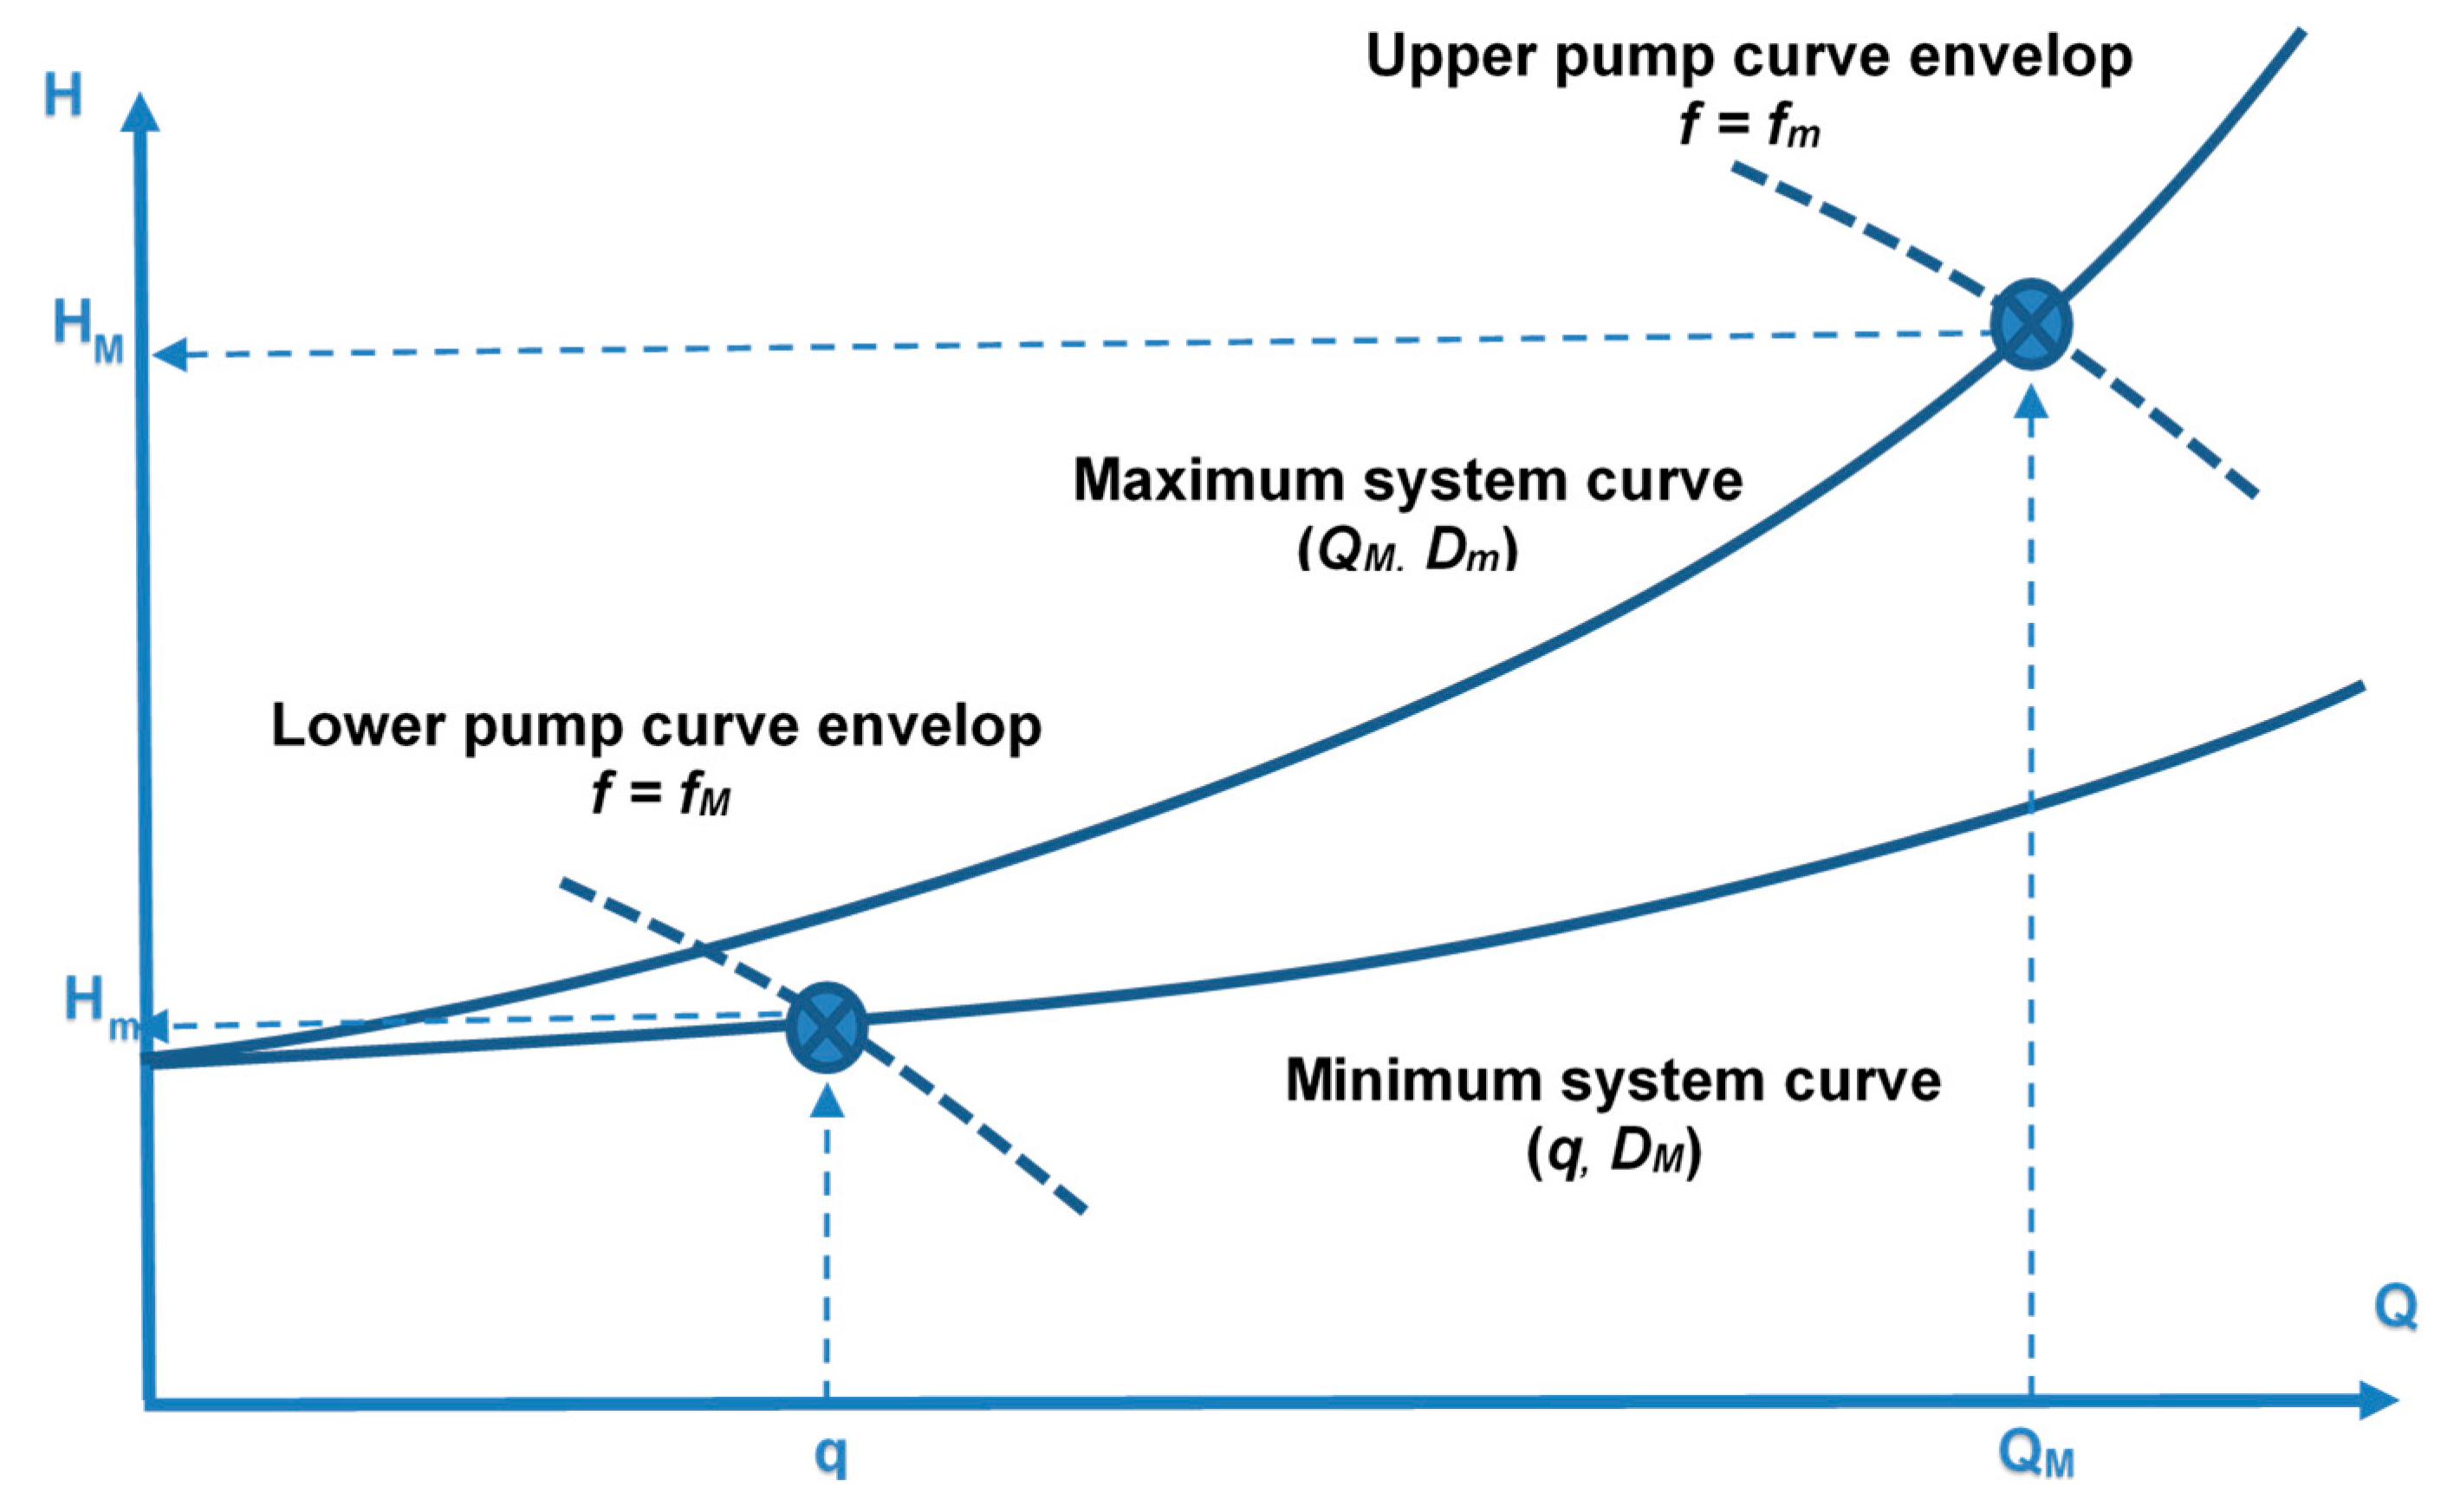
2.4. Structure of the BPV-GENOME Model
The flowchart of the BPV-GENOME (Bounded Photovoltaic irrigation-GENOME) model is depicted in
Figure 3.
The model BPV-GENOME is composed of several modules: An input/output module, a GA module, a PV pumping simulation model and a bounding module. The model was programmed in the EXCEL© spreadsheet platform using the VBA programming language. The input module reads the general input data of the problem and the specific databases, i.e., the pipe database and the pump database. These databases are stored in EXCEL© sheets. These databases contain the basic characteristics of the pipe and pump series and their associated costs. The output module writes the final solution found by the model (optimal combination of pipe diameter, pump unit, storage capacity and PV peak power) and the best fitness function value for every generation in a results spreadsheet.
2.5. Case Study
A specific case study was used in order to test the methodology. This case study consisted in finding the optimal design of a PV irrigation system for an olive farm in Tabernas, in the province of Almería (Southeast of Spain). A description of the area and the characteristics of the farm can be found in Zavala et al. [
37].
The location of the PV plant is 37°06’ north latitude and 02°18’ west longitude and its elevation is 435 meters above sea level. A fixed PV frame was considered with a tilt angle of 20°, the azimuth is 0° and the albedo is 0.2. Conventional crystalline cells were used in this study. The peak power per module was 275 W and the cost of the PV plant was supposedly 0.5 €/PW.
The calculated irrigation water requirements are given in
Table 2 for the whole farm.
The water is pumped from a well to an elevated tank with a static head of 38 m. The total length of the pipe from the well to the tank is 420 m.
The pipe series is composed of 14 PVC pipes with different diameter sizes taken from a major manufacturer. The working pressure of the selected pipes was 10 atm. The relative roughness of the pipe was 0.0015 mm. The pipe database is supplied as a
supplementary material.
The pump database is composed of 229 different pump units. This database includes submerged pumps of 4 and 6 inches. These pumps differ in the impeller type and the number of impellers per pump unit. This database was taken from an international pump manufacturer and it is also supplied as a
supplementary material.
The overall efficiency of the system, comprising the pump, inverter and PV array efficiencies was considered equal to 0.5. In this research, a constant pump efficiency was assumed.
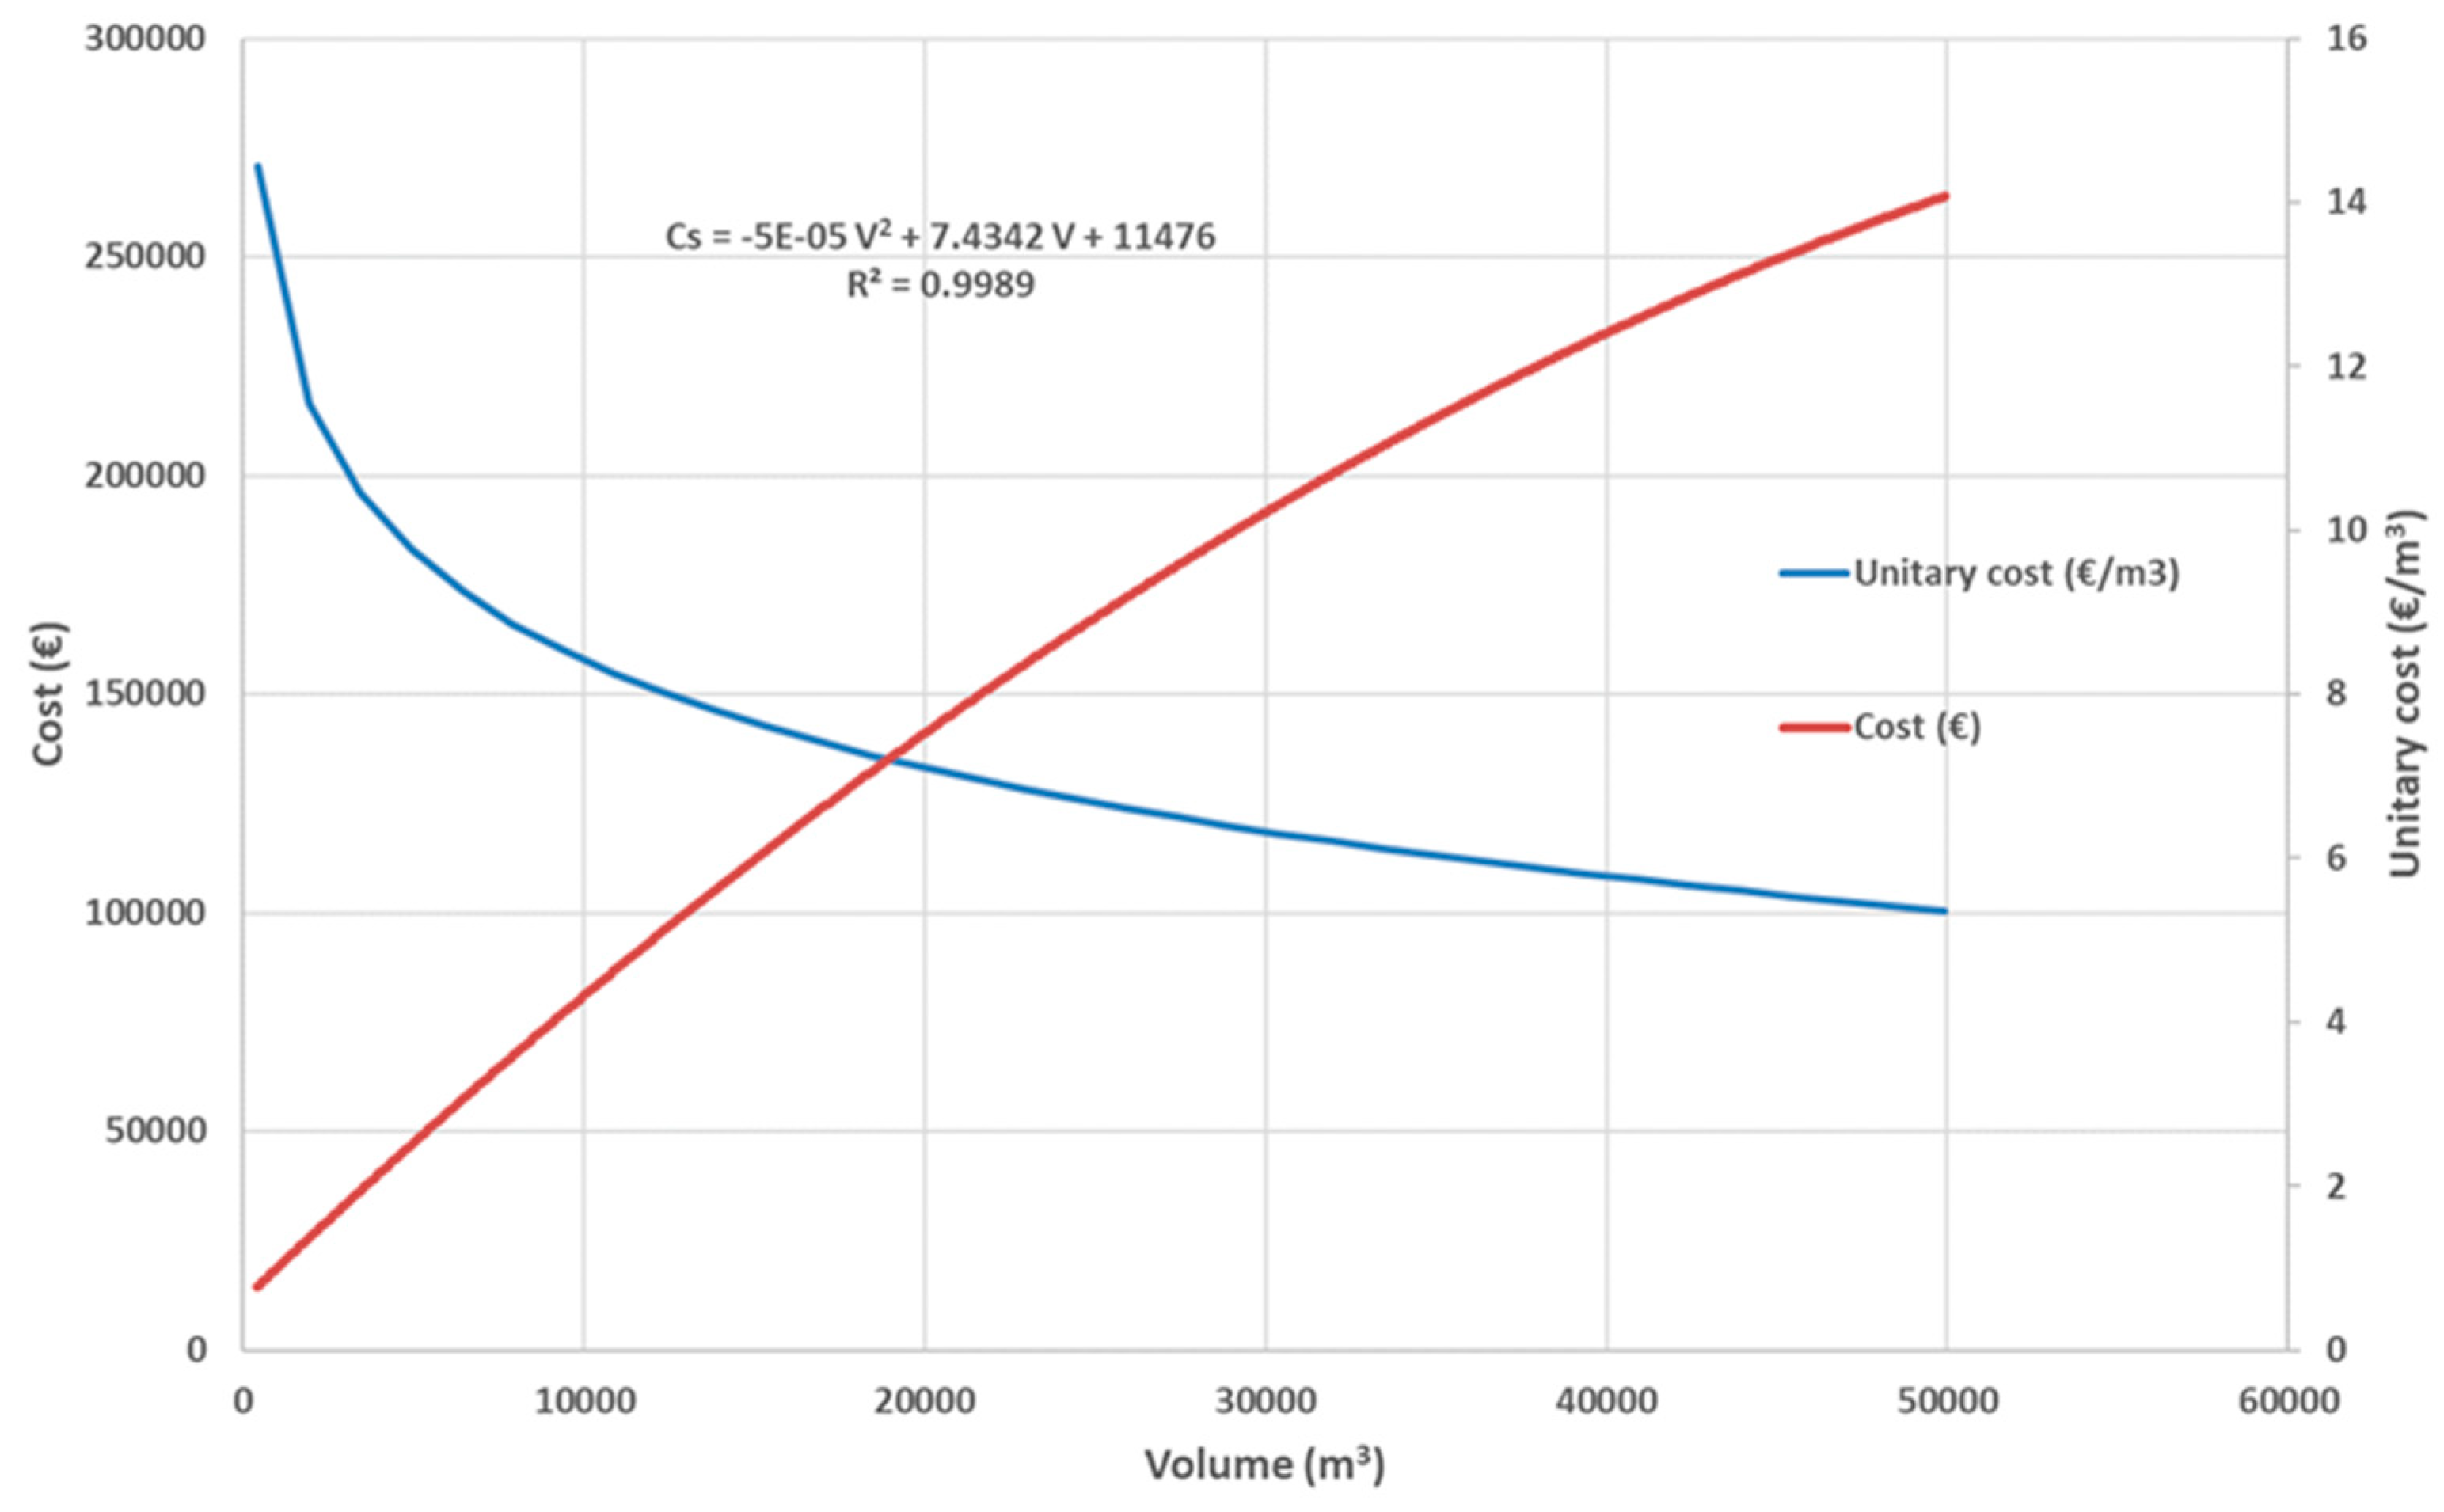
For the storage tank, a reservoir constructed of excavated natural earth and lined with a plastic sheet was considered. The cost function of this type of reservoir was obtained by fitting unitary cost data provided by an experienced consulting company (see
Figure 4).
4. Conclusions
In this study, a new heuristic method based on a hybrid approach and a search space reduction has been developed and adapted to the optimal design of stand-alone PV irrigation pumping to a storage tank. The proposed approach is based on iteratively bounding the search space by applying engineering-based rules to the problem with the aim of reducing the number of possible scenarios to analyze and applying a genetic algorithm to the reduced search space. This methodology has been applied to find the optimal design of a benchmark PV irrigation system with storage for a real farm located in Tabernas in the province of Almería (Spain).
A considerable reduction of the search space was accomplished with the proposed methodology, which also provided a much faster and accurate convergence.
The total cost of the PV irrigation system was considerably reduced. This study proved that the most sensitive variables were the number of modules and the type of pump, whereas the diameter of the pipe and volume of the storage tank remained more stable.
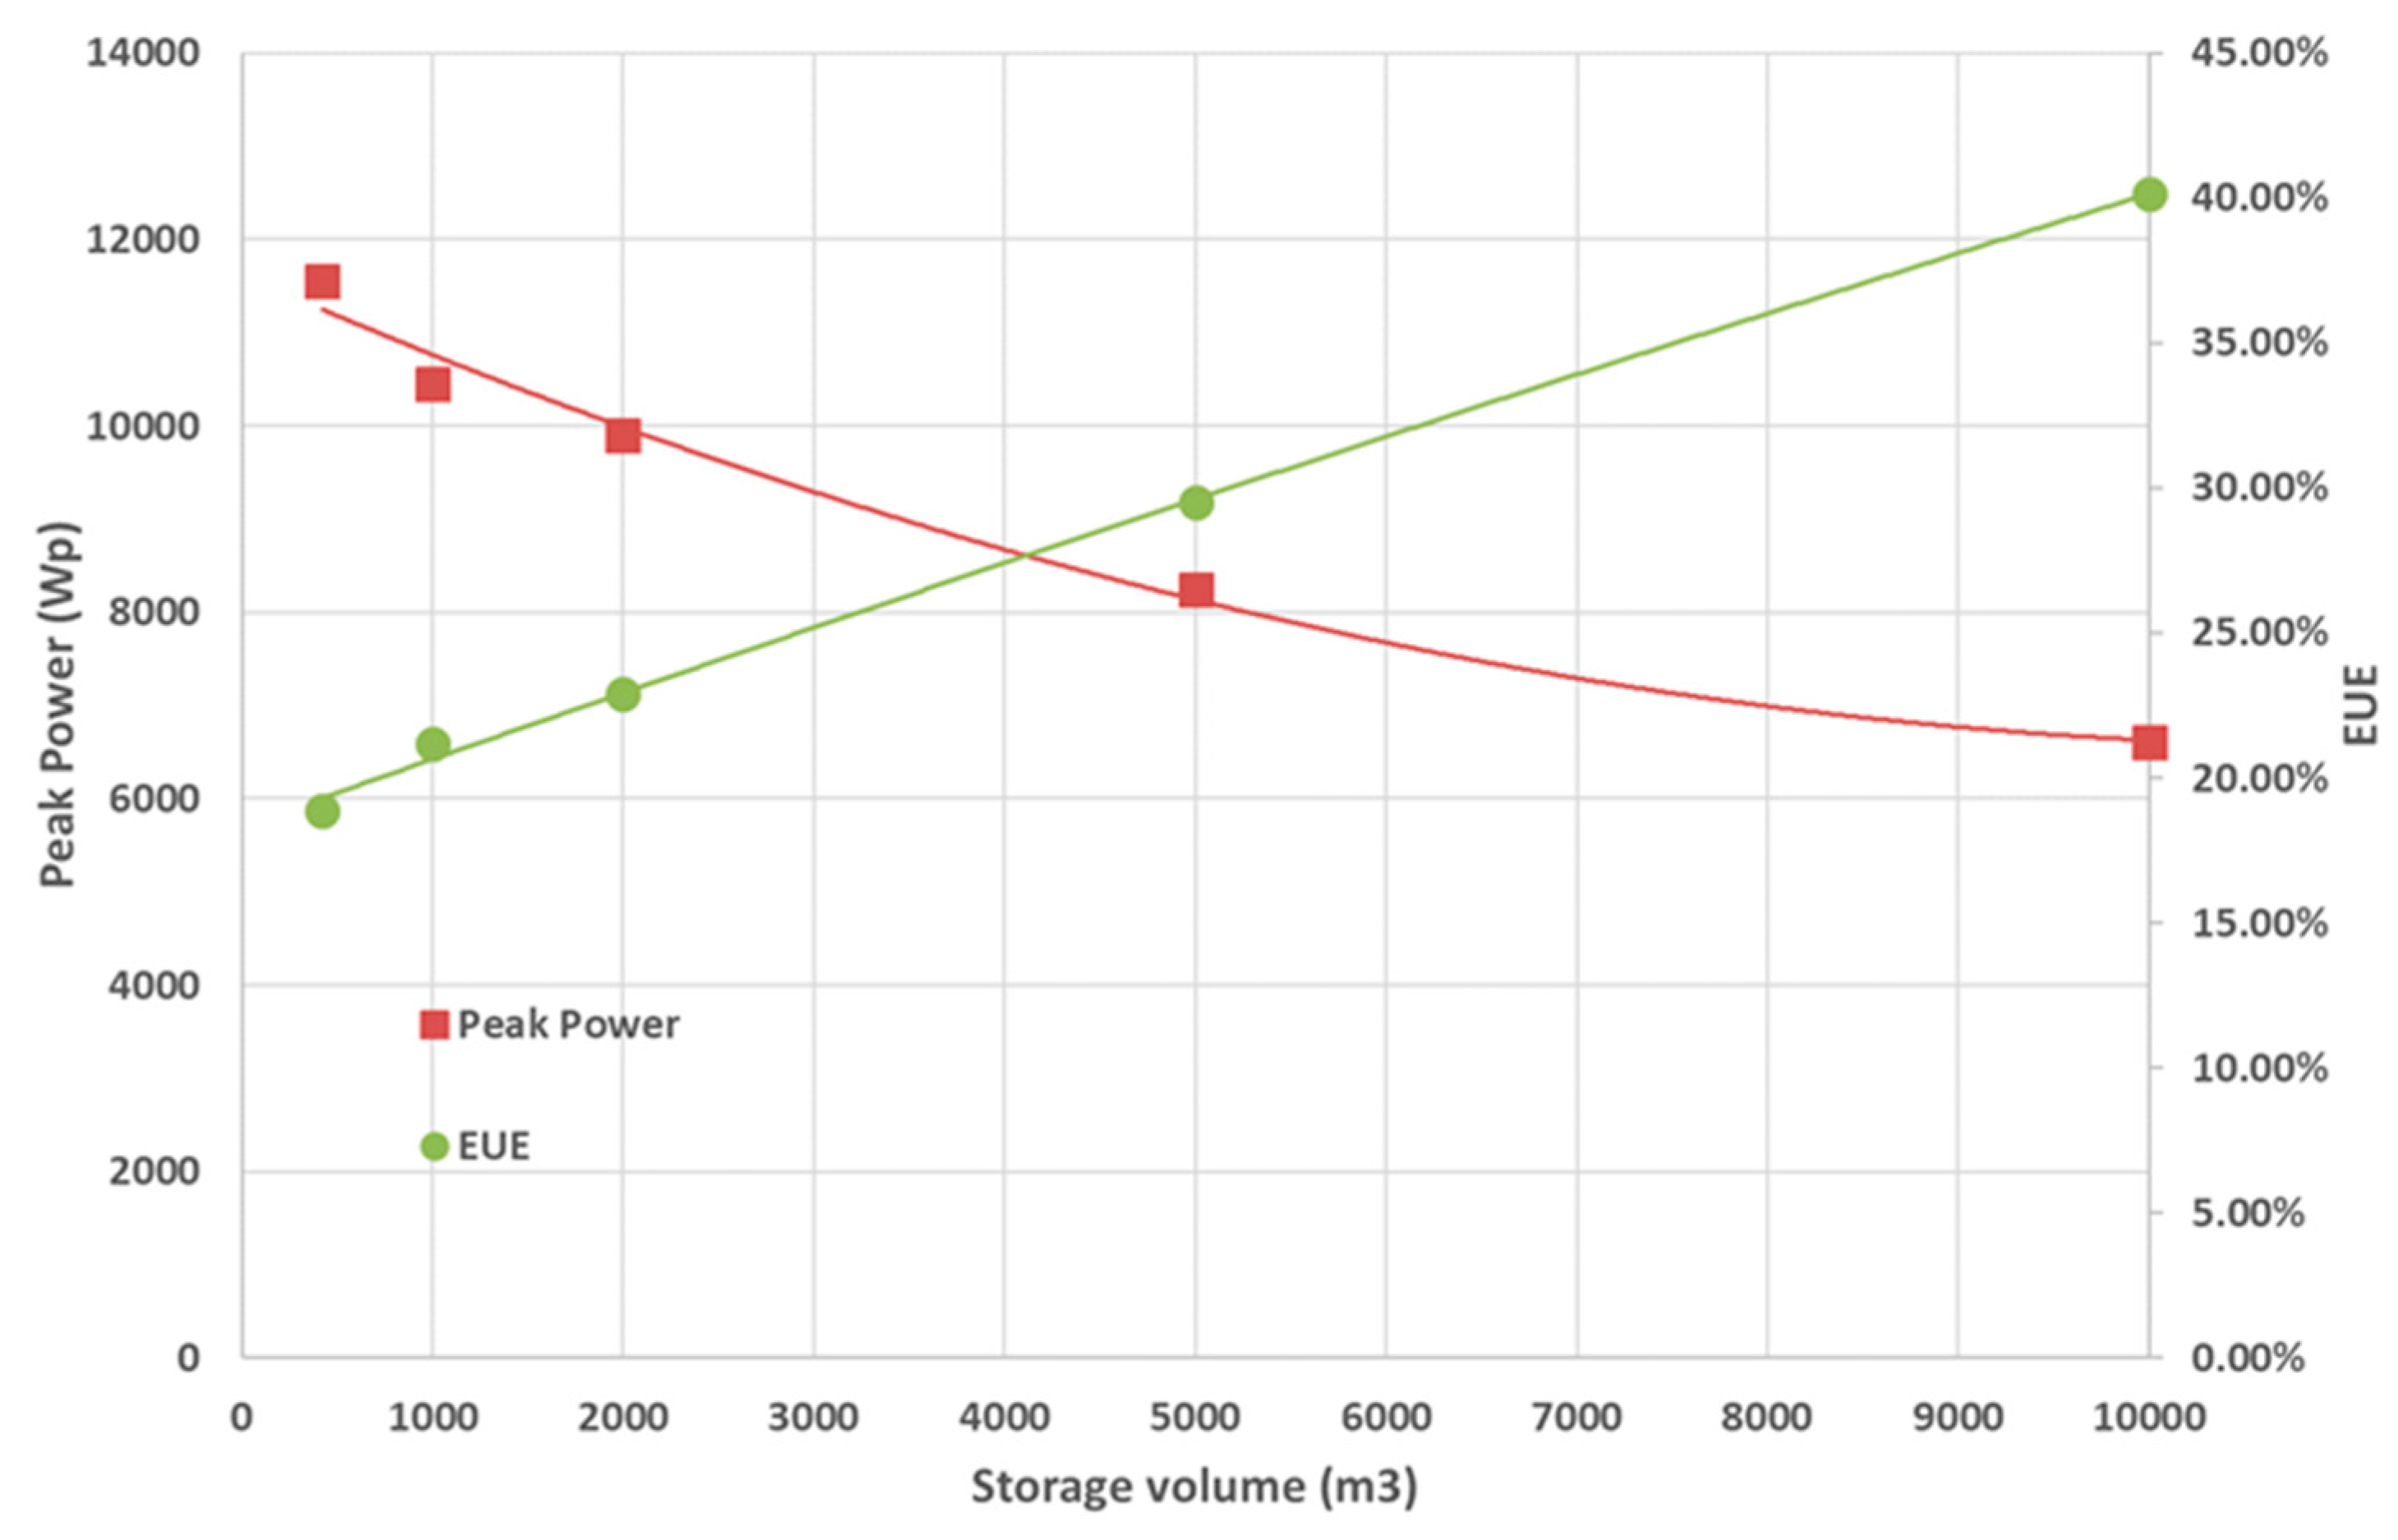
It has been proven that minimizing the system cost may result in low energy use efficiency (EUE). To overcome this situation, a multiobjective optimization approach considering two objectives, i.e., minimizing cost and maximizing EUE, is strongly recommended for future research in order to obtain balanced designs with the optimal trade-off between efficiency and cost.


