Spatio-Temporal Trend of Aging Regions and Their Neighborhood Environment: Findings from Daegu Metropolitan City, Korea


1
Department of Urban Planning, Keimyung University, 1095 Dalgubeol-daero, Dalseo-gu, Daegu 42601, Korea
2
Department of Civil and Environmental Engineering, Seoul National University, Gwanak-ro 1, Gwanak-gu, Seoul 08826, Korea
*
Author to whom correspondence should be addressed.
Sustainability 2020, 12(3), 1218; https://0-doi-org.brum.beds.ac.uk/10.3390/su12031218
Submission received: 23 January 2020
/
Revised: 5 February 2020
/
Accepted: 6 February 2020
/
Published: 7 February 2020
(This article belongs to the Special Issue A Healthy Built Environment for an Ageing Population)
Abstract
:This study aims to examine how the aging population of each region has changed from 2009 to 2018, and how age-friendly the current neighborhood environments are in those areas in Daegu, Korea. The 139 administrative units are used as spatial units to identify aging regions, while 100 m × 100 m grid cells are employed as spatial units to capture the environmental variables of the neighborhood comprehensively. To analyze Daegu’s aging regions, emerging hotspot analysis was performed, demonstrating the spatio-temporal patterns of the elderly population. ANOVA analysis and a case study with field surveys were used to examine the age-friendly environmental conditions in aging regions. Findings of this study showed that Daegu’s aging regions were increasing rapidly and spreading from the city center over time. In addition, it was found that the neighborhood environmental conditions of the aging regions were very poor in terms of accessibility, safety, and pleasurability. Significant differences were also found in the levels of age-friendliness of the neighborhood environments, depending on whether they are urban or suburban. The results herein support public policy proposals relevant to urban planning, environmental design, and aging policies.
1. Introduction
Most countries now comprise a growing aging population [1,2,3]. Korea is experiencing the rapid growth of an aging population as well; the percentage of the elderly (aged 65 years or older) was 14.3% in 2018 [4]. Given the current rate of aging in Korea, the influence of the aging phenomenon is expected to increase over time. According to the Statistics Korea report, the ratio of the elderly is expected to increase by 41.0% in 2060 due to a continued decrease in birthrate [4]. These demographic changes have caused drastic changes in many aspects of society, including the field of urban planning and design. In recent years, efforts to make cities and communities more age-friendly have gained importance [5,6], and developing supportive urban communities by understanding the association between population aging and urban changes is a major issue in public policy [7,8].
Many researchers have demonstrated that as the elderly’s physical capabilities decrease, age-friendly environments are needed to improve their quality of life [9,10,11,12,13]. Therefore, the importance of the neighborhood environment as an urban policy for the elderly has been highlighted lately, because the neighborhood environment, which is equipped with various convenient facilities, facilitates social contact and provides the elderly with a healthy and active life. In particular, the elderly are more affected by their immediate, walkable neighborhood environment because their daily activities are more limited than those of the young generation due to physical restrictions [3,9,10,11,14].
As the elderly population increases, various facilities to accommodate their walking behavior need to be established within the neighborhood. In Korea, rapid economic development over the past decades has been accompanied by multiple urban and environmental changes, including the proliferation of roads. According to the Organization for Economic Cooperation and Development (OECD) report, Korea has one of the highest per capita traffic fatality rates, especially with regard to the elderly, who are at higher risk, with their fatality rates being up to three times greater than those of other OECD countries [15]. The Ministry of the Interior and Safety of Korea recently (in December 2019) announced a plan for the improvement of 216 vulnerable transportation facilities in 47 traffic accident-prone areas that are unsafe for elderly pedestrians, since more than half (57%) of the traffic accidents in Korea that year were fatalities involving elderly pedestrians [16]. In addition to traffic issues, Korea is facing serious social issues due to high suicide [17,18] and poverty rates among the elderly [19]. Especially, in Korea, where the baby boomers are retiring, the aging issue has become a societal concern in various fields including welfare, politics, and health care, as well as urban planning.
Developing age-friendly communities has become a significant issue for social policy, and it includes issues in urban as well as rural environments [20]. The city of Daegu is one of the oldest and representative metropolitan cities in Korea, and as a city where urban areas are integrated with rural areas, it includes the characteristics of both urbanized and countryside areas in Korea. Additionally, in Daegu, the elderly accounted for 15.48% of the total population as of November 2019, which was the second-highest among the Korean metropolitan cities, followed by Busan [21]. Therefore, an investigation on the aging regions and the neighborhood environment of the elderly in Daegu is required. The purpose of this study is to analyze the spatio-temporal trend of the elderly population to capture the phenomenon and characteristics of aging regions in Daegu. In addition, we would like to explore the features of aging regions in terms of age-friendly neighborhood environments, especially with regard to walking behavior. Specifically, we examine (1) how the elderly (aged 65 years or older) population of each region changes over time and place, and (2) whether the neighborhood environment for the elderly differs significantly between urban and suburban areas.
2. Literature Review
2.1. Neighborhood Enviornments for Active and Healthy Aging
The ecological theory of aging is the most influential in the field of environmental gerontology, where the behaviors of people depend on and are connected to various physical and social environments due to the continuous interaction between human beings and the environment [2,22,23]. For the elderly in particular, their physical and social environments are crucial factors for a healthy life, and they tend to be more attached to their living environment than other age groups due to the decline of their physical, mental, and social functions [24,25]. Additionally, the elderly prefer aging in the environment they have lived in, and their spatial experience and attachment to the region are important in understanding the process of aging [26,27,28]. The physical and social environment is very important for the elderly, since it leads to healthy aging and improved quality of life for older people [28,29]. Havighurst suggested the activity theory based on the concept of successful aging as a more detailed approach, describing that the elderly can maintain a positive sense of theirselves if they continue to participate in various social activities [30,31]. In line with this theory, based on Lawton and Nahemow’s ecological perspective of active aging, the World Health Organization (WHO) proposed an age-friendly city to promote active and healthy aging and enhance quality of life as people age by developing supportive urban communities and various city-level initiatives for the elderly [2,6,7,8,32,33].
The physical and social activities of the elderly are emphasized for active and healthy aging, and it is associated with neighborhood environmental conditions [12,13,25,34]. An age-friendly city offers a supportive environment that enables residents to age actively within their neighborhoods as they interact with other people and use community resources by driving, shopping locally, using parks and libraries, or attending church [6]. Through the combined neighborhood environment consisting of well-planned outdoor spaces, buildings, housing, transportation, and well-operated municipal services, the necessary minimum level of favorable community conditions can be obtained [6]. Outdoor walking, in particular, facilitates healthy aging, because walking is the most common physical activity among the elderly [14,34]. Neighborhoods, including built and social environments, influence outdoor walking for the elderly [10], and the neighborhood’s physical attributes can encourage a healthier lifestyle [25]. Furthermore, the built and social environments of neighborhoods influence the elderly’s participation in their communities significantly [35].
2.2. Three Elements of Age-Friendly Neighborhood Environments: Accessibility, Safety, and Pleasurability
To investigate the main factors and variables of age-friendly neighborhood environments, we reviewed studies regarding the residential and environmental elements related to the elderly’s living conditions. It was shown that a wide range of factors, including the aesthetic, design, and health features of the environment, accessibility of local services and facilities, perceptions of neighborhood safety, and neighborhood relationships influence the elderly’s residential satisfaction [11,36,37,38,39,40].
The studies concerning the elderly’s walking and neighboring environment focused on the accessibility of the neighborhood. Michael et al. measured the influence of built neighborhood environments on walking with regard to the elderly and included neighborhood-level built environmental characteristics such as sidewalk quality, neighborhood graffiti and vandalism (aesthetics), and the presence of shopping malls, parks, and trails [41]. Yun examined the association of the elderly’s walking behaviors with the neighborhood environment as objectively accessed characteristics (e.g., pedestrian/bike facilities, aesthetics, traffic safety, walkability, parking, and transit) [12]. Buffel et al. mentioned that urban environments and communities (e.g., museums, libraries, parks, and communal spaces) may improve the quality of life for the elderly [20]. Other works also mentioned appropriate services (including shopping and health services), organizations (including senior centers and churches), civility and safety (including trust and physical safety), and walkability (including distance to amenities and attractive surroundings) as accessibility factors [5,42,43,44]. In short, accessibility to certain facilities is a very important factor, especially in the context of the elderly’s walking behaviors. It considers convenience for the elderly related to facilities such as local markets, senior citizen centers and health facilities, and transportation. In this study, we would like to define accessibility as ease of approach to various facilities in the neighborhood, considering the accessibility of convenience, medical, and community facilities.
When accessing a certain facility, perceived and physical safety is also an important factor in age-friendly neighborhood environments. Safety in comprehensive terms includes addressing anxiety related to various fields, including natural disasters, crime and risk, privacy, safety from transportation accidents, and safety in dangerous facilities. Yun examined the perception of the environment’s characteristics (e.g., safety, attractiveness, comfort, perceived crime) [12]. In addition, König et al. found that overall, safety was one of the highest-rated aspects of a neighborhood in the United States and Germany, and this included it being pedestrian-friendly [25]. Meanwhile, Yoo and Kim found safety issues in mixed-traffic streets with on-street parking [13]. Forsyth et al. perceived safety in the context of urban design and planning to create an environment safe from traffic, pollutants, and perceived and actual crime [2]. Pas et al. considered safety from neighborhood crime, in particular, because of the study area, namely South Africa; this developing country is more vulnerable to criminal activities [5]. Since Korea is considered a safe city worldwide in terms of crime [45], we are not including criminal safety in our analysis; instead, we took into account the dangerous physical environment caused by dilapidated buildings. Therefore, in our study, we are going to focus on the prevention of accidents and physical safety in terms of terrain, building conditions, and traffic accident characteristics.
The concept of pleasurability varies by study, unlike the factors of accessibility and safety. Most of the studies perceived pleasurability as an aesthetic aspect affecting the citizen’s sentiments or appreciation of their community. Yun analyzed the walking behavior of the elderly considering the pedestrian amenities in the neighborhood [12]. Hillcoat et al. evaluated the neighborhood environment in terms of the level of residential satisfaction being a motive for wishing to move in the UK. They considered factors related to pleasurability in the neighborhood such as children/young people loitering, noise levels, etc. [11]. Choi et al. and Gallimore et al. used the pleasurability to test a walkable pedestrian environment [46,47]. In this study, we are going to focus on the physical aspects of pleasurability because our approach is to focus on the urban physical environment using statistic data; therefore, our concept of pleasurability focuses on eco-friendliness, which includes air quality, green infrastructure, and hazardous facilities.
3. Materials and Methods
3.1. Study Area
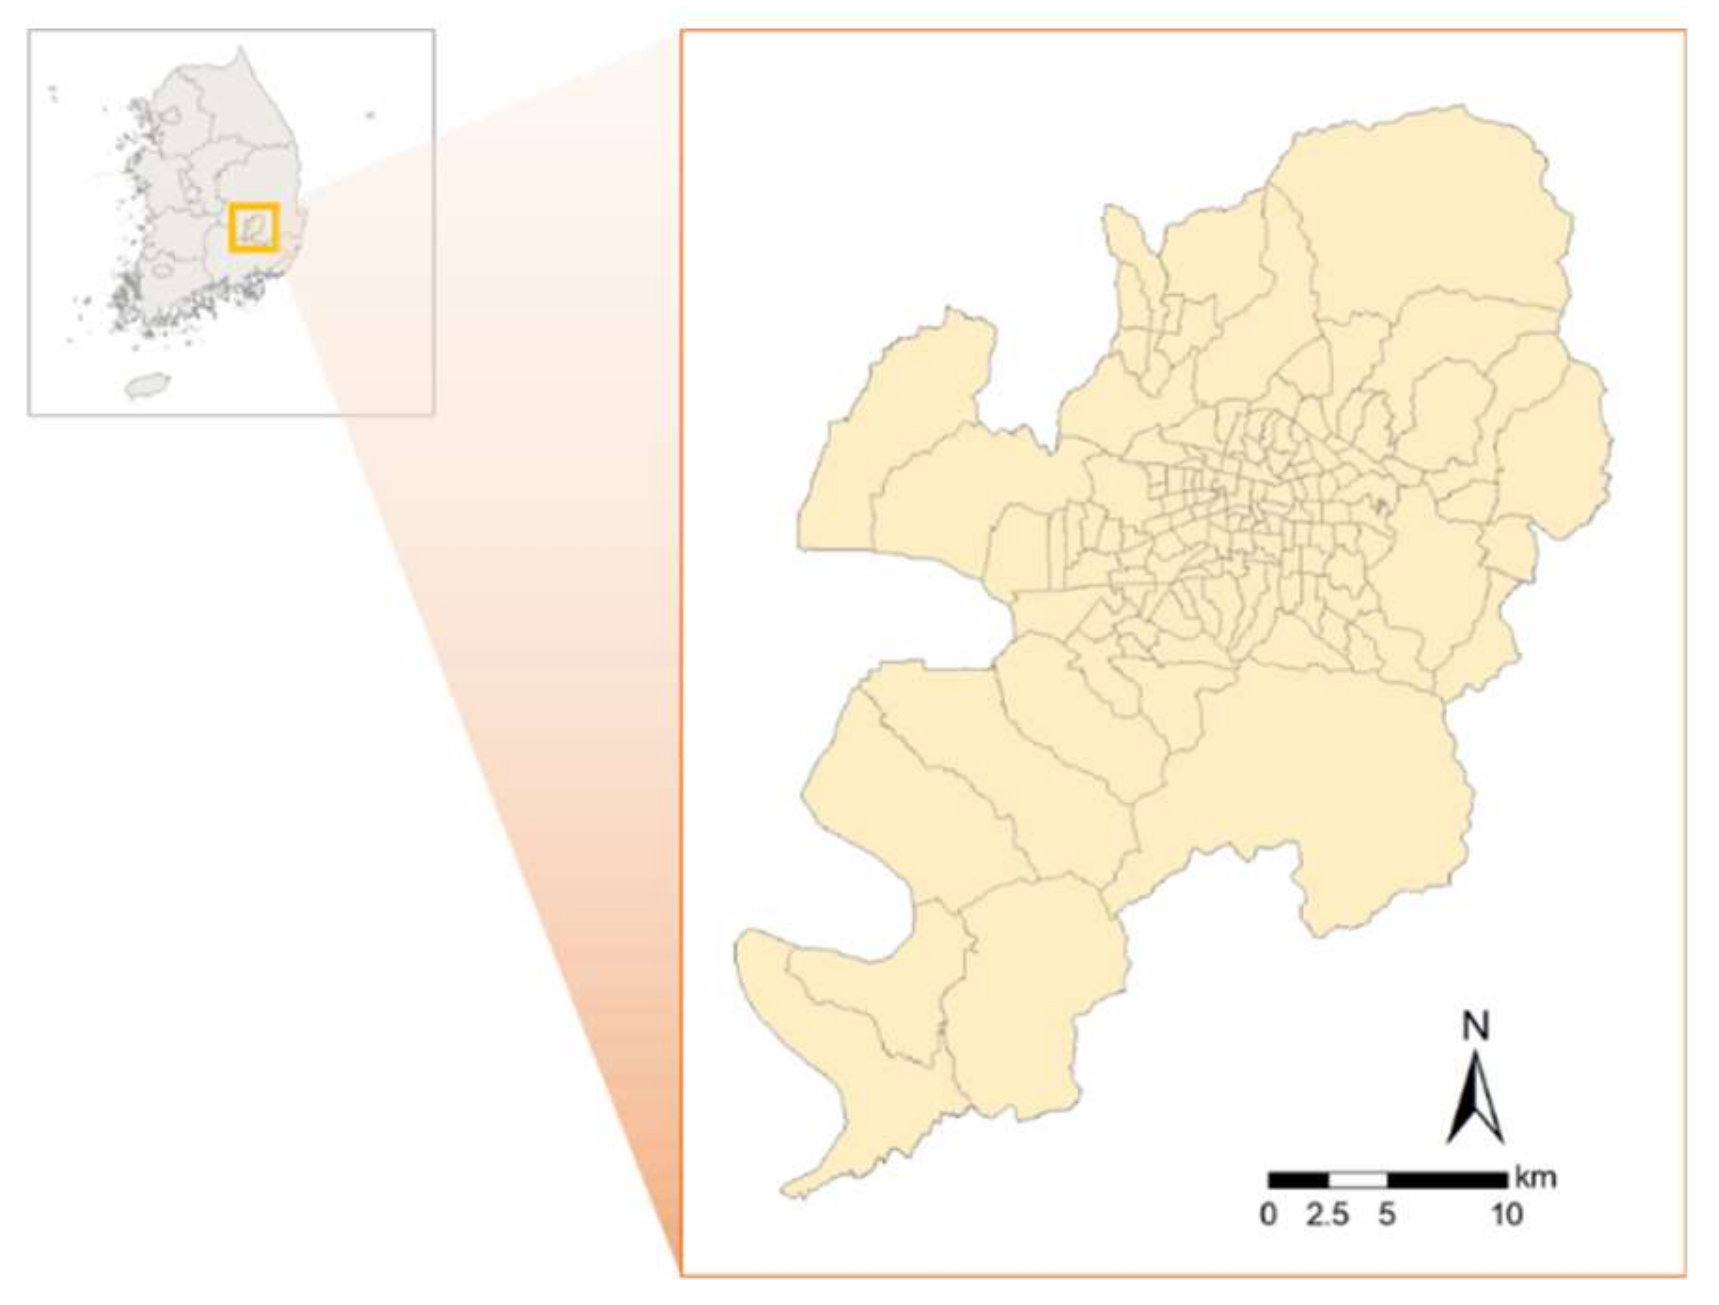
As shown in Figure 1, Daegu is located in the mid-south eastern area of Korea. Since the 1960s, Korea’s rapid economic growth, which focused on manufacturing industrial development in Daegu, has attracted people from rural areas [48]. In the 1980s, the city of Daegu expanded as the surrounding rural areas were included, and in 1995, it was promoted as Daegu Metropolitan City since it plays a prominent role in the mid-south eastern area of Korea [49]. Daegu is the 3rd largest city in Korea, with its population reaching 2,458,031 in December 2019 [50]. Its total area is 883.5 km2, approximately 1.5 times that of Seoul (605.2 km2), the capital city of Korea [51]. Recently, Daegu’s manufacturing-oriented industry is no longer attractive to the younger generation, which is accelerating the outflow of young people. In addition, the population of Daegu has been declining rapidly as the population that flowed in during the 1950s and 1960s is aging. Daegu is a city where urban areas are integrated with rural areas containing 139 diverse administrative units. This is because when the city was expanding it has experienced a government-led urban development in the central area, and also it included many surrounding areas in rural areas. This study examines how regions densely populated with the elderly (aged 65 years or older) changed over time and place in Daegu Metropolitan City. The spatial scope of this study is the city of Daegu, which consists of 139 administrative units, Eup-Myeon-Dong (hereafter, EMD), and the temporal scope covers the past decade, namely from 2009 to 2018.
3.2. Variables: Data
3.2.1. Elderly Population Ratio
The ratio of the elderly to the total population is used as a measure of aging. To explore the spatio-temporal trend of aging in Daegu from 2009 to 2018, this study employs the administrative unit (EMD) as a spatial unit of analysis. Data were obtained using the census data from the Korean Statistical Information Service [52].
3.2.2. Age-Friendly Neighborhood Environmental Variables
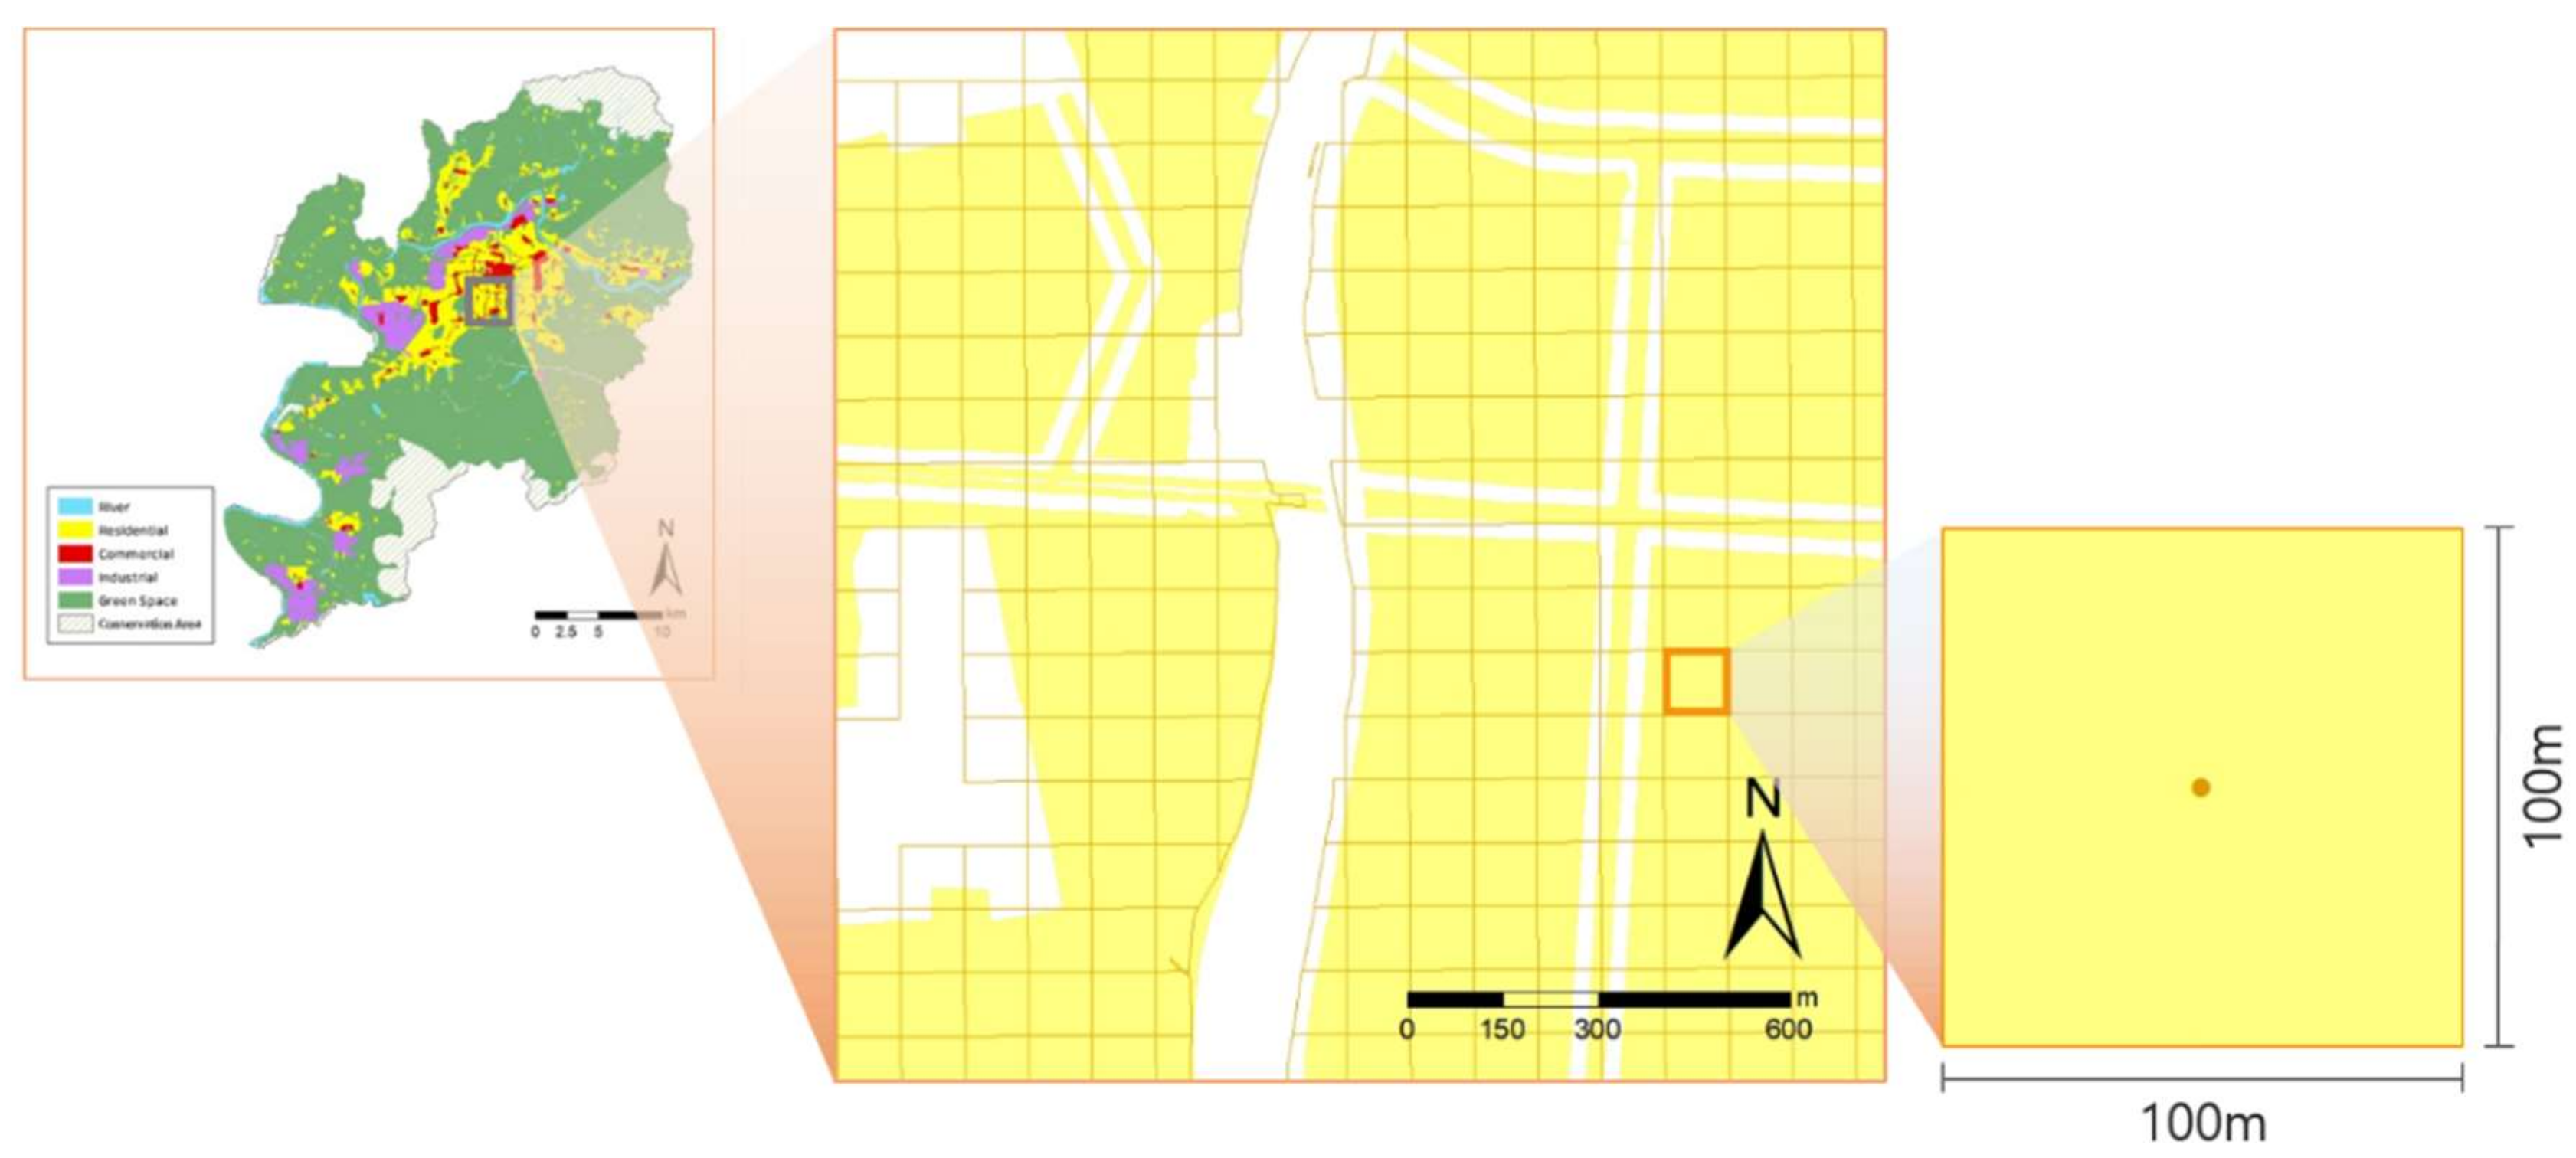
Based on the review of previous studies in Section 2.2, this study suggests that three elements, namely accessibility, safety, and pleasurability, contribute to age-friendly neighborhood environments. In this section, the 100 m × 100 m grid cell is used as a spatial unit of analysis to examine neighborhood environmental conditions in detail. In other words, the aging regions are derived by EMD units, and these EMDs are subdivided into the 100 m × 100 m grid cells to analyze the neighborhood environmental status. To assess the neighborhood environmental factors in aging regions, this study covers the residential areas, excluding rivers, streams, and the restricted development districts, and subdivides them into grid cells as shown in Figure 2.
As presented in Table 1, this study includes 17 variables that comprise three elements (accessibility, safety, and pleasurability) as environmental variables of age-friendly neighborhoods. Most of the data were acquired from the open data portal of the National Information Society Agency in Korea, the Korea National Spatial Data Infrastructure Portal, Road Name Address from the Korea Local Information Research and Development Institute [53,54,55]. A detailed description of the variables is as follows.
- Accessibility
Accessibility indicates the approachability of important facilities for the elderly. Convenience stores and local markets are representative facilities that the elderly use to purchase items necessary for daily life. In addition, various diseases occur with age, and the elderly need health care services in the community [56]. Therefore, this study selected hospitals (including clinics) and public health centers as medical facilities. As variables of welfare and administrative facilities, senior citizen community centers and welfare centers were included because these facilities are considered to be where the elderly spend their leisure time and maintain their social activities [34]. If the traffic infrastructure is ill-equipped in the area where elderly citizens live, many restrictions will result in health care services, leisure activities, and social participation; therefore, transportation facilities (subways and bus stops) were included as a variable for accessibility factors. In addition, urban parks, variables of park facilities, were considered necessary access facilities in an age-friendly neighborhood environment. Using ArcGIS, the variables were calculated as the network distance from the center of the grid cell to the nearest facility, or as the number of facilities distributed within a 400-m network buffer from the center of the grid cell.
- Safety
Safety refers to a state of being free from the danger of various accidents occurring within the community, and it includes building, terrain, and accident conditions. As a variable for building conditions, we calculated the ratio of dilapidated buildings as the percentage of old buildings (30+ years), because as buildings age, they deteriorate, resulting in various safety issues such as leaks and collapses, as well as overall poor living conditions. Terrain conditions include gradient, which hampers movement on steep slopes, especially for the elderly. Areas where elderly pedestrians were prone to meet with traffic accidents were included under accident conditions to check if the community had a safe environment for elderly pedestrians. Safety factors were generated from the average values of percentages of old buildings, mean slopes, and the number of traffic accidents involving the elderly.
- Pleasurability
Pleasurability refers to the level of satisfaction obtained from the surrounding natural or architectural environment and atmospheric conditions. In this study, hazardous facilities, green infrastructure, and air quality were considered. Factories, and excreta and waste disposal facilities were selected as hazardous facilities, since they are elements that can cause various forms of pollution. With regard to green infrastructure, this study used the Normalized Difference Vegetation Index (NDVI) to evaluate green environmental conditions. Air quality is also an important factor in regional pleasurability. It includes particulate matter (PM10 and PM2.5), which has recently become an issue in Korea [67], since it can cause fatalities in the elderly, who generally have weak respiratory systems and low immunity. Therefore, this study selected PM10 and PM2.5 to measure air quality in aging regions in Daegu. Hazardous facility variables were calculated distance to the closest each destination, while green infrastructure and air quality variables were calculated from the mean value within the 400-m network buffer. We used the NDVI to allocate a quantitative value indicating the distribution or condition of vegetation to present green infrastructure. To calculate the NDVI of Daegu, a satellite image of Landsat-8 OLI provided by the United States Geological Survey (USGS) was used (for 25 April 2018), considering that the cloud volume was less than 20%. In addition, to measure Daegu’s air quality, we used the Air Korea’s annual average data of particulate matter (PM10 and PM2.5) from each monitoring station. Hence, we could estimate the density of particulate matter (PM2.5 and PM10) of the whole of Daegu after considering the distance weighting function by implementing the IDW (inverse distance weighted) analysis from each monitoring station.
3.3. Analytical Method
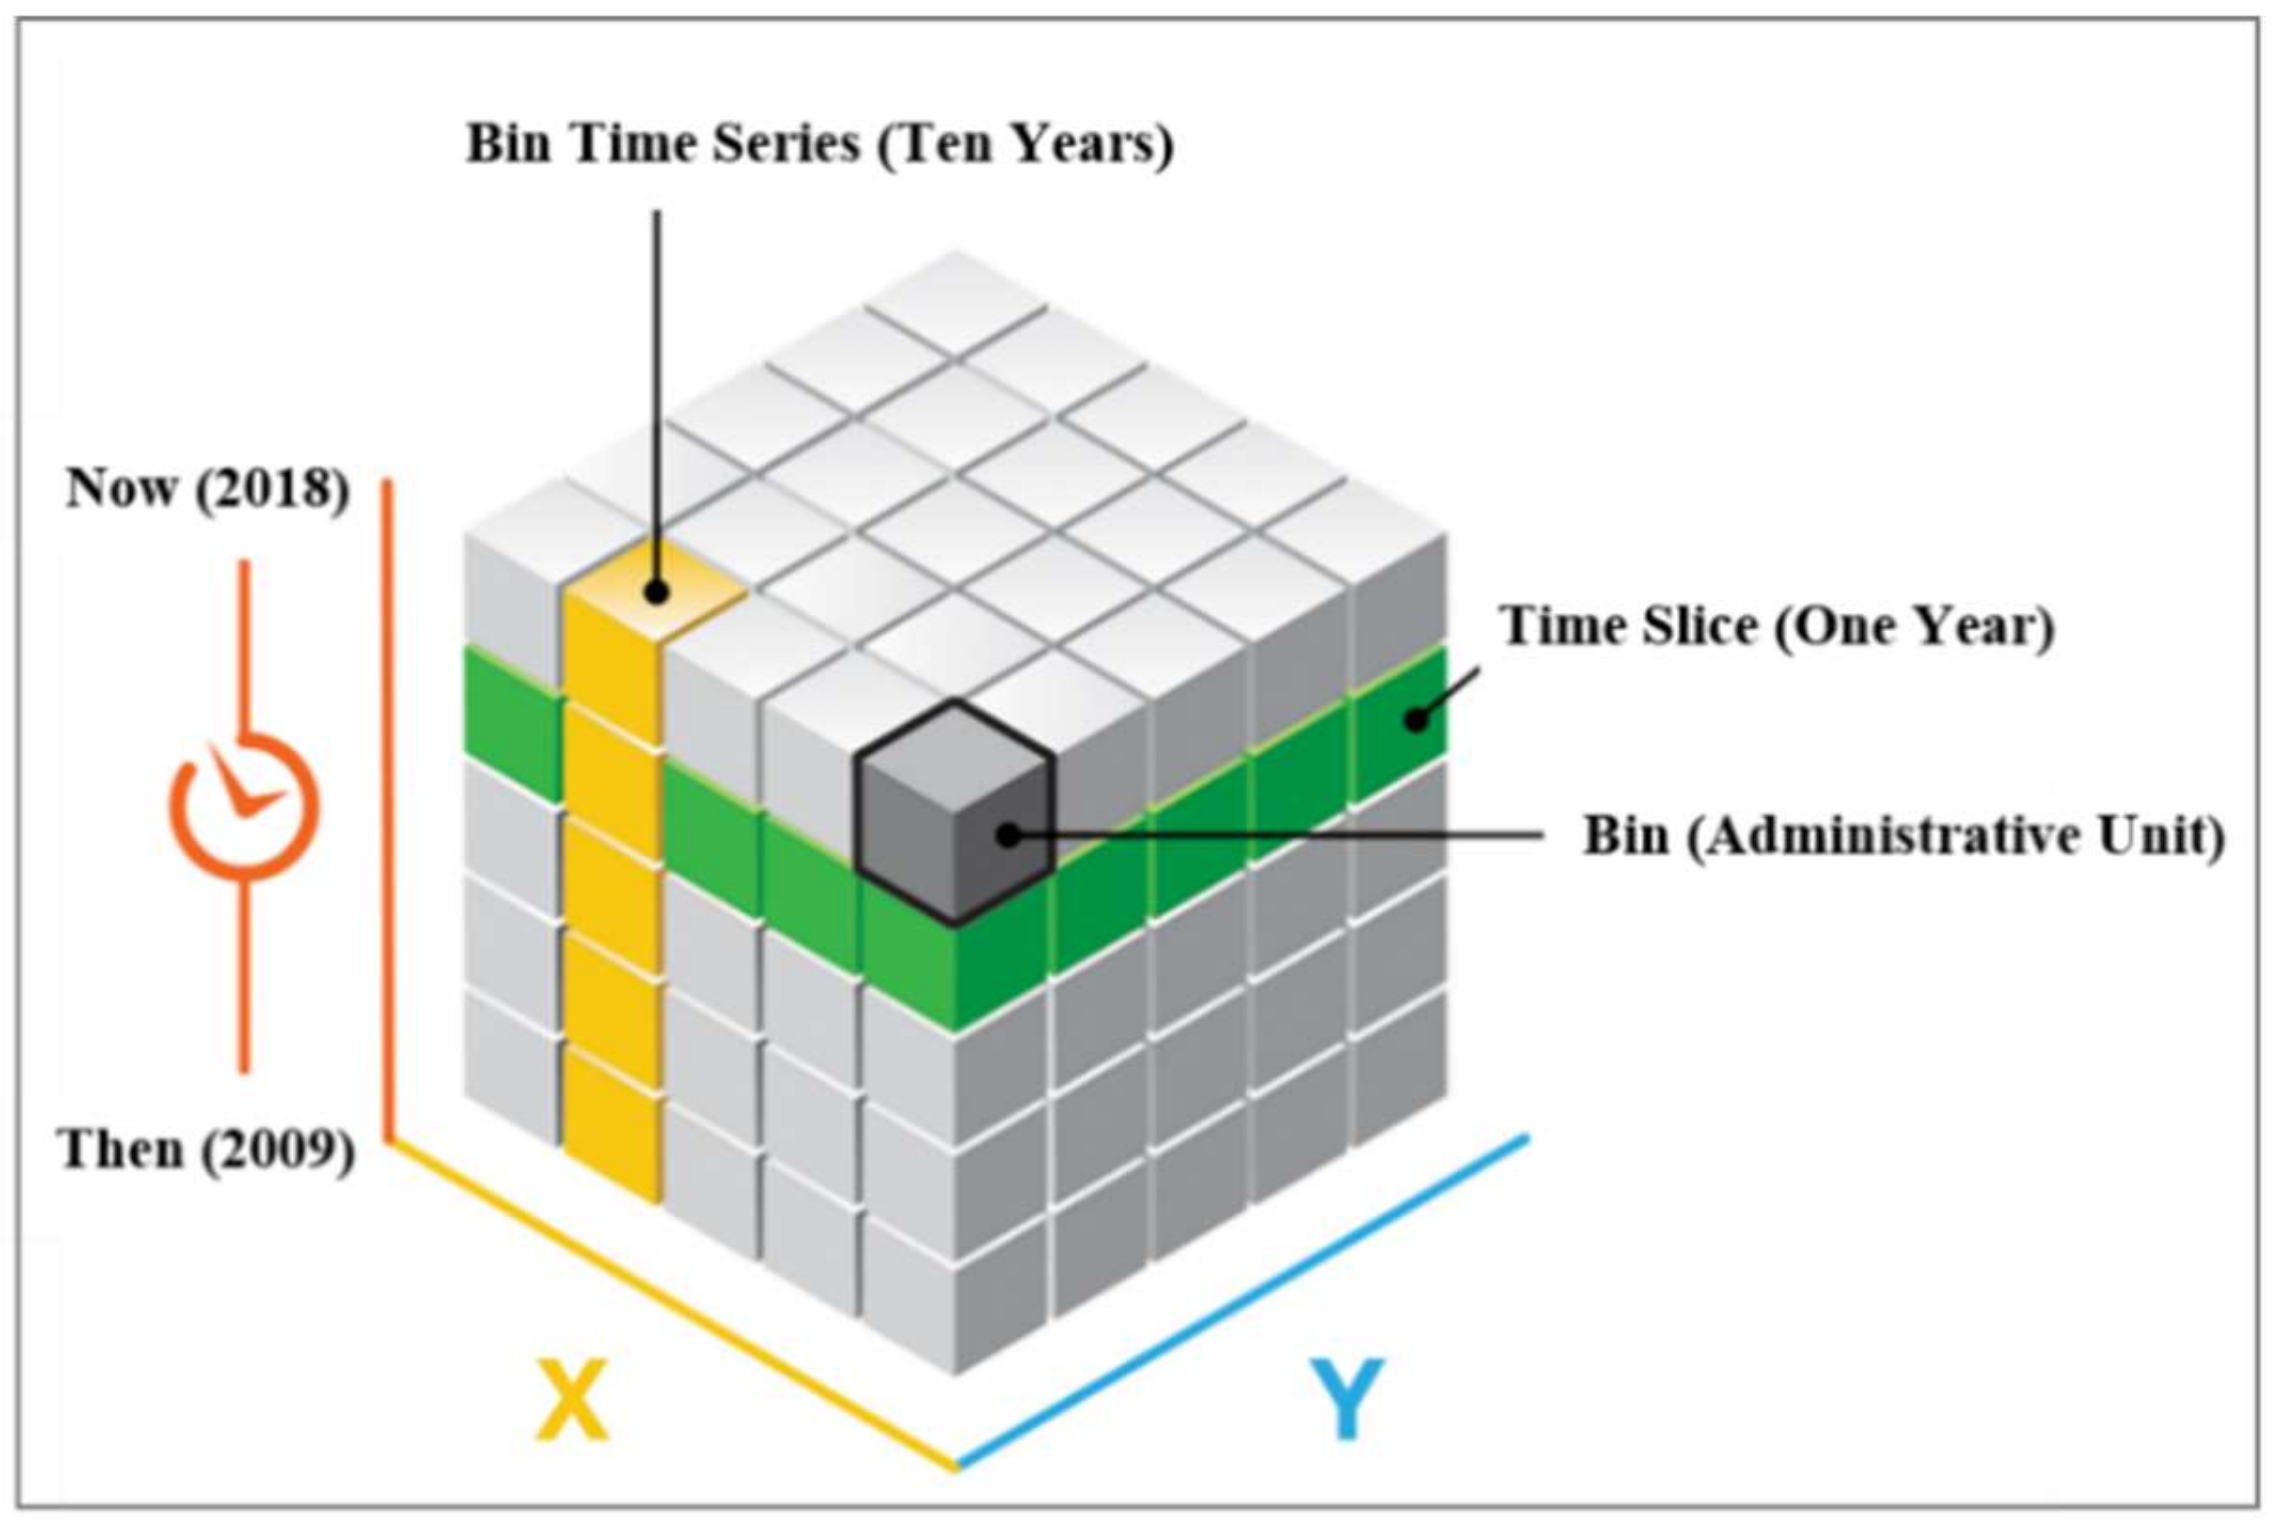
This study used the emerging hotspot analysis tool provided by ArcGIS Pro to observe the community-level spatio-temporal distribution of regions densely populated with the elderly based on each administrative unit (EMD) in Daegu Metropolitan City. In many previous studies, “hotspot” describes a region or value that is high compared to its surroundings [68,69,70,71]. In this study, we define a hotspot as a location showing statistically significant clustering (local autocorrelation) in the spatial pattern of the elderly population. Unlike previous studies where hotspot analysis was performed using simple spatial clusters, our approach (emerging hotspot analysis) enables a three-dimensional analysis combining temporal and spatial clusters. The creation of a space-time cube from a defined location is required as the first step of the analysis. As seen in Figure 3, a three-dimensional cube is generated as the 10-year (2009–2018) temporal trend of the ratio of the elderly population is determined when the location of each administrative unit of Daegu is fixed. As a result, 1390 (139 spatial units × 10 years) space-time cubes were created, and they were converted to the netCDF data format (Network Common Data Format). With the cube generated, we calculated the Getis-Ord Gi* statistic [72] to classify high and low values in a bin relative to its neighboring bins within the clustered cubes [68]. After calculating the z-score and p-value, which indicate the time-series trends of each cube, we could categorize the spatial and temporal patterns of each study area with the evaluation result of the hot and cold spot trends by applying the Mann–Kendall trend test. Additionally, with regard to the space-weighted matrix, which defines the neighborhood in the emerging hotspot analysis, we used Contiguity Edges Only option, which defines neighbors as areas in which at least one area abuts from the interface of the area.
With the emerging hotspot analysis of the aging regions in Daegu complete, we explored the neighborhood environment of the elderly in Daegu’s urban and suburban areas in detail. Using ANOVA and post hoc test (Dunnett’s test), we examined if there is a statistically significant difference among regional groups in the level of age-friendliness in the neighborhood environment.
4. Results
4.1. Spatio-Temporal Trend of the Elderly Population
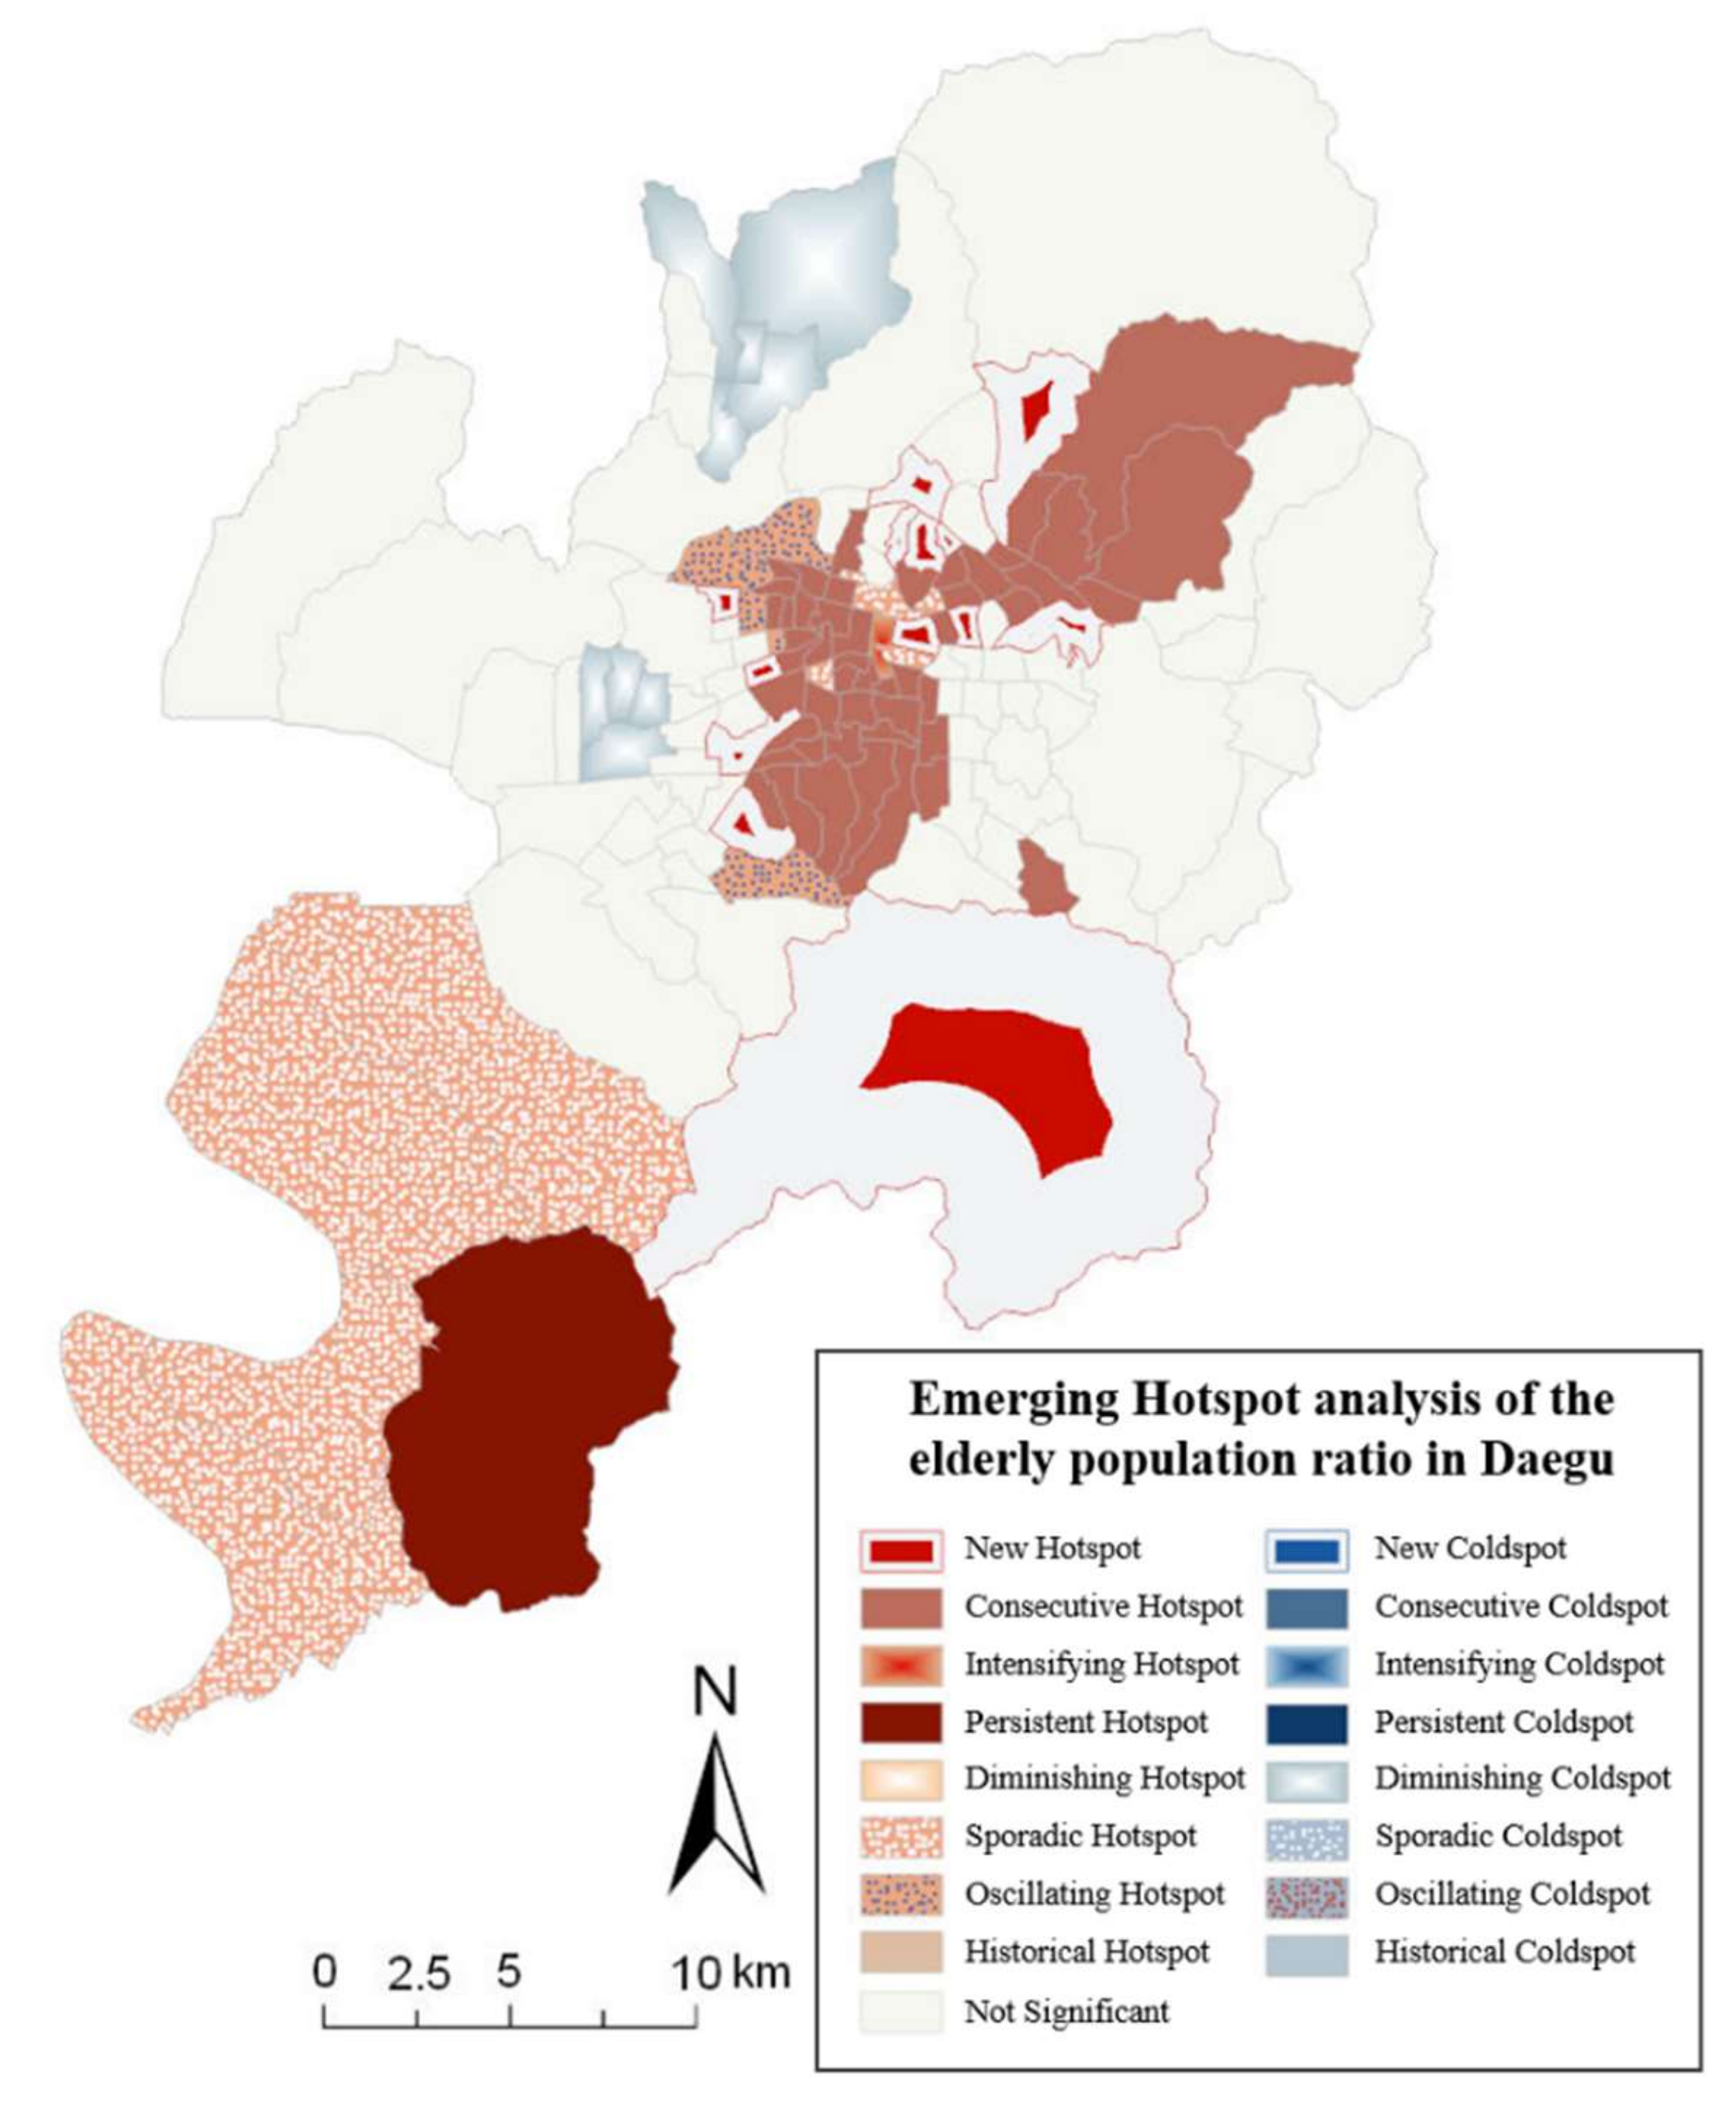
From 2009 to 2018, the ratio of the elderly population in Daegu increased steadily. The emerging hotspot analysis results showed that of the 139 administrative units in Daegu, 86 presented hot and coldspot trends (see Table 2 and Figure 4). Meanwhile, with regard to sporadic and oscillating patterns, both types of hotspots did not appear consistently during the 10-year time phase, so these patterns were not included in this study. Detailed information on the time and space pattern for each type is as follows.
First, Consecutive Hotspots are areas where significant hotspots occurred continuously during the most recent period (2017 and 2018), and 49 of the 139 administrative units in Daegu (35.3%) were in Consecutive Hotspots. In particular, all the administrative units in the southern district were in Consecutive Hotspots, followed by 67% of the units in the central district and 60% in the eastern district. Significantly, the southern district has the second lowest population among the eight local governments in Daegu, but its ratio of the elderly population is the highest; the southern district once recorded 230,000 people, but as of 2018, only 150,501 people are remaining. Additionally, with regard to the average monthly floating population in Daegu Metropolitan City in 2018, that of the southern district was found to be the lowest, and its number of floating populations remained at the bottom compared to the resident registration population. In the 1990s, the central district affected population outflow with its large-scale housing development projects and apartment supply outside the city center. The population-housing census showed that the percentage of old houses in the central district stood at 31.60%, which is overwhelmingly higher than the average value in Daegu (8.03%) [75]. In the case of the eastern district, the residents have many complaints about the noise and building height restrictions by the airport and K2 air force unit.
Second, New Hotspot indicates the areas of statistical significance during the last temporal stage (in this study, 2018), and it is most likely to surround Consecutive Hotspots, as shown in Figure 4. It is interpreted that the ratio of the elderly is gradually spreading over time based on Consecutive Hotspots.
Third, Intensifying Hotspot refers to areas where 90% of the time stages during the 10 years (2009–2018) correspond to hotspot areas, and increase in intensity over time. The central district had Intensifying Hotspots, and currently, these areas have a high floating population as well as dense population due to active commercial vitalization. On the other hand, not only the ratio of the elderly is high in this area, but also the ratio of elderly pensioners is high. Moreover, 80% of old buildings are more than 20 years of buildings. Additionally, in this area, population aging occurs from the initial stage, and it increases drastically over time.
Fourth, Yuga-eup in the southern edge of Daegu was in a Persistent Hotspot, where a constant hotspot was maintained for more than 90% of the 10-year phase, without increasing or decreasing over time. Yuga-eup has a large scale of industrial complexes, and recently, some areas in their county increase the youth population due to job growth, but still, where the elderly lives are not in good residential conditions.
Finally, a Diminishing Cold Spot was found in Chilgok (at the northern edge of the city) and Seongseo (10 km west of the city center). Chilgok has one of the highest percentages of young adults because it has developed its residential districts and acts as a sub-center. Seongseo has universities and industrial parks, which encourage the inflow of youth. All of these areas are in coldspots, but their intensity decreases over time, which means they could be in hotspots in the future, indicating future aging regions, which raises potential concern.
4.2. Analysis of Age-Friendly Neighborhood Environmental Conditions
4.2.1. Comparison of Age-Friendly Neighborhood Environments by Regional Group
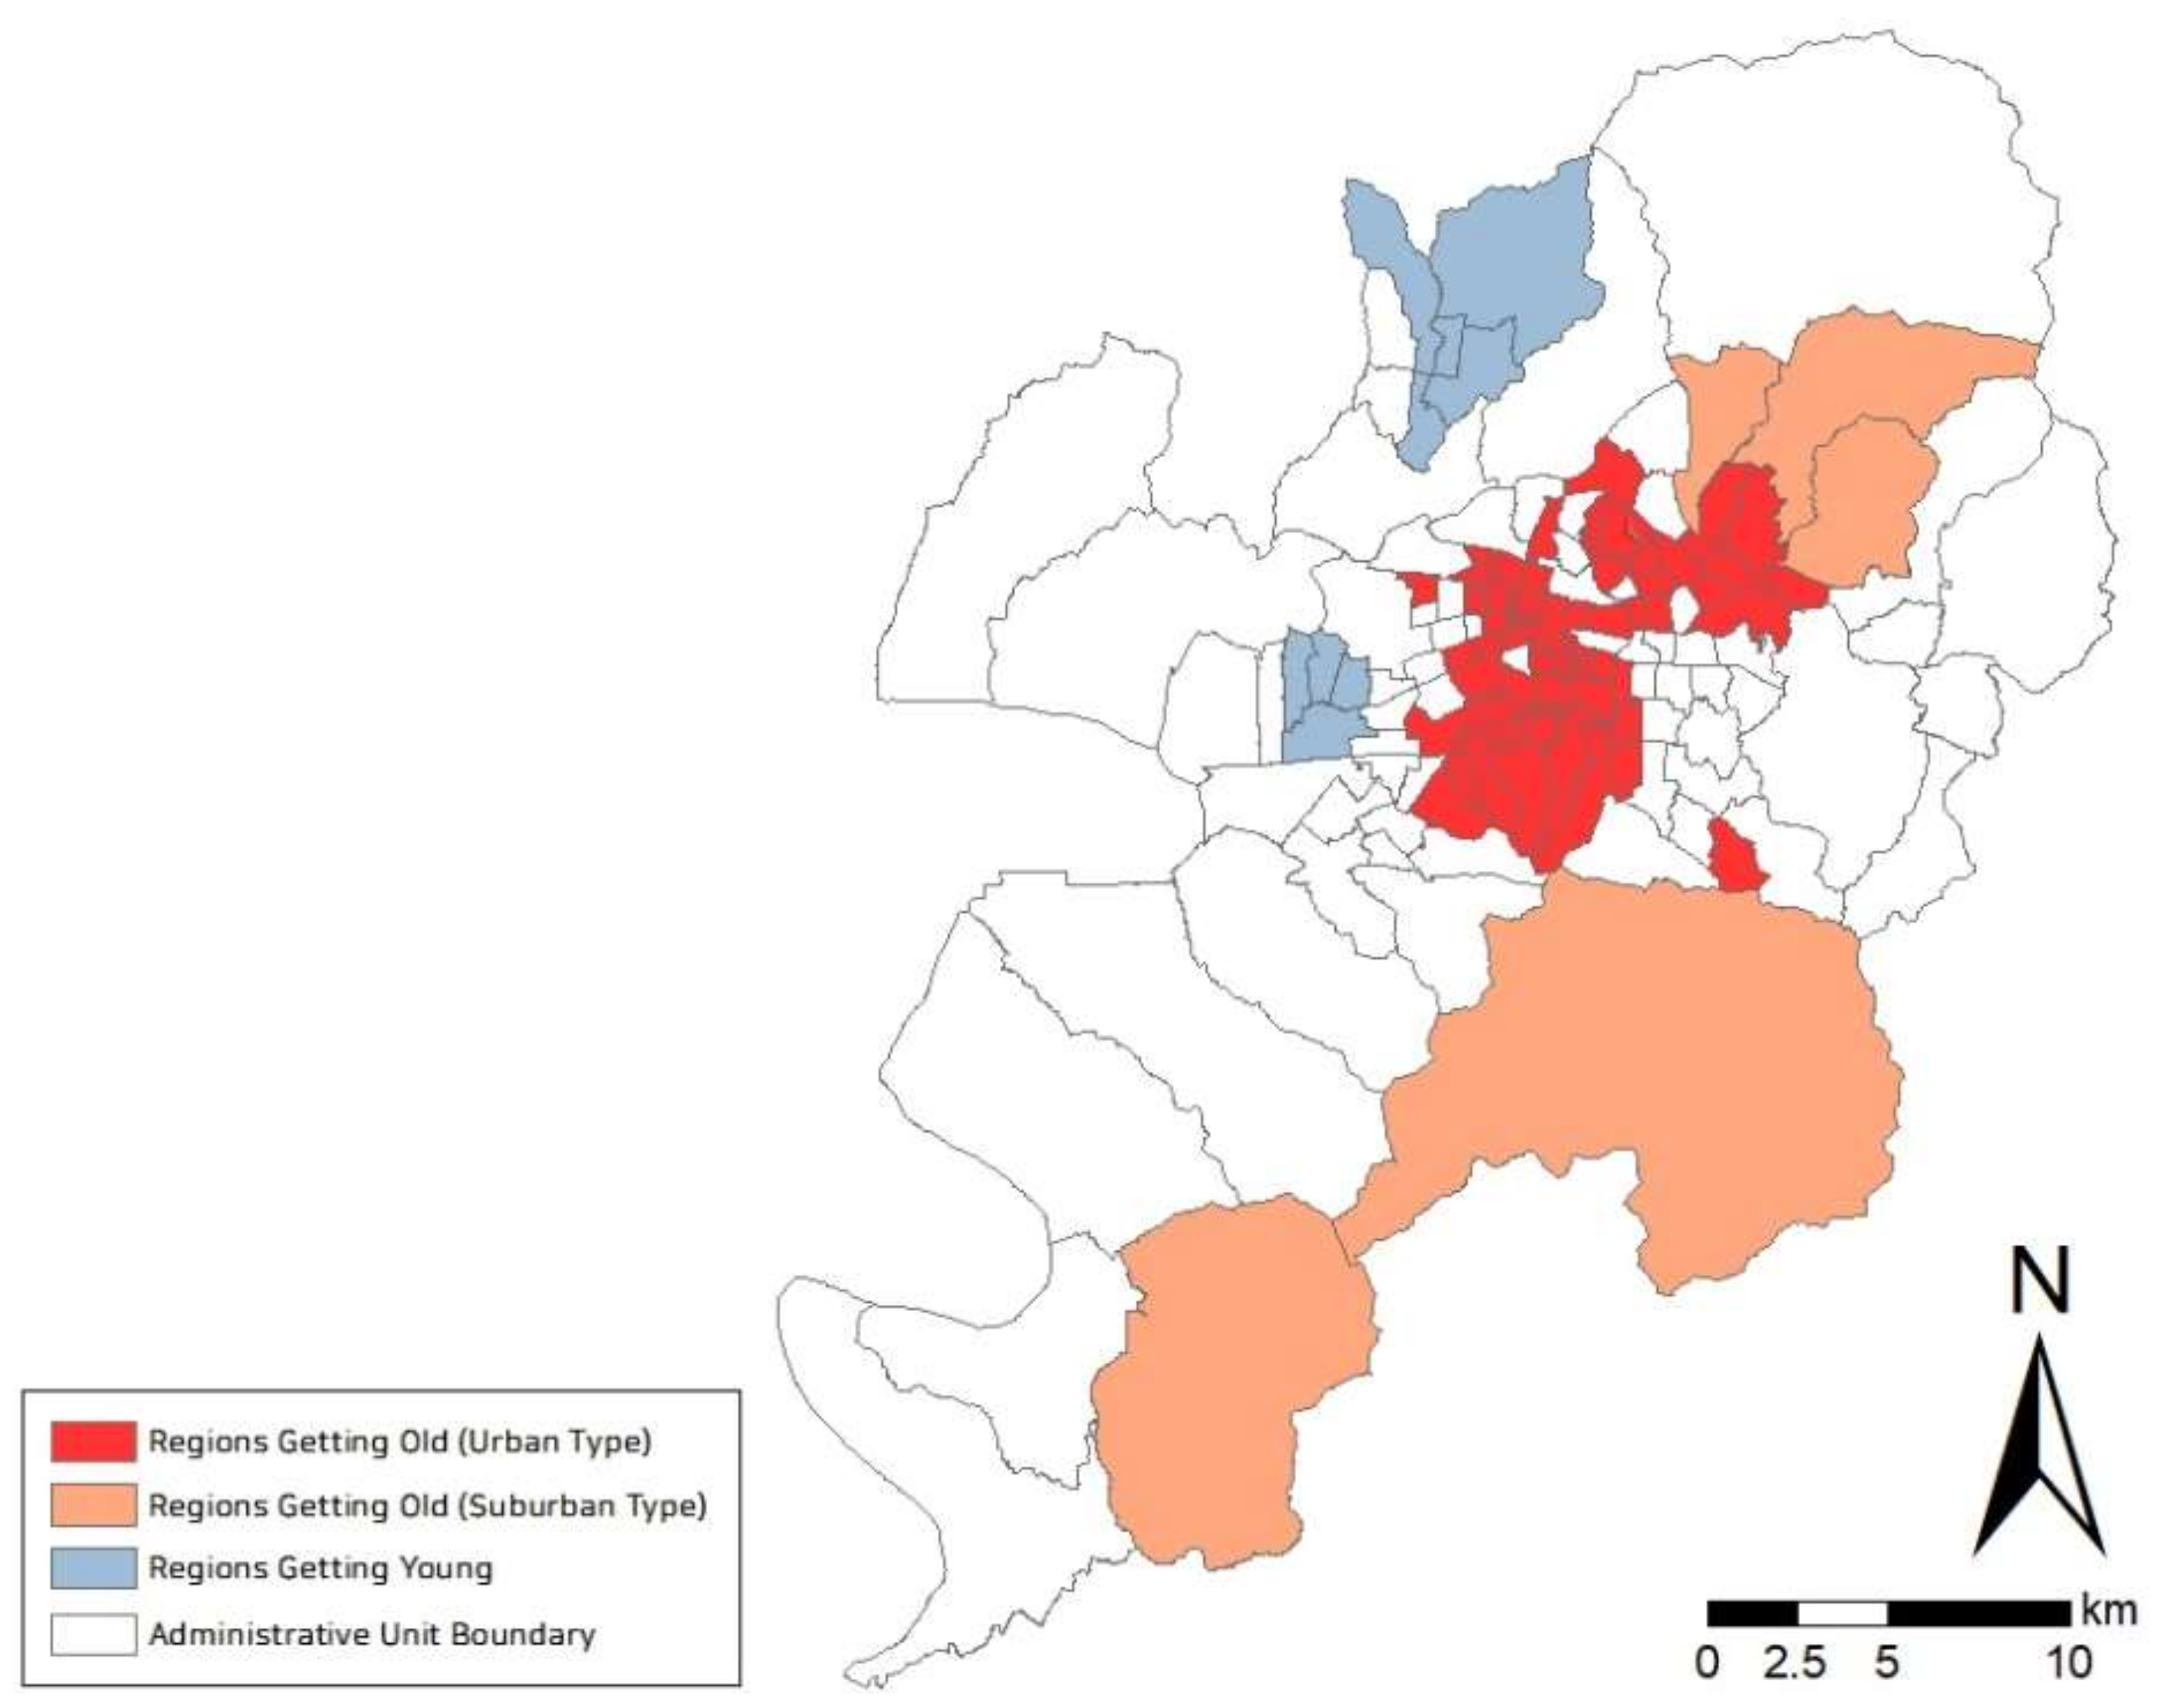
In order to compare and analyze the neighborhood environmental conditions with regard to age-friendliness, we classified the regions into three groups, “regions getting old (urban-type)”, “regions getting old (suburban-type),” and “regions getting young,” as shown in Figure 5. The patterns corresponding to hotspots (New, Consecutive, Intensifying, and Persistent Hotspots) are considered as aging regions, and are further divided into “regions getting old (urban-type)” and “regions getting old (suburban-type)”. Coldspots are considered as “regions getting young”. Out of 139 administrative units of Daegu, 64 units were included as hotspots for aging regions. Among them, 5 units were in suburban regions, and the rest 59 units were corresponding to urban regions. Meanwhile, 9 units were corresponding to coldspots. Based on the residential areas within each administrative unit, 100 m × 100 m grid cells were created to analyze the neighborhood environmental level. As a result, 1413 grid cells from 5 administrative units were derived for regions getting old (suburban-type), while 3908 grid cells from 59 units were derived for regions getting old (urban-type). Moreover, 1327 grid cells representing regions getting young were derived from 9 administrative units.
As seen in Table 3, ANOVA and post hoc test (Dunnett’s test) were conducted to examine if there is a statistically significant difference among the regional groups in the level of age-friendliness in the neighborhood environmental conditions. The analysis results showed that the difference by the group was significant in all the neighborhood environmental factors; accessibility, safety, and pleasurability. First, we found that in terms of accessibility, regions getting old (suburban-type) were the worst. In addition, all the neighborhood facilities in this group were out of the walking range (400 m) of the elderly. Second, the safety factor’s building and accident characteristics were the worst in regions getting old (urban-type). The dilapidated buildings ratio was found to be twice as high as that of the other groups, indicating that the physical environment of this group is poor. Meanwhile, the terrain gradient showed that regions getting old (suburban-type) were about twice as steep as other groups. Third, with regard to the pleasurability factor, hazardous facilities can be considered favorable when these facilities are farther from residential areas since they cause various forms of pollution. Regions getting old (suburban-type) had relatively farther away from factories and excreta and waste disposal facilities when compared to the other groups. The NDVI values, which indicate green infrastructure, were the lowest in regions getting old (urban-type). Meanwhile, PM10 and PM2.5, which refer to air quality, were twice as high as recommended by the World Health Organization in all groups. According to the World Health Organization guidelines, the levels of PM10 and PM2.5 should be under 20 and 10 μg/m3 per year, respectively [76].
4.2.2. Case Study of the Environmental Conditions of Age-Friendly Neighborhoods in Aging Regions
As seen in the ANOVA and post hoc analysis in Section 4.2.1, the levels of age-friendly neighborhood environmental conditions differed significantly among the regional groups. In this section, a case study using both quantitative and qualitative approaches was conducted to comprehensively examine the current environmental conditions of the neighborhood. In the quantitative method, a distinct variable from each element (accessibility, safety, and pleasurability) was selected for age-friendly environments. By visualizing the objective quantitative indicators of the variables on the GIS map, the relative differences of the surrounding areas could be identified in detailed spatial units (100 m × 100 m grid cells). In addition, the status and current conditions of the environment could be obtained qualitatively through a field survey. As shown in Table 4 and Table 5, we selected four distinct regions (EMDs) undergoing significant growth of the aging population. Two urban and two suburban EMDs were selected, taking the spatial distribution of Daegu into account.
Daesin-dong, which is in regions getting old (urban-type), has a lot of traffic and a floating population due to Seomun Market, a representative traditional market. Significantly, this area has almost 10 times the traffic accidents involving elderly pedestrians (Daesin-dong: 37.62 number/km2, Daegu: 3.80 number/km2) of not only Daegu, but also the country due to poor road maintenance and traffic volume. In addition, it has almost twice the percentage of old buildings than Daegu does (Daesin-dong: 64.67%, Daegu: 36.16%) inside the site and it lacks small-scale parks that are easily accessible to residents. Namsan2-dong, also an urban aging region, has more than twice the percentage of old buildings than Daegu does (Namsan2-dong: 76.84 number/km2, Daegu: 36.16 number/km2). Therefore, most of the areas are redevelopment or reconstruction sites. Additionally, illegal parking caused by a lack of parking spaces and narrow streets hampers residents’ walking safety and comfort. Moreover, since there is a lack of parks where residents can rest, the NDVI values in this area were lower than those in other areas (Namsan2-dong: 0.11, Daegu: 0.18).
Since a large apartment complex is being constructed in Yuga-eup, a suburban aging region, several neighborhood facilities are being established, and there is a substantial youth population. However, the areas that are densely populated by the elderly are still in poor condition. They lack access to neighborhood facilities, especially the urban park (average distance to the urban park; Yuga-eup: 786.88 m, Daegu: 628.49 m). Yuga-eup’s dilapidated buildings ratio (25.91%) is lower than the average value of Daegu (36.16%). However, this is due to the recent construction of apartment complexes near the industrial parks. The ratio of dilapidated buildings is still high in areas where the elderly is concentrated. As seen in a field photo in Table 5, newly built apartment complexes are alongside old buildings, highlighting the environmental disparity within the neighborhood. Dopyeong-dong is also one of the regions getting old (suburban-type). The distance to the urban park is more than 4 times the average distance to urban parks in Daegu (average distance to urban park; Dopyeong-dong: 2876.15 m, Daegu: 628.49 m). In addition, the neighborhood environment is unsafe; many paths are steep and at risk of collapsing, and the streets are dark at night.
5. Discussion and Conclusions
The dramatic increase in the aging population provides momentum to the age-friendly movement [6]. Since the current rate of aging in Korea is overwhelmingly high when compared globally, it is necessary to devise countermeasures not just for welfare, but also sustainable urban planning. This study analyzed regions in Daegu Metropolitan City that are densely populated with the elderly and examined their neighborhood environments.
The overall findings of this study are as follows. First, the emerging hotspot analysis showed that the aging regions in Daegu are spreading from the city center over time. It showed a similar aspect with the capital city of Korea, Seoul, that it experienced rapid growth of the aging population in the center of the city [78]. It also showed that although the regions of Chilgok and Seongseo are in coldspot (regions getting young) areas, their intensity is gradually decreasing over time. This indicates that even relatively youthful regions in Daegu could potentially become hotspots (regions getting old) in the future, so we need to be conscientious about preparing the whole of Daegu for an aging society. Second, ANOVA and post hoc analysis were conducted to compare the age-friendliness of the neighborhoods’ environmental conditions in regions getting old (urban-type, suburban-type) and the regions getting young in Daegu. The results showed a statistically significant difference among these three regional groups in age-friendliness levels of the neighborhoods’ environmental conditions (i.e., their accessibility, safety, and pleasurability). Suburban aging regions, in particular, were the worst in accessing all the neighborhood facilities when compared to urban aging regions and regions getting young. Additionally, the facilities in regions getting old (suburban-type) were found to be farther than the 400-m living zone radius, which is considered a walkable distance for the elderly. In terms of safety, regions getting old were generally poorly maintained and their elderly pedestrians were vulnerable to traffic accidents. Regions getting old (suburban-type) had slopes that were almost twice as steep as those in the other groups, and some of the slopes were so steep that while walking, not only the elderly, but also the young would be physically strained. Regarding pleasurability, regions getting old (suburban-type) were found to be favorable, while regions getting old (urban-type) had fared poorly due to hazardous facilities, inadequate green infrastructure, and poor air quality. Third, we conducted a case study on the urban and suburban aging regions with noticeable results from the ANOVA and post hoc analysis. It showed that among the urban aging regions, Daesin-dong and Namsan2-dong were partially transforming into slums due to the old and neglected buildings. These features are in line with the urban aging regions in Seoul that they are lacking resources in the neighborhoods especially on housing and facilities conditions [78]. In addition, the protection zones on the roads for the elderly were inadequate. Among the suburban aging regions, Yuga-eup and Dopyeong-dong had a poor infrastructure in terms of living facilities, and there was a disparity in the residential environment due to the new, large apartment complexes and the existing old housings. Moreover, they had steep slopes and neglected paths that were at risk of collapse.
Based on the analysis results above, the following policy implications can be suggested. First, it is necessary to consider neighborhood infrastructure for the elderly as a matter of equity in the city rather than in the context of supply and demand as an economic market principle. Moreover, since Daegu showed marked region-specific differences in neighborhood environment levels, it is crucial to pay attention to the areas that lack major facilities for the elderly at the city government level. In addition, the analysis showed that in terms of accessibility, medical facilities were the worst. This indicates that the quality of medical services for the elderly needs to be improved, perhaps by using visiting medical services. Second, the residential environment needs to be improved. In Daegu’s urban aging regions, we found poor residential conditions due to abandoned and vacant housings and dilapidated buildings. Moreover, since the number of elderly is expected to rise, improvements in transportation infrastructure for elderly pedestrians are also required to facilitate their participation in economic and social activities. Therefore, protection zones and continuous management plans focusing on areas where elderly pedestrians are prone to traffic accidents are required. Third, the city of Daegu should be reinvented as a more attractive residential area for the elderly by establishing ample green infrastructure in the city center. While it is important to improve medical support and health institutions as a follow-up measure, a proactive prevention approach is needed through the improvement of the physical environment with regard to urban planning and design aspects. Specifically, due to the high population density, Korea’s urban regions use high-density development for effective land usage, making the expansion and creation of large-scale parks difficult. Therefore, innovative ways to make extra use of existing urban green areas, or small pieces of land and private land need to be considered as potential sites for new green spaces within the city center. It could be a good idea to upgrade existing parks that are primarily used by the elderly beyond their limited function of providing resting spaces to promote physical activities and social interaction.
This study has some limitations as follows. First, this study mainly focused on the built environmental conditions, however, a social environment also plays a crucial role in an age-friendly city [3,20]. Several studies examined social environments such as social cohesion, employment, an opportunity for participation [5,13,56,79]. Although we included facilities related to a social network, such as a senior citizen community center, it is required to consider the involvement of the civil society of the elderly in a further study. Moreover, depending on physical or psychological status, the same physical environment can be perceived differently by each character. To move on to more in-depth research, it would be essential to examine the comparison between the perceived and actual environment by considering the individual characteristics of the elderly. Especially, physical and mental health status, presence of cohabitation families, and the period of settlement in a region can impact the age-friendly environment depending on the elderly’s characteristics. Second, people over the age of 65 were classified as elderly population. Older people have more constraints on their daily lives as they get older. That is, the age-friendly neighborhood environment also depends on the elderly’s age. In future study, the elderly group should be further subdivided and used for analysis. Lastly, this study conducted a cross-sectional analysis for evaluating the neighborhood environmental conditions. Cross-sectional design cannot examine changes in neighborhood environment over time. In future study, longitudinal analysis can be performed to measure the neighborhood environment.
Despite these limitations, this study has significance in several aspects. First, it investigated the aging population of each region from a temporal and spatial perspective. Most research examines either temporal changes or spatial distribution of the aging population, however in this study, using emerging hotspot analysis, it was able to show the spatio-temporal patterns of aging regions within the city of Daegu in the past decade. It is important for local governments to recognize the spatial and temporal trend of the aging population of each region for proactive decision making. Second, the trend of the aging population of each region was grouped into urban and suburban areas to analyze significant differences in the neighborhood environment within the groups. From our findings, age-friendly neighborhood environmental levels for both urban and suburban areas can be obtained. Especially, for cities with a rural and urban area integrated like Daegu, it is helpful to take a closer look at our findings. Third, this study explored the neighborhood environment at a community level. When measuring the aging population of each region, this study used the smallest administrative unit (EMD) for a more precise outcome as possible. Furthermore, to assess the neighborhood environmental level, all variables measured in 100 m × 100 m grid cells as a spatial unit to capture the features at a more detailed level. As a result, the trend of the elderly population and the neighborhood environment level of each region could be obtained at the community level. Lastly, by conducting an additional case study through a qualitative as well as a quantitative approach, the current status of case sites could be obtained. With our findings, a comprehensive picture from macro trends to micro-level field study can be presented. Results from this study can contribute to useful data in implementing urban and environmental planning policies and welfare policies for the elderly.
The aging society is a global phenomenon. Developing age-friendly environments has become a major concern for social and public policy [20]. Therefore, an age-friendly environment is required in the community to enhance the elderly’s quality of life. Advances in medical technology have allowed us to live longer, but as elderly. Building an environment for the elderly translates into creating an environment for all of us. Therefore, an age-friendly environment as an urban infrastructure needs to be developed throughout by the city government to improve the quality of life for all of us.
Author Contributions
Conceptualization, E.J.K. and H.K.; methodology, E.J.K. and H.K.; software, M.-Y.K.; validation, E.J.K. and H.K.; formal analysis, M.-Y.K.; investigation, E.J.K.; resources, E.J.K.; data curation, E.J.K.; writing—original draft preparation, E.J.K., M.-Y.K., and H.K.; writing—review and editing, E.J.K., M.-Y.K., and H.K.; visualization, M.-Y.K.; supervision, E.J.K.; project administration, E.J.K.; funding acquisition, E.J.K. All authors have read and agreed to the published version of the manuscript.
Funding
This work was supported by the National Research Foundation of Korea (NRF) grant funded by the Korea government (MSIT) (No. NRF-2017R1A2B4005440).
Conflicts of Interest
The authors declare no conflict of interest.
References
- Balestra, C.; Dottori, D. Aging society, health and the environment. J. Popul. Econ. 2012, 25, 1045–1076. [Google Scholar] [CrossRef] [Green Version]
- Forsyth, A.; Molinsky, J.; Kan, H.Y. Improving housing and neighborhoods for the vulnerable: Older people, small households, urban design, and planning. Urban Des. Int. 2019, 24, 171–186. [Google Scholar] [CrossRef]
- Steels, S. Key characteristics of age-friendly cities and communities: A review. Cities 2015, 47, 45–52. [Google Scholar] [CrossRef] [Green Version]
- Statistics Korea (KOSTAT). Available online: http://kostat.go.kr/portal/korea/kor_nw/1/1/index.board?bmode=read&aSeq=370779 (accessed on 27 December 2019).
- Van der Pas, S.; Ramklass, S.; O’Leary, B.; Anderson, S.; Keating, N.; Cassim, B. Features of home and neighbourhood and the liveability of older South Africans. Eur. J. Ageing 2015, 12, 215–227. [Google Scholar] [CrossRef] [Green Version]
- Fitzgerald, K.G.; Caro, F.G. An overview of age-friendly cities and communities around the world. J. Aging Soc. Policy 2014, 26, 1–18. [Google Scholar] [CrossRef]
- Buffel, T.; Phillipson, C. Can global cities be “age-friendly cities”? Urban development and ageing populations. Cities 2016, 55, 94–100. [Google Scholar] [CrossRef]
- Van Hoof, J.; Kazak, J.K. Urban ageing. Indoor Built Environ. 2018, 27, 583–586. [Google Scholar] [CrossRef]
- Towne, S.D.; Won, J.; Lee, S.; Ory, M.G.; Forjuoh, S.N.; Wang, S.; Lee, C. Using Walk ScoreTM and Neighborhood Perceptions to Assess Walking Among Middle-Aged and Older Adults. J. Community Health 2016, 41, 977–988. [Google Scholar] [CrossRef]
- Winters, M.; Voss, C.; Ashe, M.C.; Gutteridge, K.; McKay, H.; Sims-Gould, J. Where do they go and how do they get there? Older adults’ travel behaviour in a highly walkable environment. Soc. Sci. Med. 2015, 133, 304–312. [Google Scholar] [CrossRef]
- Hillcoat-Nallétamby, S.; Ogg, J. Moving beyond “ageing in place”: Older people’s dislikes about their home and neighbourhood environments as a motive for wishing to move. Ageing Soc. 2014, 34, 1771–1796. [Google Scholar] [CrossRef] [Green Version]
- Yun, H.Y. Environmental factors associated with older adult’s walking behaviors: A systematic review of quantitative studies. Sustainability 2019, 11, 3253. [Google Scholar] [CrossRef] [Green Version]
- Yoo, S.; Kim, D.H. Perceived urban neighborhood environment for physical activity of older adults in Seoul, Korea: A multimethod qualitative study. Prev. Med. (Baltim) 2017, 103, S90–S98. [Google Scholar] [CrossRef] [PubMed]
- Zandieh, R.; Flacke, J.; Martinez, J.; Jones, P.; Van Maarseveen, M. Do inequalities in neighborhood walkability drive disparities in older adults’ outdoor walking? Int. J. Environ. Res. Public Health 2017, 14, 740. [Google Scholar] [CrossRef] [PubMed]
- Adler, M.W.; Ahrend, R. Traffic Safety in Korea: Understanding the Vulnerability of Elderly Pedestrians; OECD: Paris, France, 2017. [Google Scholar]
- Ministry of the Interior and Safety. Available online: https://www.mois.go.kr/synap/popup/synapFileViewOpen.do;jsessionid=cFlgKmWmQ04vMFtXFM8TwLbV.node50?atchFileId=FILE_000903352H1wuyr&fileSn=0 (accessed on 8 January 2020).
- Sun, H.-J. Suicide prevention efforts for the elderly in Korea. Perspect. Public Health 2016, 136, 269. [Google Scholar]
- Kim, J.W.; Jung, H.Y.; Won, D.Y.; Shin, Y.S.; Noh, J.H.; Kang, T.I. Landscape of Elderly Suicide in South Korea: Its Trend According to Age, Gender, and Educational Attainment. OMEGA J. Death Dying 2018, 0030222818807845. [Google Scholar] [CrossRef] [PubMed]
- OECD iLibrary. Reducing the High Rate of Poverty Among the Elderly in Korea. Available online: https://0-www-oecd--ilibrary-org.brum.beds.ac.uk/economics/reducing-the-high-rate-of-poverty-among-the-elderly-in-korea_5jxx054fv20v-en (accessed on 12 January 2020).
- Buffel, T.; Phillipson, C.; Scharf, T. Ageing in urban environments: Developing ‘age-friendly’ cities. Crit. Soc. Policy 2012, 32, 597–617. [Google Scholar] [CrossRef] [Green Version]
- KOSIS (KOrean Statistical Information Service). Available online: http://kosis.kr/statHtml/statHtml.do?orgId=101&tblId=DT_1YL20631&vw_cd=MT_GTITLE01&list_id=101&seqNo=&lang_mode=ko&language=kor&obj_var_id=&itm_id=&conn_path=MT_GTITLE01 (accessed on 27 December 2019).
- Lawton, M.P.; Nahemow, L. Ecology and the aging process. In The Psychology of Adult Development and Aging; American Psychological Association: Washington, DC, USA, 1973; pp. 619–674. [Google Scholar]
- Lawton, M.P. Environment and Aging; Center for the Study of Aging: Albany, NY, USA, 1986; ISBN 0937829005. [Google Scholar]
- Glass, T.A.; Balfour, J.L. Neighborhoods, aging, and functional limitations. Neighborhoods Health 2003, 1, 303–334. [Google Scholar]
- König, K.; Raue, M.; D’Ambrosio, L.A.; Coughlin, J.F. Physical and emotional support of the neighborhood for older adults: A comparison of the United States and Germany. J. Environ. Psychol. 2019, 62, 84–94. [Google Scholar] [CrossRef]
- Danermark, B.; Ekstrom, M. Relocation and Health Effects on the Elderly-A Commented Research Review. J. Soc. Soc. Welf. 1990, 17, 25. [Google Scholar]
- Castle, N.G. Relocation of the elderly. Med. Care Res. Rev. 2001, 58, 291–333. [Google Scholar] [CrossRef]
- Rowles, G.D.; Bernard, M.A. Environmental Gerontology: Making Meaningful Places in Old Age; Springer Publishing Company: New York, NY, USA, 2013; ISBN 0826108148. [Google Scholar]
- Kendig, H. Directions in environmental gerontology: A multidisciplinary field. Gerontologist 2003, 43, 611–614. [Google Scholar] [CrossRef] [PubMed]
- Havighurst, R.J. Developmental Tasks and Education; University of Chicago Press: Chicago, IL, USA, 1948. [Google Scholar]
- Schroots, J.J.F. Theoretical Developments in the Psychology of Aging. Gerontologist 1996, 36, 742–748. [Google Scholar] [CrossRef] [PubMed]
- WHO. What is Healthy Ageing. Available online: https://www.who.int/ageing/healthy-ageing/en/ (accessed on 13 January 2020).
- World Health Organization. Active Aging. In A Policy Fram; WHO: Copenhagen, Denmark, 2002. [Google Scholar]
- Verma, I.; Huttunen, H. Elderly-Friendly Neighborhoods: Case Lauttasaari. J. House Elder. 2015, 29, 92–110. [Google Scholar] [CrossRef]
- Oswald, F.; Jopp, D.; Rott, C.; Wahl, H.-W. Is aging in place a resource for or risk to life satisfaction? Gerontologist 2010, 51, 238–250. [Google Scholar] [CrossRef] [Green Version]
- Rioux, L.; Werner, C. Residential satisfaction among aging people living in place. J. Environ. Psychol. 2011, 31, 158–169. [Google Scholar] [CrossRef]
- Lawton, M.P. Three functions of the residential environment. J. House Elder. 1989, 5, 35–50. [Google Scholar] [CrossRef]
- Kahana, E.; Lovegreen, L.; Kahana, B.; Kahana, M. Person, environment, and person-environment fit as influences on residential satisfaction of elders. Environ. Behav. 2003, 35, 434–453. [Google Scholar] [CrossRef]
- Golant, S.M. The effects of residential and activity behaviors on old people’s environmental experiences. In Elderly People and the Environment; Springer: Boston, MA, USA, 1984; pp. 239–278. [Google Scholar]
- Carp, F.M.; Carp, A. The ideal residential area. Res. Aging 1982, 4, 411–439. [Google Scholar] [CrossRef]
- Michael, Y.; Beard, T.; Choi, D.; Farquhar, S.; Carlson, N. Measuring the influence of built neighborhood environments on walking in older adults. J. Aging Phys. Act. 2006, 14, 302–312. [Google Scholar] [CrossRef] [Green Version]
- Buys, L.; Miller, E. Residential satisfaction in inner urban higher-density Brisbane, Australia: Role of dwelling design, neighbourhood and neighbours. J. Environ. Plan. Manag. 2012, 55, 319–338. [Google Scholar] [CrossRef] [Green Version]
- Julien, D.; Richard, L.; Gauvin, L.; Kestens, Y. Neighborhood characteristics and depressive mood among older adults: An integrative review. Int. Psychogeriatr. 2012, 24, 1207–1225. [Google Scholar] [CrossRef] [PubMed] [Green Version]
- World Health Organization. Global Age-Friendly Cities: A Guide; World Health Organization: Geneva, Switzerland, 2007; ISBN 9241547308. [Google Scholar]
- South Korea 2019 Crime & Safety Report. Available online: https://www.osac.gov/Country/SouthKorea/Content/Detail/Report/6d2ced24-cc8e-4077-8b75-15f4aeb80d5f (accessed on 13 January 2020).
- Choi, Y.; Seo, M.J.; Oh, S.H. Walkability analysis of Busan’s urban residential zones. KSCE J. Civ. Eng. 2016, 20, 2535–2547. [Google Scholar] [CrossRef]
- Gallimore, J.M.; Brown, B.B.; Werner, C.M. Walking routes to school in new urban and suburban neighborhoods: An environmental walkability analysis of blocks and routes. J. Environ. Psychol. 2011, 31, 184–191. [Google Scholar] [CrossRef]
- Cho, M.; Hassink, R. Limits to Locking-out through Restructuring: The Textile Industry in Daegu, South Korea. Reg. Stud. 2009, 43, 1183–1198. [Google Scholar] [CrossRef]
- Daegu Metropolitan City. Available online: http://www.daegu.go.kr/english/index.do?menu_id=00000747 (accessed on 13 January 2020).
- KOSIS Population. Available online: http://kosis.kr/statHtml/statHtml.do?orgId=101&tblId=DT_1B040A3&checkFlag=N (accessed on 13 January 2020).
- KOSIS. Available online: http://www.index.go.kr/potal/main/EachDtlPageDetail.do?idx_cd=2728 (accessed on 13 January 2020).
- KOSIS. Available online: http://kosis.kr/statisticsList/statisticsListIndex.do?menuId=M_01_01&vwcd=MT_ZTITLE&parmTabId=M_01_01#SelectStatsBoxDiv (accessed on 17 January 2020).
- Open Data Portal. Available online: https://www.data.go.kr/ (accessed on 15 October 2019).
- Korea National Spatial Data Infrastructure Portal. Available online: http://openapi.nsdi.go.kr/nsdi/index.do (accessed on 15 October 2019).
- Ministry of the Interior and Safety. Available online: http://www.juso.go.kr/addrlink/addressBuildDevNew.do?menu=fclts (accessed on 15 October 2019).
- Buffel, T.; McGarry, P.; Phillipson, C.; De Donder, L.; Dury, S.; De Witte, N.; Smetcoren, A.S.; Verté, D. Developing Age-Friendly Cities: Case Studies From Brussels and Manchester and Implications for Policy and Practice. J. Aging Soc. Policy 2014, 26, 52–72. [Google Scholar] [CrossRef] [PubMed]
- 7-Eleven. Available online: http://www.7-eleven.co.kr/# (accessed on 13 October 2019).
- MINISTOP. Available online: https://www.ministop.co.jp/in/en/ (accessed on 13 October 2019).
- CVS for U, CU. Available online: http://cu.bgfretail.com/en/index.do (accessed on 13 October 2019).
- About GS25. GS25 Site. Available online: http://gs25.gsretail.com/gscvs/en/global/gscvs-main (accessed on 13 October 2019).
- National Traditional Market Standard Data. Available online: https://www.data.go.kr/dataset/15012894/standard.do (accessed on 13 October 2019).
- Status of Elderly Care Facilities. Available online: https://www.data.go.kr/dataset/15006977/fileData.do (accessed on 13 October 2019).
- Korea Transport DataBase. Available online: https://www.ktdb.go.kr/www/selectPbldataChargerWebList.do?key=12 (accessed on 13 October 2019).
- National Geographic Information Map. Available online: http://map.ngii.go.kr/ms/map/NlipMap.do (accessed on 13 October 2019).
- Earthexplorer. Available online: http://earthexplorer.usgs.gov/ (accessed on 13 October 2019).
- AirKorea. Available online: http://www.airkorea.or.kr/web/detailViewDown?pMENU_NO=125 (accessed on 13 October 2019).
- Han, C.; Kim, S.; Lim, Y.-H.; Bae, H.-J.; Hong, Y.-C. Spatial and Temporal Trends of Number of Deaths Attributable to Ambient PM2.5 in the Korea. J. Korean Med. Sci. 2018, 33, e193. [Google Scholar] [CrossRef]
- Betty, E.L.; Bollard, B.; Murphy, S.; Ogle, M.; Hendriks, H.; Orams, M.B.; Stockin, K.A. Using emerging hot spot analysis of stranding records to inform conservation management of a data-poor cetacean species. Biodivers. Conserv. 2020, 29, 643–665. [Google Scholar] [CrossRef]
- Aben, J.; Adriaensen, F.; Thijs, K.W.; Pellikka, P.; Siljander, M.; Lens, L.; Matthysen, E. Effects of matrix composition and configuration on forest bird movements in a fragmented A fromontane biodiversity hot spot. Anim. Conserv. 2012, 15, 658–668. [Google Scholar] [CrossRef]
- Isobe, A.; Uchida, K.; Tokai, T.; Iwasaki, S. East Asian seas: A hot spot of pelagic microplastics. Mar. Pollut. Bull. 2015, 101, 618–623. [Google Scholar] [CrossRef]
- Lepers, E.; Lambin, E.F.; Janetos, A.C.; DeFries, R.; Achard, F.; Ramankutty, N.; Scholes, R.J. A Synthesis of Information on Rapid Land-cover Change for the Period 1981–2000. Bioscience 2005, 55, 115–124. [Google Scholar] [CrossRef]
- Getis, A.; Ord, J.K. 1992: The analysis of spatial association by use of distance statistics. Geogr. Anal. 1992, 24, 189–206. [Google Scholar] [CrossRef]
- How Emerging Hot Spot Analysis Works—ArcGIS Help. ArcGIS Desktop. Available online: https://pro.arcgis.com/en/pro-app/tool-reference/space-time-pattern-mining/learnmoreemerging.htm (accessed on 27 December 2019).
- How Creating a Space Time Cube Works—ArcGIS Help. ArcGIS Desktop. Available online: https://pro.arcgis.com/en/pro-app/tool-reference/space-time-pattern-mining/learnmorecreatecube.htm (accessed on 27 December 2019).
- Jung-Gu, Daegu Metropolitan City. Available online: http://www.jung.daegu.kr/new/pages/happiness/page.html?mc=1784 (accessed on 17 January 2020).
- WHO. Available online: https://www.who.int/airpollution/publications/aqg2005/en/ (accessed on 27 December 2019).
- Kakaomap. Available online: https://map.kakao.com/ (accessed on 27 December 2019).
- Cho, M.; Kim, J. Coupling urban regeneration with age-friendliness: Neighborhood regeneration in Jangsu Village, Seoul. Cities 2016, 58, 107–114. [Google Scholar] [CrossRef]
- Corburn, J. City planning as preventive medicine. Prev. Med. 2015, 77, 48–51. [Google Scholar] [CrossRef] [PubMed]
Figure 1.
Study area.

Figure 2.
100 m × 100 m grid cells for measuring neighborhood environmental variables.


Figure 4.
Result of the emerging hotspot analysis of the elderly population ratio in Daegu.

Figure 5.
Regions getting old (urban-type and suburban-type) and regions getting young.


Table 1.
Measurement and data source of the environmental variables of age-friendly neighborhoods.
| Variable | Measurement | Source | ||
|---|---|---|---|---|
| Accessibility | Convenience facilities | Convenience store | Distance to the closest each destination (m) | Source [57,58,59,60] |
| Local market | Source [61] | |||
| Medical facilities | Hospital | Source [54] | ||
| Public health center | Source [55] | |||
| Welfare and administrative facilities | Senior citizen community center | Source [62] | ||
| Welfare center | Source [55] | |||
| Park facilities | Urban park | Source [54] | ||
| Transportation facilities | Subway station | Source [55] | ||
| Bus stop | Number of bus stops within a 400 m network buffer | Source [63] | ||
| Safety | Building conditions | Dilapidated buildings ratio | Percentage of old buildings (30+ years) within a 400 m network buffer (%) | Source [54] |
| Terrain conditions | Slope | Mean slope within a 400 m network buffer (°) | Source [64] | |
| Accident conditions | Areas where elderly pedestrians are prone to traffic accidents | Number of traffic accidents involving the elderly within a 400 m network buffer (number/ km2) | Source [61] | |
| Pleasurability | Hazardous facilities | Factories | Distance to the closest each destination (m) | Source [54] |
| Excreta and waste disposal facilities | ||||
| Green infrastructure | NDVI | Mean NDVI within a 400 m network buffer | Source [65] | |
| Air quality | PM10 | Mean PM10 within a 400 m network buffer (μg/m3) | Source [66] | |
| PM2.5 | Mean PM2.5 within a 400 m network buffer (μg/m3) | |||
Table 2.
Results of emerging hotspot analysis.
| Pattern Name | Hotspot | Coldspot | ||
|---|---|---|---|---|
| Frequency | Percentage (%) | Frequency | Percentage (%) | |
| New Spot | 13 | 9.4 | 0 | 0.0 |
| Consecutive Spot | 49 | 35.3 | 0 | 0.0 |
| Intensifying Spot | 1 | 0.7 | 0 | 0.0 |
| Persistent Spot | 1 | 0.7 | 0 | 0.0 |
| Diminishing Spot | 0 | 0.0 | 9 | 6.4 |
| Sporadic Spot | 8 | 5.8 | 0 | 0.0 |
| Oscillating Spot | 5 | 3.6 | 0 | 0.0 |
| Historical Spot | 0 | 0.0 | 0 | 0.0 |
| Sum | Frequency | Percentage (%) | ||
| 86 | 61.9 | |||
| Not Significant | 53 | 38.1 | ||
| Total Sum | 139 | 100 | ||
Table 3.
The ANOVA and post hoc test for the comparison of the environmental variables of age-friendly neighborhoods by regional groups.
Table 3.
The ANOVA and post hoc test for the comparison of the environmental variables of age-friendly neighborhoods by regional groups.
| Neighborhood Environmental Factors | Mean | SD | ANOVA | Post hoc Test | |||||||
|---|---|---|---|---|---|---|---|---|---|---|---|
| Regions GO | Regions GY (C) | Regions GO | Regions GY (C) | F | Sig. | Dunnett T3 | |||||
| Urban (H1) | Suburban (H2) | Urban (H1) | Suburban (H2) | ||||||||
| Accessibility | Convenience store | Distance to the closest each destination (m) | 317.61 | 2315.29 | 580.18 | 3.91 | 59.32 | 20.80 | 1748.51 | 0.00 | H1 < C < H2 *** |
| Local market | 643.02 | 5212.41 | 1709.69 | 7.14 | 111.40 | 34.01 | 2613.67 | 0.00 | H1 < C < H2 *** | ||
| Hospital | 1127.55 | 4543.41 | 1493.64 | 16.84 | 57.44 | 29.30 | 3321.34 | 0.00 | H1 < C < H2 *** | ||
| Public health center | 2049.68 | 6413.93 | 1883.85 | 17.00 | 100.54 | 28.81 | 2759.67 | 0.00 | C < H1 < H2 *** | ||
| Senior citizen community center | 307.24 | 474.75 | 372.60 | 3.53 | 13.45 | 6.95 | 154.49 | 0.00 | H1 < C < H2 *** | ||
| Welfare center | 943.60 | 6714.74 | 1010.00 | 7.62 | 133.72 | 15.36 | 3310.91 | 0.00 | H1 < C < H2 *** | ||
| Urban park | 444.37 | 1566.08 | 366.71 | 4.48 | 50.90 | 7.54 | 867.53 | 0.00 | C < H1 < H2 *** | ||
| Subway station | 994.32 | 7525.52 | 1129.24 | 10.52 | 131.32 | 26.23 | 4184.20 | 0.00 | H1 < C < H2 *** | ||
| Bus stop | Number of bus stops within a 400 m network buffer | 3.91 | 1.36 | 3.55 | 0.04 | 0.04 | 0.08 | 605.38 | 0.00 | H2 < C < H1 *** | |
| Safety | Dilapidated building ratio | Percentage of dilapidated buildings within a 400 m network buffer (%) | 52.22 | 42.56 | 15.61 | 0.25 | 0.58 | 0.55 | 2022.25 | 0.00 | C < H2 < H1 *** |
| Slope | Mean slope within a 400 m network buffer (°) | 1.92 | 5.27 | 2.88 | 0.04 | 0.13 | 0.09 | 478.96 | 0.00 | H1 < C < H2 *** | |
| Areas where elderly pedestrians are prone to traffic accidents | Number of traffic accidents involving the elderly within a 400 m network buffer (number/km2) | 9.86 | 0.12 | 1.23 | 9.21 | 0.61 | 1.83 | 1355.12 | 0.00 | H2 < C < H1 *** | |
| Pleasurability | Factories | Distance to the closest each destination (m) | 628.70 | 1038.73 | 782.57 | 7.37 | 28.25 | 13.67 | 213.46 | 0.00 | H1 < C < H2 *** |
| Excreta and waste disposal facilities | 2120.68 | 5885.69 | 1652.92 | 23.05 | 76.38 | 25.66 | 2701.03 | 0.00 | C < H1 < H2 *** | ||
| NDVI | Mean NDVI within a 400 m network buffer | 0.13 | 0.23 | 0.18 | 0.00 | 0.00 | 0.00 | 1619.59 | 0.00 | H1 < C < H2 *** | |
| PM10 | Average PM10 level within a 400 m network buffer (μg/m3) | 43.32 | 41.20 | 44.01 | 0.03 | 0.08 | 0.02 | 718.51 | 0.00 | H2 < H1 < C *** | |
| PM2.5 | Average PM2.5 level within a 400 m network buffer (μg/m3) | 23.97 | 22.66 | 23.46 | 0.01 | 0.04 | 0.02 | 1024.36 | 0.00 | H2 < C < H1 *** | |
*** p < 0.001; Regions GO refers to “regions getting old,” while regions GY refers to “regions getting young;” H1 refers to hotspots in urban-type, H2 refers hotspots in suburban-type, and C refers to coldspots.
Table 4.
Status analysis of neighborhood environment in regions getting old (urban-type).
| Dilapidated Buildings Ratio (%) | Areas Where Elderly Pedestrians Are Prone to Traffic Accidents (Number/km2) | NDVI | |||
|---|---|---|---|---|---|
| Daesin-dong | |||||
 |  |  | |||
| Daesin-dong | Daegu (mean) | Daesin-dong | Daegu (mean) | Daesin-dong | Daegu (mean) |
| 64.67 | 36.16 | 37.62 | 3.80 | 0.12 | 0.18 |
 |  |  | |||
| The resident population is declining steadily due to the local slum created by long-term unoccupied properties and dilapidated buildings. | An area with the highest rates of traffic accidents involving elderly pedestrians in the country. Silver Zones (elderly protection zone) are occupied by illegal shops or are located away from crosswalks and have no safety fences, causing frequent jaywalking. | Small-scale parks that can be easily accessed by residents are insufficient. Additionally, management of the facilities is improperly performed. | |||
| Namsan2-dong | |||||
 |  |  | |||
| Namsan2-dong | Daegu (mean) | Namsan2-dong | Daegu (mean) | Namsan2-dong | Daegu (mean) |
| 76.84 | 36.16 | 17.55 | 3.80 | 0.11 | 0.18 |
 |  |  | |||
| The residential environment is poor, with many old houses, since most of the areas are redevelopment or reconstruction sites. | The roads surrounding the target areas’ boundaries are major transportation hubs in Daegu, while the sidewalks of the inner roads of the target areas are extremely narrow. Additionally, the traffic on these roads is mainly due to cars, and there is rampant illegal parking, which causes a lack of space for the pedestrians. | The target area lacks a park and has inadequate resting spaces for the residents. | |||
Note: The pictures used in this table were sourced from KakaoMap [77].
Table 5.
Status analysis of neighborhood environment in regions getting old (suburban-type).
| Distance to Urban Park (m) | Dilapidated Buildings Ratio (%) | Slope (°) | |||
|---|---|---|---|---|---|
| Yuga-eup | |||||
 |  |  | |||
| Yuga-eup | Daegu (mean) | Yuga-eup | Daegu (mean) | Yuga-eup | Daegu (mean) |
| 786.88 | 628.49 | 25.91 | 36.16 | 3.16 | 3.38 |
 |  |  | |||
| Lack of accessibility to various neighborhood facilities, including park facilities that help with physical activity. | Although Daegu Technopolis Industrial Complex has large apartment complexes, residential environment disparity is widening within the region. The elderly residents populate farmland primarily, and most of the facilities in these regions are in poor condition. | Most of the terrain in the developed areas of the region is flat, but most of the undeveloped residential areas have steep slopes. | |||
| Dopyeong-dong | |||||
 |  |  | |||
| Dopyeong-dong | Daegu (mean) | Dopyeong-dong | Daegu (mean) | Dopyeong-dong | Daegu (mean) |
| 2876.15 | 628.49 | 48.90 | 36.16 | 7.01 | 3.38 |
 |  |  | |||
| While the site is located on a mountain that includes a historical monument park, the entrance is blocked, making it difficult to access, and it is left unattended. This mixed urban and rural area has inadequate regional infrastructure. | Although the residential area has many cultural assets that can be used in tour packages, the facilities in the area are generally underdeveloped, making it necessary to develop the surrounding amenities and facilities. | Steep slopes are present and many neglected pathways are at risk of collapsing. | |||
Note: The pictures used in this table were sourced from KakaoMap [77].
© 2020 by the authors. Licensee MDPI, Basel, Switzerland. This article is an open access article distributed under the terms and conditions of the Creative Commons Attribution (CC BY) license (http://creativecommons.org/licenses/by/4.0/).
Share and Cite
MDPI and ACS Style
Kim, E.J.; Kim, M.-Y.; Kim, H. Spatio-Temporal Trend of Aging Regions and Their Neighborhood Environment: Findings from Daegu Metropolitan City, Korea. Sustainability 2020, 12, 1218. https://0-doi-org.brum.beds.ac.uk/10.3390/su12031218
AMA Style
Kim EJ, Kim M-Y, Kim H. Spatio-Temporal Trend of Aging Regions and Their Neighborhood Environment: Findings from Daegu Metropolitan City, Korea. Sustainability. 2020; 12(3):1218. https://0-doi-org.brum.beds.ac.uk/10.3390/su12031218
Chicago/Turabian StyleKim, Eun Jung, Myung-Yeon Kim, and Hyunjung Kim. 2020. "Spatio-Temporal Trend of Aging Regions and Their Neighborhood Environment: Findings from Daegu Metropolitan City, Korea" Sustainability 12, no. 3: 1218. https://0-doi-org.brum.beds.ac.uk/10.3390/su12031218
Note that from the first issue of 2016, this journal uses article numbers instead of page numbers. See further details here.