A Regional Socio-Economic Life Cycle Assessment of a Bioeconomy Value Chain


1
Department of Bioenergy, Helmholtz-Centre for Environmental Research (UFZ), 04318 Leipzig, Germany
2
Department of Environmental Technology, Technische Universität (TU) Berlin, 10623 Berlin, Germany
*
Author to whom correspondence should be addressed.
Sustainability 2020, 12(3), 1259; https://0-doi-org.brum.beds.ac.uk/10.3390/su12031259
Submission received: 14 January 2020
/
Revised: 4 February 2020
/
Accepted: 7 February 2020
/
Published: 10 February 2020
(This article belongs to the Special Issue Life Cycle Management for Sustainable Regional Development)
Abstract
:A bioeconomy tackles sustainable development at both the global and regional levels, as it relies on the optimized use of renewable bio-based resources for the provisioning of food, materials, and energy to meet societal demands. The effects of the bioeconomy can be best observed at a regional level, as it supports regional development and affects the social dimension of sustainability. In order to assess the social impacts of wood-based production chains with regional differentiation, the social life cycle assessment framework “RESPONSA” was established in 2018. We present an initial study, in which this method is applied to an exemplary production chain in a case study of laminated veneer lumber produced in central Germany. The results show a relatively better social performance compared to the reference economic sector, reflecting a relatively low rate of female employees as a major social hotspot. Several social opportunities are identified, in terms of health and safety, equal opportunities, and adequate remuneration, for the organization taking part in the value chain. Finally, considering the UN’s Sustainable Development Goals (SDGs) as a global normative framework, a number of additional indicators for RESPONSA, as well as further developments and recommendations regarding its application in other regions and the upcoming social life cycle assessment (S-LCA) guidelines, are identified.
1. Introduction
At present, the bioeconomy (BE) is seen as one of the major pathways for achieving sustainable development, as it relies on the optimized use of renewable bio-based resources for the provisioning of food, materials, and energy to meet societal demands. However, the implementation of such a global transformation process faces not only challenges related to economic efficiency and technical and scientific innovation to cope with economic and environmental factors, but also the challenge of socio-economic transformation, in which societal aspects are at least as important as those previously mentioned [1,2,3]. In addition, with the three dimensions of sustainability—environmental, economic, and social—in the UN’s Sustainable Development Goals (SDGs), a global normative goal framework for sustainable development has been addressed for the first time [4]. As the BE concept has been included in diverse policy strategies at international, national, and regional levels, an appropriate implementation of BE should be carried out, considering the alignment of the different transformation processes to cope with the challenge to achieve the SDGs [5,6,7,8,9]. On the other hand, the effects of implementing BE can be best observed at a regional scale and, therefore, BE at its core should be aimed at supporting regional development by considering local conditions, thereby strengthening social benefits (e.g., for workers or local communities) [10,11,12]. The implementation of wood-based BE concepts provides one possibility for potentially enabling socio-economic and environmental efficiency within local conditions [13,14]. Wood represents one of the most important renewable resources for the BE in Germany, considering that it is not in competition with food resources, it is regionally available, and there is an already well-established wood-based industrial sector which can provide essential support in fostering regional economies and, therefore, local communities [15]. As the transition towards BE evokes implications not only in terms of economic and ecological aspects, but also in the social dimension, analytical tools for evaluating and monitoring social sustainability are required [16,17,18]. Tools based on life cycle thinking have proved to be an effective approach, particularly for the assessment of environmental impacts, and have become well-developed and often applied in recent years [19]. Life cycle sustainability assessment (LCSA) as a holistic approach combines all three sustainability dimensions (i.e., economic, ecological, and social). Several evaluation schemes dealing with trade-offs between the dimensions while ensuring validity and applicability have been developed [20]. The development of life cycle approaches for the evaluation and monitoring of social aspects considering regional sustainability management are still in progress [12]. In this context, the “RESPONSA” (Regional SPecific cONtextualised Social life cycle Assessment) framework was established in 2018, in order to assess social impacts with particular respect to regional perspectives in a wood-based BE [2,10,21]. The goal of this work is to present initial results of the application of the RESPONSA method to the evaluation of a wood-based BE network in central Germany, in order to identify hotspots and opportunities in the evaluated value chain in terms of its potential socio-economic impacts at a regional level. Moreover, we intend to provide recommendations on how to complement the RESPONSA model by establishing a linkage to the SDG framework in this work.
2. Methods
In line with the social life cycle assessment (S-LCA) Guidelines, the work was divided into the four phases of an S-LCA [19]: Definition of Goal and Scope, Inventory Analysis, Impact Assessment, and Interpretation.
2.1. Definition of Goal and Scope
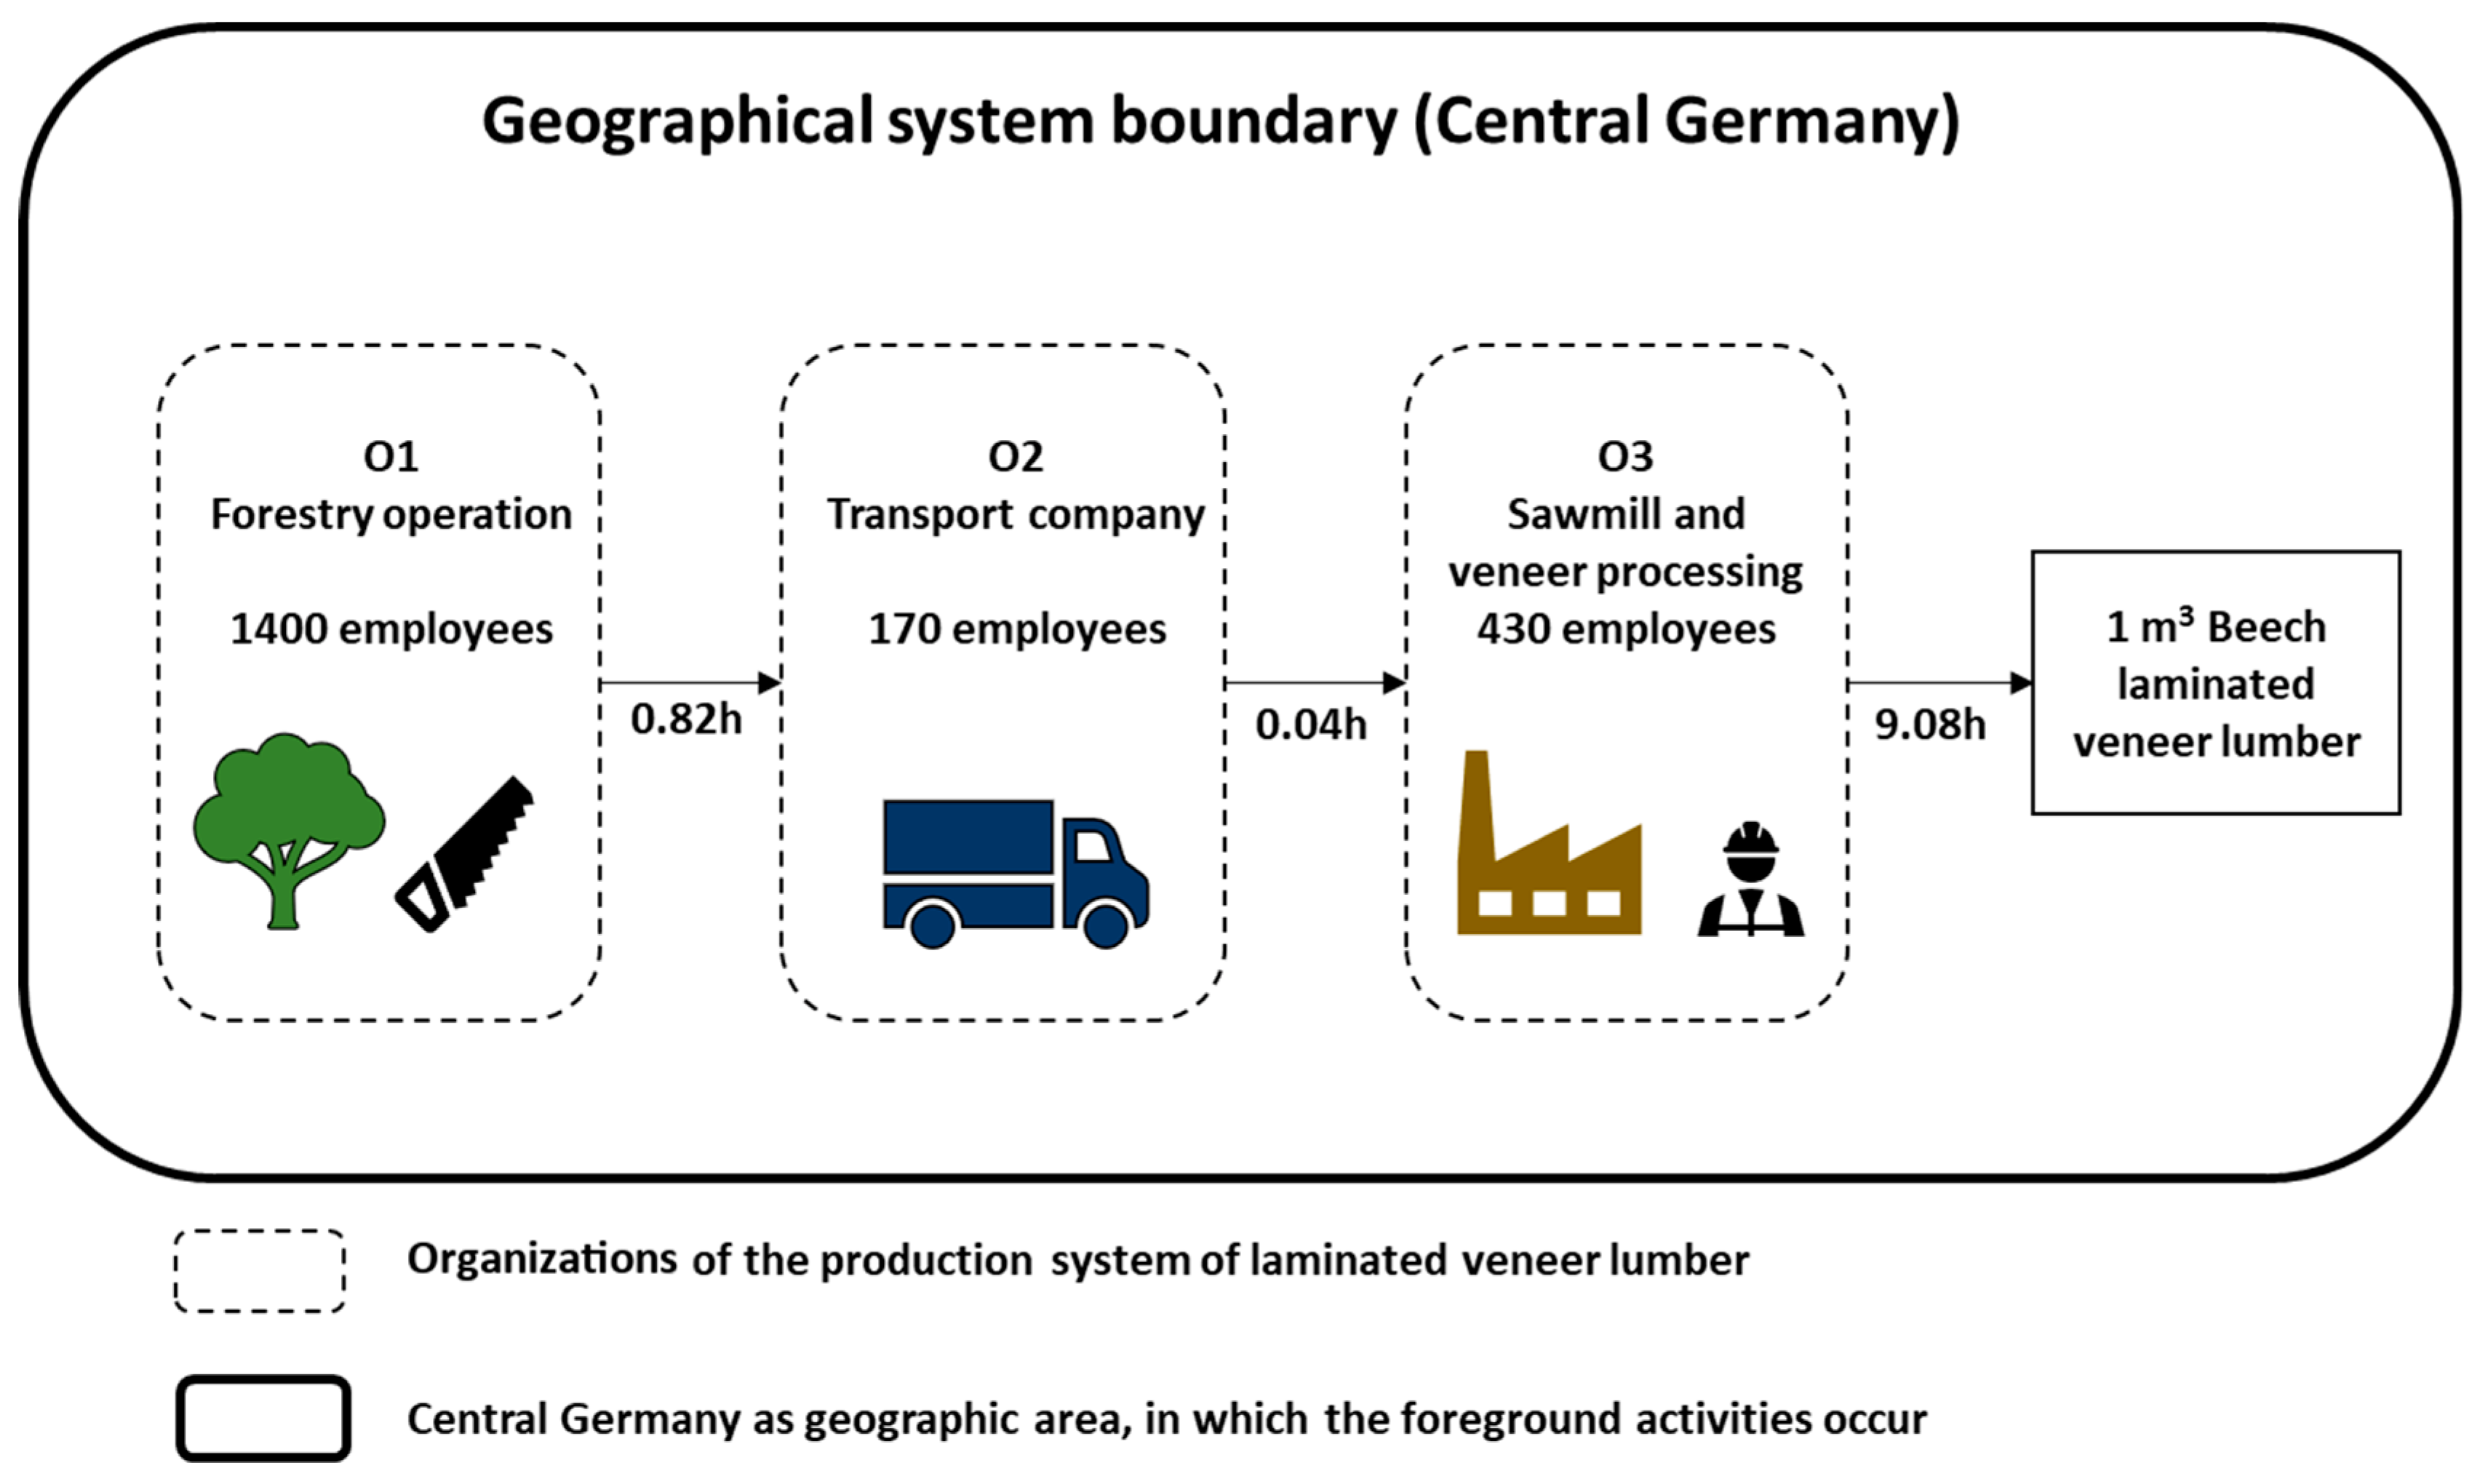
The product system analyzed in this work was the example of laminated veneer lumber (LVL) produced in Central Germany. LVL is made of 100% beech wood and serves as a supporting structure in timber construction, which can be processed further into beams, panels, and flooring. Our assessment was aimed at identifying social hotspots and social opportunities in organizations involved in the production of LVL (see Figure 1).
Social life cycle assessment (S-LCA) using RESPONSA was performed according to the method developed by Siebert et al. [2,10,21]. RESPONSA, as a context-specific social life cycle framework, estimates the social impacts of wood-based production chains in a regional BE—originally designed for central Germany—by identifying social hotspots and opportunities. Thereby, its focus is on the organizational level and foreground activities of the production chain. The assessment was based on a characterization approach by performance reference points (PRPs) [2,10,21].
2.2. Inventory Analysis
Prior to the application of the RESPONSA framework within a case study, the RESPONSA indicators outlined in [2] were related to the SDGs, in order to identify and analyze the gaps and needs within both frameworks. Initially, SDG 1 (no poverty), 2 (zero hunger), 3 (good health), 4 (quality education), 5 (gender equality), 8 (work and growth), 10 (reduced inequalities), and 16 (peace, justice, institutions) were selected, in order to cover most social aspects. For this comparison, we related the RESPONSA indicator set with the results provided by Zeug et al. [1], as they examined the SDGs underlying targets, with concern to their relevance in a German bioeconomy monitoring system. In the latter work, identified targets were evaluated by national stakeholders from the sciences, businesses, and society in terms of their relevance to a national bioeconomy monitoring system. As a result, they were categorized as “must”, “may”, or “little or no relevance”, for consideration in the monitoring of a German BE.
Comparison of the rated SDG targets by stakeholders showed very few parallels to the indicator set of RESPONSA. Only two of the targets ranked as “must” and seven as “may” relevant for German BE monitoring, as classified by Zeug et al. [1], were covered by RESPONSA, whereby 36 were proposed for inclusion in the monitoring of social sustainability (16 “must” and 20 “may”; see Appendix A). The reasons for this are presented in the discussions. Moreover, through this analysis, it was decided to include the indicator “Rate of female employees” as part of the indicator set of RESPONSA. This indicator was intended to complement the index “Equal opportunities” (see Appendix B). Most of the inventory data for O1 could be extracted from the survey, but the value for the indicator “Rate of foreign employees” was derived from the literature (Statistik der Bundesagentur für Arbeit 2018a). For the indicator “Rate of employees participated in training”, no data was available (see Appendix C).
In the Inventory Analysis phase, a questionnaire associated with the indicators established in the former step was sent to the three exemplary organizations found along the production system (see Supplementary Material). Primary data from the questionnaires of Organizations 2 (O2) and 3 (O3) was not available due to privacy constraints, for which the following steps only refer to Organization 1 (O1), which is related to the forestry sector in Central Germany. O3 was considered exemplary, with the largest contribution to the final product (see Figure 1), in order to apply the method on the example of a whole value chain showing all methodic steps. For the model of the LVL production system, Mercer Holz GmbH was considered as an exemplary transport organization (O2) and Pollmeier Massivholz GmbH & Co., which produces laminated veneer lumber made of 100% beech wood in central Germany, as an exemplary sawmill and veneer processing organization (O3). The information for the goal and scope were derived from public information on the websites of both organizations, in order to calculate the activity variable “working time hours”. For reasons of simplicity, the functional unit was determined at 1 m3, as the yearly production capacity of Pollmeier is reported in cubic meters (see Table 1. The characterization approach using performance reference points (PRP) differed in quantitative and qualitative indicators (see [2] for detailed information on their calculation). It is a comparison of site-specific indicator values from the organization to be evaluated using national and regional reference data. Thereby, the socio-economic backdrop of the organization was considered and classified by geographical location, economic sector, and organizational size. For most of the indicators, the impact assessment was based on test reference data of the IAB (Institute for Employment and Research) [22]. For nine indicator values, reference data from IAB were not available. Those were compared with reference data from a literature review (see Appendix C).
2.3. Functional Unit
The functional unit, to which the inputs and outputs of the activity variable (working time hours) were related, was defined as 1 m3 beech laminated veneer lumber. For calculation of the activity variable “working hours per m3 manufactured beech LVL”, some assumptions had to be made due to missing information. First, the annual working hours for each organization were calculated. Therefore, an average annual working time of 1647 h were assumed per full-time employee [26]. All employees were considered to be a full-time employee. In the next step, the working hours per produced beech LVL could be calculated, using
In the case of the forestry organization, “production capacity” refers to the logging of beech wood; for the transport company, it refers to the transport of timber; for the manufacturing organization, the production of LVL was used. The same effort of working hours for transport by truck, rail, and ship was assumed. Additionally, the number of employees and the volume transported by Mercer Holz GmbH (used as an exemplary transport company) refers to both sites in central Germany. For Pollmeier (used exemplary for O3), the “production capacity” of beech LVL at the site in Creuzburg had to be calculated before using
O1 harvested the beech wood and, therefore, was associated with the forestry sector, contributing 0.82 working hours to the total of 9.94 working hours required for the cradle-to-gate production of 1 m3 LVL. The logs were transported to the production site by the transport company, requiring 0.04 working hours and were processed further to LVL by O2, whose contribution to the final product accounted for 9.08 working hours (see Table 2). The geographical system boundary was constituted by central Germany.
3. Results
3.1. Impact Assessment
Context-specific PRPs determine whether indicator values represent a relatively better or relatively worse social performance. A total of 10 indicator scores were calculated, according to the quantitative approach using reference data in the form of a statistical distribution provided by test data from the IAB [22]. Six indicator scores were calculated using a mean value from a literature review as reference (see Appendix C). For 11 indicators, the characterization approach for qualitative indicators was applied; for three of these, the organizational size was also considered. It is not possible to indicate a final social performance score for LVL, but final index scores weighted relative to the contribution of each organization to the LVL could be calculated for seven different indices (see Table 3).
3.2. Interpretation
For O1, all indices and nearly all associated indicators were rated with scores above average, indicating a relatively better social performance in all observed issues in relation to other forestry organizations in central Germany. The index “Knowledge capital” showed the lowest index score (5.4), with an average performance; whereas the best score O1 achieved was in the index “Participation” (9.1). Only the indicator “Rate of female employees” (2.0) revealed a social hotspot (see Appendix C). A closer look into the questionnaire suggests that not only the overall quota of female employees was low, but also only one-fifth of civil servants were female and only marginal employees were female. A closer look at the indicator scores also allows us to differentiate within the indicators aggregated into one index score. Using the example of the index “Equal opportunities”, O1 achieved a score of 9.0 for the indicator “Female employees in management positions”, reaching almost the best possible score. In contrast, the “Rate of female employees”, only 18.28% (see Appendix C), was scored by 2.0 in the same organization, indicating a relatively poor social performance compared to the average. Considering O1 separate from the contribution to the LVL in question, the overall social performance was remarkable, as 12 of the 27 indicators could be rated with PRPs of 9 or more, where six of those achieved the highest possible score of 10. In particular, the average remuneration for full-time employees was much higher than those of reference organizations in Germany. As O3 scores could not be calculated, no weighted product scores for LVL were possible to derive, accordingly. However, it can be seen that the contribution of O1 to the final product accounted only for 8.3% of the total working hours required, whereas O3 contributed 9.08 hours and, thus, 91.7% of the total working hours to produce 1 m3 LVL.
4. Discussion and Conclusions
There are a number of gaps in the indicator set applied in the assessment using RESPONSA, in comparison with relevant SDG targets for the monitoring of a German BE. This is mainly due to different objectives in the framework of RESPONSA and stakeholder perceptions of BE monitoring. RESPONSA pursues the assessment of wood-based production chains, originally designed for central Germany. Thereby, its focus is on the organizational level and regional foreground activities of a production chain, neglecting SDG targets with a global focus. Conversely, the SDG targets evaluated by stakeholders addressing the German BE included all affected economic sectors and regions, thereby considering international policy-related targets as very important. For example, the goal to ensure the representation and participation of developing countries in decision-making processes in global, international economic and financial institutions (SDG 10.6)—categorized as “must be part of a monitoring”—is geared towards measures which should emanate from the state (in terms of policy strategies), not to the organization itself. Furthermore, fostering sustainable systems in food production, in terms of applying resilient agricultural methods (SDG 2.4), has high importance in monitoring a BE, but does not relate to the production chain of a wood-based product in central Germany. Thus, there are targets which are related to the behavior of organizations in general (e.g., SDG 2.4, 2.5 “Preserve genetic diversity of seeds/plants/animals”, or 4.1 “Equal access/free education from elementary schools on”), but not to those considered in our example. Many of the indicators of RESPONSA are related to the same SDG targets (e.g., target 8.5 “Productive full employment, decent work, pay equity”).
With the applied indicator set of RESPONSA, statements on social aspects—such as health and safety, working conditions (in terms of adequate remuneration and employment as well as knowledge capital), and worker’s participation in the product, LVL—and the organizations involved could be derived. They indicate the relatively good social performance of the value chain of LVL considering O1. For further validation, the primary data of O2 and O3 should be used in order to derive statements for all life cycle stages of the LVL. The calculation of impact scores by means of PRPs was carried out in different ways, due to quantitative or qualitative indicators and available data resources. Thereby, the most exact approach is through the assessment of reference test data of IAB, which is available in percentiles for the quantitative indicators. If such processed data were not available, the available reference data for quantitative indicators (e.g., occupational accidents) was only an average value from literature research. This approach does not ensure reliable statements. Minimum and maximum values are needed for a differentiated assessment, at least. In our study, the gap of reference data was a limiting factor for social sustainability assessment [21]. All measured indicators of RESPONSA are aimed at a maximum or minimum as target value (Appendix D). For two of those (“Rate of part-time employees” and “Rate of marginally employees”), the minimum as an objective was questionable. Taking the example of offering part-time work, instead of full-time (targeted at minimum), it enables the reconciliation of working life and family life (especially for women) without giving up the profession temporarily or even completely. Furthermore, for employees without children, it is currently more attractive to work part-time for a better work–life balance [27,28]. For employers, advantages can result from increased productivity per hour and a reduction of lost working hours and less occupational accidents. According to Siebert et al. [2], eight indicators of RESPONSA should be measured not only at a sectoral level, but also on an organizational level. Due to data availability in the example of LVL, only three indicators were assessed with respect to the organizational level (see Appendix D). Comparison at an organizational level is questionable, as the reference becomes more and more close to the organization under consideration, resulting in a comparison of almost the same thing, with scores around the average of 5. Observing regional production systems, this amounts to examining trade-offs in life cycle assessments, neglecting all background processes outside the regional system boundaries. RESPONSA, as developed from the product’s perspective, does not really evaluate the social performance of a wood-based product in a German BE context: with its indicator set instead addressing the social performance of organizations found along the production system, with regard to employee health care, adequate remuneration, and employment, it is more of a social organizational LCA (SOLCA) [29].
5. Outlook
RESPONSA proved to be a good tool for the goal and scope it was developed for; mainly addressing the workers as a stakeholder group and regional BE foreground processes. Prospectively, further indicators supplementing the indicator set could be included. These could be related to community relationships, in order to address the local community influenced by the behavior of organizations within the assessment. Additionally, positive and negative effects on other stakeholder groups, as recommended by the S-LCA guidelines, could be included, as RESPONSA was initially developed for the assessment of a wood-based product manufactured in the region of central Germany. The indicator set for the assessment showed little specificity, as the relevance of indicators such as “adequate working time”, “average remuneration level”, or “rate of vocational trainees” is supra-regional and of importance at a cross-sectoral level. If other regional benchmarks and reference data for such characterization are available, the S-LCA based on RESPONSA can easily be extended to other economic sectors or regional system boundaries, as the indicator set is generic; at least, for Germany or Europe. Considering emerging or developing countries, a closer look at the indicator set is needed for potential adjustments; for example, developing countries have differing working conditions and indicators such as child labor are very important.
In summary, the initial results presented in this work suggest that RESPONSA can be used as an interesting tool for assessing the regional effects of bioeconomy-related value chains. Thus, it is necessary to carry out further case studies similar to this work, in order to further develop the RESPONSA model, especially considering its alignment to the revised S-LCA guidelines (which are expected to be released in the short-term). With this foreseen validation, one can expect that the RESPONSA model can become part of a toolbox for supporting the life cycle management of bio-based resources at a regional scale.
Supplementary Materials
The following are available online at https://0-www-mdpi-com.brum.beds.ac.uk/2071-1050/12/3/1259/s1, Questionnaire sent to the organizations.
Author Contributions
L.J., supported by W.Z., conducted the research, data curation and general analysis, as well as the writing of this research article. W.Z. did the conceptualization, management, and submission a review process of this research article. The manuscript has been edited by A.B., D.T., and M.F., and reviewed by all authors. All authors have read and agreed to the published version of the manuscript.
Funding
This research received no external funding.
Conflicts of Interest
The authors declare no conflict of interest.
Appendix A. SDG Sub-Goals Related to RESPONSA Indicators
| SDG Code | SDG Sub-Goal | Part of Monitoring | RESPONSA | RESPONSA Indicator |
| 1.1 | Eliminate extreme poverty, pay equity | must | no | |
| 1.2 | Poverty reduction, pay equity | must | yes | Payment according to basic wage, average remuneration level, rate of marginal employees (max. 450 €), rate of fixed-term employees, rate of employees provided by temporary work agencies |
| 1.4 | Enable economic participation for all people | must | no | |
| 1.5 | Increase resistance of population against extreme climate events | may | no | |
| 1.a | Financial support/development aid, eradication of poverty | may | no | |
| 2.1 | Food access, food security | must | no | |
| 2.2 | End malnutrition, food security | must | no | |
| 2.3 | Increase agricultural productivity, income (small producers) | may | no | |
| 2.4 | Sustainable systems in food production (resilience) | must | no | |
| 2.5 | Preserve genetic diversity of seeds/plants/animals | must | no | |
| 2.a | Investment in rural infrastructure, agricultural research and consulting | must | no | |
| 2.b | Trade restrictions, prevent distortions, stop agricultural export subsidies | may | no | |
| 2.c | Stability food market, fluctuations of food prices, reserves | must | no | |
| 3.9 | Reduce pollution of air/water/soil, health protection | must | no | |
| 4.1 | Equal access/free education from elementary schools on (girls/boys) | may | no | |
| 4.2 | Equal access/free education from preschool/kindergarten on (girls/boys) | may | no | |
| 4.3 | Promote gender equality | may | yes | Rate of employees participated in trainings, support for professional qualification, rate of vocational trainees |
| 4.5 | Gender disparities (parity indices) | may | yes | rate of disabled employees, rate of foreign employees |
| 4.7 | Education for sustainable development | must | yes | Rate of employees participated in trainings |
| 4.b | Increase number of scholarships | may | no | |
| 5.1 | Eliminate discrimination against women | may | yes | Measures to improve gender equality, rate of female employees |
| 5.a | Financial equality, legal framework for women (e.g., pension, real estate) | may | no | Measures to improve gender equality, rate of female employees |
| 8.2 | Economic productivity increase through diversification | may | no | |
| 8.3 | Promoting decent work, innovation, creativity, SMEs | must | no | |
| 8.4 | Resource efficiency in consumption/production | may | no | |
| 8.6 | Increase share of youth employment, education and vocational training | may | no | Rate of vocational trainees |
| 8.7 | Worker rights, abolition of forced labor/trafficking/child labor | may | no | |
| 8.10 | Promote national financial institutions for financial infrastructure | must | no | |
| 8.a | Support developing countries/technical assistance | may | no | |
| 10.1 | Income growth | may | yes | Payment according to basic wage, average remuneration level, rate of marginal employees (max. 450 €) |
| 10.5 | Regulation/supervision of global financial markets | may | no | |
| 10.6 | Improvement of representation/participation of developing countries | must | no | |
| 10.a | Justice, treatment of developing countries | may | no | |
| 10.b | Efficient and effective development assistance/financial flows/direct investment | must | no | |
| 16.5 | Reduction of bribery/corruption | must | no | |
| 16.7 | Democratic decision-making | may | yes | Works council |
Appendix B. RESPONSA Indicators Related to SDG Sub-Targets and Stakeholder Relevance
| Index | Sub-Index | Responsa Indicator | SDG Sub-Goal | Stakeholder Relevance for Monitoring (1) |
| Health and safety | Accidents | Occupational accidents | 8.8 | no relevance |
| Occupational fatal accidents | 8.8 | no relevance | ||
| Sick-leave | Sick-leave days | 8.8 | no relevance | |
| Preventive health measures | 8.8 | no relevance | ||
| Adequate remuneration | Payment | Payment according to basic wage | 1.2, 10.1, 8.5 | must, may, no relevance |
| Average remuneration level | 1.2, 10.1, 8.5 | must, may, no relevance | ||
| Financial participation | Capital participation | 8.5 | no relevance | |
| Profit-sharing and bonuses | 8.5 | no relevance | ||
| Adequate working time | Working time | Contractual working hours | 8.5 | no relevance |
| Compensation for overtime | 8.5 | no relevance | ||
| Work–life balance | Access to flexible working time agreements | 8.5, 3.4 | no relevance | |
| Rate of part-time employees | 8.5, 3.4 | no relevance | ||
| Employment | Job conditions | Rate of qualified employees | 4.4 | no relevance |
| Rate of marginal employees (max. 450 €) | 1.2, 10.1, 8.5 | must, may, no relevance | ||
| Duration of employment | Rate of fixed-term employees | 1.2, 8.5 | must, no relevance | |
| Rate of employees provided by temporary work agencies | 1.2, 8.5 | must, no relevance | ||
| Knowledge capital | On-the-job-training | Rate of employees participated in training | 4.7, 4.3, 4.4, | must, may, no relevance |
| Support for professional qualification | 4.3, 4.4 | may, no relevance | ||
| Vocational training | Rate of vocational trainees | 4.3, 8.6, 4.4 | may, may, no relevance | |
| Research and development | Rate of employees in research and development | 9.5 | may | |
| Equal opportunities | Gender equality | Female employees in management positions | 5.5 | no relevance |
| Rate of female employees | 5.1, 5.a, 8.5 | may, may, no relevance | ||
| Measures to improve gender equality | 5.1, 5.a, 5.4 | may, may, no relevance | ||
| Integrate older employees | Measures to support older employees | 10.2, 10.3 | no relevance | |
| Integrate minorities | Rate of disabled employees | 4.5, 8.5, 10.2, 10.3 | may, no relevance | |
| Rate of foreign employees | 4.5, 8.5, 10.7 | may, no relevance | ||
| Participation | Worker participation | Works council | 16.7 | may |
| Indices, sub-indices, and Responsa indicators adapted from [2]; (1) stakeholder relevance for each SDG sub-target according to [1]. | ||||
Appendix C. Data, PRP, and Calculated Scores for O1
| RESPONSA Indicator | Data O1 | PRP O1 | Scores O1 |
| 1. Health and Safety | 8.2 a | ||
| Occupational accidents | 51.12 | 67 b | 7.4 |
| Occupational fatal accidents | 0.00 | 0.011 b | 10 |
| Sick-leave days | 2.67 | 14.1 b | 10 |
| Preventive health measures | yes | 94% yes, 6% no (biggest organizational size) b | 5.6 * |
| Sick-leave analysis | yes | 50% yes, 50% no | 7.5 |
| Employee survey regarding safety measures taken at the workplace | no | 50% yes, 50% no | 2.5 |
| Discussion groups on health and safety issues in the organization | no | 100% no | 5 |
| Internal activities | yes | 50% yes, 50% no | 7.5 |
| Training or consultation offers for employees | yes | 100% no | 10 |
| Financial support for external health activities | no | 100% no | 5 |
| Network for organizational health management | no | 25% yes, 75% no | 3.75 |
| Other | no data | 10% yes, 80% no | |
| 2. Adequate remuneration | 7.2 a | ||
| Payment according to basic wage | sectoral collective agreement | 22% yes, 78% no | 8.9 |
| Average remuneration level | 4105 € | 1016.34 | 10 |
| Capital participation | no | 100% no | 5.0 |
| Profit-sharing and bonuses | no | 100% no | 5.0 |
| 3. Adequate working time | 8.4 a | ||
| Contractual working hours | 40.0 | 40.85 | 6.6 |
| Compensation for overtime | financial and free time compensation | financial compensation and free time b | 9.3 |
| Access to flexible working time agreements | yes | 14% yes, 86% no | 9.7 |
| Rate of part-time employees | 4.34% | 42.70% | 9.5 |
| 4. Employment | 8.4 a | ||
| Rate of qualified employees | 5.4 | ||
| Rate of employees with vocational training | 52% | 37.63% | 6,8 |
| Rate of employees with an academic degree | 44% | 0.00% | 7,0 |
| Rate of employees in the board | 0% | 15.48% | 2,3 |
| Rate of marginal employees (max. 450 €) | 0.23% | 14.29% | 9.7 |
| Rate of fixed-term employees | 1.55% | 1.62% | 10 |
| Rate of employees provided by temporary work agencies | 0% | no data | >5 |
| 5. Knowledge capital | 5.4 a | ||
| Rate of employees participated in training | no data | 33.44% | |
| Support for professional qualification | no | 39% yes, 61% no | 3.1 |
| Rate of vocational trainees | 3.25% | 0.00% | 7.7 |
| Rate of employees in research and development | 0.77% | no data | |
| 6. Equal opportunities | 7.5 a | ||
| Female employees in management positions | yes | 21% yes, 79% no (biggest organizational size) b | 9.0 * |
| 19.00% | |||
| Rate of female employees | 18.28% | 39.50% | 2.0 |
| Measures to improve gender equality | yes | 86% yes, 14% no (biggest organizational size) b | 5.7 * |
| Childcare support | no | 100% yes | 0 |
| Support for employees with relatives in need of care | no | 100% no | 5 |
| Special consideration on employees with care responsibilities regarding the work organization | yes | 40% yes, 60% no | 8 |
| Offers for employees in parental leave | yes | 100% yes | 5 |
| Special support for women | no data | no data | |
| Member of a network of family friendly organizations | no | 100% no | 5 |
| Other measures | no data | no data | |
| Measures to support older employees | yes | ||
| Partial retirement | yes | no data | |
| Special equipment in the workplaces for older employees | no | no data | |
| Individual adaptation of the job requirements | no data | no data | |
| Working groups mixed in ages | no data | no data | |
| Integration of older employees into training | yes | no data | |
| Specific training for older employees | no | no data | |
| Integration of older employees into preventive health measures | no | no data | |
| Rate of disabled employees | 5.81% | 2.8% b | 10 |
| Rate of foreign employees | 22.2% | 10.8% b | 10 |
| 7. Participation | 9.1 a | ||
| Works council | yes | 18% yes, 82% no | 9.1 |
| * Indicator score calculation on ES and OS level: (OS score for Preventive health measures: 5.3, OS score for Female employees in management positions: 8.95 for Q1, 3.95 for Pollmeier, OS score for Measures to support older employees: 5.7); a Index score calculation: ; b Other sources than IAB Estabishment Panel [30,31,32,33,34,35]. | |||
The IAB Establishment panel is a yearly survey of 16,000 organizations in Germany conducted by the Institute for Employment Research (IAB). In an earlier project within the BioEconomy Cluster, test data of the IAB were processed using STATA by UFZ, aggregated from 2011, 2012, 2013, and 2014.
Appendix D. Set of Indicators with Type of Indicator, Objective, and PRP Level
| Indicators | Unit | Measure | Type | Objective | PRP Level |
| Occupational accidents | Nr | Number of accidents per year per 1000 employees | quant. | Min | ES |
| Occupational fatal accidents | Nr | Number of fatal accidents per year per 1000 employees | quant. | Min | ES |
| Sick-leave days | Nr | Sick-leave days per year per employee | quant. | Min | ES |
| Preventive health measures | y/n | Health measures (e.g., sick-leave analysis, health activities) | qual. | Yes | OS |
| Payment according to basic wage | y/n | Payment according to collective agreement | qual. | Yes | ES |
| Average remuneration level | € | Average payment per month per full-time employee per total employees | quant. | Max | ES |
| Capital participation | y/n | Possibility of capital participation | qual. | Yes | ES |
| Profit-sharing and bonuses | y/n | Possibility of profit-sharing and bonuses | qual. | Yes | ES |
| Contractual working hours | H | Average contractual working hours per week per full-time employee | quant. | Min | ES |
| Compensation for overtime | y/n | Compensation measures | qual. | Yes | ES |
| Access to flexible working time agreements | y/n | Availability of flexible working agreements | qual. | Yes | ES |
| Rate of part-time employees | % | Percentage of part-time employees per total employees | quant. | Min | ES |
| Rate of qualified employees | % | Percentage of employees with professional training per total employees | quant. | Max | ES |
| Rate of marginal employees (max. 450 €) | % | Percentage of employees earning max. 450 € per month per total employees | quant. | Min | ES |
| Rate of fixed-term employees | % | Percentage of fixed-term employees per total employees | quant. | Min | ES |
| Rate of employees provided by temporary work agencies | % | Percentage of employees provided by temporary work agencies per total employees | quant. | Min | ES |
| Rate of employees participated in training | % | Percentage of employees participated in training per total employee | quant. | Max | ES |
| Support for professional qualification | y/n | Assumption of cost or exemption for training programs | qual. | Yes | ES |
| Rate of vocational trainees | % | Percentage of trainees per total employees | quant. | Max | ES |
| Rate of employees in research and development | % | Percentage of employees working permanently or temporally in the R&D section per total employee | quant. | Max | ES |
| Female employees in management positions | % | Percentage of female employees in management positions (1st and 2nd level) in relation to all employees in management positions | quant. | Max | OS |
| Rate of female employees | % | Percentage of female employees per total employees | quant. | Max | ES |
| Measures to improve gender equality | y/n | Measures for family support (e.g., support for child care, support for female employees) | qual. | Yes | OS |
| Measures to support older employees | y/n | Measures for older employees (e.g., offer of part-time contracts, special equipment of the workplace) | qual. | Yes | ES |
| Rate of disabled employees | % | Percentage of disabled employees per total employees | quant. | 5% | ES |
| Rate of foreign employees | % | Percentage of foreign employees per total employees | quant. | Max | ES |
| Works council | y/n | Existence of works councils in the organization | qual. | Yes | ES |
| Units: Nr = Number; % Percent; y/n = yes/no; h = hours. Type: quant. = quantitative; qual. = qualitative. PRP level: ES = Economic sector; OS = Economic sector and organizational size. (Adapted from [21]). | |||||
References
- Zeug, W.; Bezama, A.; Moesenfechtel, U.; Jähkel, A.; Thrän, D. Stakeholders’ Interests and Perceptions of Bioeconomy Monitoring Using a Sustainable Development Goal Framework. Sustainability 2019, 11, 1511. [Google Scholar] [CrossRef] [Green Version]
- Siebert, A.; O’Keeffe, S.; Bezama, A.; Zeug, W.; Thrän, D. How not to compare apples and oranges: Generate context-specific performance reference points for a social life cycle assessment model. J. Clean. Prod. 2018, 198, 587–600. [Google Scholar] [CrossRef]
- BMBF, Forschung Für Eine Biobasierte Wirtschaft—Erfolge Und Herausforderungen Für Die Bioökonomie in Deutschland (Research For a Bio-Based Economy—Successes and Challenges for the Bio-Economy in Germany). Available online: https://www.fona.de/medien/pdf/Forschung_fuer_eine_biobasierte_Wirtschaft.pdf (accessed on 1 November 2019).
- UN. Transforming Our World: The 2030 Agenda for Sustainable Development; UN: Geneva, Swizerland, 2015. [Google Scholar]
- German Bioeconomy Council. Update Report of National Strategies around the World—Bioeconomy Policy (Part III); Bioeconomy Council: Berlin, Germany, 2018. [Google Scholar]
- Kleinschmit, D.; Arts, B.; Giurca, A.; Mustalahti, I.; Sergent, A.; Pulzl, H. Environmental concerns in political bioeconomy discourses. Int. For. Rev. 2017, 19, 41–55. [Google Scholar] [CrossRef]
- Meyer, R. Bioeconomy Strategies: Contexts, Visions, Guiding Implementation Principles and Resulting Debates. Sustainability 2017, 9, 1031. [Google Scholar] [CrossRef] [Green Version]
- Heimann, T. Bioeconomy and SDGs: Does the Bioeconomy Support the Achievement of the SDGs? Earth’s Future 2019, 7, 43–57. [Google Scholar] [CrossRef] [Green Version]
- Balkau, F.; Bezama, A. Life cycle methodologies for building circular economy in cities and regions. Waste Manag. Res. 2019, 37, 765–766. [Google Scholar] [CrossRef] [PubMed] [Green Version]
- Siebert, A.; Bezama, A.; O’Keeffe, S.; Thrän, D. Social life cycle assessment: in pursuit of a framework for assessing wood-based products from bioeconomy regions in Germany. Int. J. Life Cycle Assess. 2016, 23, 651–662. [Google Scholar] [CrossRef] [Green Version]
- O’Keeffe, S.; Majer, S.; Bezama, A.; Thrän, D. When considering no man is an island—assessing bioenergy systems in a regional and LCA context: A review. Int. J. Life Cycle Assess. 2016, 21, 885–902. [Google Scholar] [CrossRef]
- Bezama, A.; Siebert, A.; Hildebrandt, J.; Thrän, D. Integration of LCA, LCC, and SLCA methods for assessing a bioeconomy region. In Life Cycle Approaches to Sustainable Regional Development; Taylor & Francis: Abingdon, UK, 2016; pp. 258–264. [Google Scholar]
- Bezama, A.; Ingrao, C.; O’Keeffe, S.; Thrän, D. Resources, Collaborators, and Neighbors: The Three-Pronged Challenge in the Implementation of Bioeconomy Regions. Sustainability 2019, 11, 7235. [Google Scholar] [CrossRef] [Green Version]
- Hildebrandt, J.; Siebert, A.; Thrän, D.; Bezama, A. Monitoring material flows of a bioeconomy region. In Proceedings of the 25th European Biomass Conference: Setting the Course for a Biobased Economy, Stockholm, Sweden, 12–15 June 2017; ETA-Florence Renewable Energies: Florence, Italy, 2017; pp. 1566–1574. [Google Scholar]
- Carus, M.; Dammer, L. Food or Non-Food: Which Agricultural Feedstocks Are Best for Industrial Uses? Nova-Institut: Huerth, Germany, 2013. [Google Scholar]
- Bezama, A. Let us discuss how cascading can help implement the circular economy and the bio-economy strategies. Waste Manag. Res. 2016, 34, 593–594. [Google Scholar] [CrossRef] [PubMed] [Green Version]
- Bezama, A. Understanding the systems that characterise the circular economy and the bioeconomy. Waste Manag. Res. 2018, 36, 553–554. [Google Scholar] [CrossRef] [PubMed] [Green Version]
- Ingrao, C.; Bacenetti, J.; Bezama, A.; Blok, V.; Goglio, P.; Koukios, E.G.; Lindner, M.; Nemecek, T.; Siracusa, V.; Zabaniotou, A.; et al. The potential roles of bio-economy in the transition to equitable, sustainable, post fossil-carbon societies: Findings from this virtual special issue. J. Clean. Prod. 2018, 204, 471–488. [Google Scholar] [CrossRef]
- United Nations Environment Programme. Guidelines for Social Life Cycle Assessment of Products; United Nations Environment Programme, DTIE: Paris, France, 2009. [Google Scholar]
- Finkbeiner, M.; Schau, E.M.; Lehmann, A.; Traverso, M. Towards Life Cycle Sustainability Assessment. Sustainability 2010, 2, 3309–3322. [Google Scholar] [CrossRef] [Green Version]
- Siebert, A.; Bezama, A.; O’Keeffe, S.; Thrän, D. Social life cycle assessment indices and indicators to monitor the social implications of wood-based products. J. Clean. Prod. 2018, 172, 4074–4084. [Google Scholar] [CrossRef]
- IAB-FDZ IAB-Betriebspanel—Testdaten [IAB Establishment Panel—Test Data]. Available online: https://fdz.iab.de/de/FDZ_Establishment_Data/IAB_Establishment_Panel/IABBP_9317.aspx (accessed on 1 January 2018).
- Mercer Holz. Zahlen & Fakten. Available online: https://mercer-holz.de/unternehmen/zahlen-fakten.html (accessed on 1 November 2019).
- Pollmeier Pollmeier Stammwerk Creuzburg. Pollmeier Main Plant at Creuzburg. Available online: https://www.pollmeier.com/de/Unternehmen/standorte (accessed on 1 November 2019).
- Pollmeier. Pollmeier Buche. eine Holzart. 1000 Möglichkeiten (Pollmeier Beech. A Type of Wood. 1000 Possibilities); Pollmeier: Creuzburg, Germany, 2018. [Google Scholar]
- Statista Durchschnittliche Jährliche Arbeitszeit pro Erwerbstätigen (Voll-und Teilzeit) in Deutschland von 2001 bis 2018 (Average Annual Working Time per Employee (Full and Part-Time) in Germany from 2001 to 2018). Available online: https://de.statista.com/statistik/daten/studie/4047/umfrage/entwicklung-der-jaehrlichen-arbeitszeit-pro-erwerbstaetigen/ (accessed on 1 December 2019).
- van Breeschoten, L.; Evertsson, M. When does part-time work relate to less work-life conflict for parents? Moderating influences of workplace support and gender in the Netherlands, Sweden and the United Kingdom. Community Work Fam. 2019, 22, 606–628. [Google Scholar] [CrossRef] [Green Version]
- Beham, B.; Drobnič, S.; Präg, P.; Baierl, A.; Eckner, J. Part-time work and gender inequality in Europe: A comparative analysis of satisfaction with work–life balance. Eur. Soc. 2018, 21, 378–402. [Google Scholar] [CrossRef] [Green Version]
- Martínez-Blanco, J.; Lehmann, A.; Chang, Y.-J.; Finkbeiner, M. Social organizational LCA (SOLCA)—A new approach for implementing social LCA. Int. J. Life Cycle Assess. 2015, 20, 1586–1599. [Google Scholar] [CrossRef]
- BAUA Bundesanstalt für Arbeitsschutz und Arbeitsmedizin; BMAS Bundesministerium für Arbeit und Soziales Sicherheit und Gesundheit bei der Arbeit—Berichtsjahr 2016 (Safety and Health at Work—Reporting Year 2016). Available online: www.baua.de/dok/8732292 (accessed on 1 November 2019).
- Statista Tödliche Arbeitsunfälle in Deutschland bis 2017. Anzahl tödlicher Arbeitsunfälle je 1.000 Vollarbeiter in Deutschland in den Jahren 1987 bis 2017 (Fatal Occupational Accidents in Germany until 2017 Number of Fatal Occupational Accidents per 1,000 Full-Time Workers in Germany in the Years 1987 to 2017). Available online: https://de.statista.com/statistik/daten/studie/763855/umfrage/toedliche-arbeitsunfaelle-je-1000-vollarbeiter-in-deutschland/ (accessed on 17 August 2019).
- Knieps, F.; Pfaff, H. Gesundheit in Regionen. Zahlen, Daten, Fakten mit Gastbeiträgen aus Wissenschaft, Politik und Praxis; MWV Medizinisch Wissenschaftliche Verlagsgesellschaft: Berlin, Germany, 2014. [Google Scholar]
- Zapf, I. Individual and Workplace-Specific Determinants of Paid and Unpaid Overtime Work in Germany; DIW, Deutsches Institut für Wirtschaftsforschung: Berlin, Germany, 2015. [Google Scholar]
- Statistik der Bundesagentur für Arbeit Schwerbehinderte Menschen in Beschäftigung (Anzeigeverfahren SGB IX) (Severely Disabled Persons in Employment (Notification Procedure SGB IX). Available online: https://www.bmas.de/DE/Themen/Teilhabe-Inklusion/Foerderung-der-Ausbildung-und-Beschaeftigung/beschaeftigung-schwerbehinderter-menschen.html (accessed on 1 October 2019).
- Statistik der Bundesagentur für Arbeit Berichte: Analyse Arbeitsmarkt, Arbeitsmarkt für Ausländer (Monatszahlen), Dezember 2017 (Reports: Analysis Labour Market, Labour Market for Foreigners (Monthly Figures), December 2017). Available online: https://statistik.arbeitsagentur.de/Statistikdaten/Detail/201807/analyse/analyse-d-arbeitsmarkt-auslaender/analyse-d-arbeitsmarkt-auslaender-d-0-201807-pdf.pdf (accessed on 1 October 2019).
Figure 1.
Geographical system boundary of the production system (adapted from [2]). The hours, as input flows, are the expended working hours of each organization for 1 m3 laminated veneer lumber (LVL).
Figure 1.
Geographical system boundary of the production system (adapted from [2]). The hours, as input flows, are the expended working hours of each organization for 1 m3 laminated veneer lumber (LVL).


| O1 | O2 | O3 | |||
|---|---|---|---|---|---|
| Employees | 1394 | Employees | 170 | Employees | 430 |
| Logging 01 (m3/y) | 2,800,000 | Transport of timber (m3/y) | 7,000,000 | Beech wood processing (m3/y) | 750,000 |
| Logging of beech wood (m3/y) | 547,620 | Beech wood processing Creuzburg (m3/y) | 325,000 | ||
| Production of beech LVL (m3/y) | 180,000 | ||||
Table 2.
Calculations of the production system of LVL.
| O1 | O2 | O3 | |||
|---|---|---|---|---|---|
| Annual working hours (h/y) | 2,295,918 | Annual working hours (h/y) | 279,990 | Annual working hours (h/y) | 708,210 |
| Production of beech LVL Creuzburg (m3/y) | 78,000 | ||||
| Working hours per LVL (h/m3) | 0.82 | Working hours per LVL (h/m3) | 0.04 | Working hours per LVL (h/m3) | 9.08 |
Table 3.
Index scores, weighted scores, and weighted product scores of O1 and O3 (exemplary) related to their contribution to the LVL.
Table 3.
Index scores, weighted scores, and weighted product scores of O1 and O3 (exemplary) related to their contribution to the LVL.
| Index | Index Score O1 | Weighted Score O1 1 | Index Score O3 | Weighted Score O3 2 | Weighted Product Score |
|---|---|---|---|---|---|
| 1. Health & safety | 8.2 | 0.68 | I1 | WS1 | 0.68 + WS1 |
| 2. Adequate remuneration | 7.2 | 0.60 | I2 | WS2 | 0.60 + WS2 |
| 3. Adequate working time | 8.4 | 0.70 | I3 | WS3 | 0.70 + WS3 |
| 4. Employment | 8.4 | 0.70 | I4 | WS4 | 0.70 + WS4 |
| 5. Knowledge capital | 5.4 | 0.45 | I5 | WS5 | 0.45 + WS5 |
| 6. Equal opportunities | 7.5 | 0.62 | I6 | WS6 | 0.62 + WS6 |
| 7. Participation | 9.1 | 0.76 | I7 | WS7 | 0.76 + WS7 |
The calculated index scores and weighted scores for Organization 1 (O1) are shown. The calculation for Organization 3 (O3) is exemplary. The color system is based on the following Assessment Scale: ![Sustainability 12 01259 i001]() . 1 ; 2 .
. 1 ; 2 .
 . 1 ; 2 .
© 2020 by the authors. Licensee MDPI, Basel, Switzerland. This article is an open access article distributed under the terms and conditions of the Creative Commons Attribution (CC BY) license (http://creativecommons.org/licenses/by/4.0/).
Share and Cite
MDPI and ACS Style
Jarosch, L.; Zeug, W.; Bezama, A.; Finkbeiner, M.; Thrän, D. A Regional Socio-Economic Life Cycle Assessment of a Bioeconomy Value Chain. Sustainability 2020, 12, 1259. https://0-doi-org.brum.beds.ac.uk/10.3390/su12031259
AMA Style
Jarosch L, Zeug W, Bezama A, Finkbeiner M, Thrän D. A Regional Socio-Economic Life Cycle Assessment of a Bioeconomy Value Chain. Sustainability. 2020; 12(3):1259. https://0-doi-org.brum.beds.ac.uk/10.3390/su12031259
Chicago/Turabian StyleJarosch, Lena, Walther Zeug, Alberto Bezama, Matthias Finkbeiner, and Daniela Thrän. 2020. "A Regional Socio-Economic Life Cycle Assessment of a Bioeconomy Value Chain" Sustainability 12, no. 3: 1259. https://0-doi-org.brum.beds.ac.uk/10.3390/su12031259
Note that from the first issue of 2016, this journal uses article numbers instead of page numbers. See further details here.