Article

The Dependence Between Shear Strength Parameters and Microstructure of Subgrade Soil in Seasonal Permafrost Area

1
College of Transportation, Jilin University, Changchun 130025, China
2
School of Transportation Science and Engineering, Jilin Jianzhu University, Changchun 130118, China
*
Author to whom correspondence should be addressed.
Sustainability 2020, 12(3), 1264; https://0-doi-org.brum.beds.ac.uk/10.3390/su12031264
Submission received: 6 January 2020 / Revised: 7 February 2020 / Accepted: 7 February 2020 / Published: 10 February 2020
(This article belongs to the Special Issue Sustainability of Soil Reuse in Civil Construction)

Abstract

:
Permafrost and seasonal permafrost are widely distributed in China and all over the world. The failure of soil is mainly shear failure, and the strength of soil mainly refers to the shear strength. The two most important parameters of shear strength are cohesion and angle of internal friction. In order to ensure the sustainability of road construction in seasonal permafrost area, the microstructure of subgrade soil was observed and analyzed. First, three subgrade soils with different plasticity indices were prepared for triaxial test and scanning electron microscope (SEM). Then, these specimens underwent freezing–thawing (FT) cycles and were obtained shear strength parameters by triaxial shear test. Next, the microstructure images of soil were obtained by SEM, and the microstructure parameters of soil were extracted by image processing software. Finally, the correlation method was used to analyze the dependence between the shear strength parameters and the microstructure parameters. Results revealed that subgrade soils with a higher plasticity index had higher cohesion and lower angle of internal friction. In addition, with the increase of the number of FT cycles, the diameter and number of soil particles and pores tend to increase, while the roundness, fractal dimension and directional probabilistic entropy of particles decreased. With the increase of the plasticity index, the particle and pore diameter decreased, but the particle and pore number increased. Besides, particle roundness had the greatest influence on the cohesion and angle of internal friction of shear strength parameters.

1. Introduction

Soil is the sediment formed in various natural environments after weathering of rocks. Soil consists of solid phase, liquid phase, and gas phase. In the permafrost area and seasonal permafrost area, the temperature changes greatly. The free water in the soil in these areas freezes to ice at low temperatures, then the ice melts into water at high temperatures [1]. The interaction of ice and water complicates the permafrost. Permafrost covers about 23% of the earth’s land surface. China is the third largest permafrost country in the world. Permafrost and seasonal permafrost account for more than two-thirds of the total land area in China. The highway engineering structure in these areas is facing the challenge of winter frost heave and spring thaw settlement. Therefore, it is increasingly important to study the mechanical properties of subgrade soil after freezing–thawing (FT) cycles [2,3,4,5]. The change of microstructure is the essence of the change of mechanical properties. In order to ensure the sustainability of road construction in seasonal permafrost area, the microstructure of subgrade soil must be observed and analyzed.
As early as the 19th century, the researchers began to understand and gradually obtained the data of temperature, thickness, burial conditions and distribution of Siberian permafrost, laying a foundation for the subsequent study of Siberian permafrost. After that, infrastructure construction in permafrost and seasonal permafrost area gradually made people pay increasing attention to permafrost research. Current studies [6,7,8,9] have shown that after FT cycles, the height of soil increased, and the water content decreased. The elastic modulus and failure strength of soil gradually decreased after FT cycles and stabilized after 7 FT cycles. In addition, as the number of FT cycles increases, the cohesion of the clay gradually decreased, while the angle of internal friction gradually increased [10]. Liu et al. [11] studied silty sand in a similar way and found that the maximum reduction in elastic modulus and failure strength after FT cycles was 45%. Orakoglu et al. [12] found that the compressive strength of unreinforced soil decreased with an increment of FT cycles. Similarly, the strength, stiffness, and viscosity characteristics of frozen loess gradually weakened with the increase of the number of FT cycles, and 4–6 times was the steady of FT number [13].
In the early stage of soil microstructure research, due to the backward scientific and technological means, the research equipment was mainly limited to a magnifying glass and an optical microscope. Since the 1960s, with the emergence of new equipment such as scanning electron microscope (SEM) and mercury intrusion porosimetry (MIP), the study of soil microstructure has become more prosperous. Zhou et al. [14] studied the pore structures of the silty clay by using MIP and found that the pore volume increased after FT cycles. Di et al. [15] studied the microstructure of compacted soil and found that the pore diameter distribution of compacted soil was not uniform in the case of direct saturation, while more uniform in the case of unsaturated curing. Ouassila et al. [16] researched reconstituted soil microstructure by SEM and found that the reconstituted soil was characterized by a porous structure based on loose skeleton of grains and a clayey fraction was unevenly distributed. In addition, using SEM technology, Tang et al. [17] found that freezing temperature had little effect on the shape and direction of pores in soil samples, but freezing temperature would increase the volume of pores. Garzón et al. [6] observed that the layered morphology and characteristics related to the presence of clay minerals were clearly visible by SEM. Tang et al. [18] observed the microstructure of sandy silt with SEM and confirmed that FT could change the micropore parameters of soil. Zhang et al. [19] investigated the variations of microscopic pore structure of silty clay after FT with SEM, and found that the mean value of the anisotropy microscopic pore structures increased about 12% after FT. Neto et al. [20] studied the relationship between the microstructure and mechanical behavior of clay and found that loading and compacting did not affect the micropores. The microstructure analysis of soil in previous studies is mainly qualitative analysis. Since the 1990s, with the development and application of a series of image processing software and the emergence of relevant theories, quantitative analysis has been gradually applied in the study of soil microstructure. Voltolini et al. [21] proposed a series of quantitative analysis tools for soil microstructure. Trzcinski et al. [22] quantitatively analyzed the microstructure parameters of different soil samples and proved that engineering parameters could be predicted according to soil microstructure types and pore space parameters. With the further upgrading of technology and analysis methods, researchers [23,24,25,26,27,28,29,30] have studied different aspects of different soils and achieved some results. However, the relationship between microstructure and mechanical properties has rarely been studied in previous studies. Gao et al. [31] mainly studied the relationship between hydromechanical behavior and microstructure of soil. Rosone et al. [32,33] studied the relationship between mechanical properties and microstructure of lime-treated clay and proved the consistency between microstructure and mechanical properties. Chen et al. [34] found that there was a unique linear relation between strength and the void ratio at failure to the reference void ratio. Yu et al. [35] found the change of dry density of soil was related to the change of macropore distribution.
In this paper, the correlation method was used to analyze the dependence between shear strength parameters and microstructure parameters of subgrade soil. In addition, the influence of the plasticity index and FT action on subgrade soil was studied. First, three subgrade soils with different plasticity indices were selected. Then, these specimens underwent FT cycles and were obtained shear strength parameters by triaxial shear test. Next, the microstructure images of soil samples were obtained by SEM, and the microstructure parameters were extracted by image processing software. Finally, the correlation method was used to analyze the dependence between the shear strength parameters and the microstructure parameters.

2. Materials and Methods
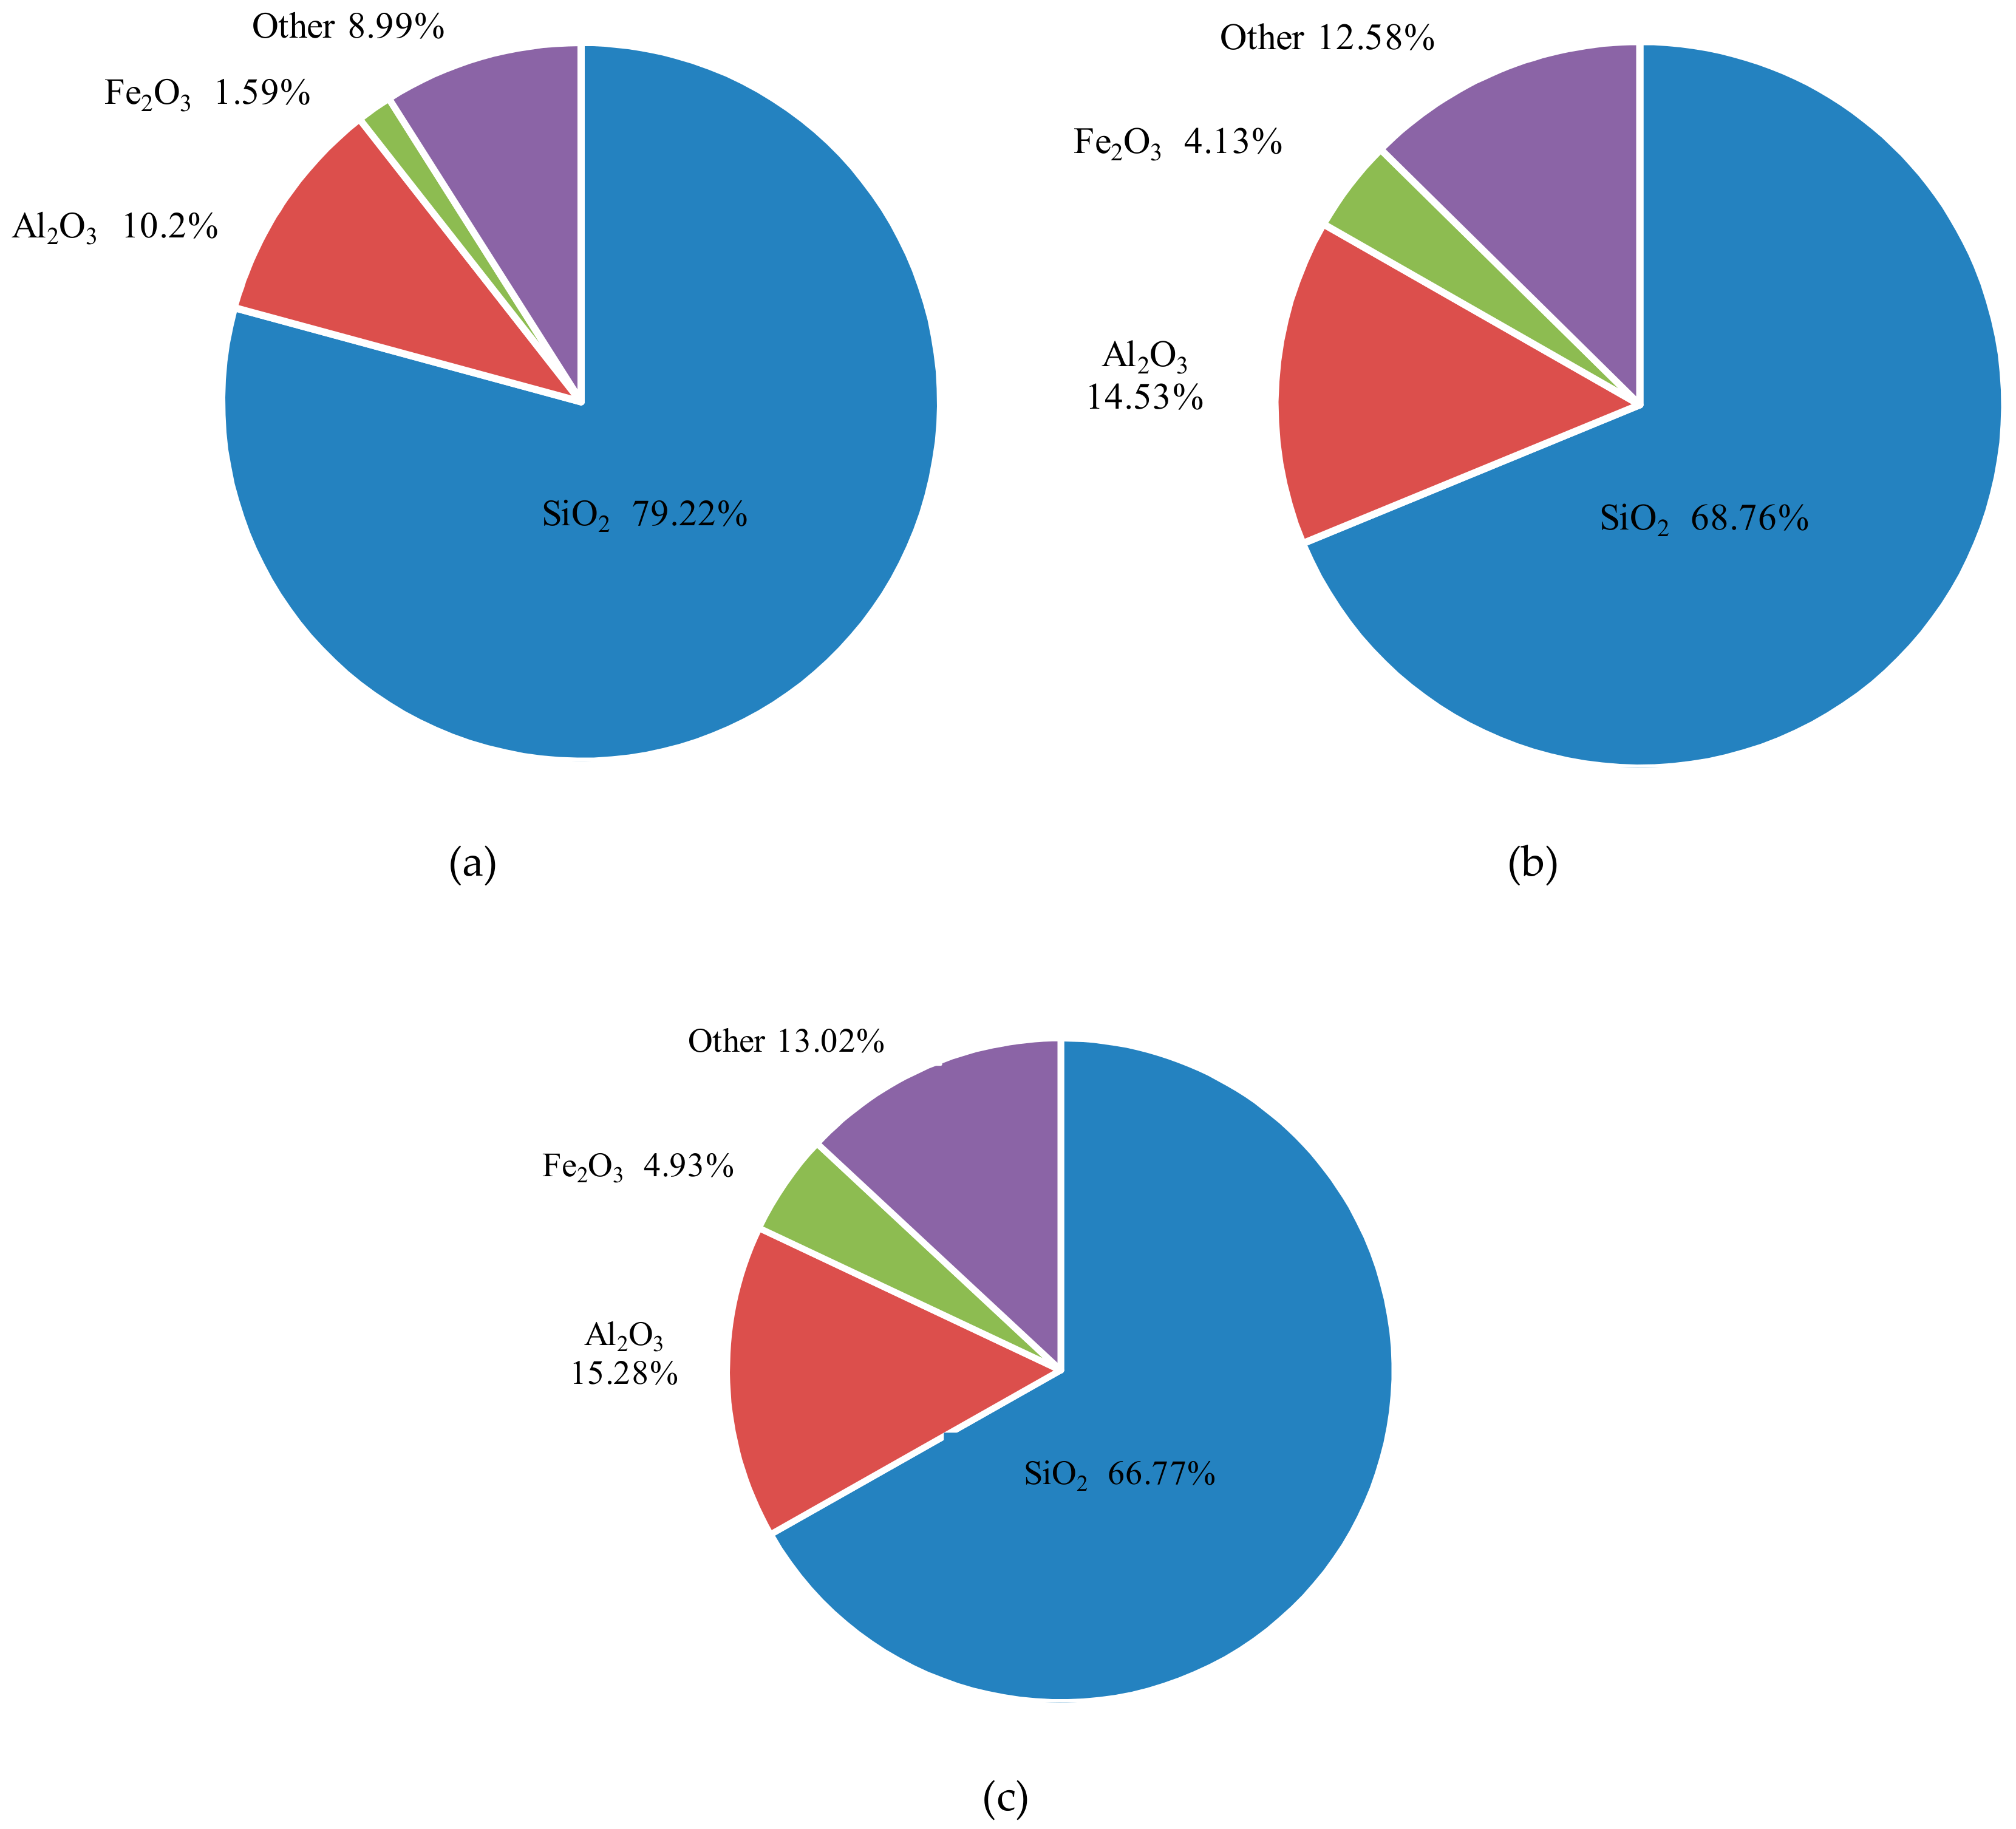
2.1. Materials

A variety of soil samples were selected from the expressway areas around Changchun, China, for the Atterberg limits test. According to the plasticity index, three representative soil samples with different plasticity indexes were selected and named as Sample A, Sample B, and Sample C successively. According to the Test Methods of Soils for Highway Engineering [36], Sample A is silty sand, Sample B is silt, and Sample C is clay.
The basic physical properties of three soil samples are shown in Table 1. Figure 1 shows grain size accumulation curve of three soil samples. Figure 2 showed chemical compositions of three soil samples respectively.
From Figure 2, it can be seen that the subgrade soil was mainly composed of SiO2, Al2O3, and Fe2O3. With the plasticity index increasing, the content of SiO2 in subgrade soil decreased, while the content of Al2O3 and Fe2O3 increased.

2.2. Test Program

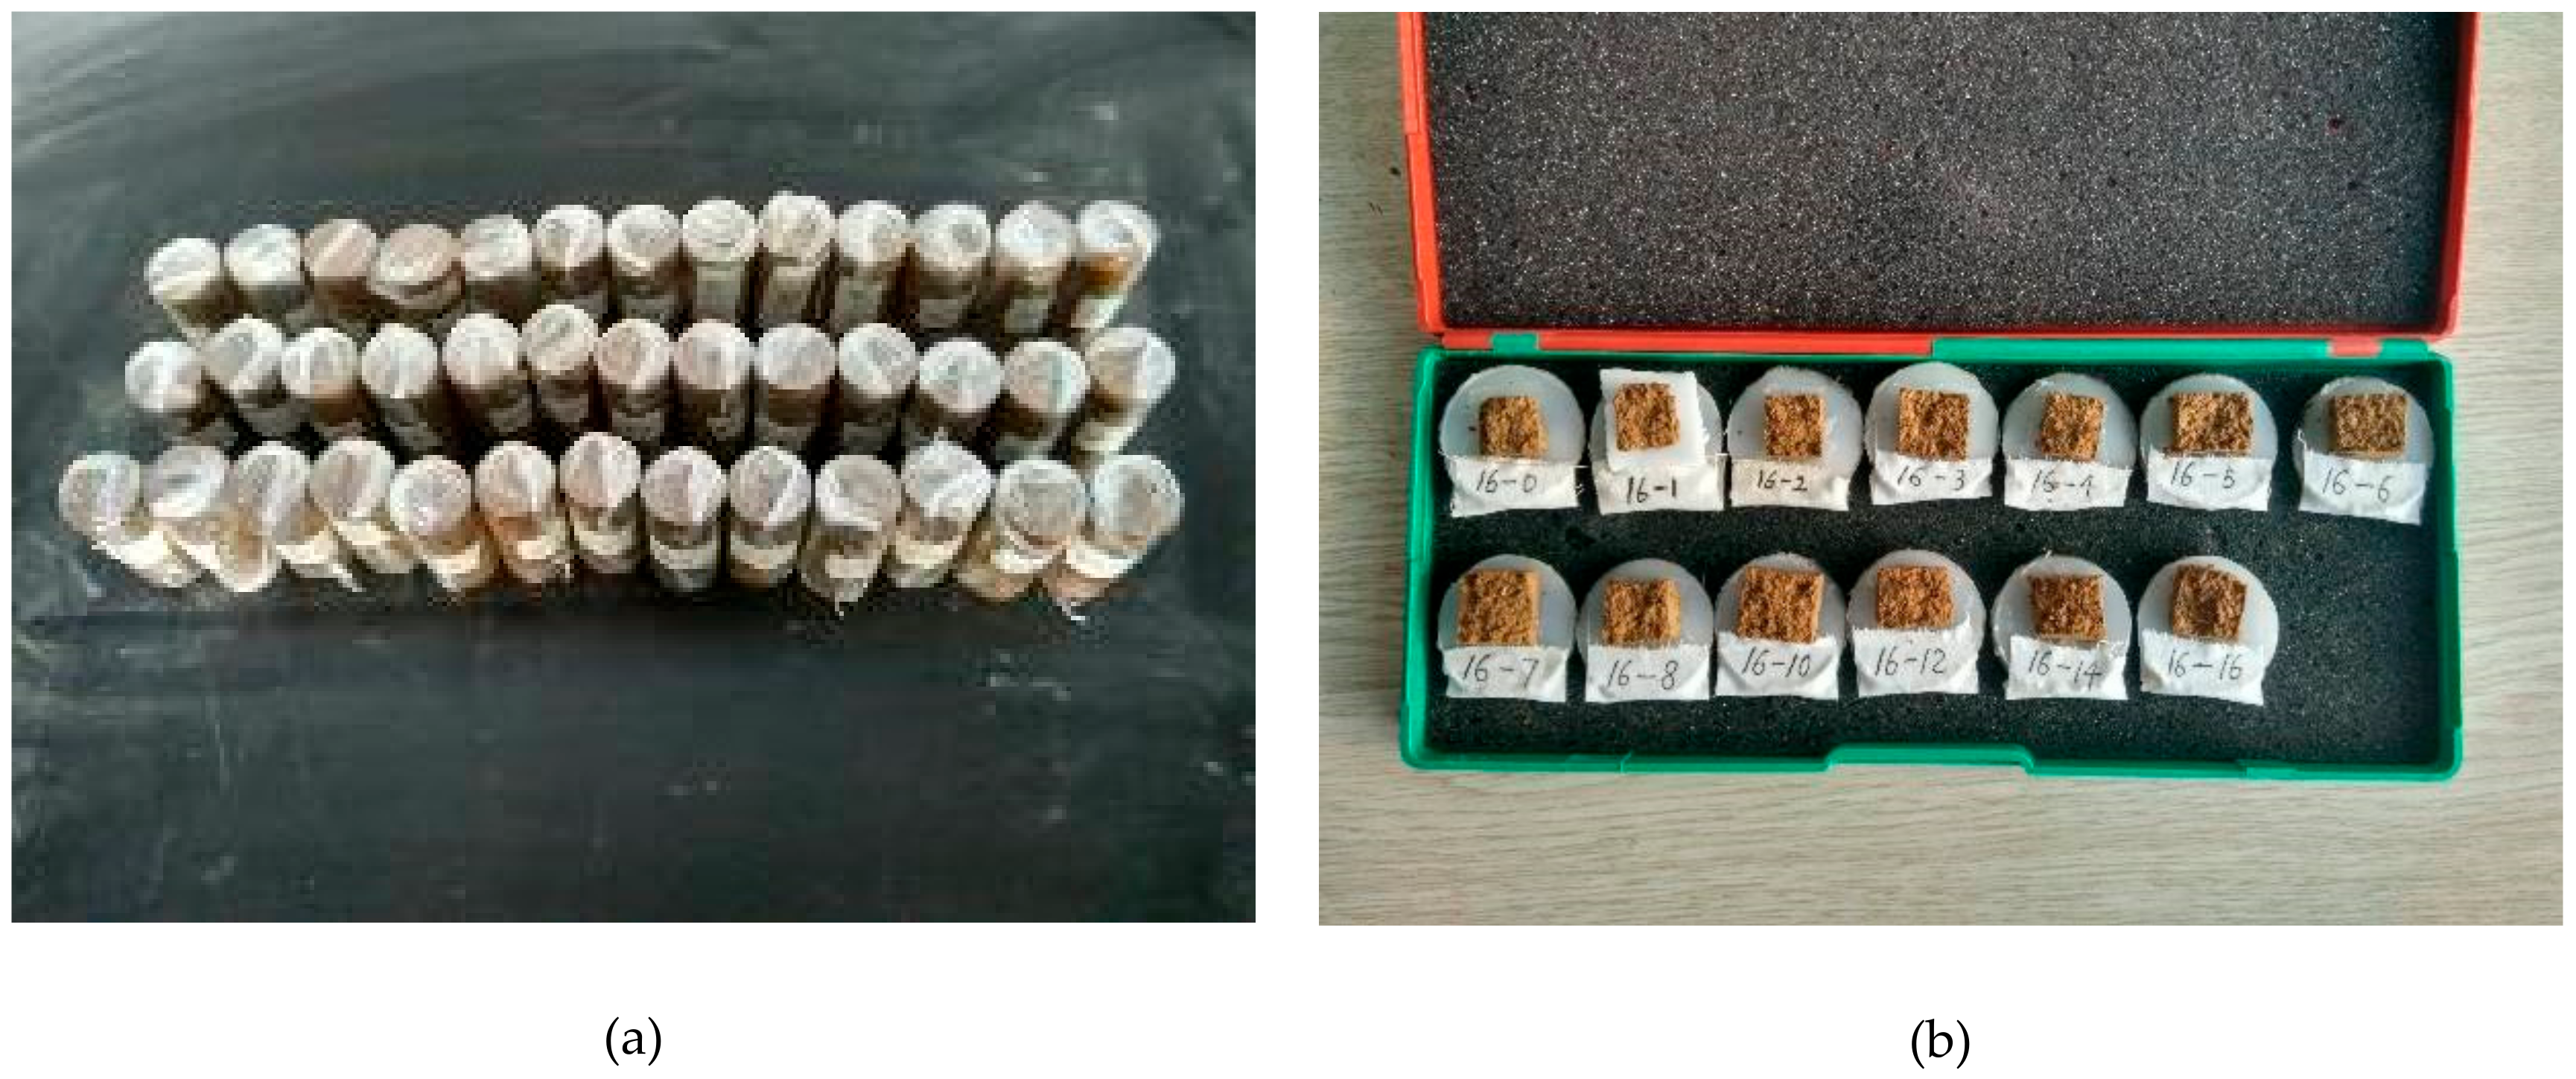
2.2.1. Preparing and FT of Test Samples

According to the molding method of Chinese specifications, the test soils were made into cylinder samples (diameter of 39.1 mm, height of 80 mm) with their optimum water content. They were compacted at the lowest compaction standard of high-grade highway subgrade (96%).
To prevent moisture loss, finished specimens, shown in Figure 3a, were wrapped with plastic film and placed in the FT cycle box. In order to freeze and thaw the sample fully, the FT condition was to freeze at −20 °C for 24 h and thaw at 20 °C for 24 h. The number of FT cycles was selected as 0, 2, 4, 6, 8, 10, 12, 14, and 16.

2.2.2. Test Procedures of Shear Strength Parameters

The strain controlled triaxial apparatus was used to conduct unconsolidated and undrained triaxial shear tests under confining pressures of 100 kPa, 200 kPa and 300 kPa respectively. The degree of saturation of silt sand, silt, and clay is 0.48, 0.44, and 0.35 respectively. The cohesion and the angle of internal friction were obtained from the test results. According to the Mohr–Coulomb theory, shown in Equation (1), cohesion and friction strength are two components of shear strength. The cohesion mainly refers to the chemical bonding force. The friction strength can be divided into two parts: sliding and occlusion. Sliding refers to the sliding friction between solid particles of soil, which is the main part of soil friction strength. Occlusal friction refers to the friction caused by lifting, rotating and pulling out of the particles of the shear plane caused by the staggered arrangement of soil particles [37]. The angle of internal friction is an important factor influencing friction strength. It can be seen from Equation (1) that shear strength is positively correlated with cohesion and angle of internal friction.
τ = c + σ tan φ
where τ is the shear strength, c is the cohesion, φ is the angle of internal friction.
We can also calculate the shear strength of the soil by using Equation (1).

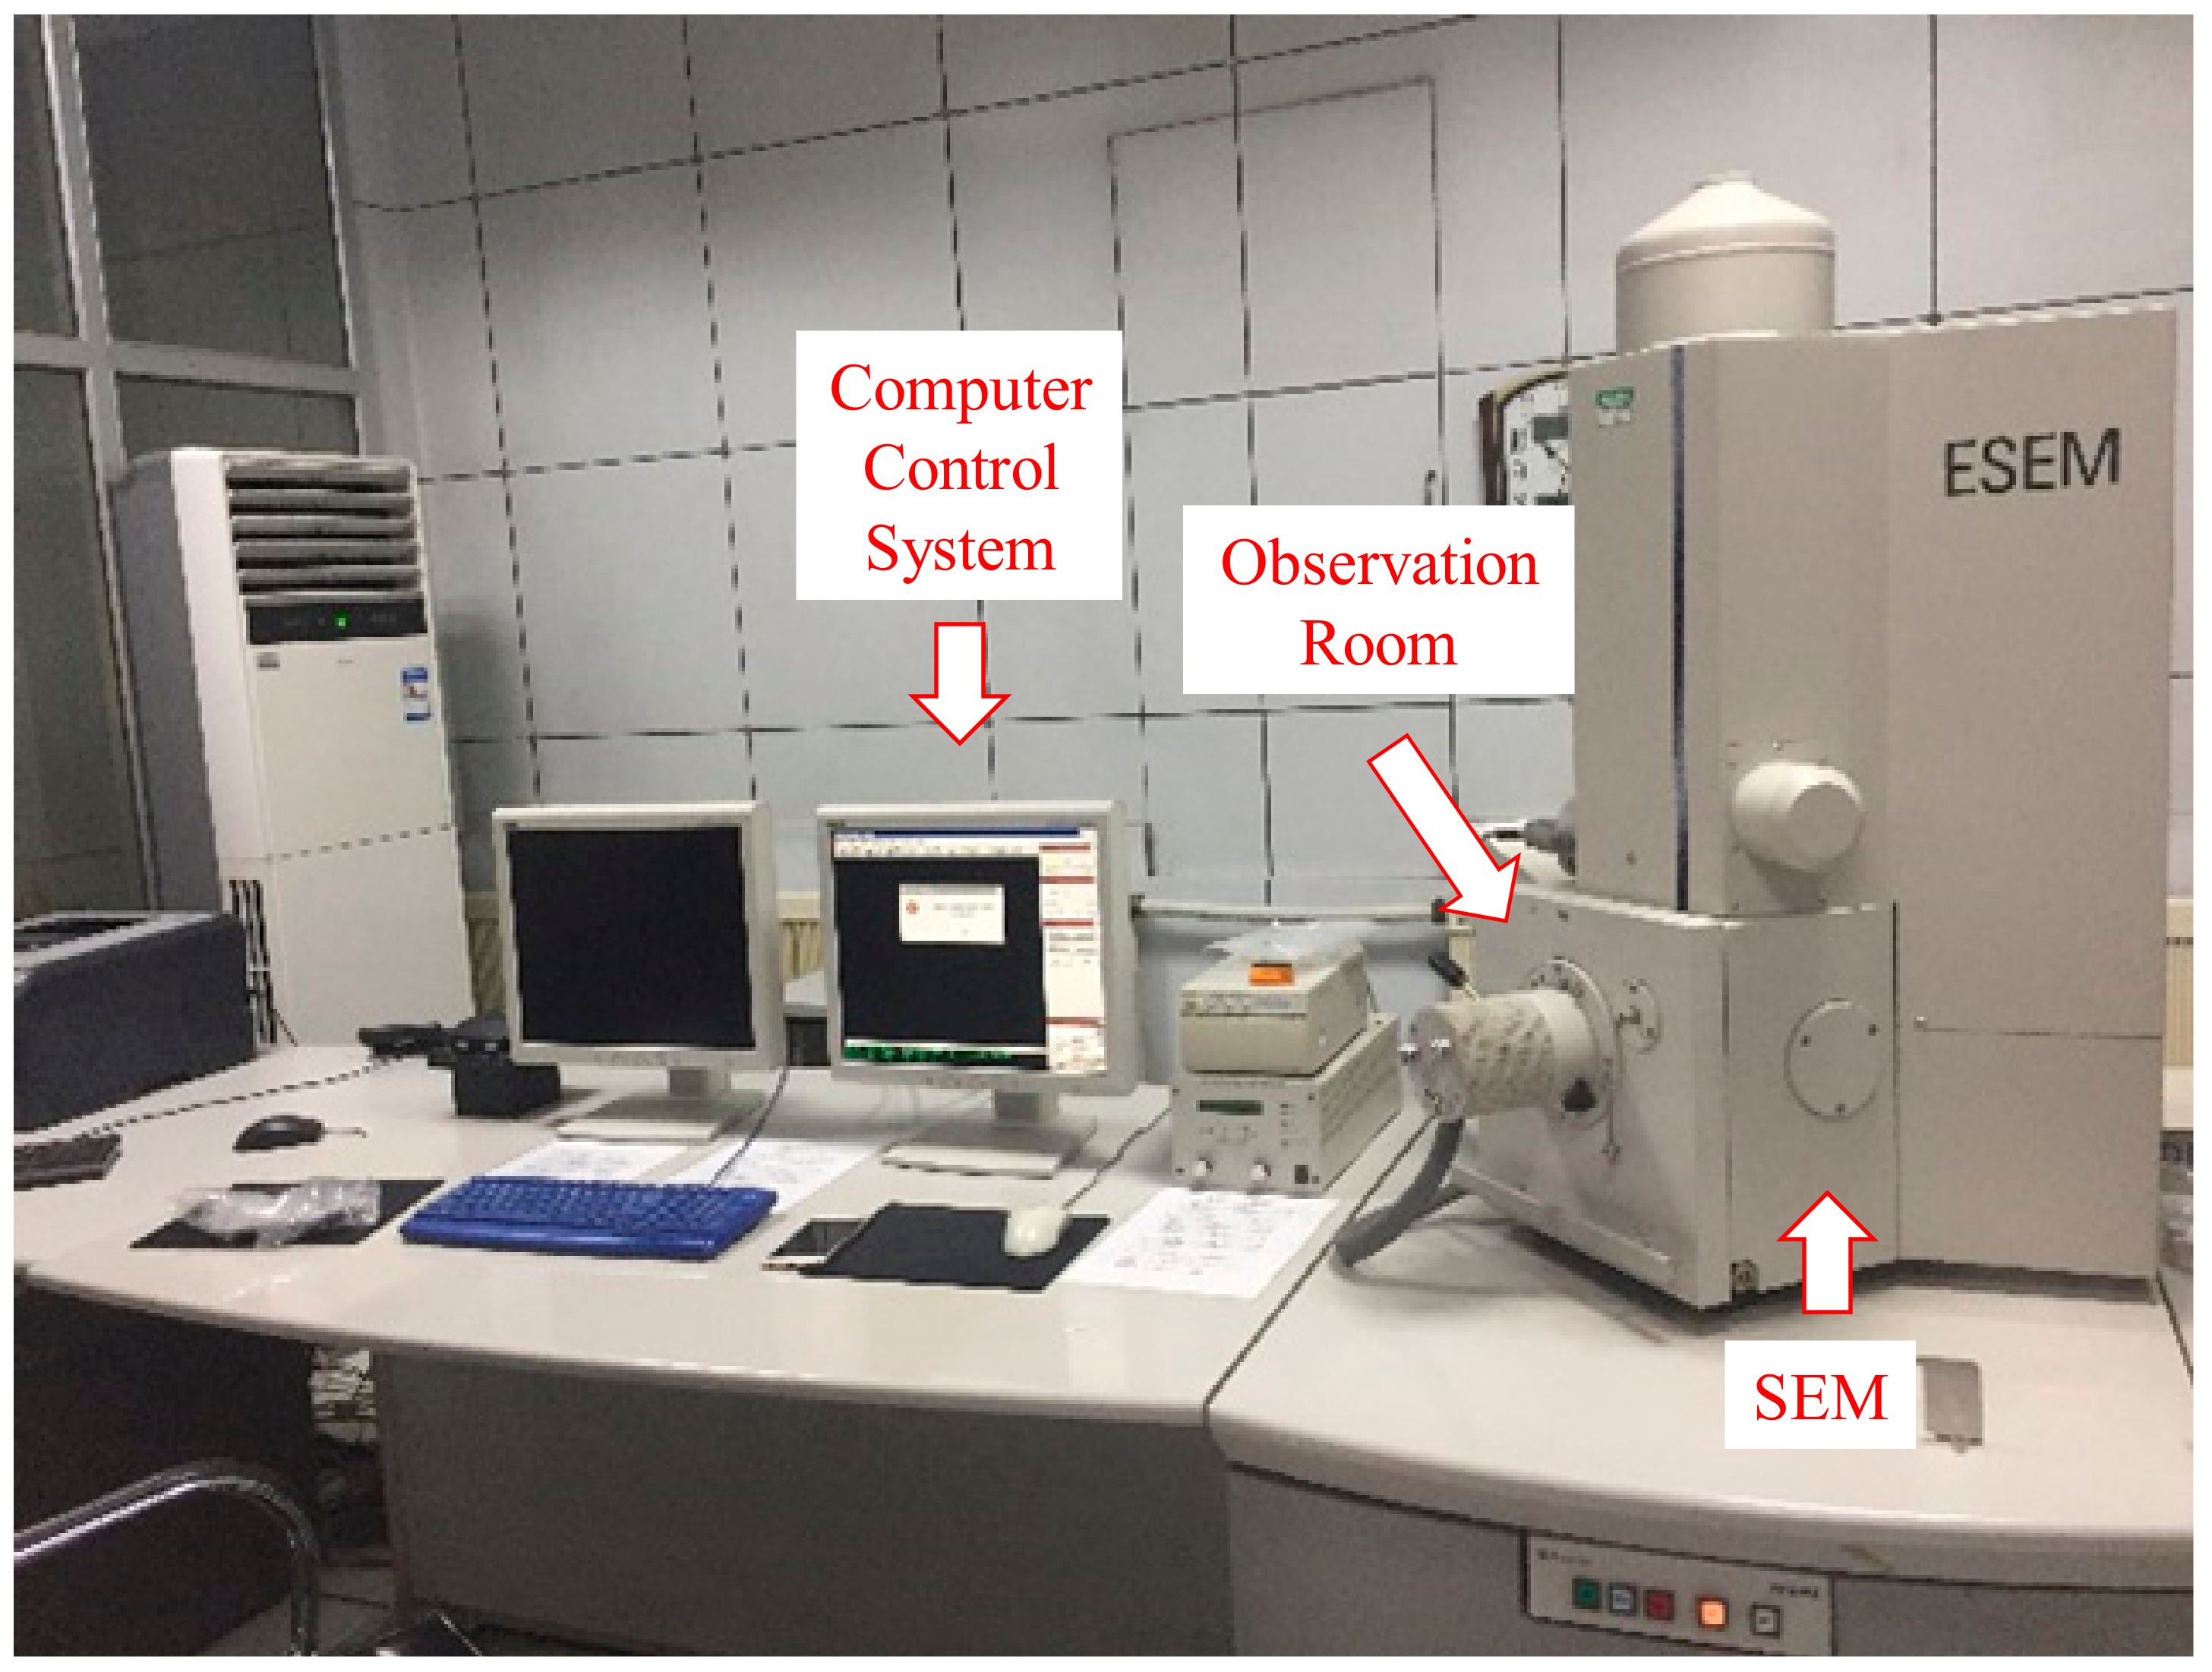
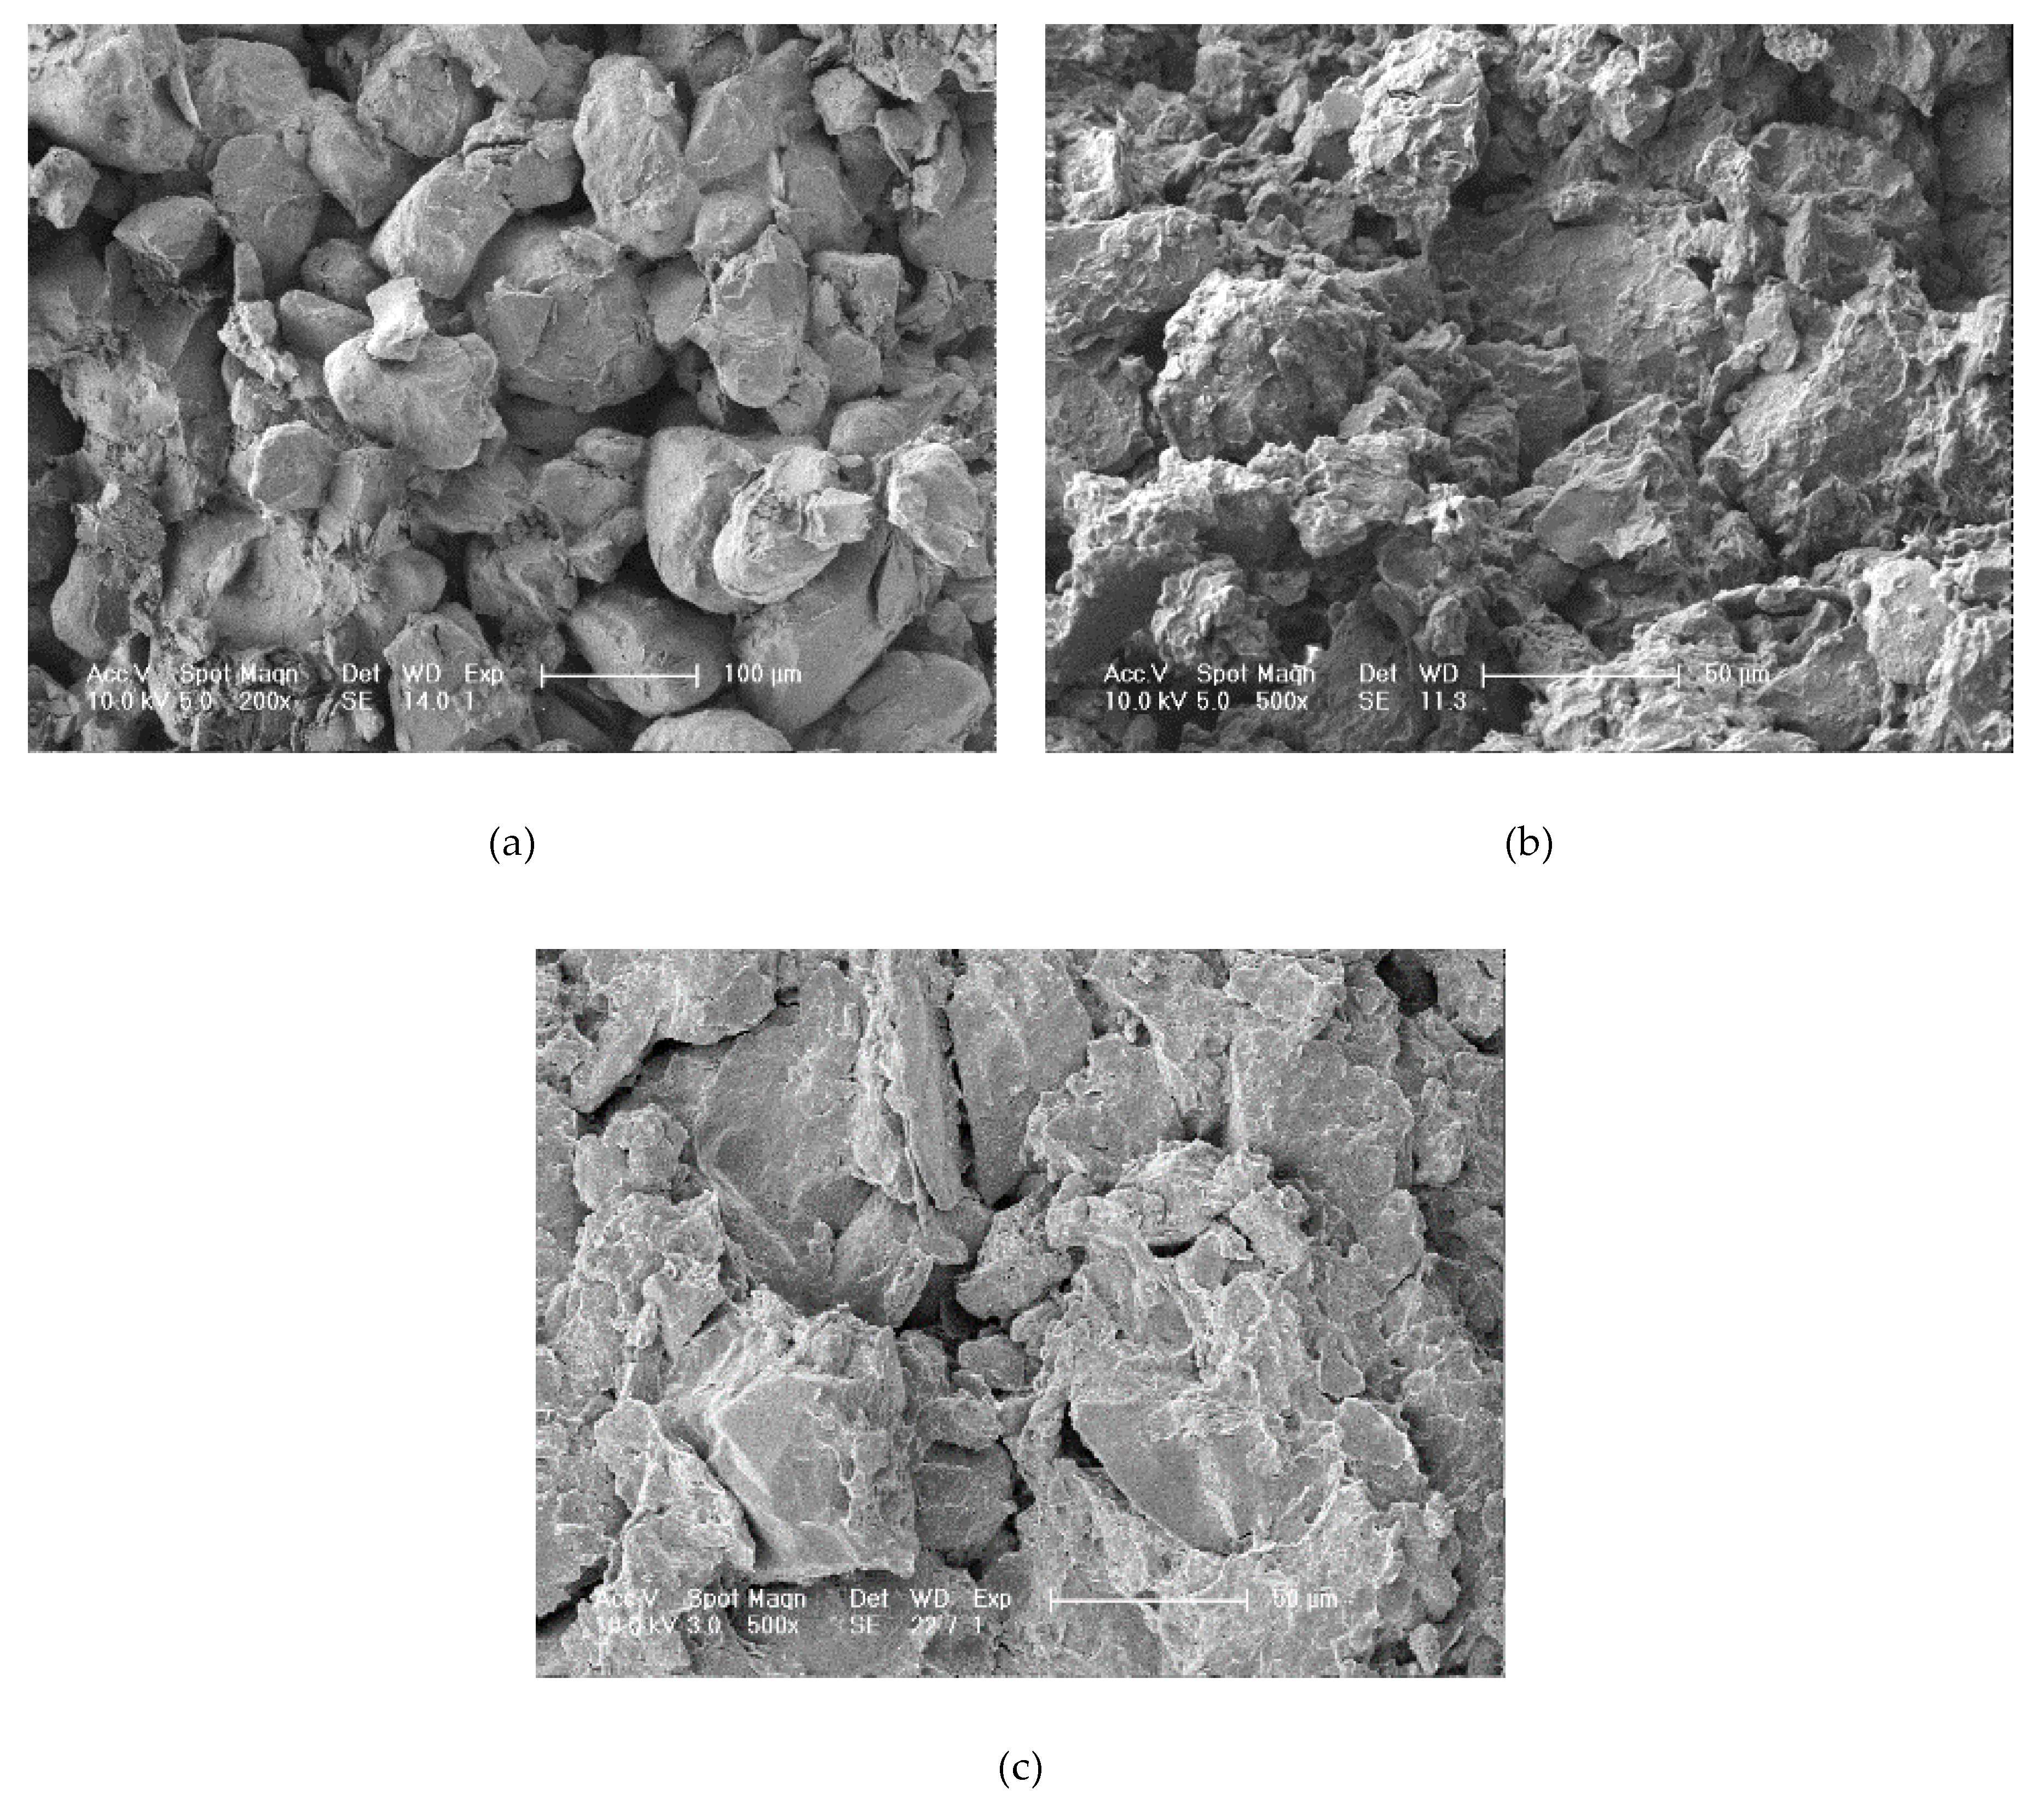
2.2.3. Preparation and Test Procedures of Microstructure Sample

After the FT cycles stabilized, each soil sample needed to be further processed. First, the soil samples were broken carefully. Then, the soil sample size and edges were trimmed. The modified soil samples are shown in Figure 3b. Finally, the soil samples were air-dried and gilded. It is important to ensure that the observed surface of the soil sample is not disturbed during the whole process.
The prepared sample was put into the SEM image observation room. SEM equipment is shown in Figure 4. During the process of obtaining the microstructural photos, the flat part of the soil sample was selected to be photographed in order to avoid the deviation caused by the edges of the soil sample and some large particles and pores. The microstructure of the three soil samples is shown in Figure 5.

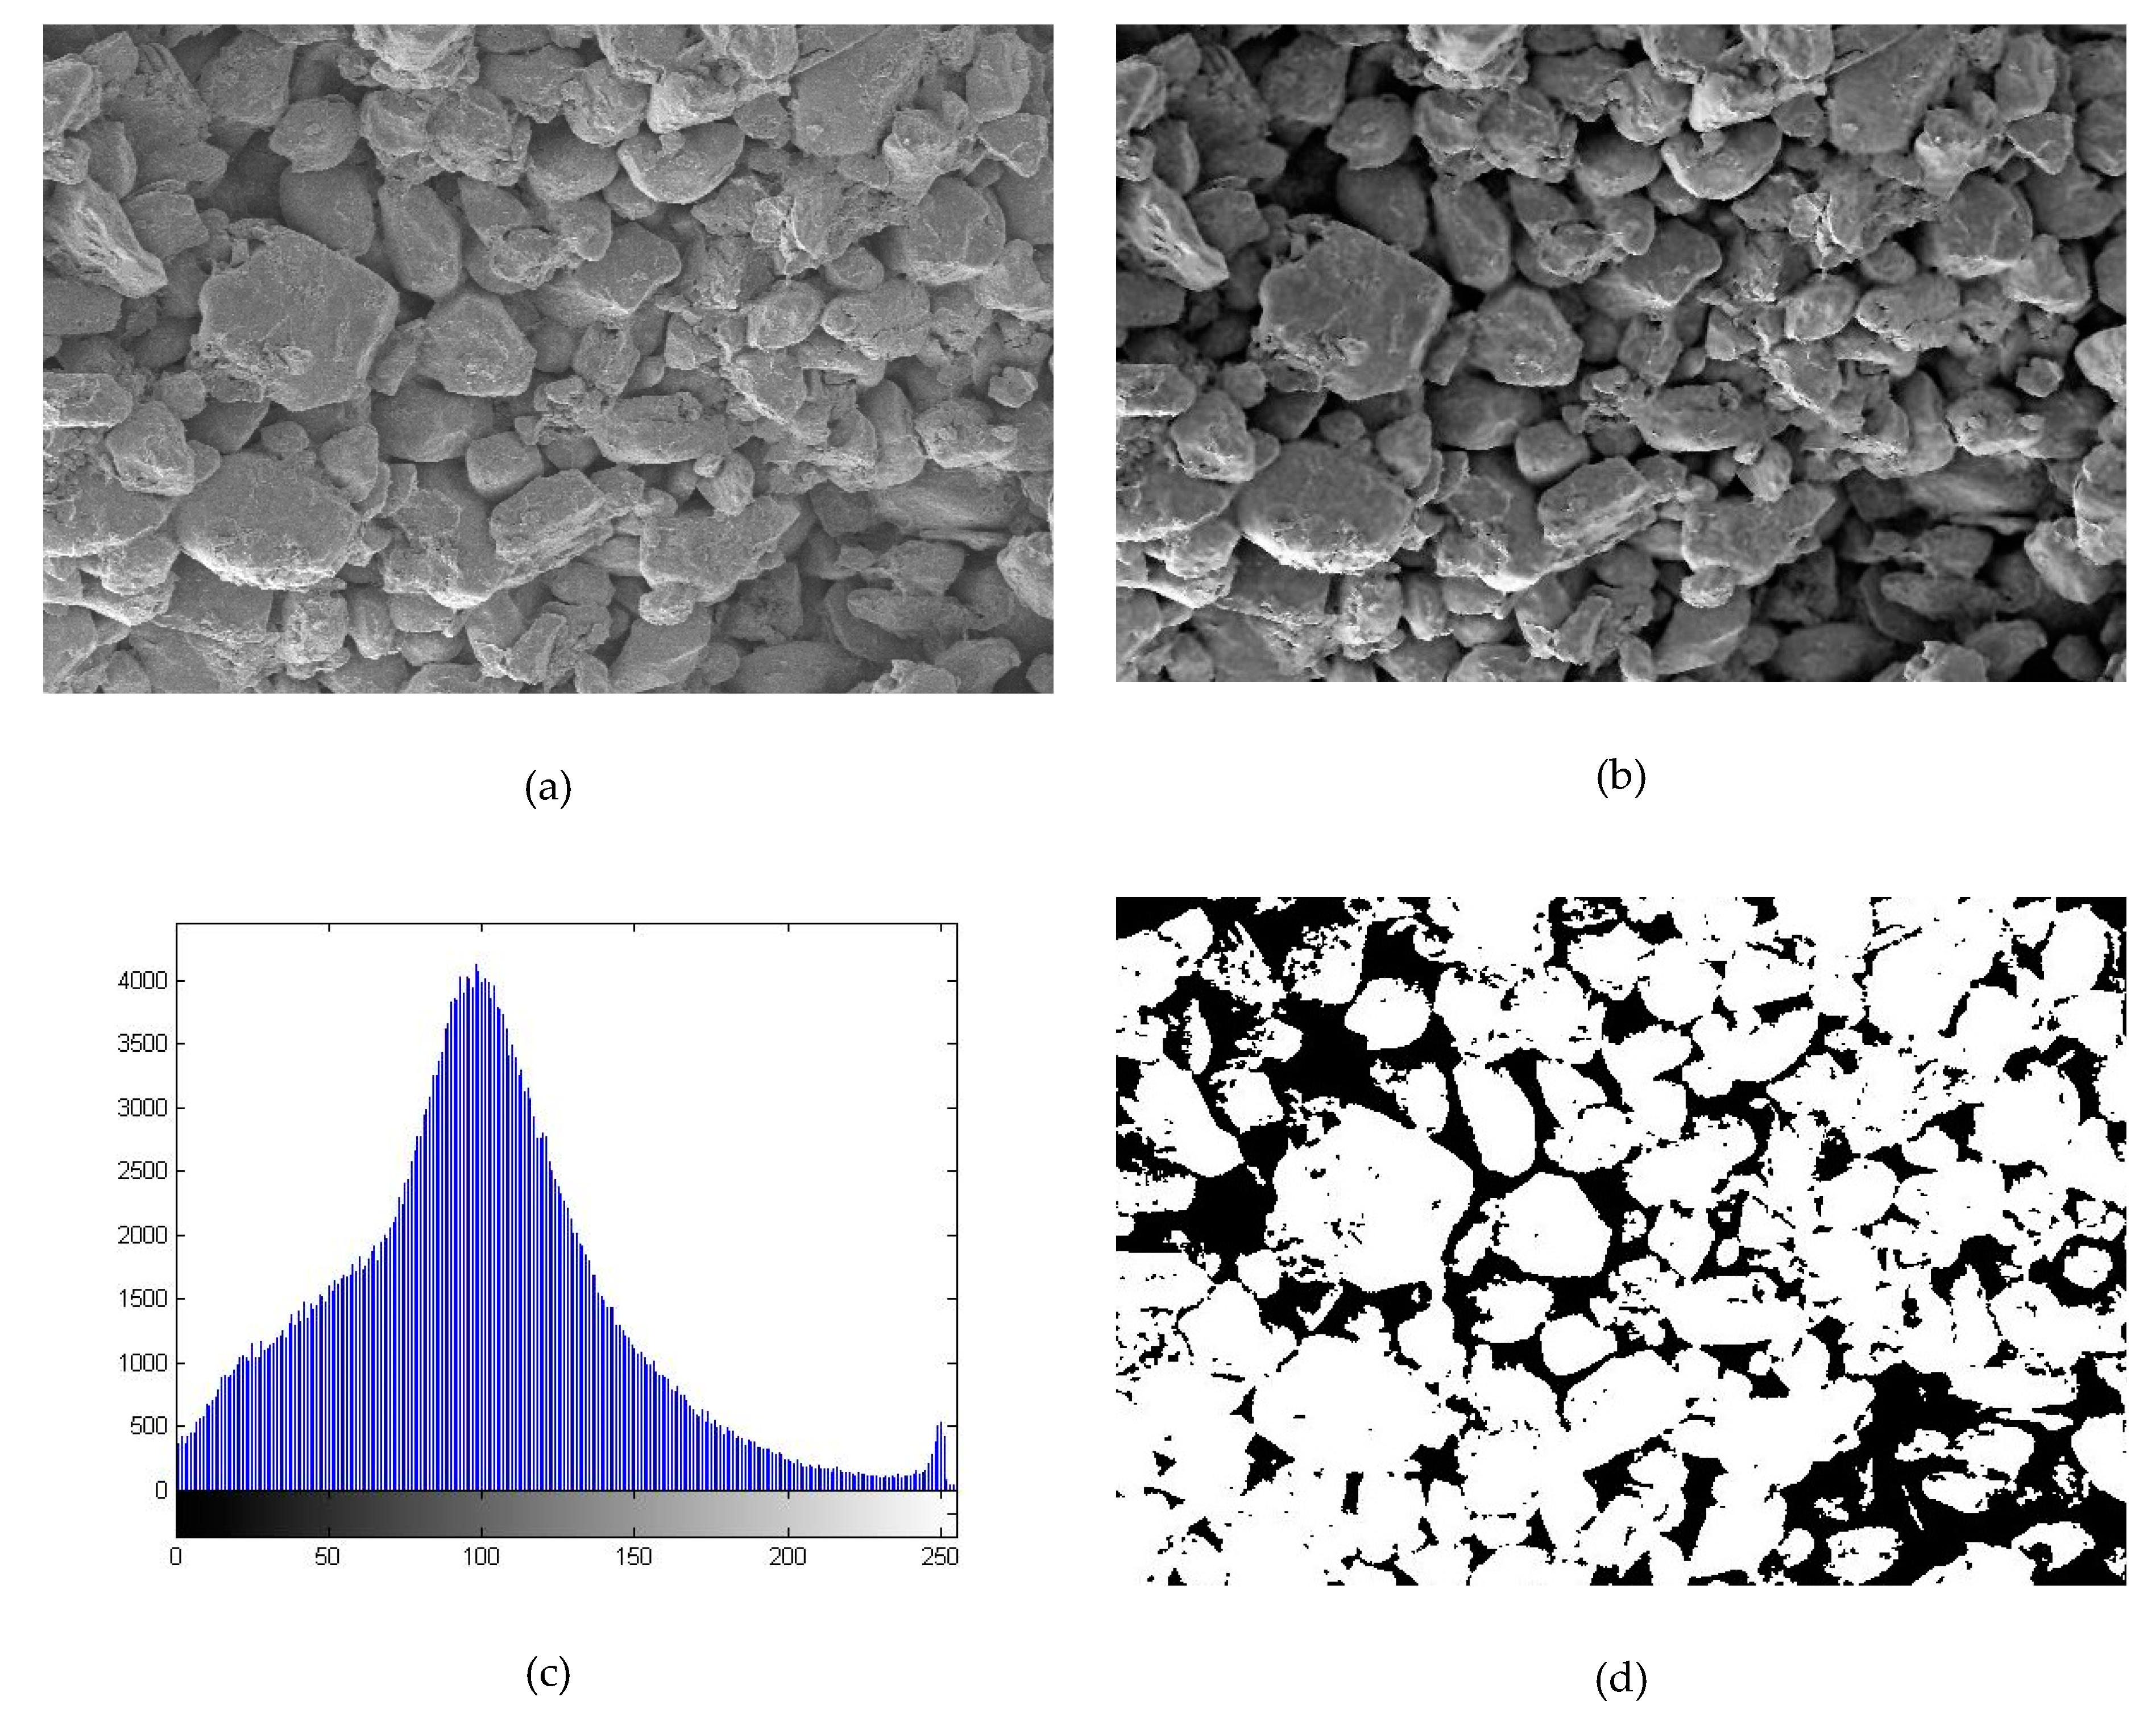
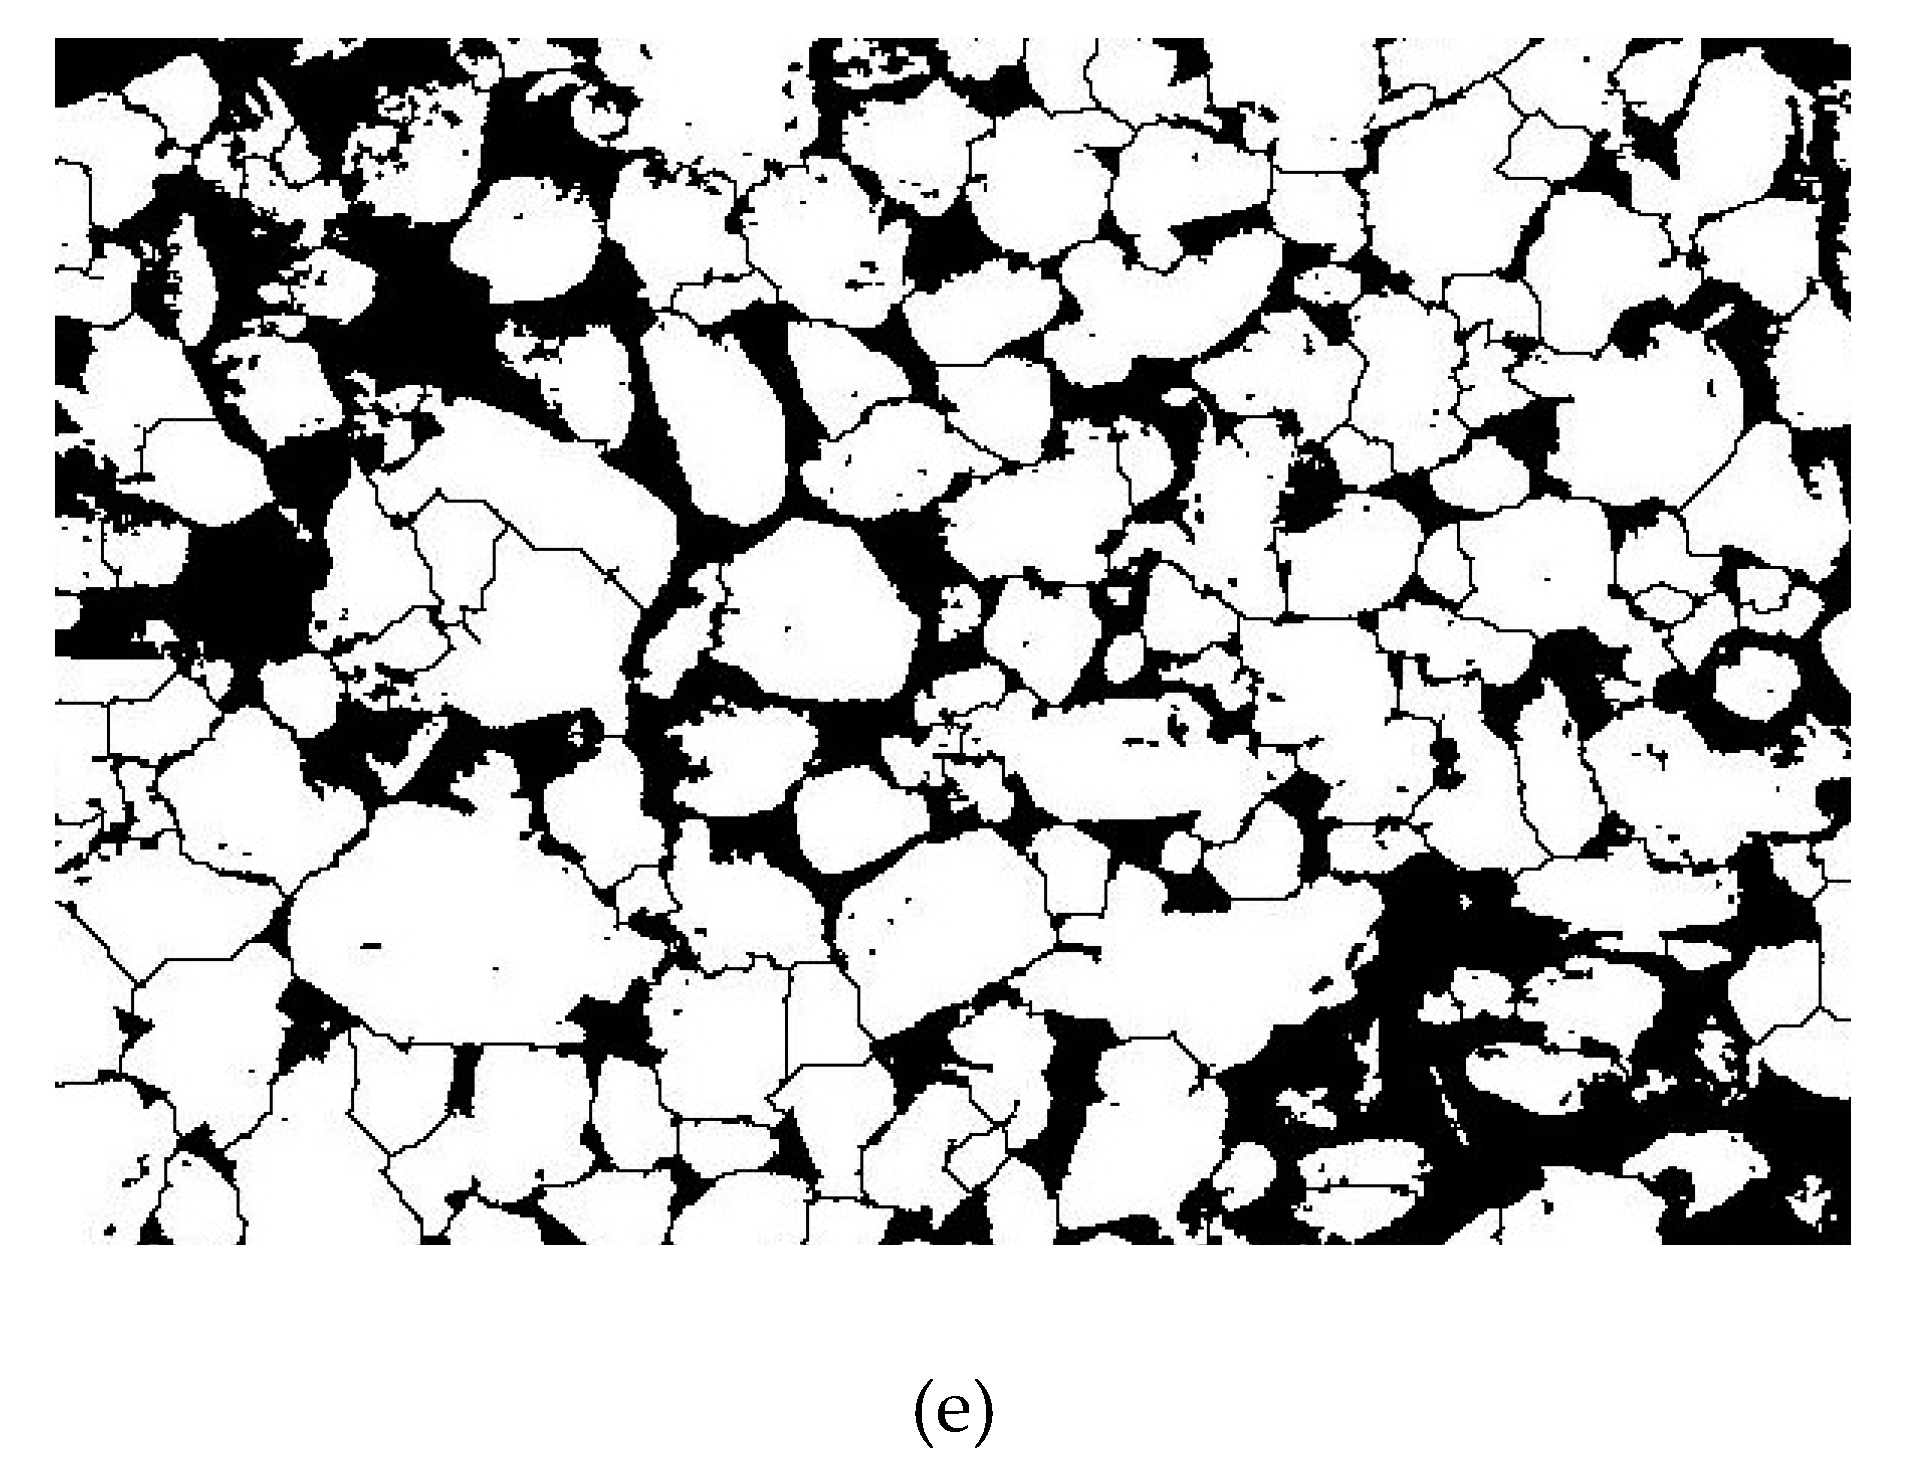
2.2.4. Image Processing and Data Acquisition

Matlab 2014a (MathWorks, Inc., Natick, MA, USA) has a dedicated image processing toolbox. This image processing toolbox contains specialized grayscale and color image display functions and a rich library of image processing functions. From basic image enhancement to image segmentation, Matlab provides simple function calls to implement many classic image processing methods. In addition, Matlab provides read-write and display support for a variety of image file formats such as TIF, BMP, JPG, and so on. Therefore, Matlab software was used in this paper to process images so as to eliminate errors caused by uneven image brightness and other factors in the test results.
Image processing contains the pre-processing, image binarization and image segmentation. Figure 6 shows the image processing process using Matlab. Firstly, the photos were preprocessed to eliminate the uneven background and enhance the contrast. Then, the gray histogram of the image was extracted, and the image was binarized. The threshold of image binarization was the gray level corresponding to the gray histogram peak. Finally, the image was segmented reasonably.
Image-Pro Plus (IPP) 6.0, (Media Cybernetics, Inc., Rockville, MD, USA) has a powerful image information extraction function. In this paper, IPP was used to extract various microstructural parameters of the image, including the maximum diameter, minimum diameter, average diameter, area, angle, roundness, fractal dimension, and other basic parameters of each particle and pore.

3. Results and Discussion

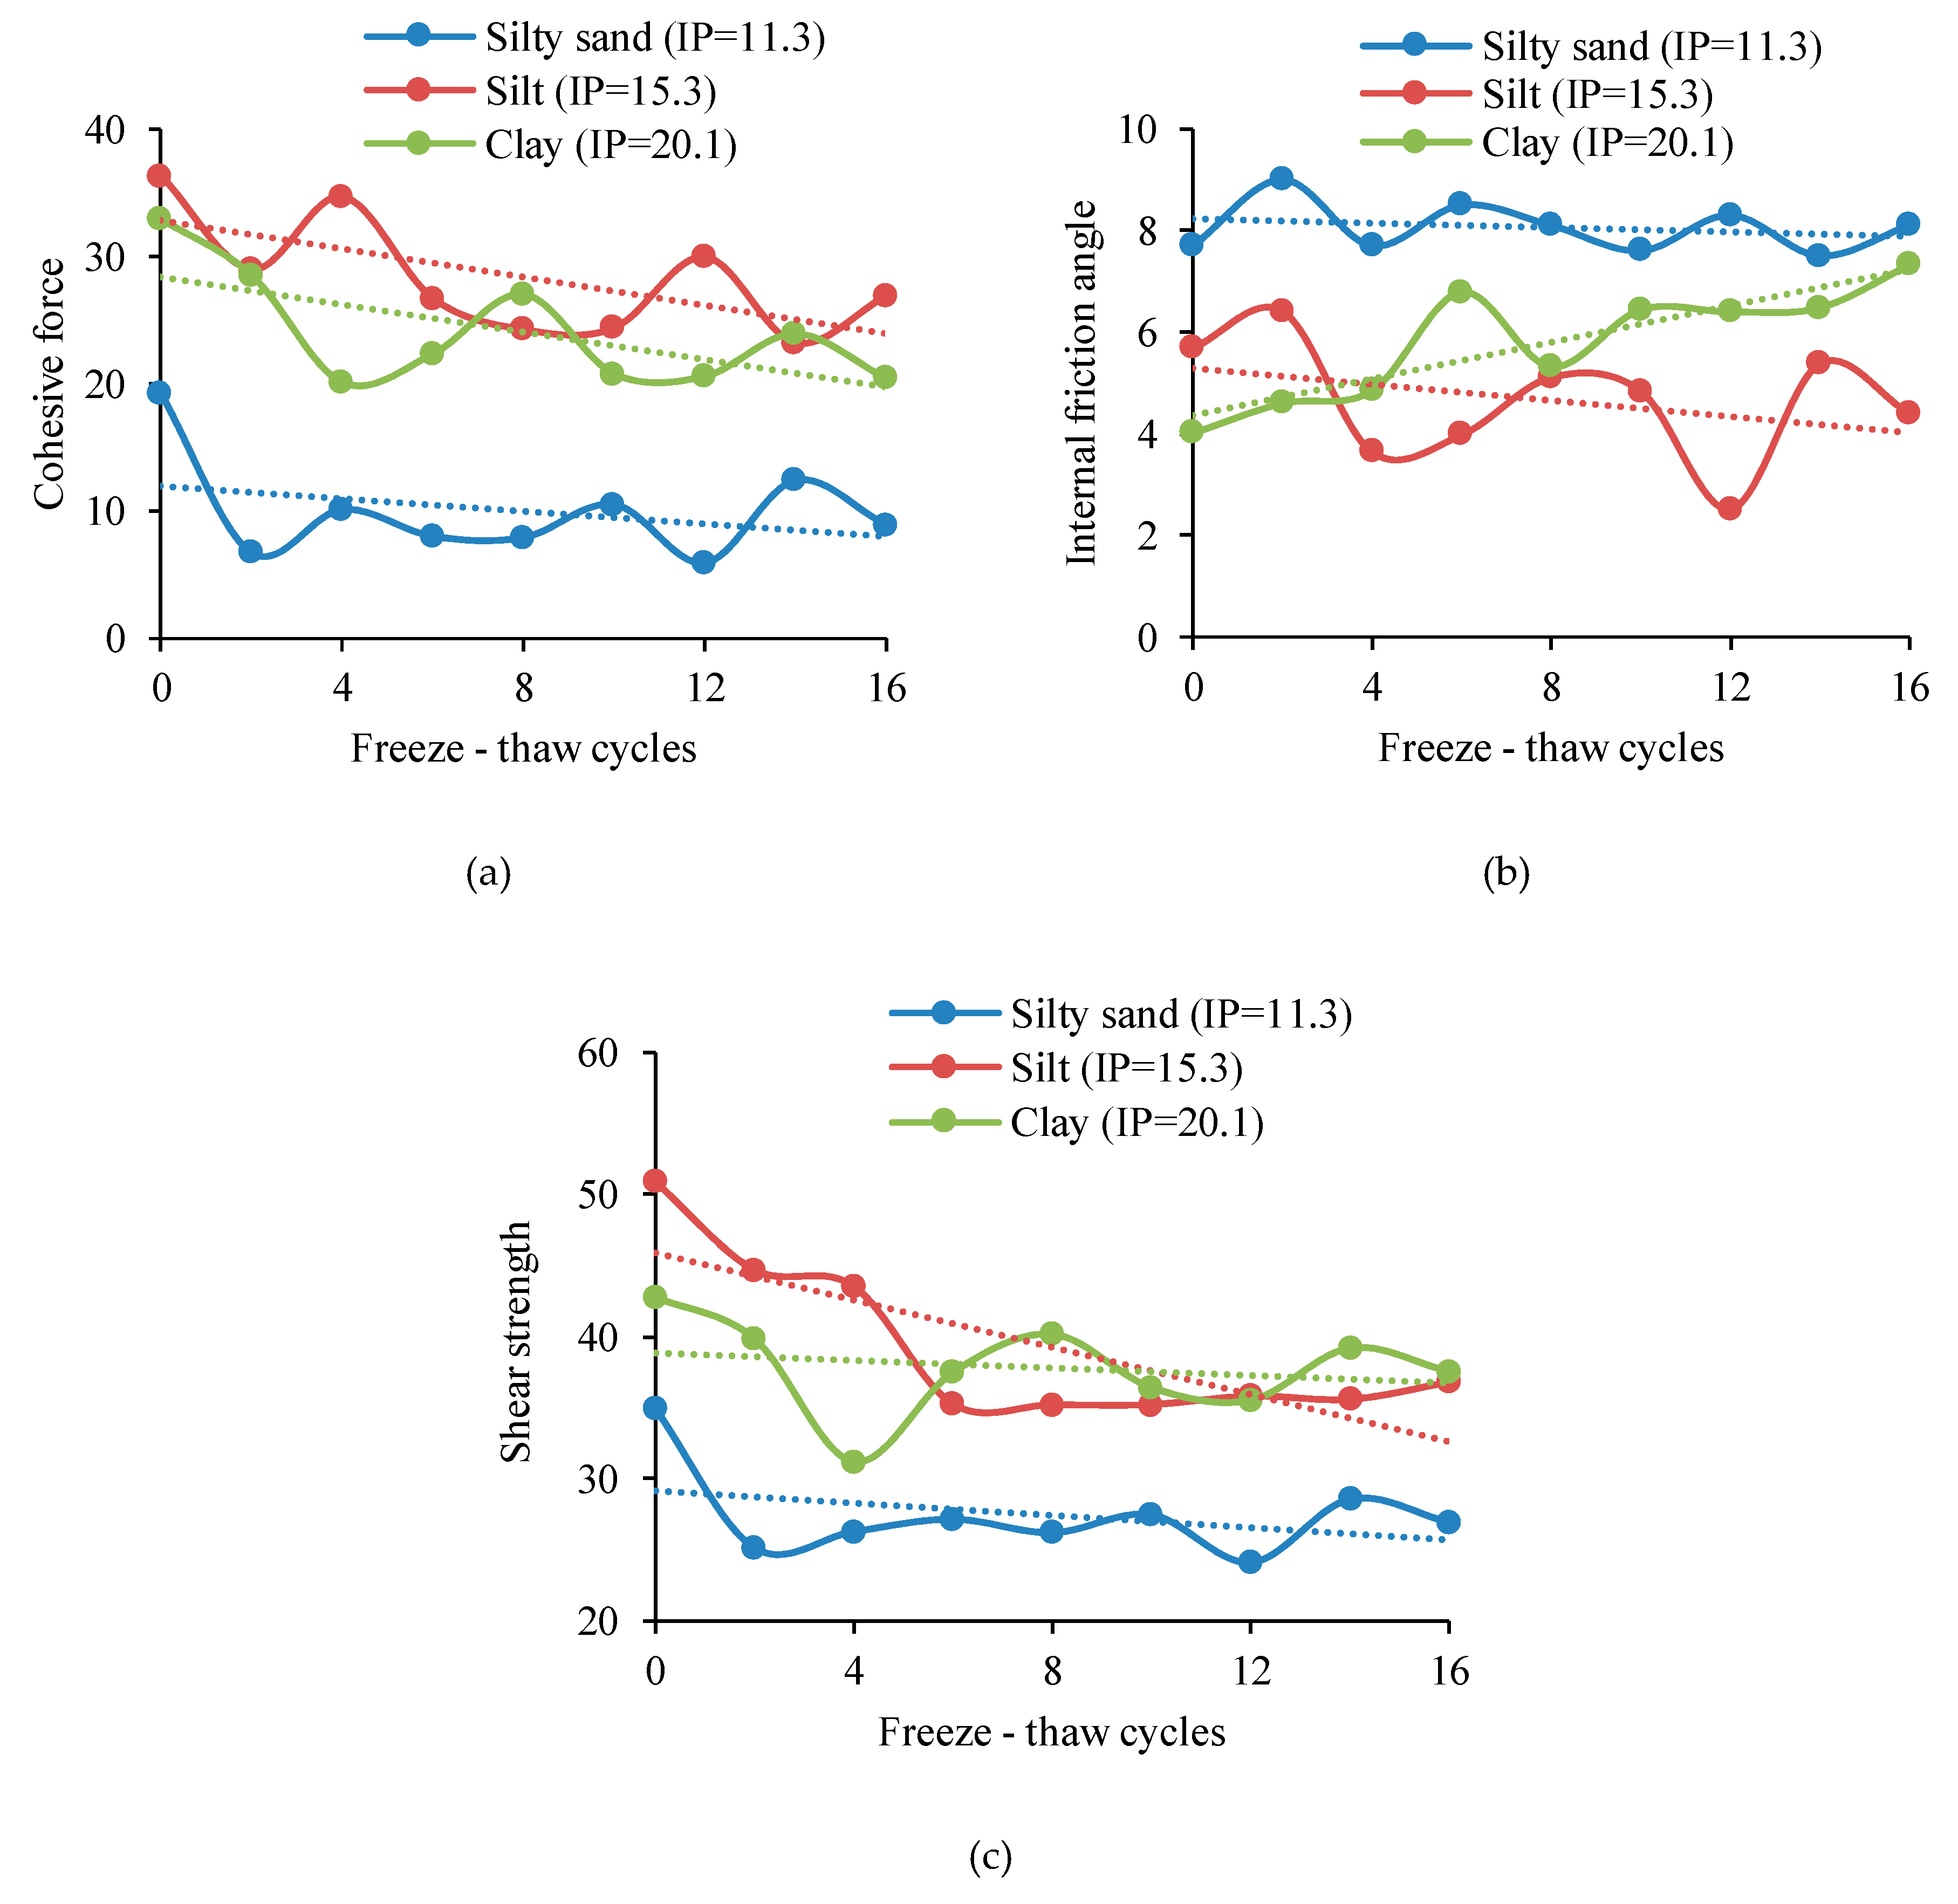
3.1. Shear Strength Parameters

As can be seen from Figure 7a,b with an increment of the number of FT cycles, the cohesion of three types of subgrade soils gradually decreases, but the angle of internal friction of three types of subgrade soils change inconsistently. After FT cycles, the angle of internal friction of silty sand changes little, but the angle of internal friction of silt decreases, while that of clay increases. In addition, the cohesion of silty sand is less than that of silt and clay, while the angle of internal friction of silty sand is greater than that of silt and clay.
As can be seen from Figure 7c, with the increase of FT cycles, the shear strength of all three soil samples decreased. The shear strength of silt sand decreased by 31.1%, that of silt decreased by 30.8%, and that of clay decreased by 27.1%. It can be seen from Equation (1) that cohesion and angle of internal friction are positively correlated with shear strength. For silty sand and silt, the decrease of cohesion and angle of internal friction leads to the decrease of shear strength. For clay, the increase of angle of internal friction leads to the increase of friction strength, which makes the clay’s shear strength less affected by FT cycles action.

3.2. Microstructure Parameters

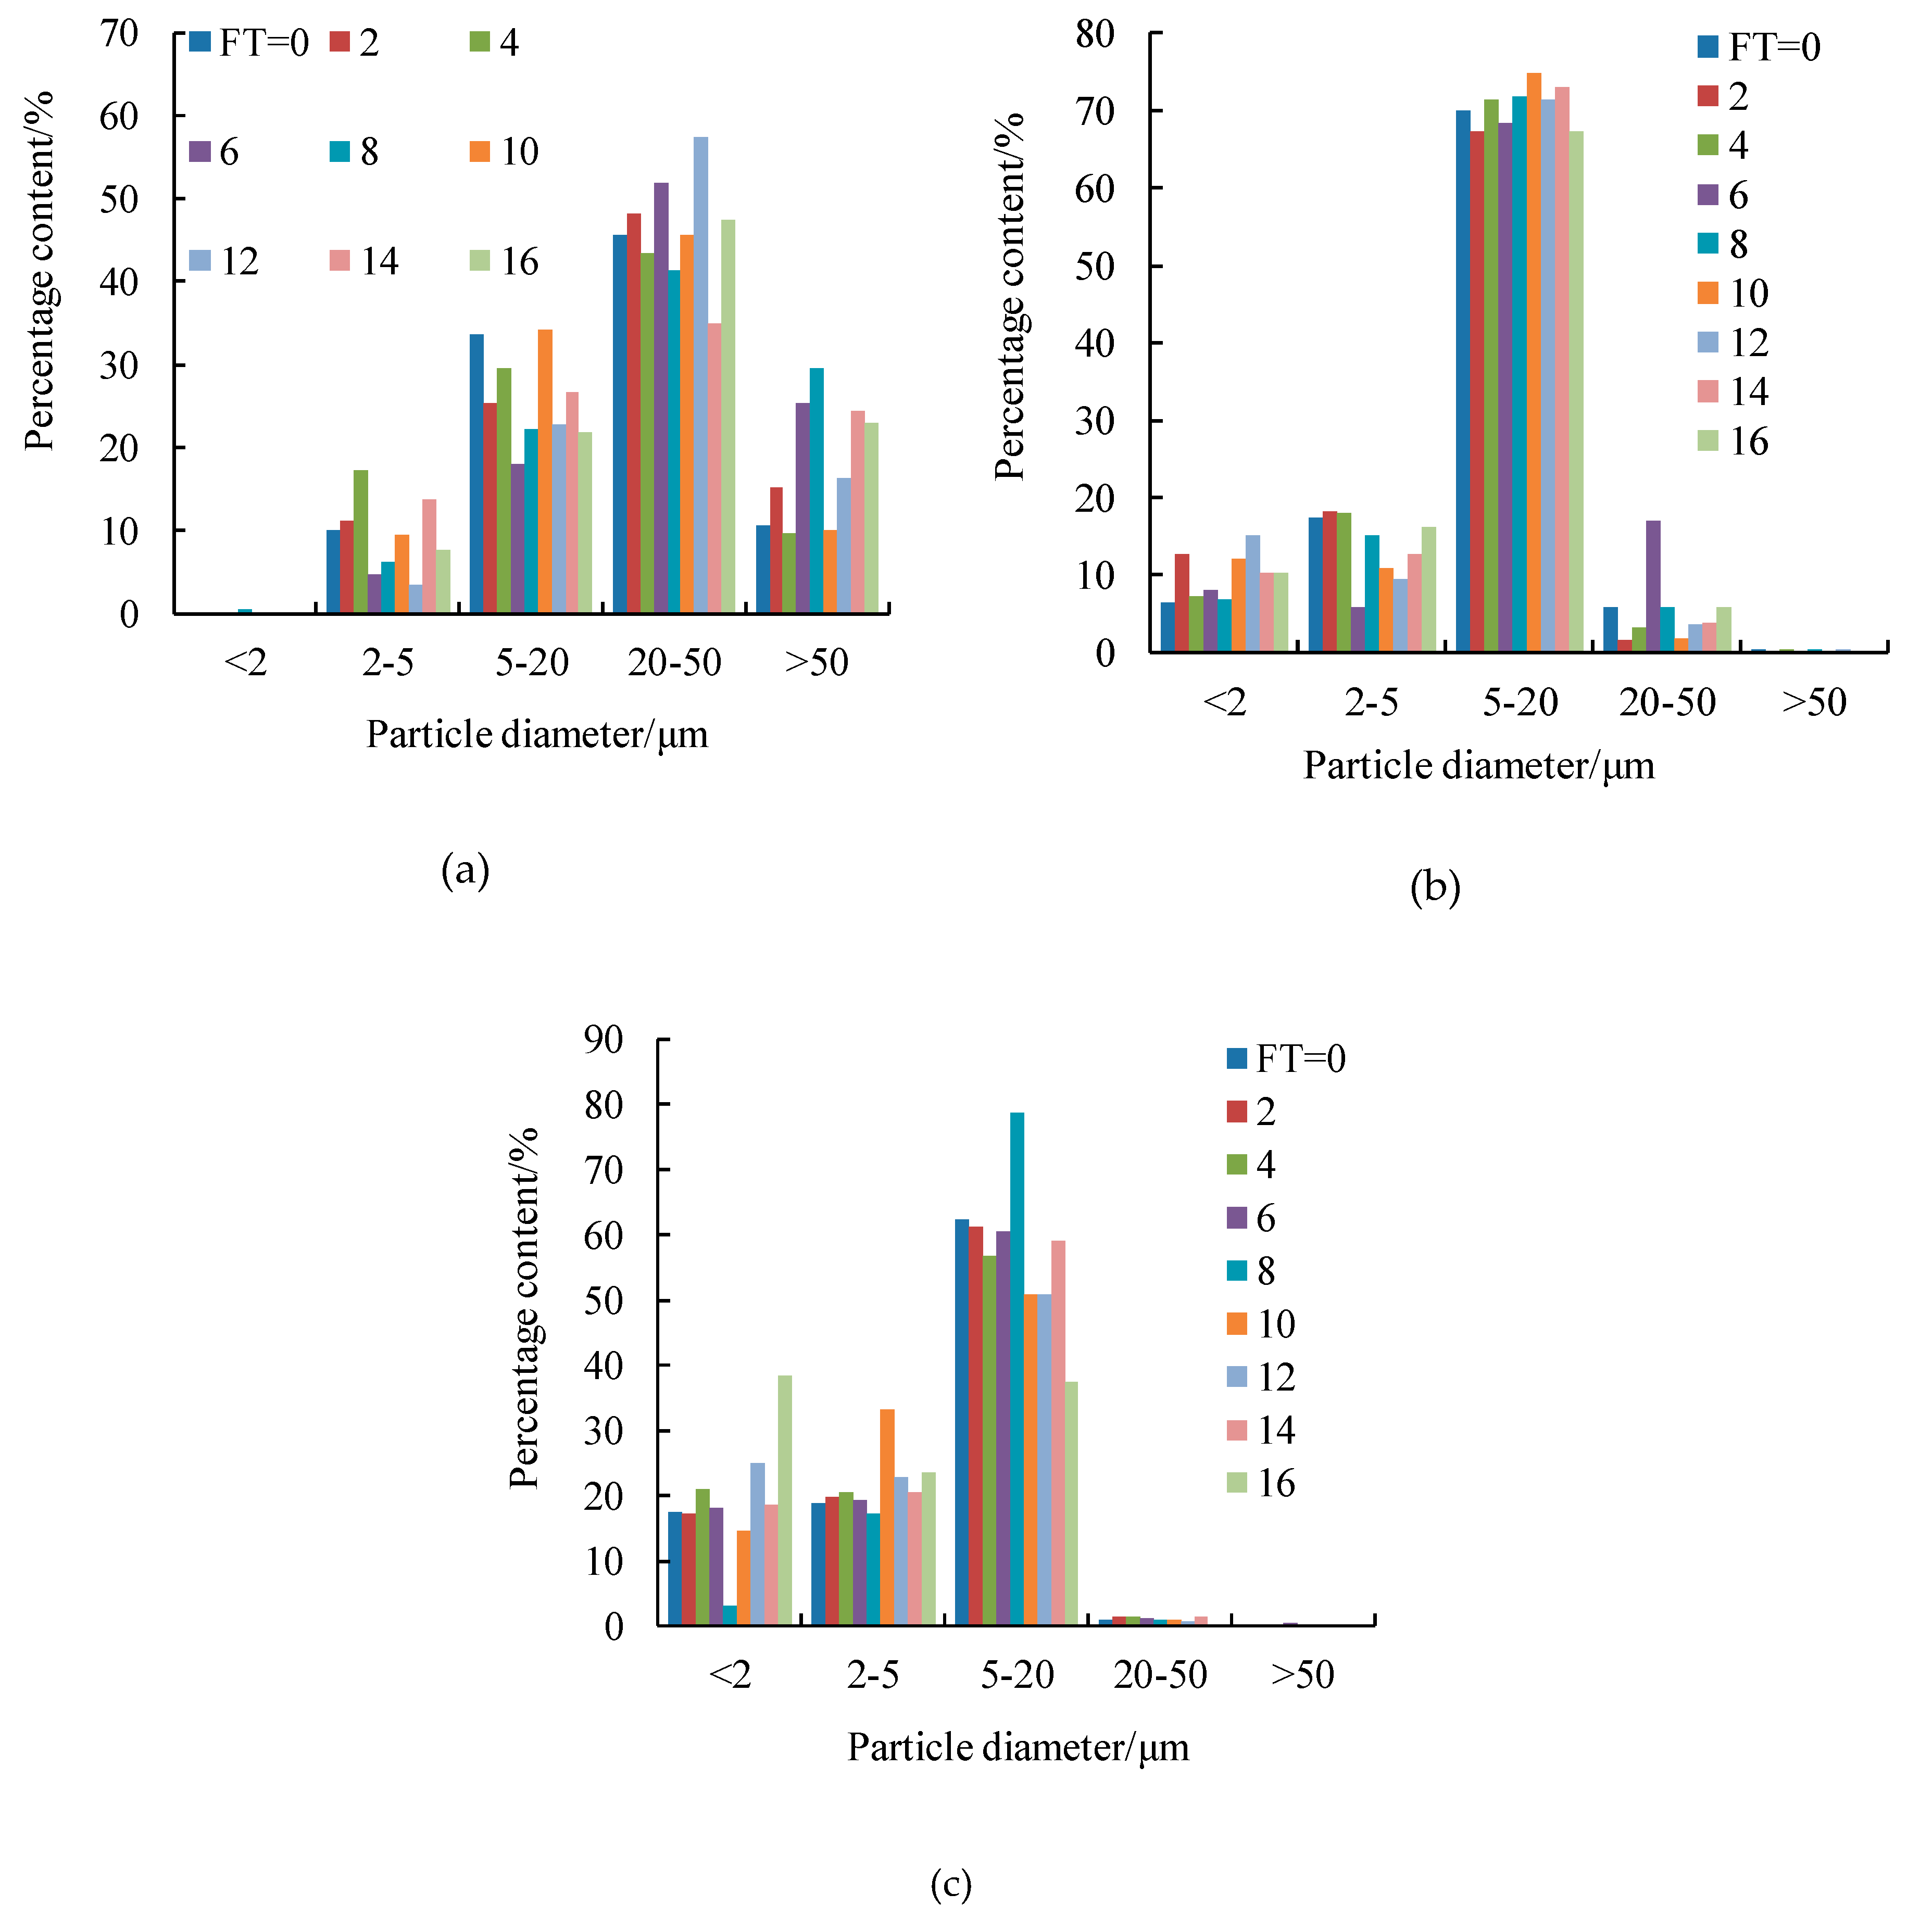
3.2.1. Particle Diameter Distribution

The particle diameter distribution can reflect the size of soil particles. In order to understand the variation rule of soil particle diameter in detail, the particle diameter was classified into five categories <2 μm, 2–5 μm, 5–20 μm, 20–50 μm, and >50 μm.
According to Figure 8, the particle diameter of silty sand is mainly 20–50 μm, while the diameter of particles of silt and clay is principally 5–20 μm. Moreover, the content of clay particles with diameters <2 μm and 2–5 μm is significantly higher than that of silt, while the content of silt particles with diameters of 20–50 μm is significantly higher than that of clay. It can be seen that with the increase of the plasticity index, there are more small diameter particles. What’s more, the particle content of silty sand decreased at <5 μm and 5–20 μm and increased at 20–50 μm and >50 μm. The particle diameter of silt did not change obviously. The particle content of clay increased in <5 μm and 5–20 μm and decreased in 20–50 μm. This indicates that the FT cycles enhance the thaw settlement of silty sand and the frost heaving of clay.

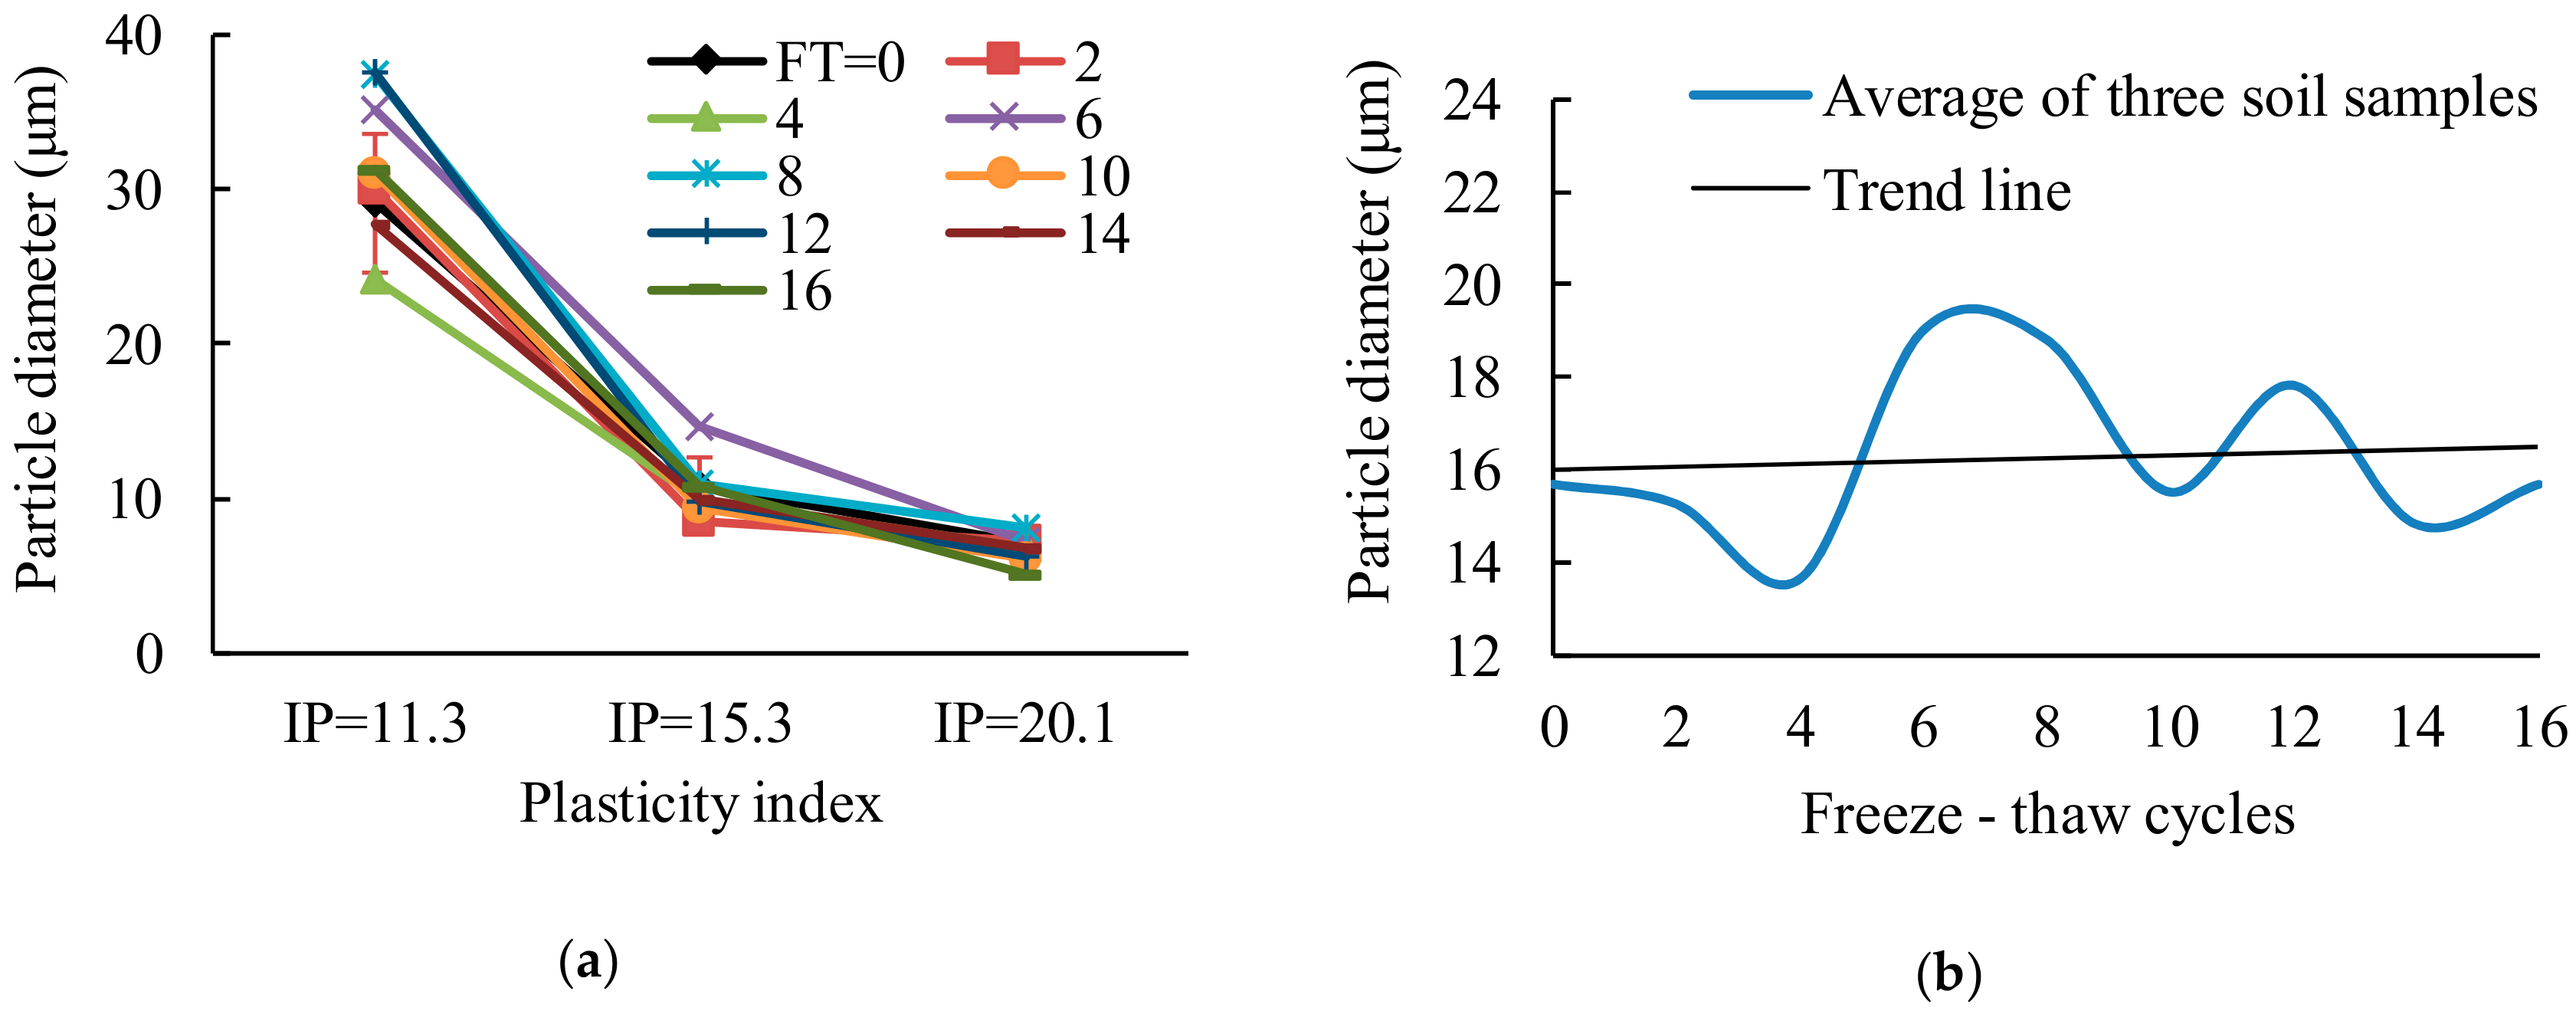
3.2.2. Particle Diameter

The particle diameter means the average diameter of all particles calculated by the microstructural pictures.
With the increase of the plasticity index, the particle diameter of soil decreases in Figure 9a, which is consistent with the results of particle diameter distribution. The particle diameter of silt sand is greater than 20 μm, while that of silt and clay is less than 20 μm. Furthermore, with the increase of the plasticity index, the diameter of soil particles not only decreases, but also the sensitivity of soil to FT action decreases. Figure 9b shows that the diameter of soil particles increases slightly with the number of FT cycles increases. It indicates that the FT cycles increase the agglomeration of particles.

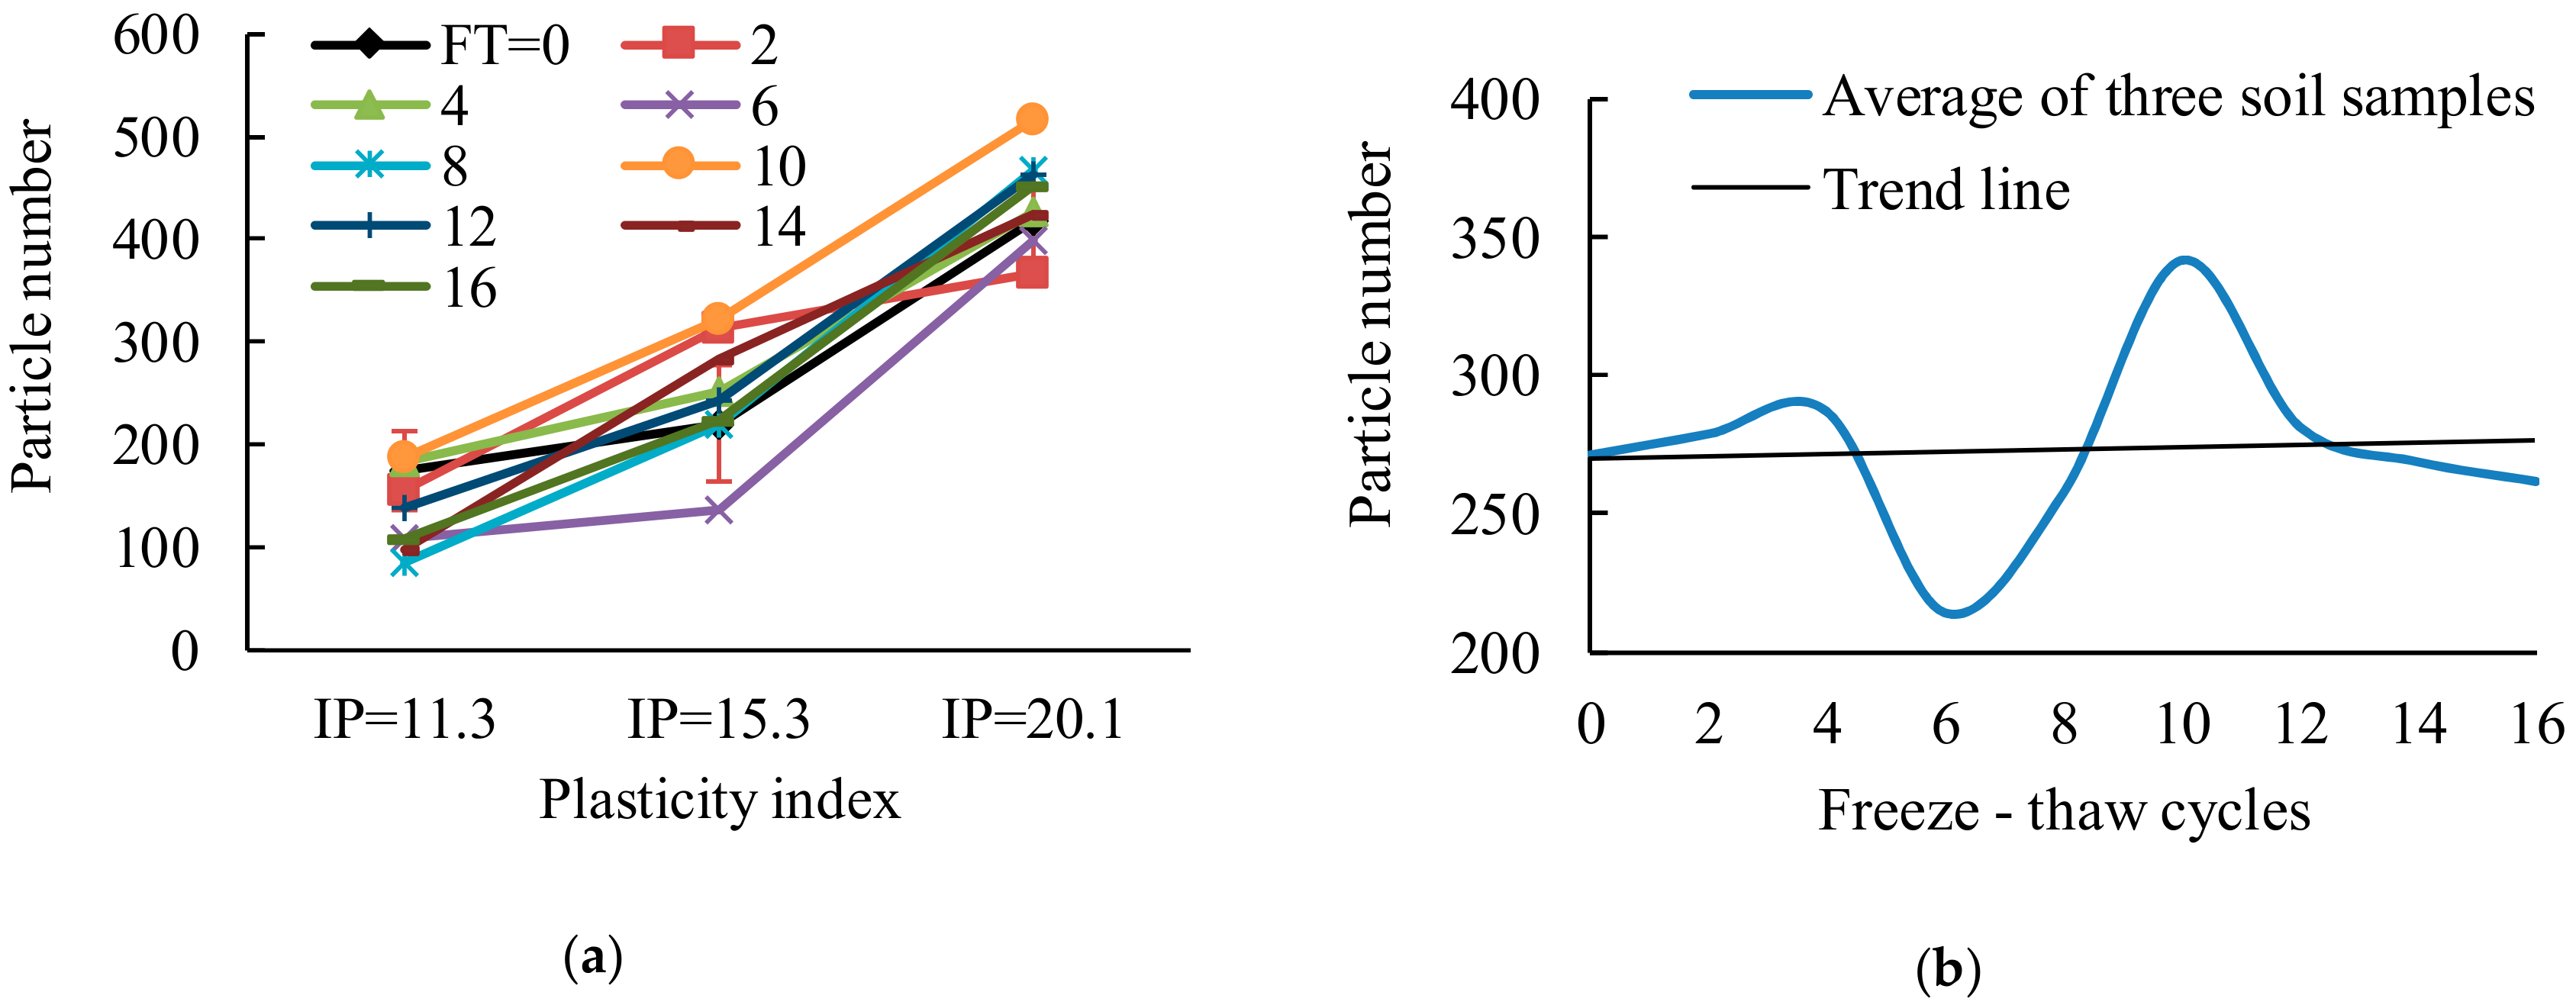
3.2.3. Particle Number

The number of particles is counted from the microstructure image using image analysis software.
As shown in Figure 10a, the number of soil particles increases with the increase of the plasticity index. This indicates that the soil with a large plasticity index has more small diameter particles. It can be seen from Figure 10b that with the effect of FT on the soil, the number of soil particles increases and decreases for many times, but generally remains stable. This shows that the soil particles reunite and split several times during the FT process.

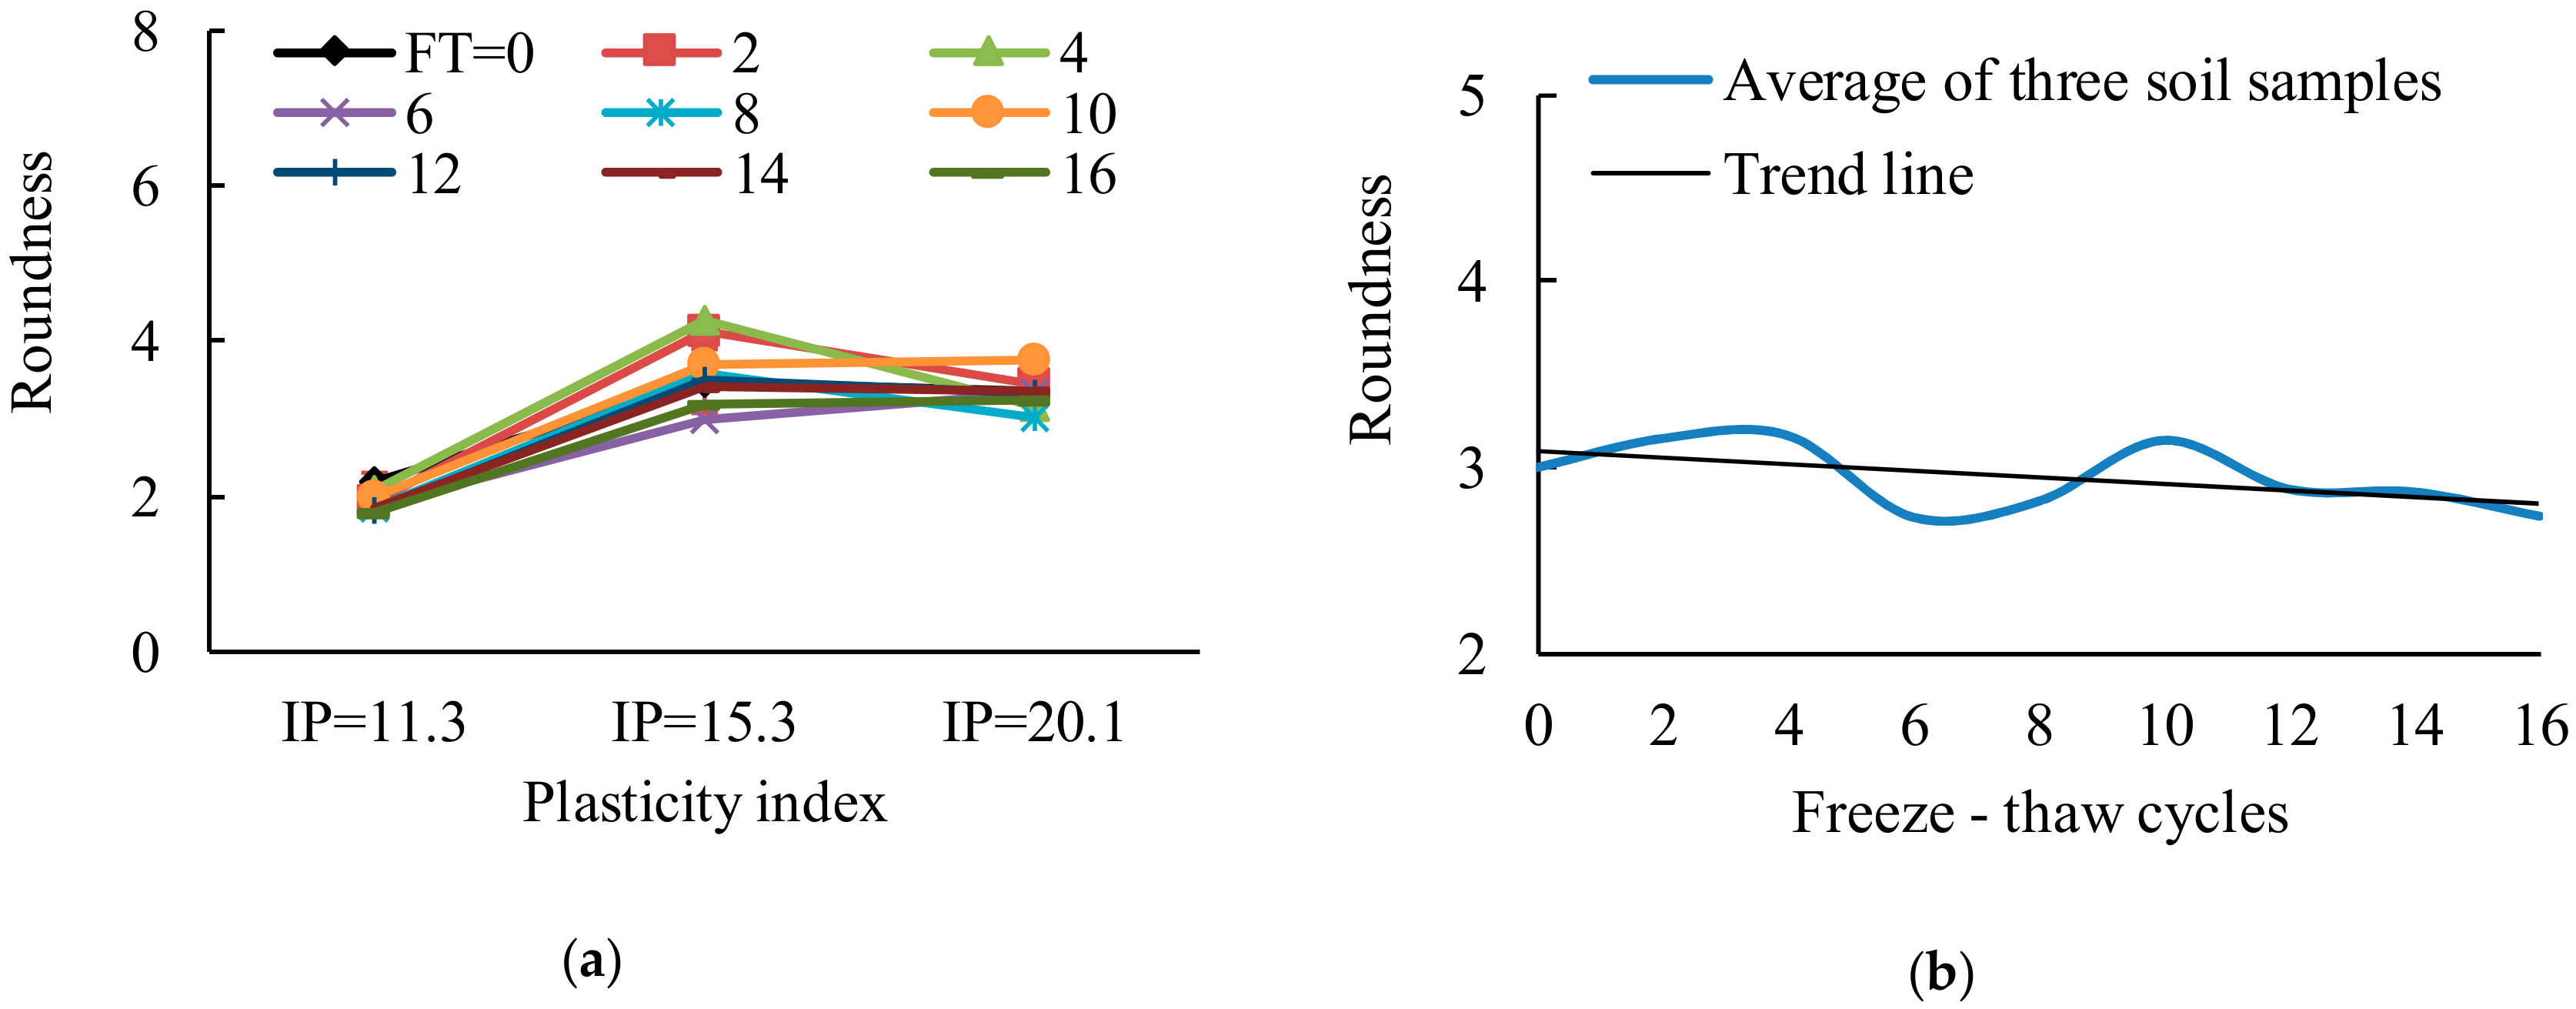
3.2.4. Particle Roundness

The particle roundness means the degree that each particle tends to be rounded. The roundness of a circular object is 1, and the roundness of other shapes is greater than 1. Generally, roundness can be calculated by the following Equation (2):
Roundness = perimeter 2 4 × π × area
From Figure 11a, the roundness of silty sand is obviously smaller than that of silt and clay. This indicates that the soil particles of silty sand are rounder. Combined with the diameter and number of soil particles, it can be concluded that the soil particles of silty sand have a larger diameter, rounder shape, and smaller number. All these characteristics make the contact area between soil particles smaller, which further weakens the chemical bonding force between soil particles. This is the essential reason for the low cohesion of sandy soil. It can be seen from Figure 11b that the roundness of soil particles tends to decrease under the action of FT cycles.

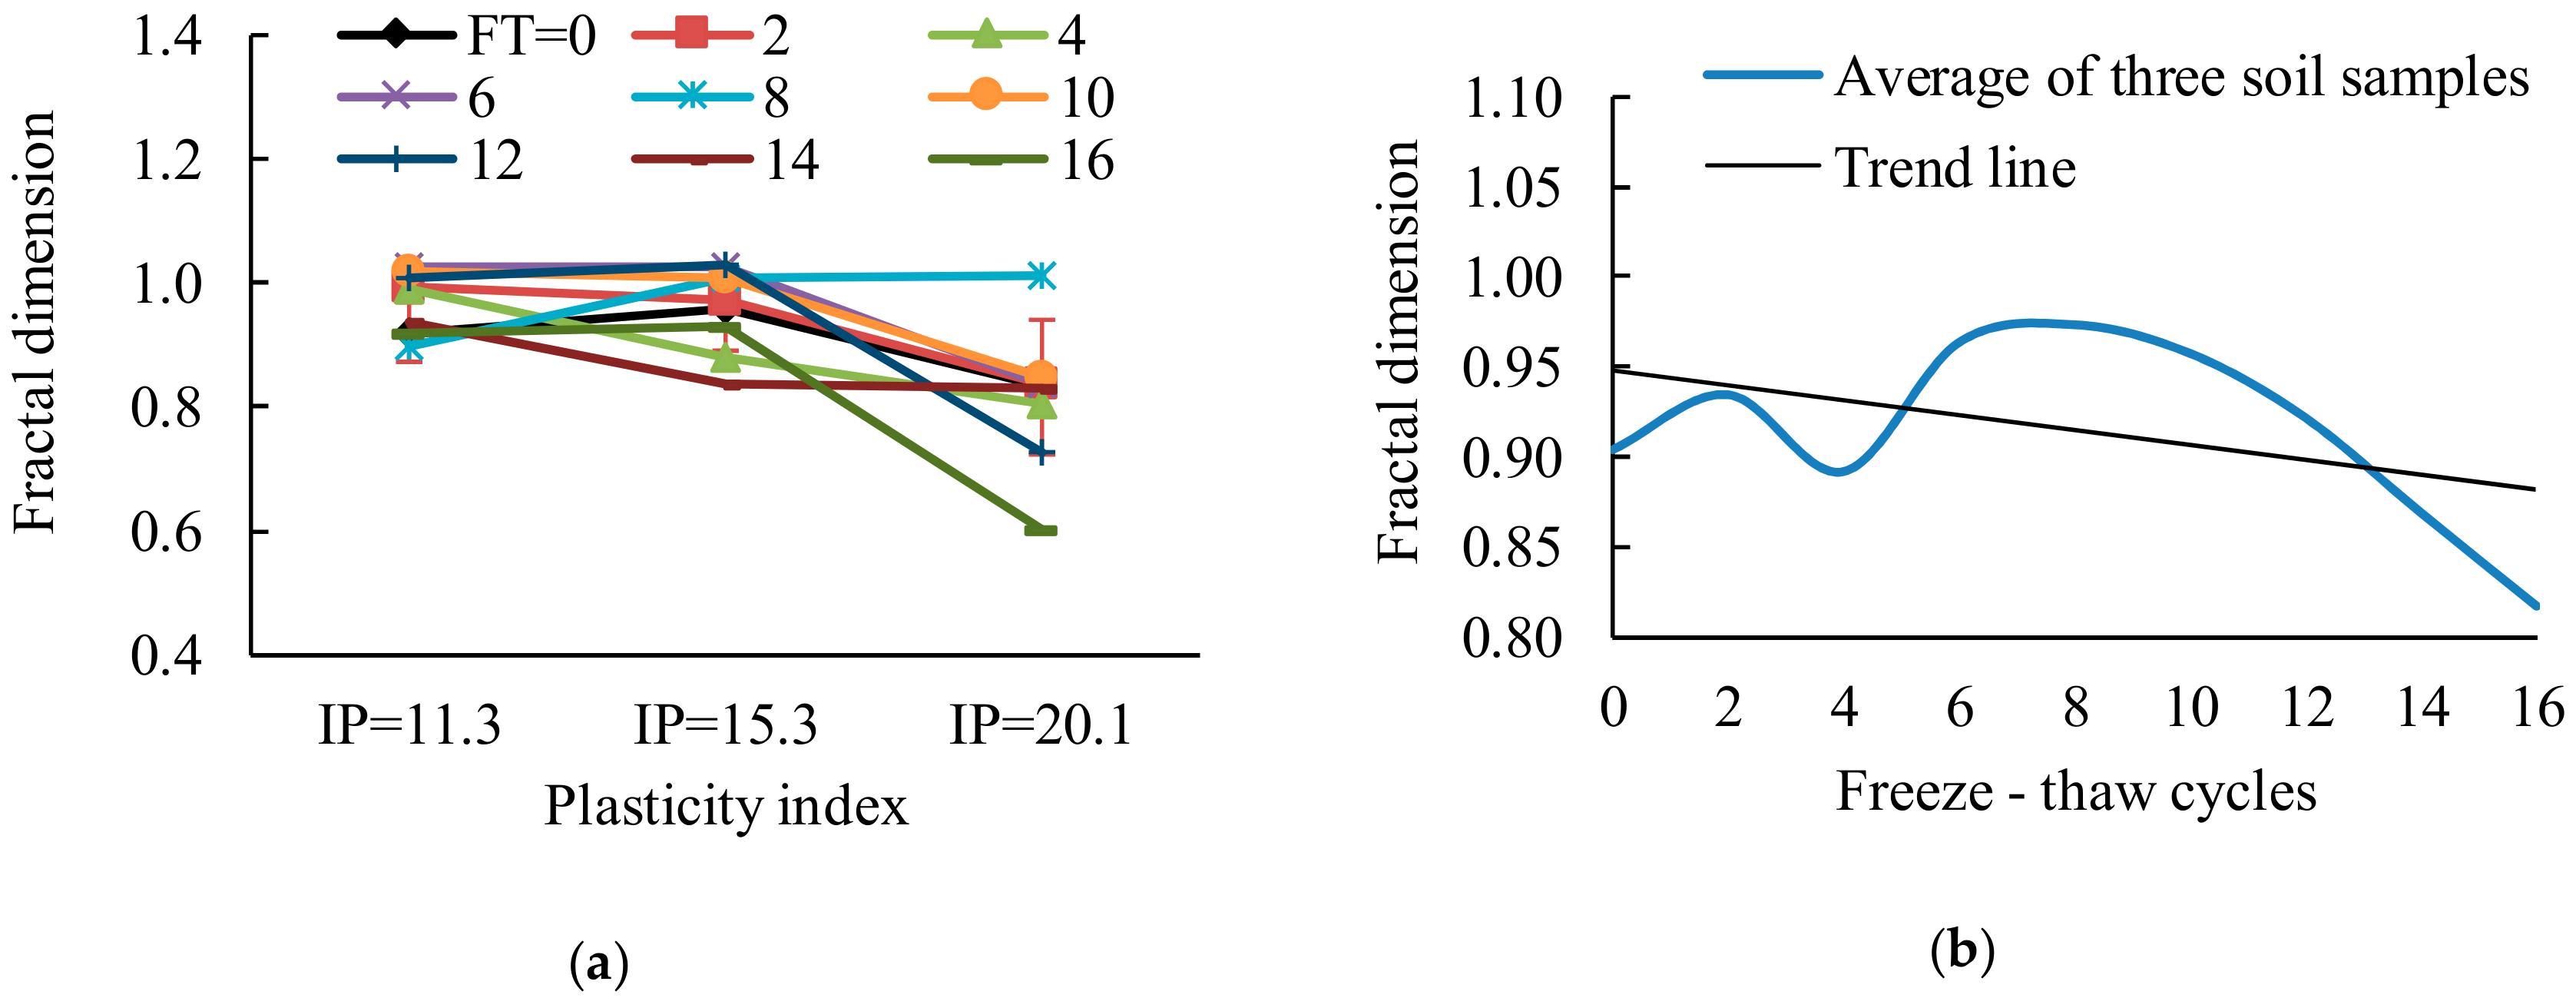
3.2.5. Particle Fractal Dimension

The fractal dimension of particle surface fluctuation refers to the fluctuation degree of the particle surface. When the fractal dimension of soil particles is larger, there are more protrusions on the surface of soil particles, and the surface of soil particles is more irregular.
As can be seen from Figure 12a, the fractal dimension of clay is more sensitive to FT action than that of silt sand and silt. Because there are many small-diameter particles and pores in clay, free water frost heaving in the soil can easily fill the pores and excess free water frost heaving will change the surface undulations of particles. Figure 12b also shows that with an increment of the number of FT cycles, the fractal dimension of soil particles gradually decreases. This indicates that the FT action can reduce the surface irregularity of soil particles.

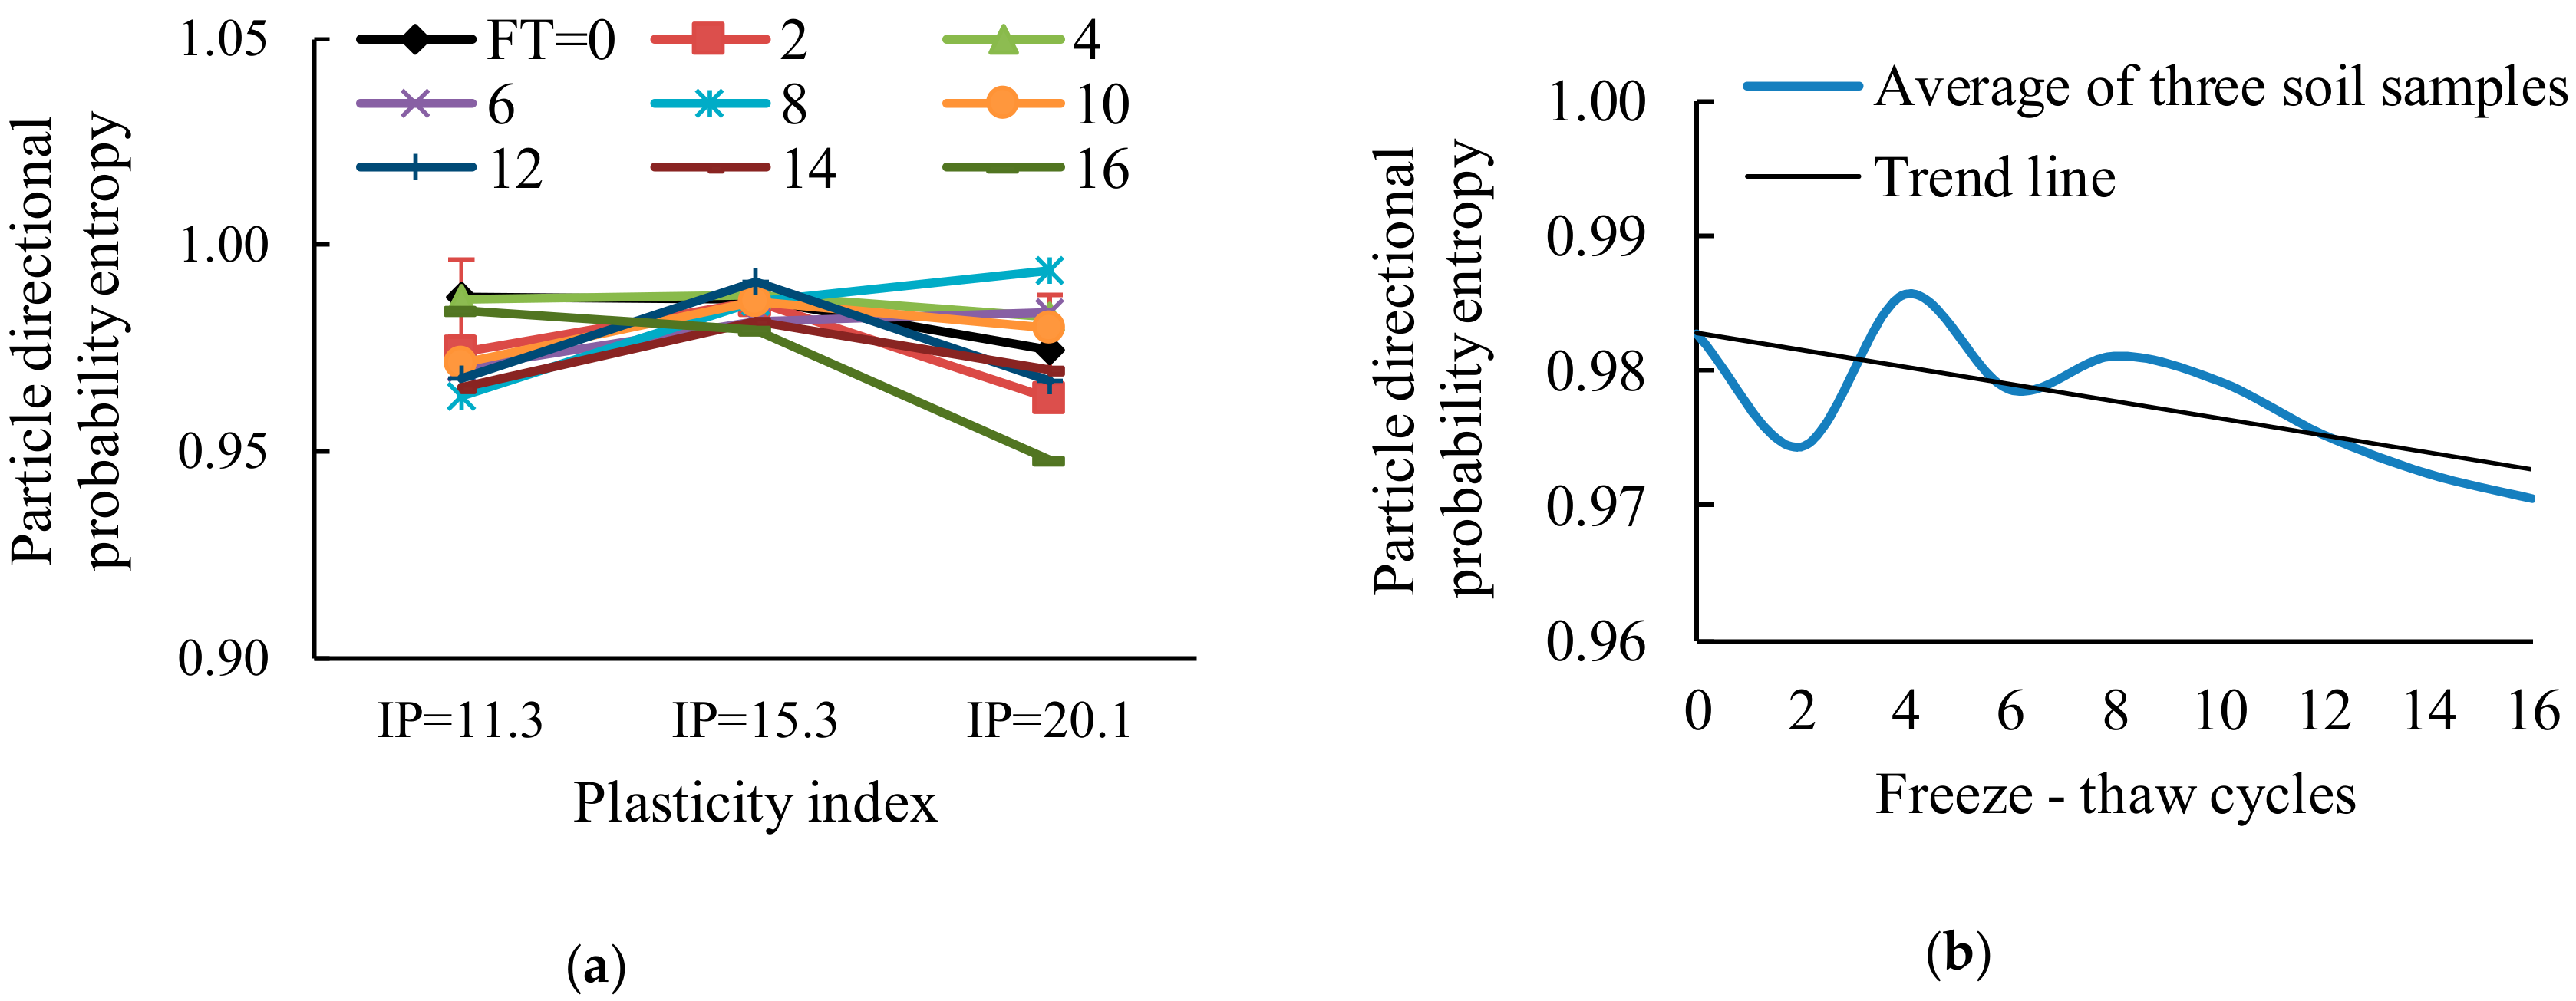
3.2.6. Particle Directional Probability Entropy

Direction refers to the measurement of the angle between the spindle and the vertical line of the object, which is extracted by IPP software. Due to the symmetrical direction of soil particle within (0, 360°), the angle value within (0, 180°) is just counted. The angle is divided into 18 azimuth regions with 10° per region, and the probability of particles in each azimuth region is calculated. The particle directional probability entropy [38] was calculated by Equation (3).
H m = i = 1 n P i log n P i ,
where Hm, n, Pi are directional probability entropy, azimuth area number, and probability of particles in a certain azimuth region, respectively.
The value range of directional probabilistic entropy is 0–1. When the directional probability entropy of soil particles is higher, the consistency of soil particles’ arrangement direction is worse.
Figure 13a indicates that the particle directional probabilistic entropy changes little with the increase of the plasticity index. Among them, the particle directional probabilistic entropy of clay is greatly affected by FT action, followed by silty sand, and silt is the smallest. It can be concluded from Figure 13b that with the increase of the number of FT cycles, the directional probability entropy of particles decreases gradually, which indicates that the arrangement direction of soil particles tends to be consistent.

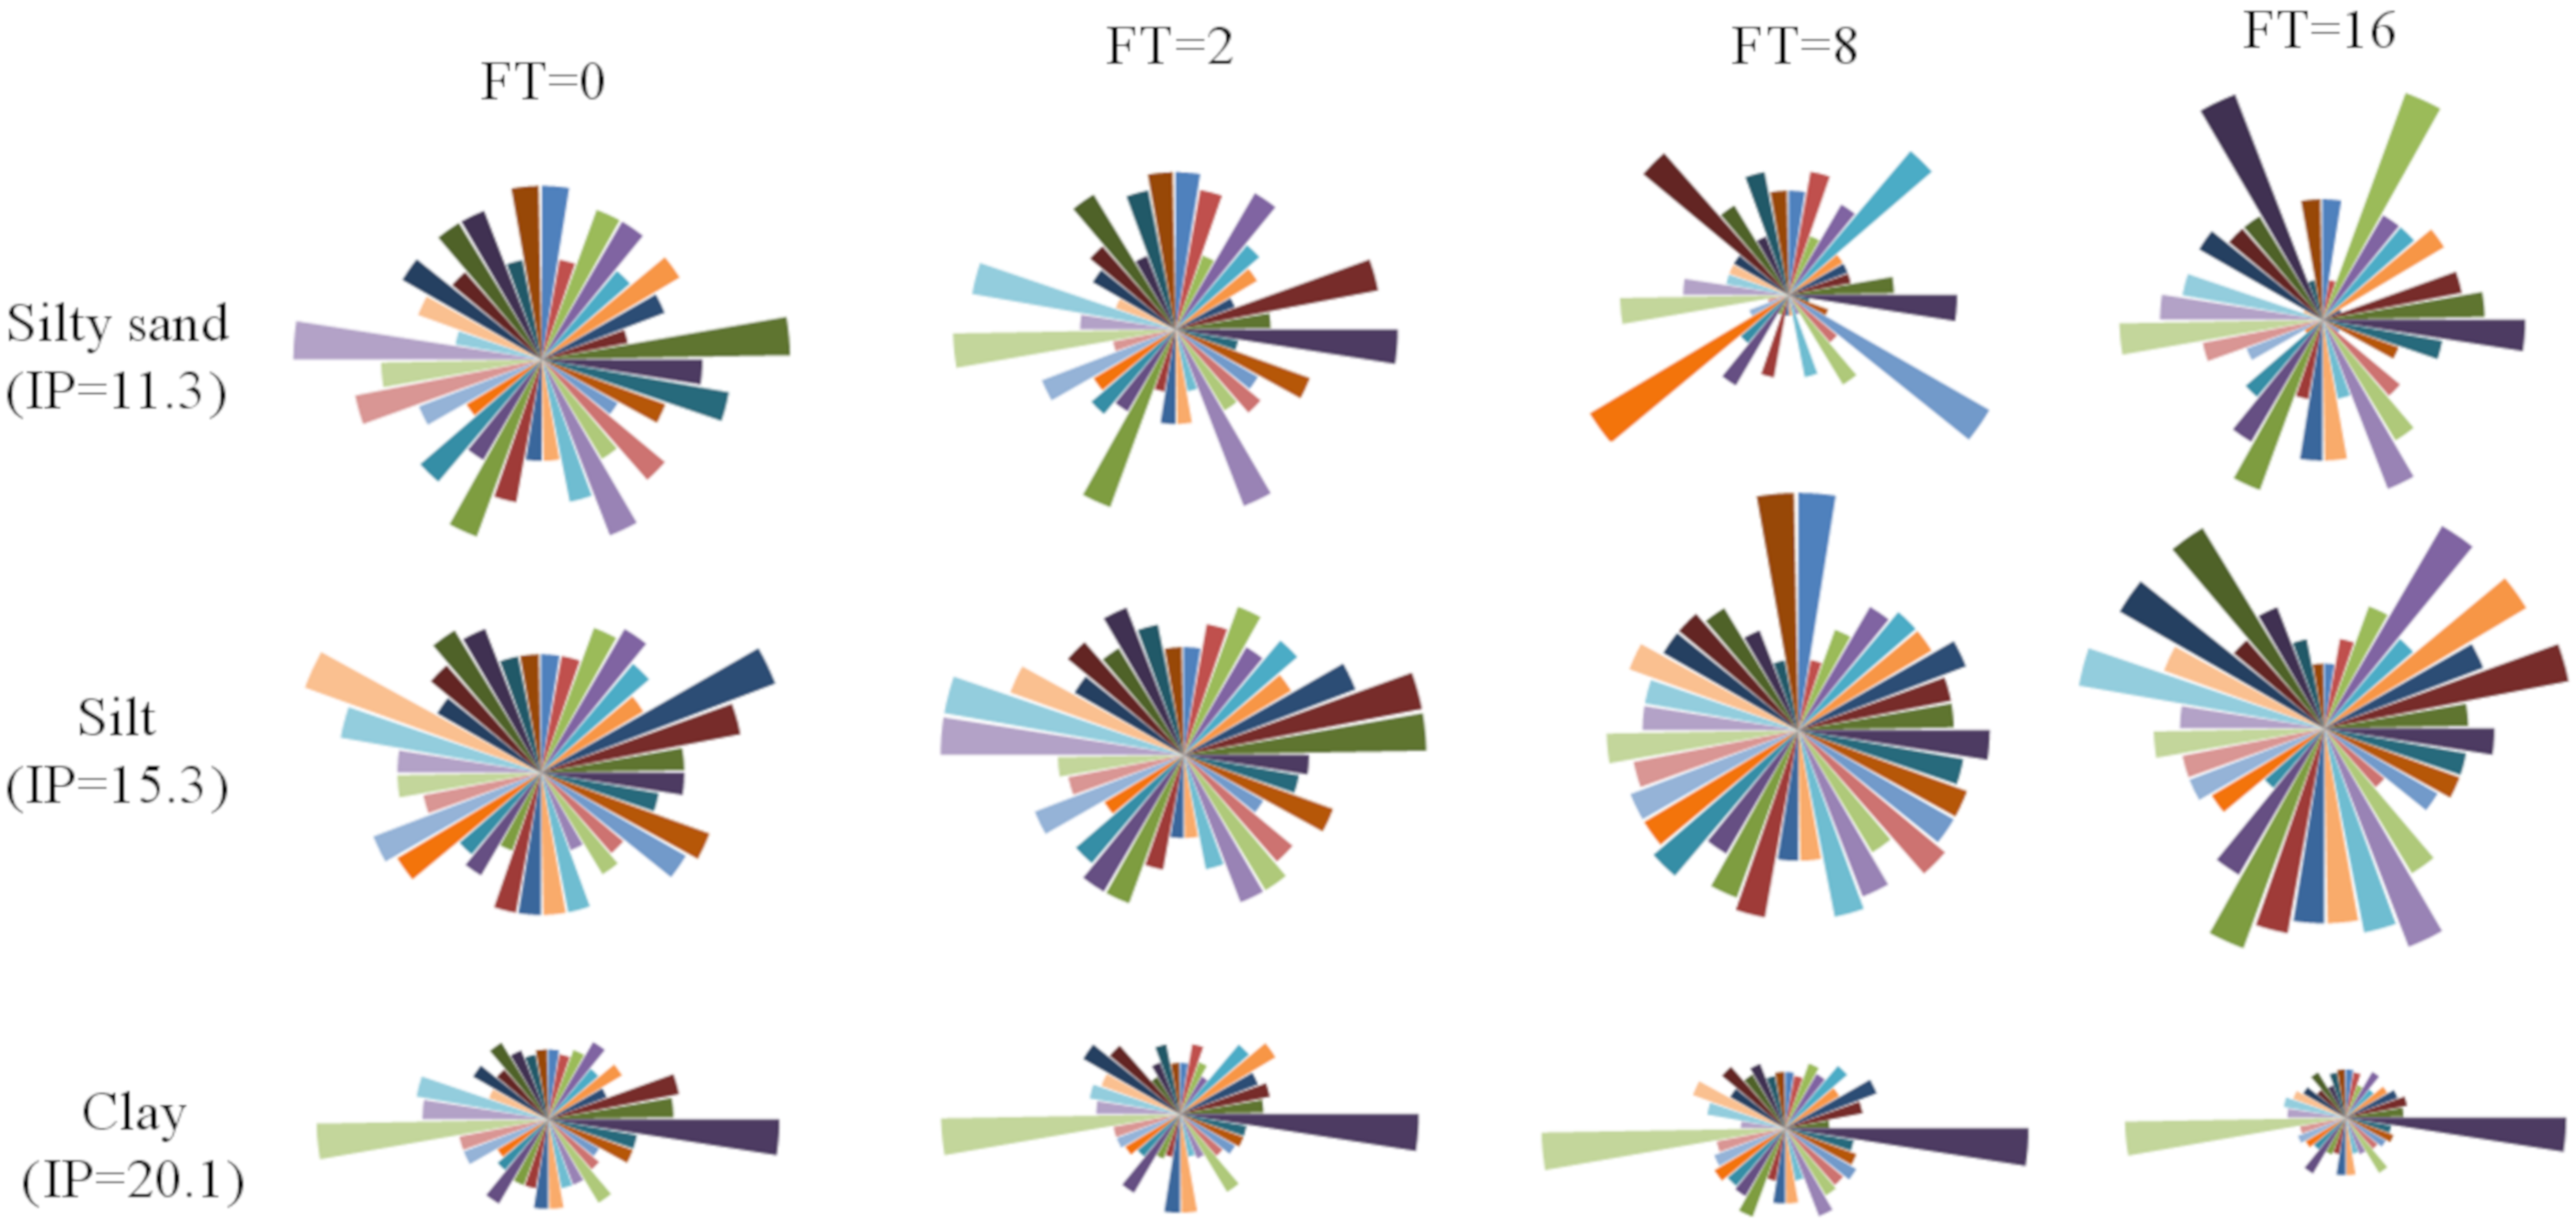
3.2.7. Particle Direction Simulation

To get a clearer picture of how the particles are arranged in all directions, the directional characteristics of particles are simulated by Nightingale diagram in Figure 14.
As can be seen from Figure 14, in the case of FT = 0, the distribution of particles in silty sand and silt in all directions is more homogeneous, while the arrangement of particles in clay in two directions is more prominent. After FT cycles, the particle direction of silty sand is concentrated in six directions, the particle direction change of silt is not obvious, and the particle arrangement of clay tend to be more concentrated in two directions. This shows that FT cycles will change the arrangement direction of particles and make the arrangement direction of particles become consistent

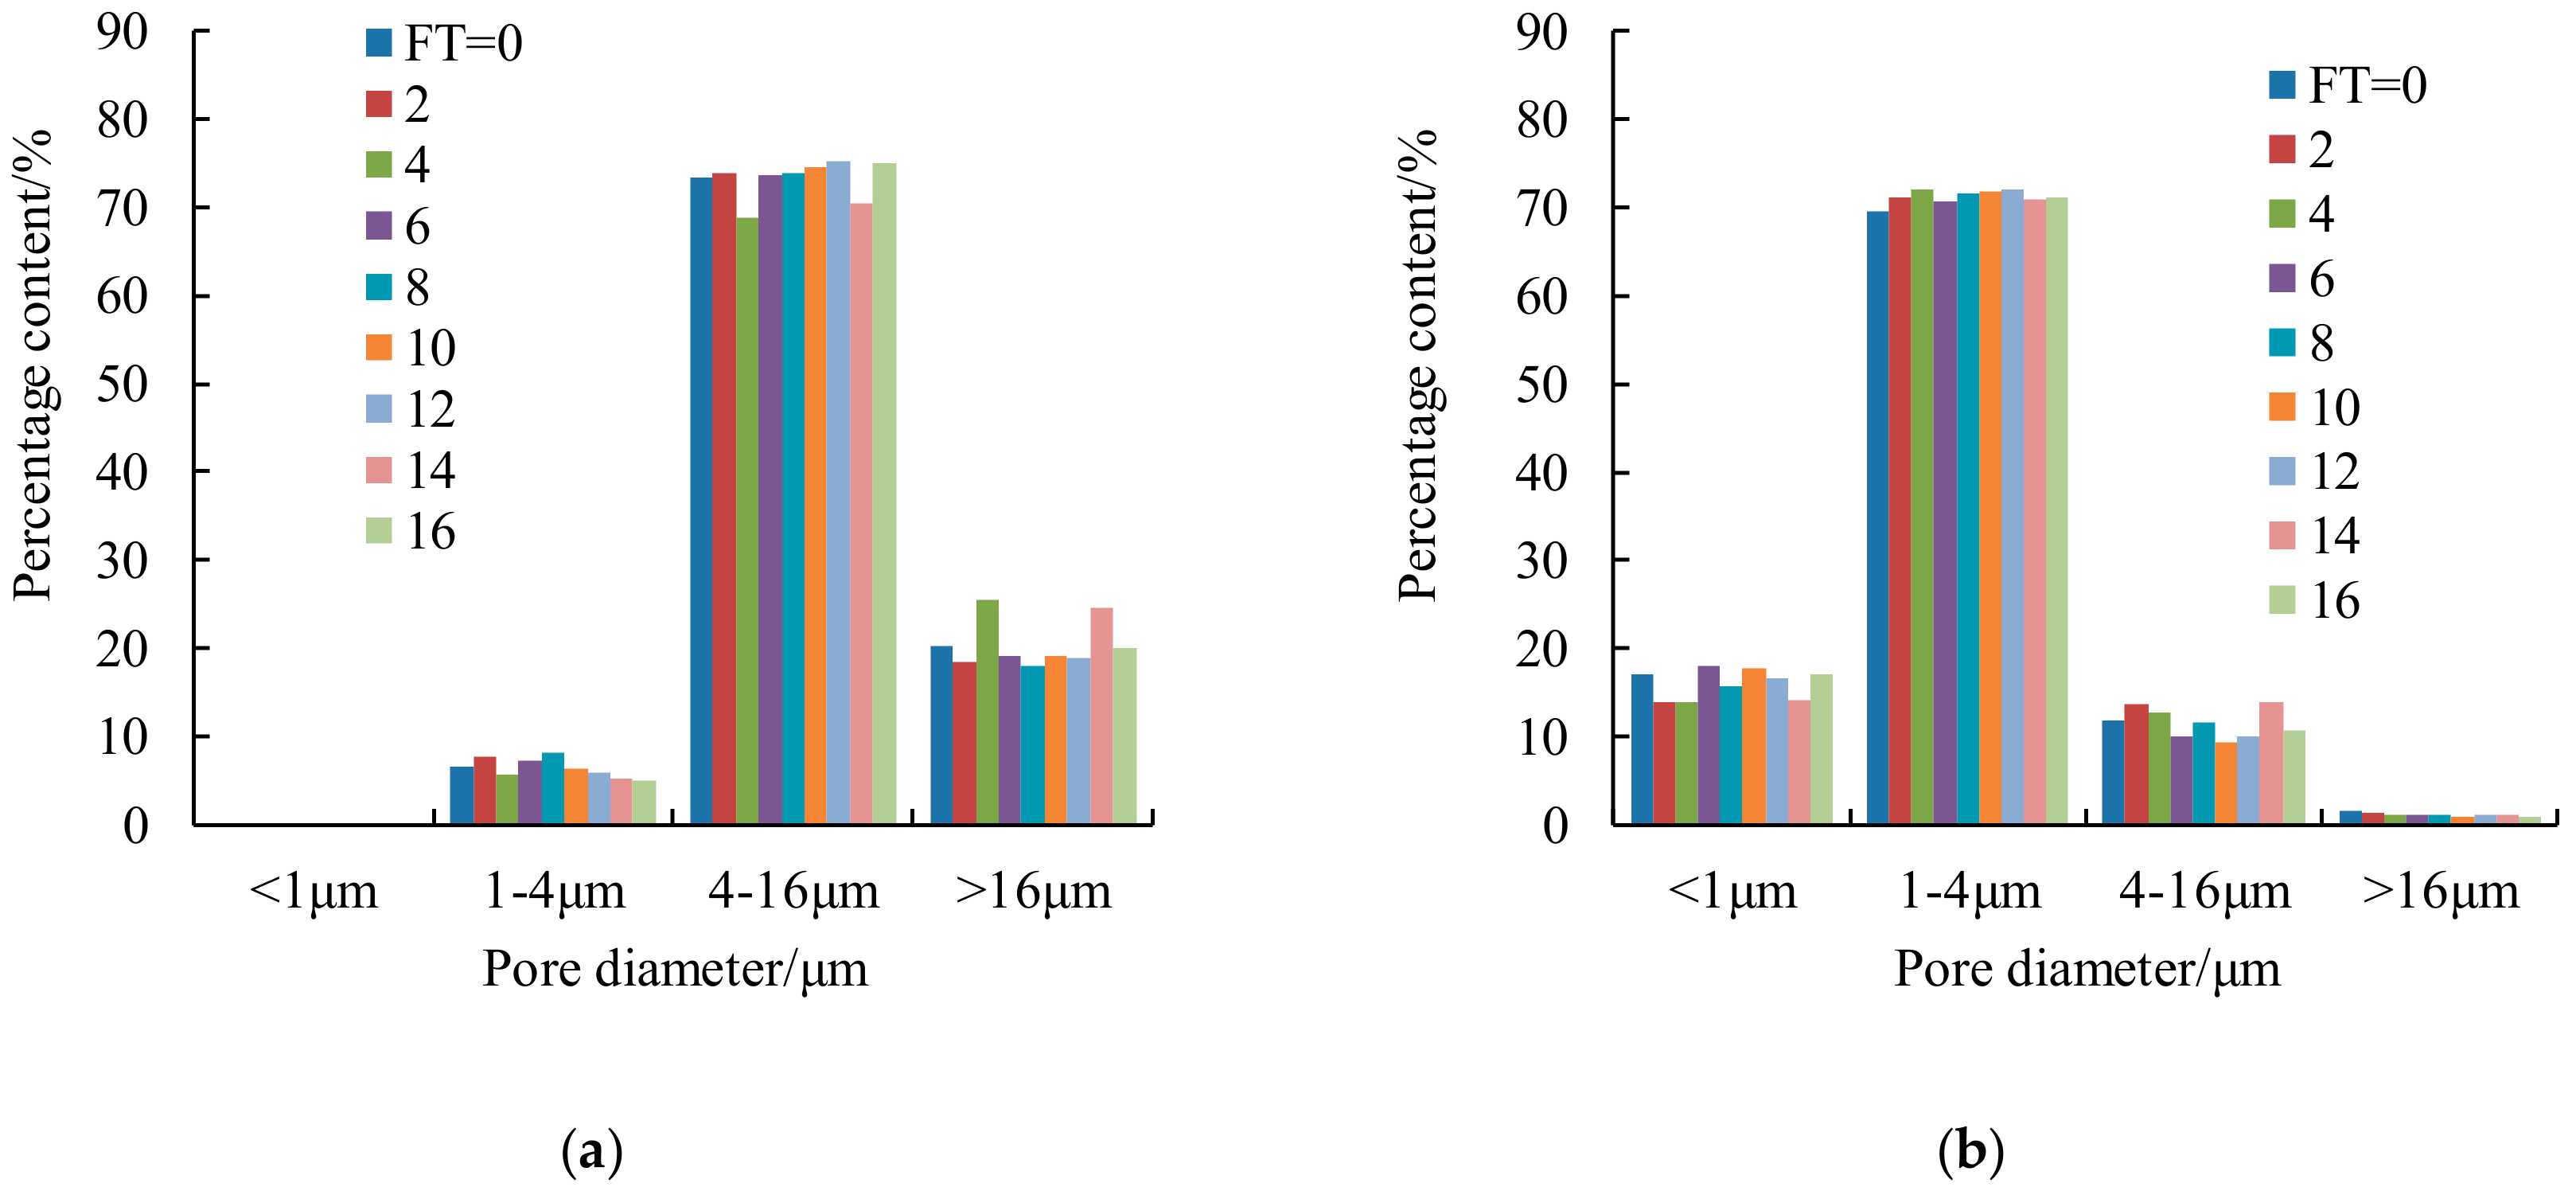
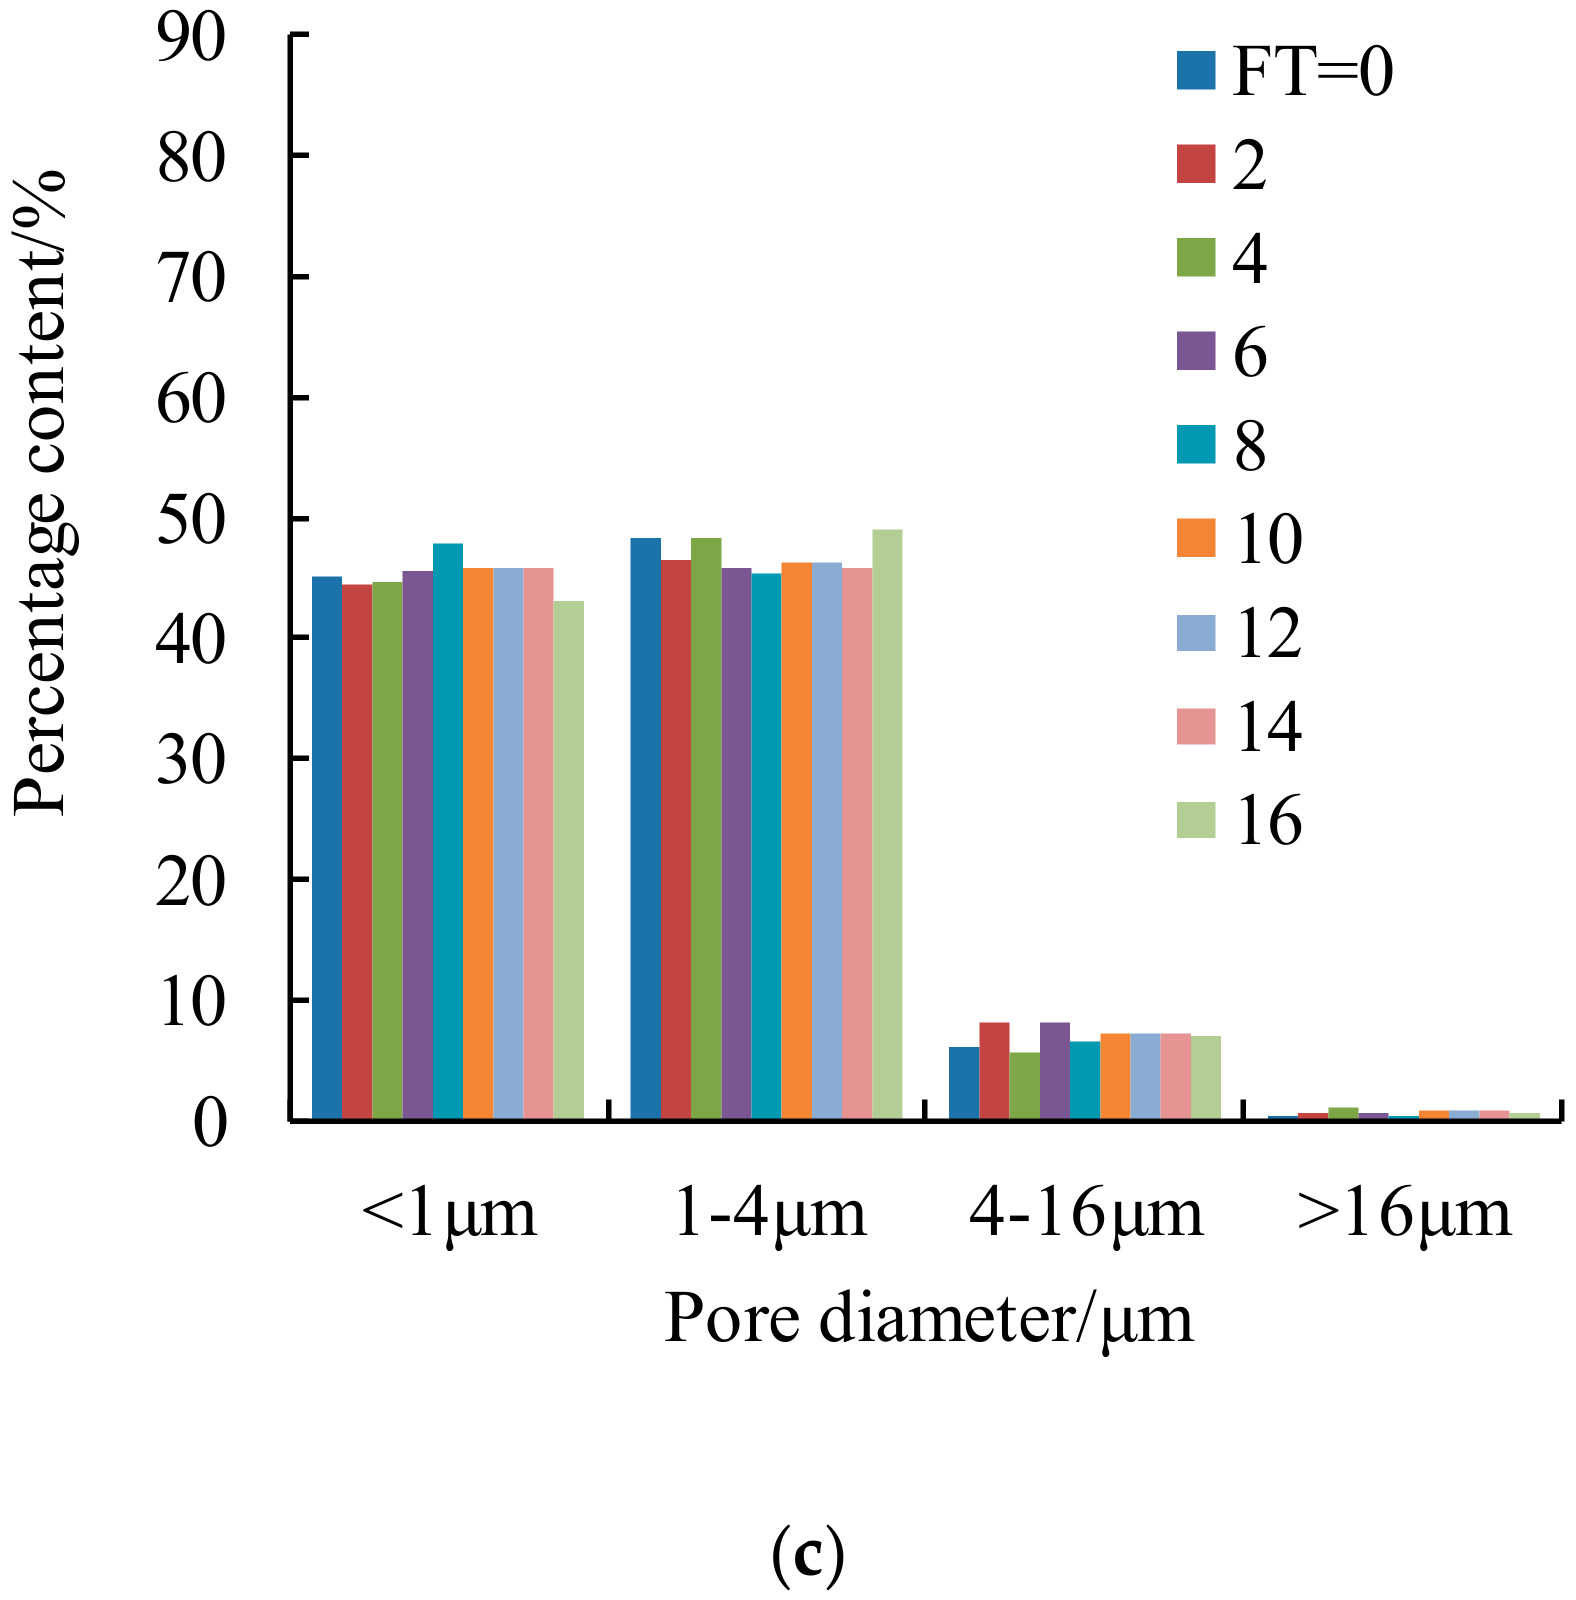
3.2.8. Pore Diameter Distribution

The pore diameter distribution can reflect the pores size in the soil. The pore diameter is classified into four categories according to the classification criteria of >16 µm, 4 µm–16 µm, 1 µm–4 µm, and <1 µm.
As shown in Figure 15, the pore diameter of silty sand is mainly 4–16 μm, that of silt is mainly 1–4 μm, and that of clay is mainly <1 μm and 1–4 μm. It can be seen that with the increase of the plasticity index, the large diameter pores gradually decrease, while the small diameter pores gradually increase.

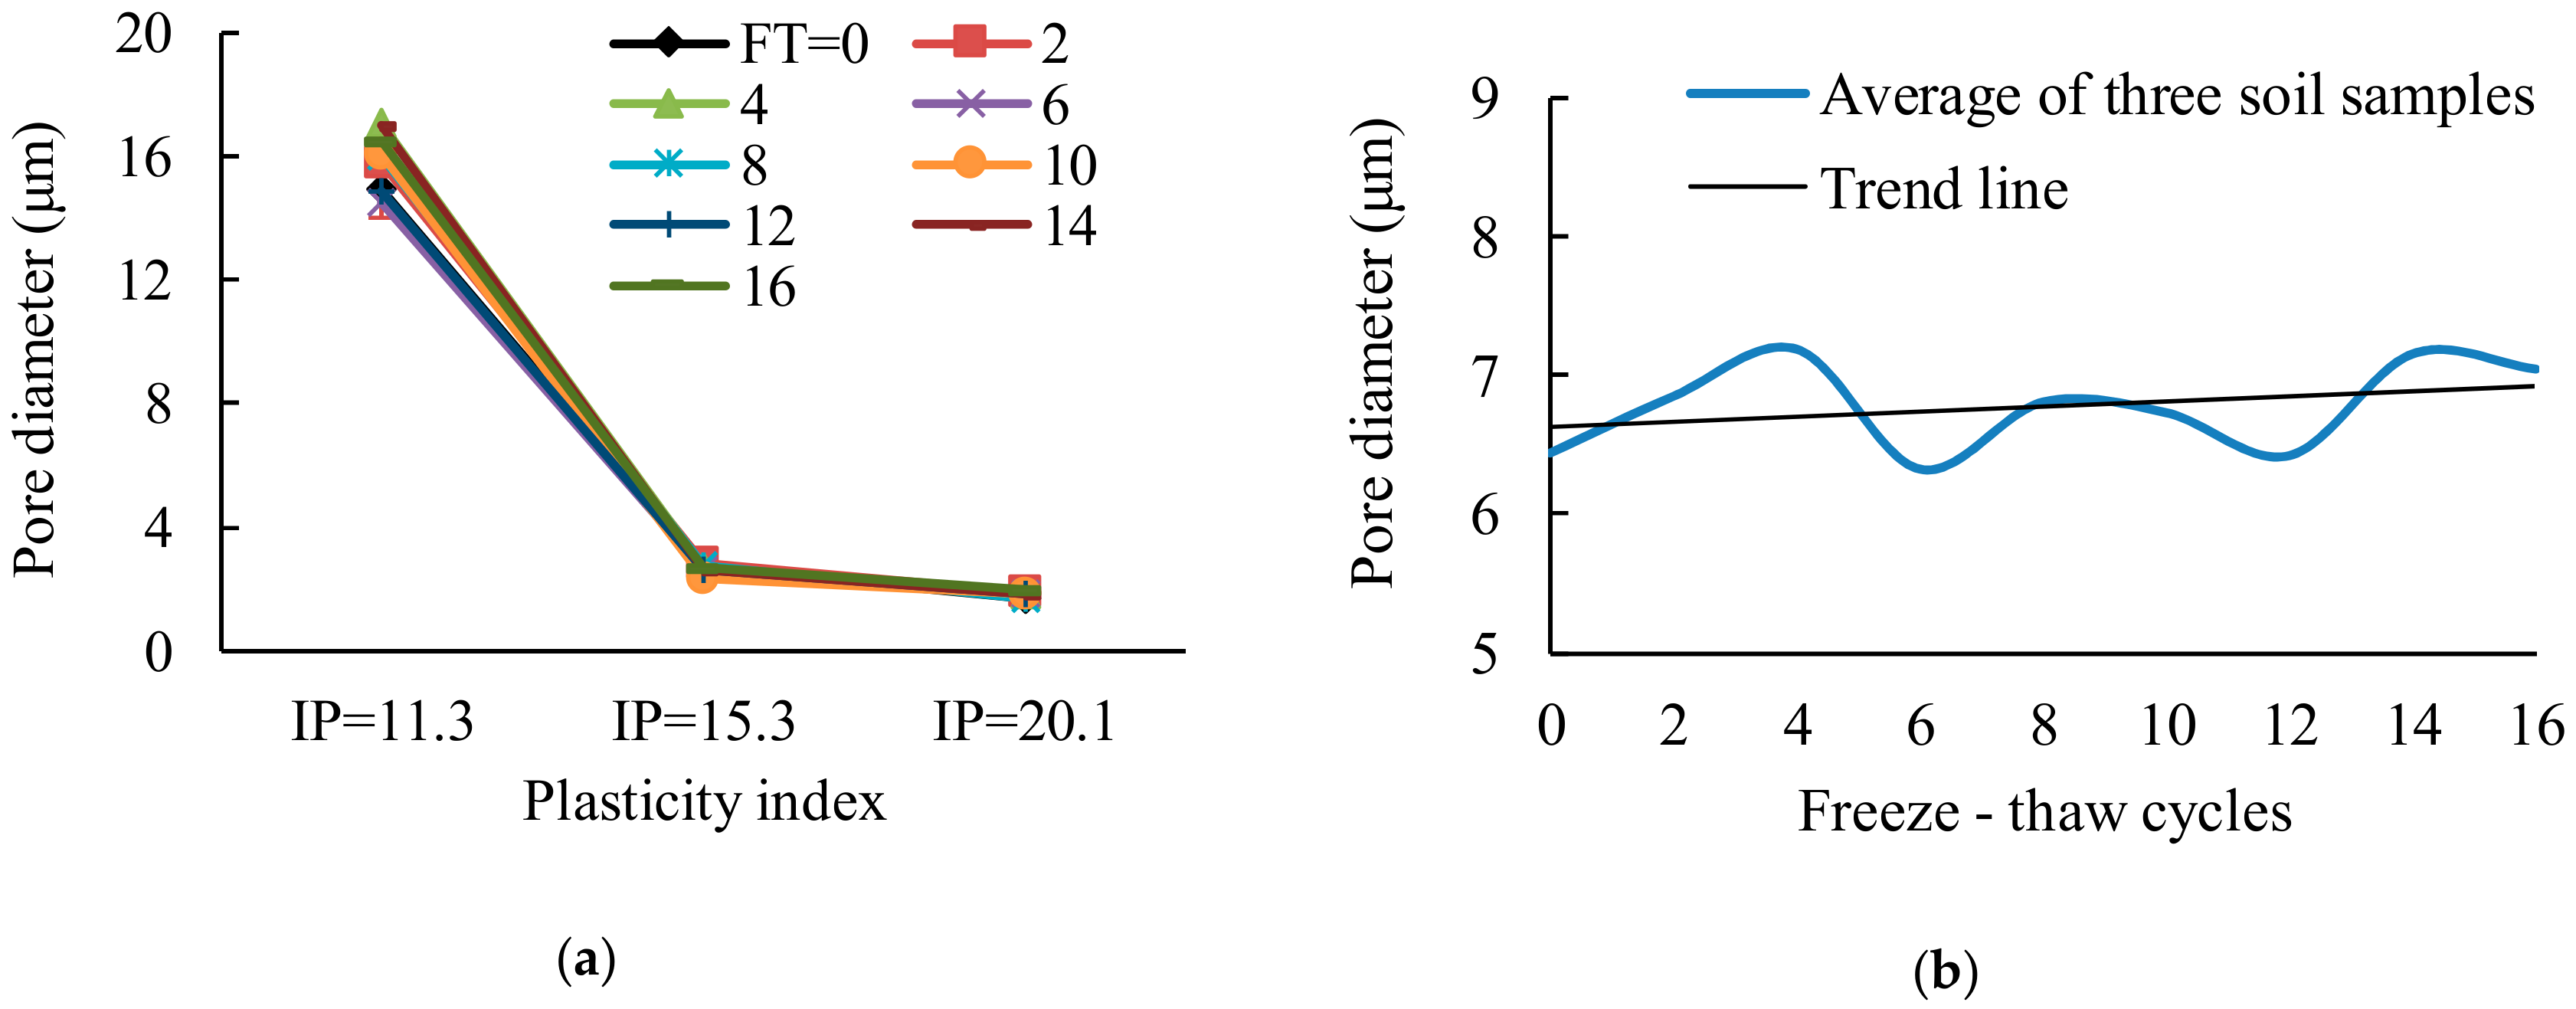
3.2.9. Pore Diameter
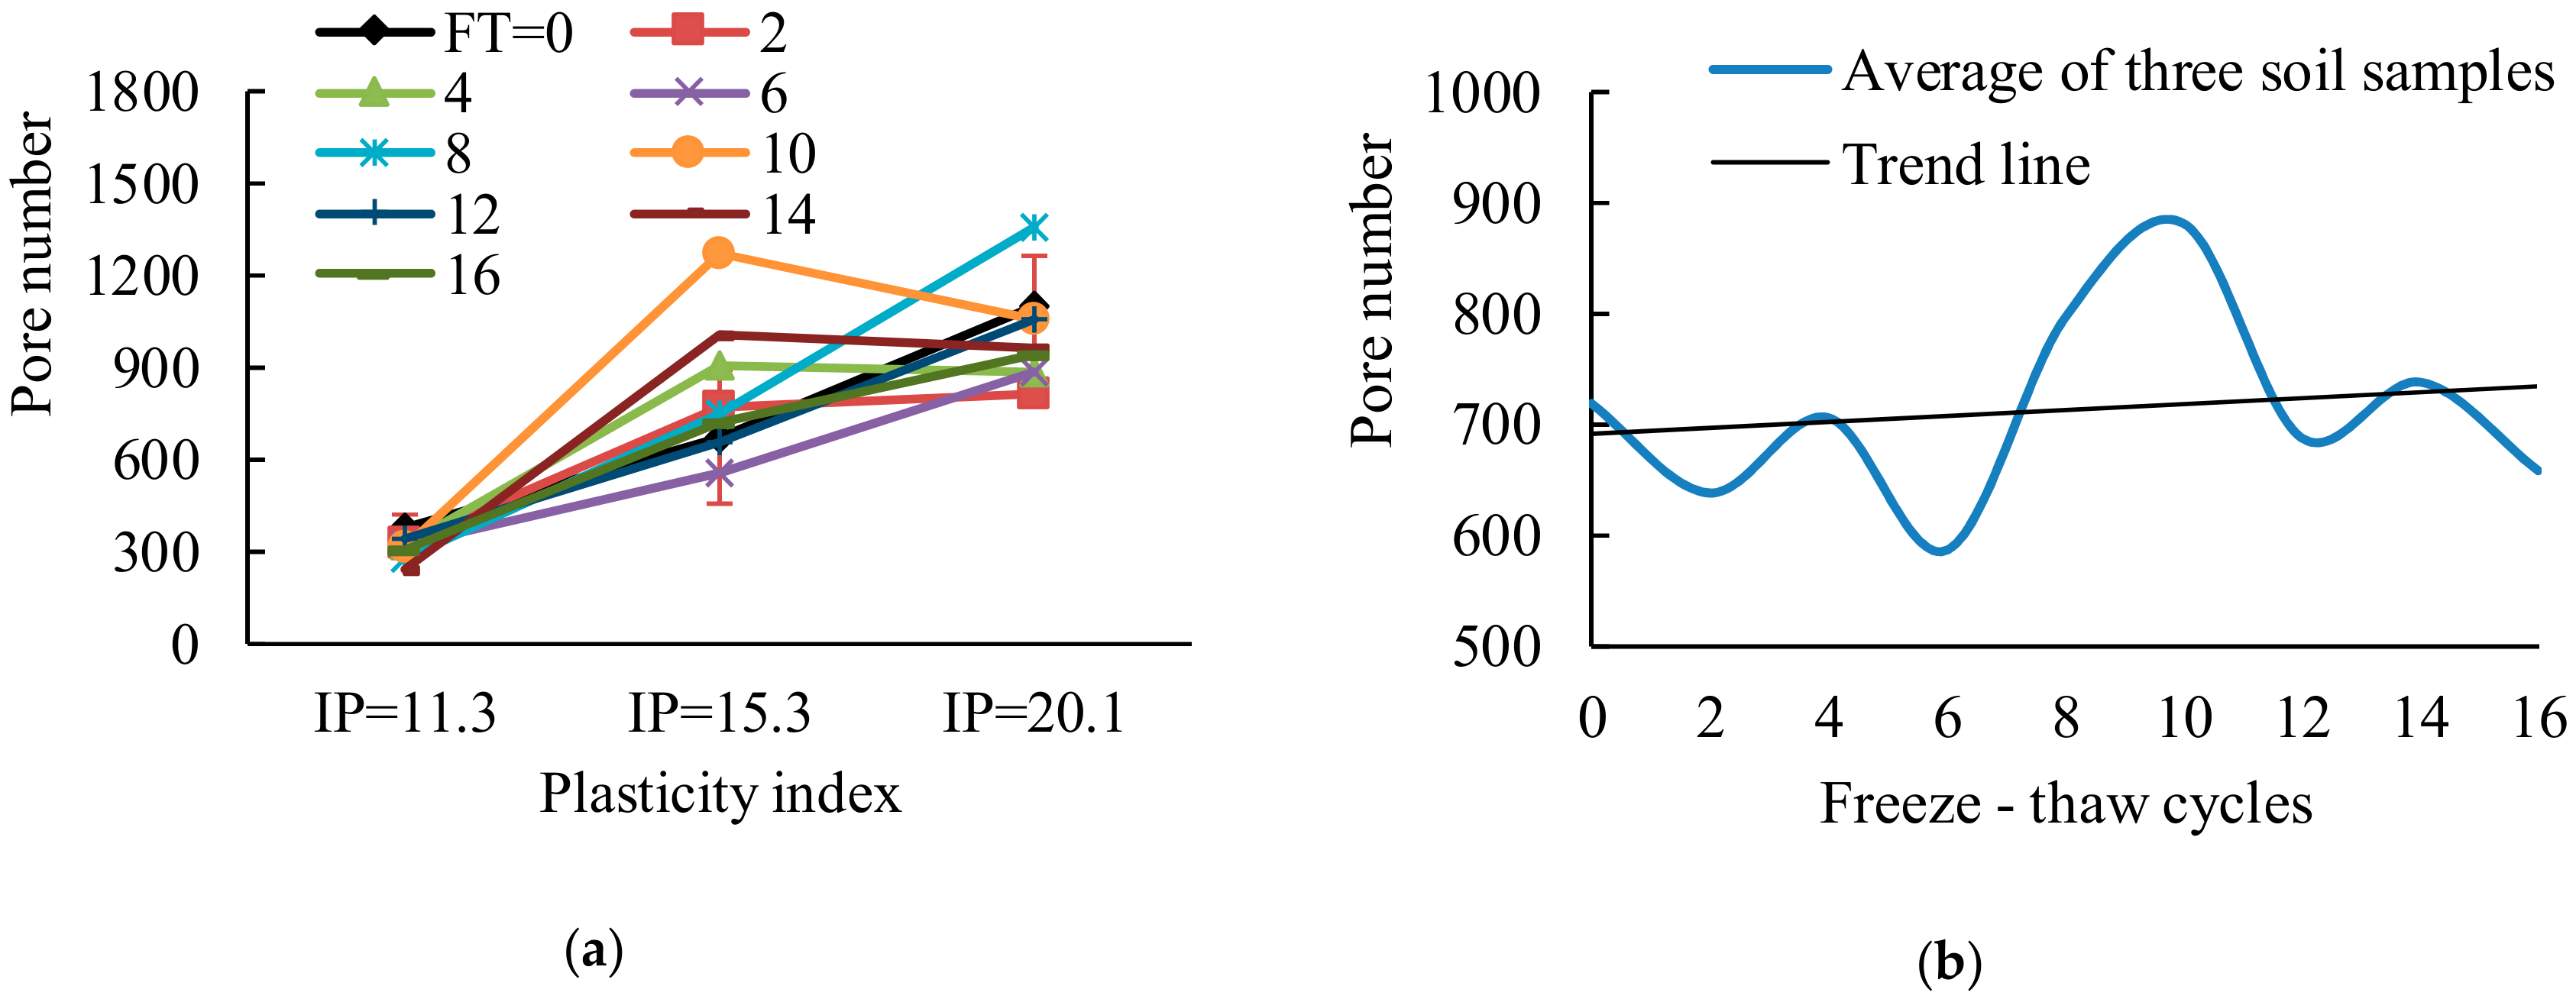
The pore diameter refers to the average diameter of all pores in the microstructural photographs.
Figure 16 shows that the pore diameter decreases with the increase of the plasticity index. Moreover, the pore diameter of silty sand is significantly larger than that of silt and clay. This is consistent with the results of pore diameter distribution. The pores of silt sand are mainly large (4–16 μm in diameter), while the pores of silt and clay are mainly small (less than 4 μm in diameter). Under the action of FT cycles, the pore diameter tends to increase by FT cycles.

3.2.10. Pore Number

It can be seen from Figure 17 that with the increase of the plasticity index, the pore number increases. The pore number of silt and clay are more sensitive to FT than that of silty sand. Because silt and clay have many small and micro ores, the freeze-heaving of free water in the soil will fill these pores, and the excess free water will penetrate into the weak areas of the soil and create new pores. With the increase of FT cycles, the pore number increases gradually.

4. Spearman’s Rank Correlation Coefficient Method (SRCCM)

The variables involved in the correlation analysis do not have the problem of dividing independent variables and dependent variables, and the relationship between variables is equivalent. In this study, the relationship between soil shear parameters and microstructure parameters is obscure, so we adopt the method of correlation analysis.
SRCCM is the nonparametric measure of the dependence for two variables. It uses the monotone equation to evaluate the correlation between two statistical variables. If there are no repeated values in the data, and when the two variables are completely monotonically correlated, the spearman rank correlation coefficient is +1 or −1. SRCCM was selected to analyze the dependence between shear strength parameters and microstructure parameters.
Assuming that two random variables are X and Y respectively (or can be regarded as two sets), the number of elements of them is N, and the i (1 ≤ i ≤ N) values of the two random variables are represented by Xi and Yi respectively. Element xi and yi are respectively xi’s ranking in X and yi’s ranking in Y. The elements in set x and y are subtracted to obtain a ranking difference set d, where di = xi - yi, (1 ≤ I ≤ N). The spearman rank correlation coefficient between random variables X and Y can be calculated by di, as shown in Equation (4). The correlation coefficients between shear strength parameters and microstructure parameters are shown in Table 2.
p = 1 6 i = 1 N d i 2 N N 2 1
It can be concluded from Table 2 that cohesion is related to most microstructure parameters, such as diameter of particles and pores, number of particles and pores, particle roundness, and particle directional probability entropy. The angle of internal friction is related to the diameter of particles and pores, the number of particles and pores, and the particle roundness.
Since there may be autocorrelation between various microstructure parameters, the effect of two microstructure parameters on cohesion may be consistent. In order to avoid overlapping and repeating effects, the microstructure parameters are used as reference series for autocorrelation analysis. If there is a significant correlation between two microstructural parameters, they have the same effect, and one must be discarded. The autocorrelation analysis of microstructure parameters is shown in Table 3.
As can be seen from Table 2 and Table 3, among the microstructure parameters correlated with cohesion, roundness has the highest correlation except for the autocorrelation microstructure parameters. It can also be learned that the microstructure parameter related to the angle of internal friction is particle roundness. Furthermore, cohesion is positively correlated with roundness, while the angle of internal friction is negatively correlated with roundness. Hence, the soil with a higher plasticity index has higher cohesion and lower angle of internal friction.
Particle roundness is the degree to which particle shape tends to be round. When the roundness of soil particles is larger, the shape of soil particles is more irregular. Irregular shape of soil particles will increase chemical bonding force and occlusal friction between soil particles. Therefore, the most dependent microstructure parameter of cohesion and angle of internal friction is particle roundness.

5. Conclusions

In this paper, the dependence between shear strength parameters and microstructure parameters of three types of subgrade soils after FT cycles was analyzed. The conclusions were as follows:
(1)
The cohesion and shear strength of three types of subgrade soils are gradually reduced with the increase of the number of FT cycles. After FT, the shear strength of soil samples is reduced by about 30%.
(2)
During FT, soil particles will reunite and split many times, resulting in changes in soil particles and pore properties. With an increment of the number of FT cycles, the diameter and number of soil particles and pores tend to increase, while the roundness, fractal dimension and directional probabilistic entropy of particles all decrease.
(3)
With the increase of the plasticity index, the particle and pore diameter decreases, but the particle and pore number increases. In addition, subgrade soils with higher plasticity index have higher cohesion and lower angle of internal friction.
(4)
Regardless of the autocorrelation effect of microstructure parameters, particle roundness has the greatest influence on the cohesion and angle of internal friction of shear strength parameters.

Author Contributions

H.L. and X.L. conceived of and designed the experiments. X.L. and X.H. analyzed the data and wrote the paper. J.W. investigated the experiments. Y.Z. audited the content. All authors have read and agreed to the published version of the manuscript.

Funding

This research was funded by the National Natural Science Foundation of China [grant number 51308256].

Acknowledgments

The authors express their appreciation for the financial support of the National Natural Science Foundation of China [grant number 51308256].

Conflicts of Interest

The authors declare no conflict of interest.

References

  1. Lininger, K.B.; Wohl, E. Floodplain dynamics in North American permafrost regions under a warming climate and implications for organic carbon stocks: A review and synthesis. Earth-Sci. Rev. 2019, 193, 24–44. [Google Scholar] [CrossRef]
  2. Watanabe, T.; Tateno, R.; Imada, S.; Fukuzawa, K.; Isobe, K.; Urakawa, R.; Oda, T.; Hosokawa, N.; Sasai, T.; Inagaki, Y.; et al. The effect of a freeze-thaw cycle on dissolved nitrogen dynamics and its relation to dissolved organic matter and soil microbial biomass in the soil of a northern hardwood forest. Biogeochemistry 2019, 142, 319–338. [Google Scholar] [CrossRef]
  3. Mahedi, M.; Cetin, B.; Cetin, K.S. Freeze-thaw performance of phase change material (PCM) incorporated pavement subgrade soil. Constr. Build. Mater. 2019, 202, 449–464. [Google Scholar] [CrossRef]
  4. Hazirbaba, K. Effects of freeze-thaw on settlement of fine grained soil subjected to cyclic loading. Cold Reg. Sci. Technol. 2019, 160, 222–229. [Google Scholar] [CrossRef]
  5. Kraatz, S.; Miller, H.J.; Jacobs, J.M. Remotely Sensed Freeze-Thaw from the Soil Moisture Active Passive Instrument to Inform the Timing of Seasonal Load Restrictions in Alaska. Transp. Res. Rec. 2019, 2673, 410–418. [Google Scholar] [CrossRef]
  6. Garzon, E.; Sanchez-Soto, P.J.; Romero, E. Physical and geotechnical properties of clay phyllites. Appl. Clay Sci. 2010, 48, 307–318. [Google Scholar] [CrossRef]
  7. Han, C.P.; Cheng, P.F. Micropore variation and particle fractal representation of lime-stabilised subgrade soil under freeze-thaw cycles. Road Mater. Pavement 2015, 16, 19–30. [Google Scholar] [CrossRef]
  8. Meng, T.; Qiang, Y.; Hu, A.; Xu, C.; Lin, L. Effect of compound nano-CaCO 3 addition on strength development and microstructure of cement-stabilized soil in the marine environment. Constr. Build. Mater. 2017, 151, 775–781. [Google Scholar] [CrossRef]
  9. Wei, H.B.; Zhang, Y.P.; Wang, F.Y.; Che, G.F.; Li, Q.L. Experimental Research on Resilient Modulus of Silty Clay Modified by Oil Shale Ash and Fly Ash after Freeze-Thaw Cycles. Appl. Sci. 2018, 8, 1298. [Google Scholar] [CrossRef] [Green Version]
  10. Wang, D.Y.; Ma, W.; Niu, Y.H.; Chang, X.X.; Wen, Z. Effects of cyclic freezing and thawing on mechanical properties of Qinghai–Tibet clay. Cold Reg. Sci. Technol. 2007, 48, 34–43. [Google Scholar] [CrossRef]
  11. Liu, J.K.; Chang, D.; Yu, Q.M. Influence of freeze-thaw cycles on mechanical properties of a silty sand. Eng. Geol. 2016, 210, 23–32. [Google Scholar] [CrossRef]
  12. Orakoglu, M.E.; Liu, J.; Lin, R.; Tian, Y. Performance of Clay Soil Reinforced with Fly Ash and Lignin Fiber Subjected to Freeze-Thaw Cycles. J. Cold Reg. Eng. 2017, 31, 04017013. [Google Scholar] [CrossRef]
  13. Zhou, Z.; Ma, W.; Zhang, S.; Mu, Y.; Li, G. Effect of freeze-thaw cycles in mechanical behaviors of frozen loess. Cold Reg. Sci. Technol. 2018, 146, 9–18. [Google Scholar] [CrossRef]
  14. Zhou, J.; Tang, Y. Experimental inference on dual-porosity aggravation of soft clay after freeze-thaw by fractal and probability analysis. Cold Reg. Sci. Technol. 2018, 153, 181–196. [Google Scholar] [CrossRef]
  15. Di Sante, M.; Fratalocchi, E.; Mazzieri, F.; Pasqualini, E. Time of reactions in a lime treated clayey soil and influence of curing conditions on its microstructure and behaviour. Appl. Clay Sci. 2014, 99, 100–109. [Google Scholar] [CrossRef]
  16. Bahloul, O.; Abbeche, K.; Bahloul, A.; Cui, Y.J.; Ghabezloo, S.; Pereira, J.M.; Tang, A.M. Study of the microstructure of a collapsible soil flooded with NaCl saline. In Proceedings of the E3S Web of Conferences, Paris, France, 12–14 September 2016; Volume 9. [Google Scholar]
  17. Tang, Y.Q.; Zhou, J.; Hong, J.; Yang, P.; Wang, J.X. Quantitative analysis of the microstructure of Shanghai muddy clay before and after freezing. B Eng. Geol. Environ. 2011, 71, 309–316. [Google Scholar] [CrossRef]
  18. Tang, Y.; Li, J. Test method and application for microstructures of undisturbed silty sand and sandy silt. Environ. Earth Sci. 2018, 77, 657. [Google Scholar] [CrossRef]
  19. Zhang, Z.-L.; Cui, Z.-D. Analysis of microscopic pore structures of the silty clay before and after freezing–thawing under the subway vibration loading. Environ. Earth Sci. 2017, 76, 528. [Google Scholar] [CrossRef]
  20. Neto, M.P.C.; Hernandez, O.; Reinaldo, R.L.; Borges, C.; Caicedo, B. Study of the relationship between the hydromechanical soil behavior and microstructure of a structured soil. Earth Sci. Res. J. 2018, 22, 91–101. [Google Scholar] [CrossRef]
  21. Voltoini, M.; Tas, N.; Wang, S.; Brodie, E.L.; Ajo-Franklin, J.B. Quantitative characterization of soil micro-aggregates: New opportunities from sub-micron resolution synchrotron X-ray microtomography. Geoderma 2017, 305, 382–393. [Google Scholar] [CrossRef] [Green Version]
  22. Trzcinski, J.; Wojcik, E. Application of microstructure classification for the assessment of the variability of geological-engineering and pore space properties in clay soils. Open Geosci. 2019, 11, 236–248. [Google Scholar] [CrossRef]
  23. Hazirbaba, K.; Zhang, Y.; Hulsey, J.L. Evaluation of temperature and freeze-thaw effects on excess pore pressure generation of fine-grained soils. Soil Dyn. Earthq. Eng. 2011, 31, 372–384. [Google Scholar] [CrossRef]
  24. Otalvaro, I.F.; Neto, M.P.C.; Caicedo, B. Compressibility and microstructure of compacted laterites. Transp. Geotech. 2015, 5, 20–34. [Google Scholar] [CrossRef]
  25. James, J.; Kasinatha Pandian, P. Strength and microstructure of micro ceramic dust admixed lime stabilized soil. Rev. Constr. 2018, 17, 5–22. [Google Scholar] [CrossRef] [Green Version]
  26. Wasim, M.; Li, C.Q.; Mahmoodian, M.; Robert, D. Quantitative Study of Coupled Effect of Soil Acidity and Saturation on Corrosion and Microstructure of Buried Cast Iron. J. Mater. Civil Eng. 2019, 31, 04019206. [Google Scholar] [CrossRef]
  27. Valdez, A.S.; Bosch-Serra, A.D.; Yague, M.R.; Poch, R.M.; Puigpinos, E. Earthworm community and soil microstructure changes with long-term organic fertilization. Arch. Agron. Soil. Sci. 2019. [Google Scholar] [CrossRef]
  28. Sukmak, P.; Kunchariyakun, K.; Sukmak, G.; Horpibulsuk, S.; Kassawat, S.; Arulrajah, A. Strength and Microstructure of Palm Oil Fuel Ash-Fly Ash-Soft Soil Geopolymer Masonry Units. J. Mater. Civil Eng. 2019, 31, 04019164. [Google Scholar] [CrossRef]
  29. Oliveira, C.F.; Pires, P.J.M.; Teixeira, J.E.S.L. Physical, mechanical, and microstructure investigation of tropical clayey soils stabilised with desulfurisation slag for pavement application. Road Mater. Pavement 2019. [Google Scholar] [CrossRef]
  30. El Howayek, M.; Bobet, A.; Santagata, M. Microstructure and cementation of two carbonatic fine-grained soils. Can. Geotech. J. 2019, 56, 320–334. [Google Scholar] [CrossRef]
  31. Gao, Y.; Sun, D.a.; Zhou, A. Hydromechanical behaviour of unsaturated soil with different specimen preparations. Can. Geotech. J. 2016, 53, 909–917. [Google Scholar] [CrossRef]
  32. Rosone, M.; Celauro, C.; Ferrari, A. Microstructure and shear strength evolution of a lime-treated clay for use in road construction. Int. J. Pavement Eng. 2018. [Google Scholar] [CrossRef]
  33. Rosone, M.; Megna, B.; Celauro, C. Analysis of the chemical and microstructural modifications effects on the hydro-mechanical behaviour of a lime-treated clay. Int. J. Geotec. Eng. 2019. [Google Scholar] [CrossRef]
  34. Chen, B.; Sun, D.a.; Yun-shi, H.U. Experimental study on strength characteristics and microscopic mechanism of marine soft clays. Mar. Georesour. Geotec. 2019. [Google Scholar] [CrossRef]
  35. Yu, C.; Wang, H.; Zhou, A.; Cai, X.; Wu, Z. Experimental Study on Strength and Microstructure of Cemented Soil with Different Suctions. J. Mater. Civil Eng. 2019, 31, 04019082. [Google Scholar] [CrossRef]
  36. Ministry of Transport of the People’s Republic of China. Test Methods of Soils for Highway Engineering (JTG E40-2007); China Communications Press: Beijing, China, 2007; Volume 18, pp. 223–226. (In Chinese) [Google Scholar]
  37. Li, G.X. Advanced Soil Mechanics; Tsinghua university press: Beijing, China, 2004; pp. 154–196. [Google Scholar]
  38. Shi, B. Quantitative assessment of changes of Microstructure for clayey soil in the process of compaction. Chin. J. Geotech. Eng. 1996, 18, 57–62. (In Chinese) [Google Scholar]
Figure 1. Grain size accumulation curve.
Sustainability 12 01264 g001
Figure 2. Chemical composition of soil sample: (a) Silty sand, (b) silt, (c) clay.
Sustainability 12 01264 g002
Figure 3. Specimen: (a) Static triaxial test specimen, (b) scanning electron microscope (SEM) samples.
Sustainability 12 01264 g003
Figure 4. SEM equipment.
Sustainability 12 01264 g004
Figure 5. The microstructure of soil samples: (a) Silty sand [Plasticity Index (IP) = 11.3], (b) silt (IP = 15.3), (c) clay (IP = 20.1).
Sustainability 12 01264 g005
Figure 6. The image processing: (a) The original image, (b) pre-processing, (c) gray histogram, (d) image binarization, (e) the final image.
Sustainability 12 01264 g006aSustainability 12 01264 g006b
Figure 7. Variation of shear strength parameters: (a) Cohesion force, (b) angle of internal friction, (c) shear strength.
Sustainability 12 01264 g007
Figure 8. Variation of Particle diameter under FT cycles: (a) Silty sand (IP = 11.3), (b) silt (IP = 15.3), (c) clay (IP = 20.1).
Sustainability 12 01264 g008
Figure 9. Variation of particle diameter under different conditions: (a) Different plasticity index, (b) different FT cycles.
Sustainability 12 01264 g009
Figure 10. Variation of particle number under different conditions: (a) Different plasticity index, (b) different FT cycles.
Sustainability 12 01264 g010
Figure 11. Variation of particle roundness under different conditions: (a) Different plasticity index, (b) different FT cycles.
Sustainability 12 01264 g011
Figure 12. Variation of particle fractal dimension under different conditions: (a) Different plasticity index, (b) different FT cycles.
Sustainability 12 01264 g012
Figure 13. Variation of particle directional probability entropy under different conditions: (a) Different plasticity index, (b) different FT cycles.
Sustainability 12 01264 g013
Figure 14. Simulated particle pattern of different types of soil samples under FT cycles.
Sustainability 12 01264 g014
Figure 15. Variation of pore diameter under FT cycles: (a) Silty sand (IP = 11.3), (b) silt (IP = 15.3), (c) clay (IP = 20.1).
Sustainability 12 01264 g015aSustainability 12 01264 g015b
Figure 16. Variation of pore diameter under different conditions: (a) Different plasticity index, (b) different FT cycles.
Sustainability 12 01264 g016
Figure 17. Variation of pore number under different conditions: (a) Different plasticity index, (b) different FT cycles.
Sustainability 12 01264 g017
Table 1. Basic physical properties of test soil.
SampleLiquid Limit (%)Plastic Limit (%)Plasticity Index (%)Optimum Moisture (%)Maximum Density (g/cm3)
Silty sand24.713.411.311.12.04
Silt35.920.615.315.31.86
Clay40.220.120.114.11.83
Table 2. Correlation coefficient between shear strength parameters and microstructure parameters.
CorrelationParticle DiameterParticle NumberRoundnessFractal DimensionParticle Directional Probability EntropyPore DiameterPore Number
Cohesion−0.537**0.481*0.802**−0.0600.456*−0.532**0.575**
Angle of internal friction0.530**−0.459*−0.698**0.072−0.3730.588**−0.570**
** Correlation is significant at the 0.01 level. * Correlation is significant at the 0.05 level.
Table 3. Microstructure parameter autocorrelation analysis.
CorrelationParticle DiameterParticle NumberRoundnessFractal DimensionParticle Directional Probability EntropyPore DiameterPore Number
Particle diameter1.000−0.941**−0.661**0.619**−0.0020.858**−0.841**
Particle number−0.941**1.0000.626**−0.538**0.098−0.869**0.905**
Roundness−0.661**0.626**1.000−0.2030.385*−0.532**0.690**
Fractal dimension0.619**−0.538**−0.2031.0000.3690.459*−0.450*
Particle directional probability entropy−0.0020.098**0.385*0.3691.000−0.0070.193
Pore diameter0.858**−0.869**−0.532**0.459*−0.0071.000−0.891**
Pore number−0.841**0.905**0.690**−0.450*0.193−0.891**1.000
** Correlation is significant at the 0.01 level. * Correlation is significant at the 0.05 level.

