Article

Potential Distribution of the Critically Endangered Chinese Pangolin (Manis pentadactyla) in Different Land Covers of Nepal: Implications for Conservation

by
Hari Prasad Sharma
1,*,
Bhagawat Rimal
2,
Mingxia Zhang
3,4,
Sandhya Sharma
1,
Laxman Prasad Poudyal
5,
Sujan Maharjan
6,
Ripu Kunwar
7,
Prativa Kaspal
8,
Namrata Bhandari
9,
Laxmi Baral
10,
Sujita Dhakal
11,
Ashish Tripathi
11,
Nimisha Karki
12,
Bibasa Khadki
13,
Prakash Thapa
14,
Bipin Kumar Acharya
15,
Suman Acharya
16,
Kedar Baral
17,18 and
Hem Bahadur Katuwal
4,19,*
1
Central Department of Zoology, Tribhuvan University, Kathmandu 44600, Nepal
2
College of Applied Sciences (CAS)-Nepal, Tribhuvan University, Kathmandu 44613, Nepal
3
Southeast Asia Biodiversity Research Institute, Chinese Academy of Sciences, Yezin, Nay Pyi Taw 05282, Myanmar
4
Center for Integrative Conservation, Xishuangbanna Tropical Botanical Garden, Chinese Academy of Sciences, Yunnan 666303, China
5
Suklaphata National Park, Department of National Parks and Wildlife Conservation, Kanchanpur 10400, Nepal
6
Planning, Monitoring and Coordination Division, Ministry of Forests and Environment, Kathmandu 44613, Nepal
7
Cultural and Spatial Ecology, Department of Geosciences, Florida Atlantic University, Boca Raton, FL 33431, USA
8
Natural Heritage Nepal & Women for Conservation, Bhaktapur 66400, Nepal
9
Valdosta State University, Valdosta, Georgia, GA 31601, USA
10
Ministry of Industry, Tourism, Forest and Environment, Hetauda 44107, Nepal
11
Kathmandu Forestry College, Tribhuvan University, Kathmandu 44613, Nepal
12
Department of Environment Science and Engineering, Kathmandu University, Kavrepalanchok 45200, Nepal
13
School of Environmental Science and Management, Pokhara University, Kathmandu 44613, Nepal
14
Division Forest Office, Baglung 33300, Nepal
15
Department of Epidemiology, School of Public Health, Sun Yat Sen University, Guangzhou 510080, China
16
Anthropology and Environmental Policy, Department of Anthropology, University of Maine, Orono, ME 04469, USA
17
Division Forest Office, Tanahun 33900, Nepal
18
School of Natural and Computational Science, Massey University, Auckland 4442, New Zealand
19
University of Chinese Academy of Sciences, Beijing 100049, China
*
Authors to whom correspondence should be addressed.
Sustainability 2020, 12(3), 1282; https://0-doi-org.brum.beds.ac.uk/10.3390/su12031282
Submission received: 1 January 2020 / Revised: 24 January 2020 / Accepted: 30 January 2020 / Published: 10 February 2020

Abstract

:
Anthropogenic activities have driven many wildlife species towards extinction. Among these species, the geographic distributions of many are poorly documented, which can limit the effectiveness of conservation. The critically endangered Chinese pangolin (Manis pentadactyla) is experiencing population decline throughout its range due to land-use changes and illegal trade for food and traditional medicine. Using distribution records and maximum entropy modeling, we predicted the potential distribution of the Chinese pangolin across Nepal. Most suitable potential habitats of the Chinese pangolin occurred in forest areas of the mid-hill region in central and eastern Nepal, followed by cultivated land. Almost all potential suitable habitats of the Chinese pangolin occurred outside of protected areas, and most of them were encroached upon by cultivated land, human settlements, and infrastructure developments. The results from this study provide baseline information on the potential suitable habitats of the Chinese pangolin in Nepal, which helps to develop site- and species-specific management plans and to identify priority areas to minimize the current threats to the pangolin and enhance the stewardship of species conservation.

1. Introduction

Many wildlife species are at risk of extinction in response to anthropogenic activities, including climate change, habitat alteration or loss, biological invasion, infrastructure, or combinations of these and other factors [1,2,3]. Consequently, vertebrate extinction risk is increasing, and for mammalian species, extinction rates have accelerated during the last several decades [4,5]. However, the extinction rates of species and the relative effects of factors causing extinction risk vary across regions, particularly in relation to changes in land cover [6]. Conservation of species depends on understanding of their ecological needs, which first requires knowledge of species’ distributions and habitat associations [7,8]. Identifying species’ potential distribution is a prerequisite for species conservation [9,10] and can play a vital role in ecological restoration by, for example, connecting meta-populations across landscapes and population viability analyses [11,12,13,14].
Of the eight pangolin species worldwide, Nepal supports the Chinese pangolin (Manis pentadactyla) and Indian pangolin (M. crassicaudata). In addition to Nepal, Chinese pangolins occur in the Asian countries of Bangladesh, Bhutan, China, India, Lao PDR, Myanmar, Thailand, and Vietnam [15,16]. The Chinese pangolin is listed as critically endangered on the IUCN Red List of Threatened Species and is included in Appendix I of the Convention on International Trade in Endangered Species of Wild Fauna and Flora and in the protected mammal species of Nepal’s Wildlife Protection Act 1973 [17,18]. The primary cause for their threatened status is poaching for illegal trade of scales and meat [16,17,18,19,20,21,22,23,24,25,26].
Chinese pangolins reportedly prefer forests over other land types [24,27,28,29]; however, the extent of some of the forest area in Nepal is declining due to conversion to cultivated land and settlements, dams and roads [30], timber harvest, human-caused forest fires, and livestock grazing [31]. The resulting habitat fragmentation can also isolate Chinese pangolins to small patches [32] and potentially alter their behavior [33,34].
There are limited data on the population and habitat of the Chinese pangolin in Nepal [31]. Generally, concerned entities have prioritized conservation in areas where species occurrence has been confirmed. Studies are very localized in a few locations, and the effects of current land cover are under-studied. The Pangolin Conservation Action Plan for Nepal (2018–2022) also focuses more study on the habitat selection of Chinese pangolin [31]. Here, we used species distribution modeling (SDM) to study the potential distribution of the Chinese pangolin in existing land cover types and to provide the baseline information for developing an area- and species-specific conservation strategy in Nepal. Maximum entropy modeling (Maxent; [35]) is widely used to estimate species distribution from presence-only data and is particularly well suited for modeling threatened species with limited available data [36,37,38]. In addition, maximum entropy models provide flexible choices of thresholds to use with binary outputs [35] in order to quantify and define reserve areas for threatened species such as the Chinese pangolin. This data will be beneficial for establishing corridors and/or reserve designs for the critically endangered Chinese pangolin, like other species whose populations are declining [39]. The aim of this study was to identify the potential habitats of the Chinese pangolin within existing land covers throughout Nepal in order to guide the prioritization of future research, monitoring, and conservation.

2. Material and Methods
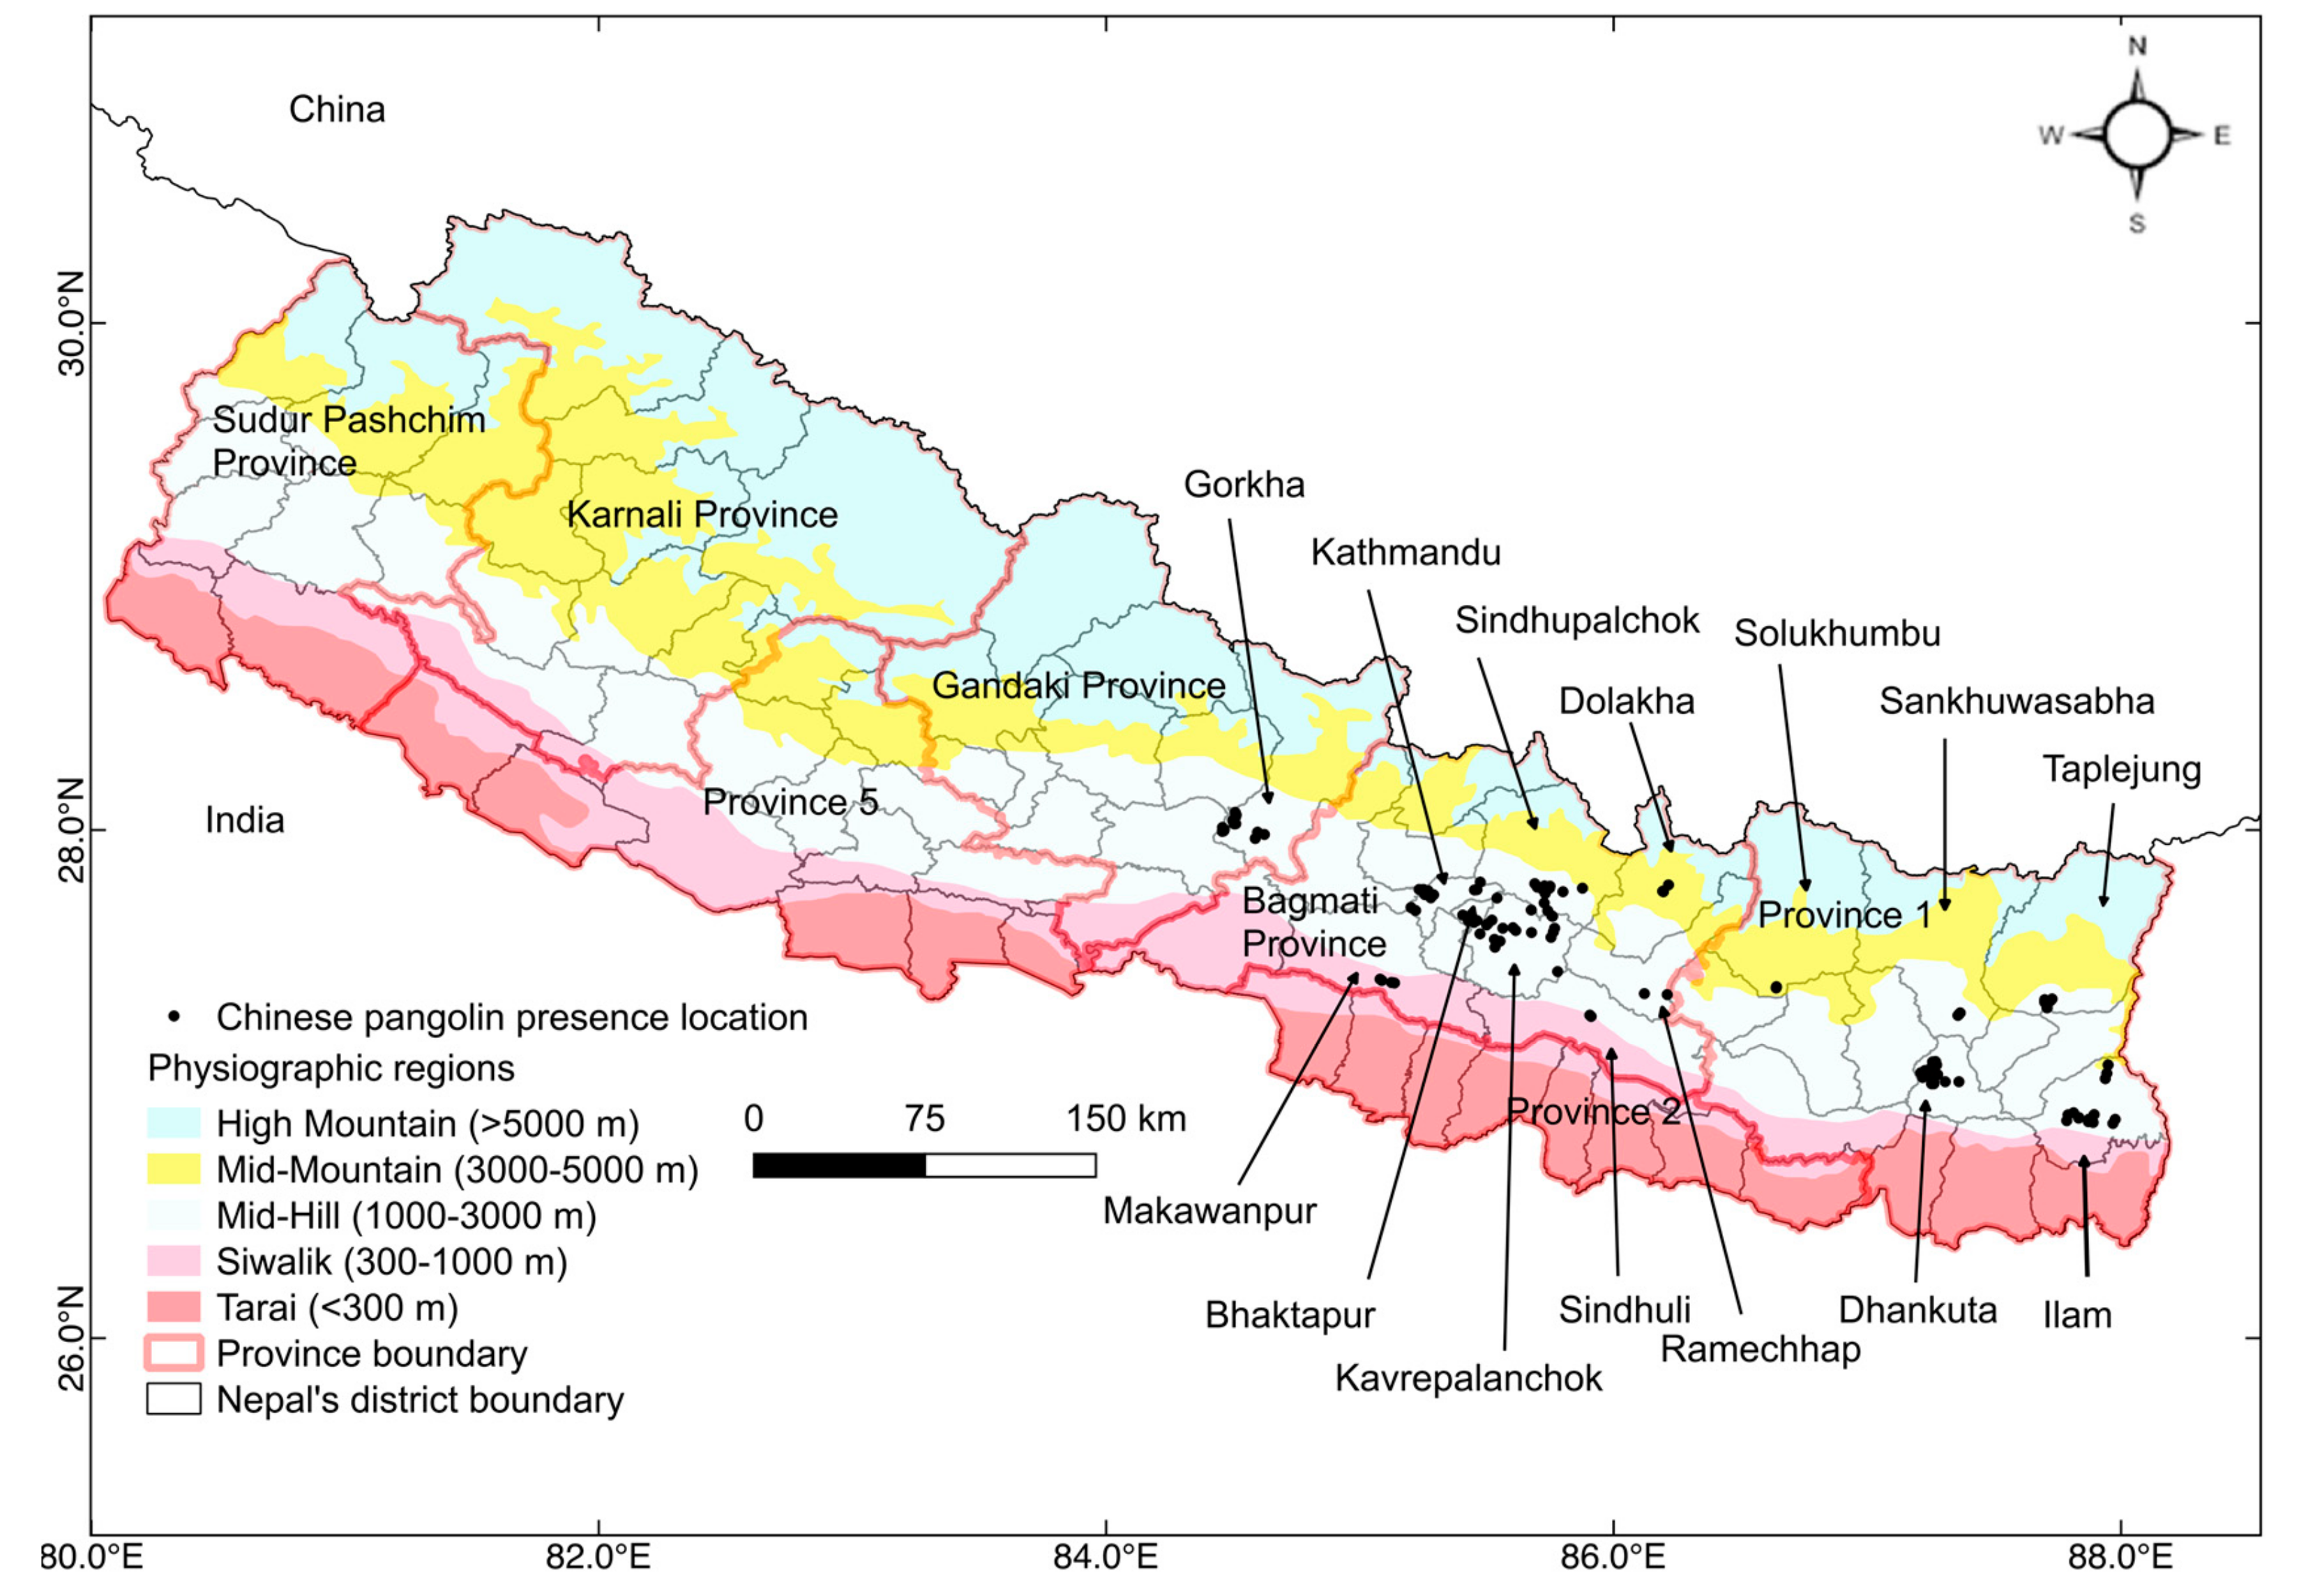
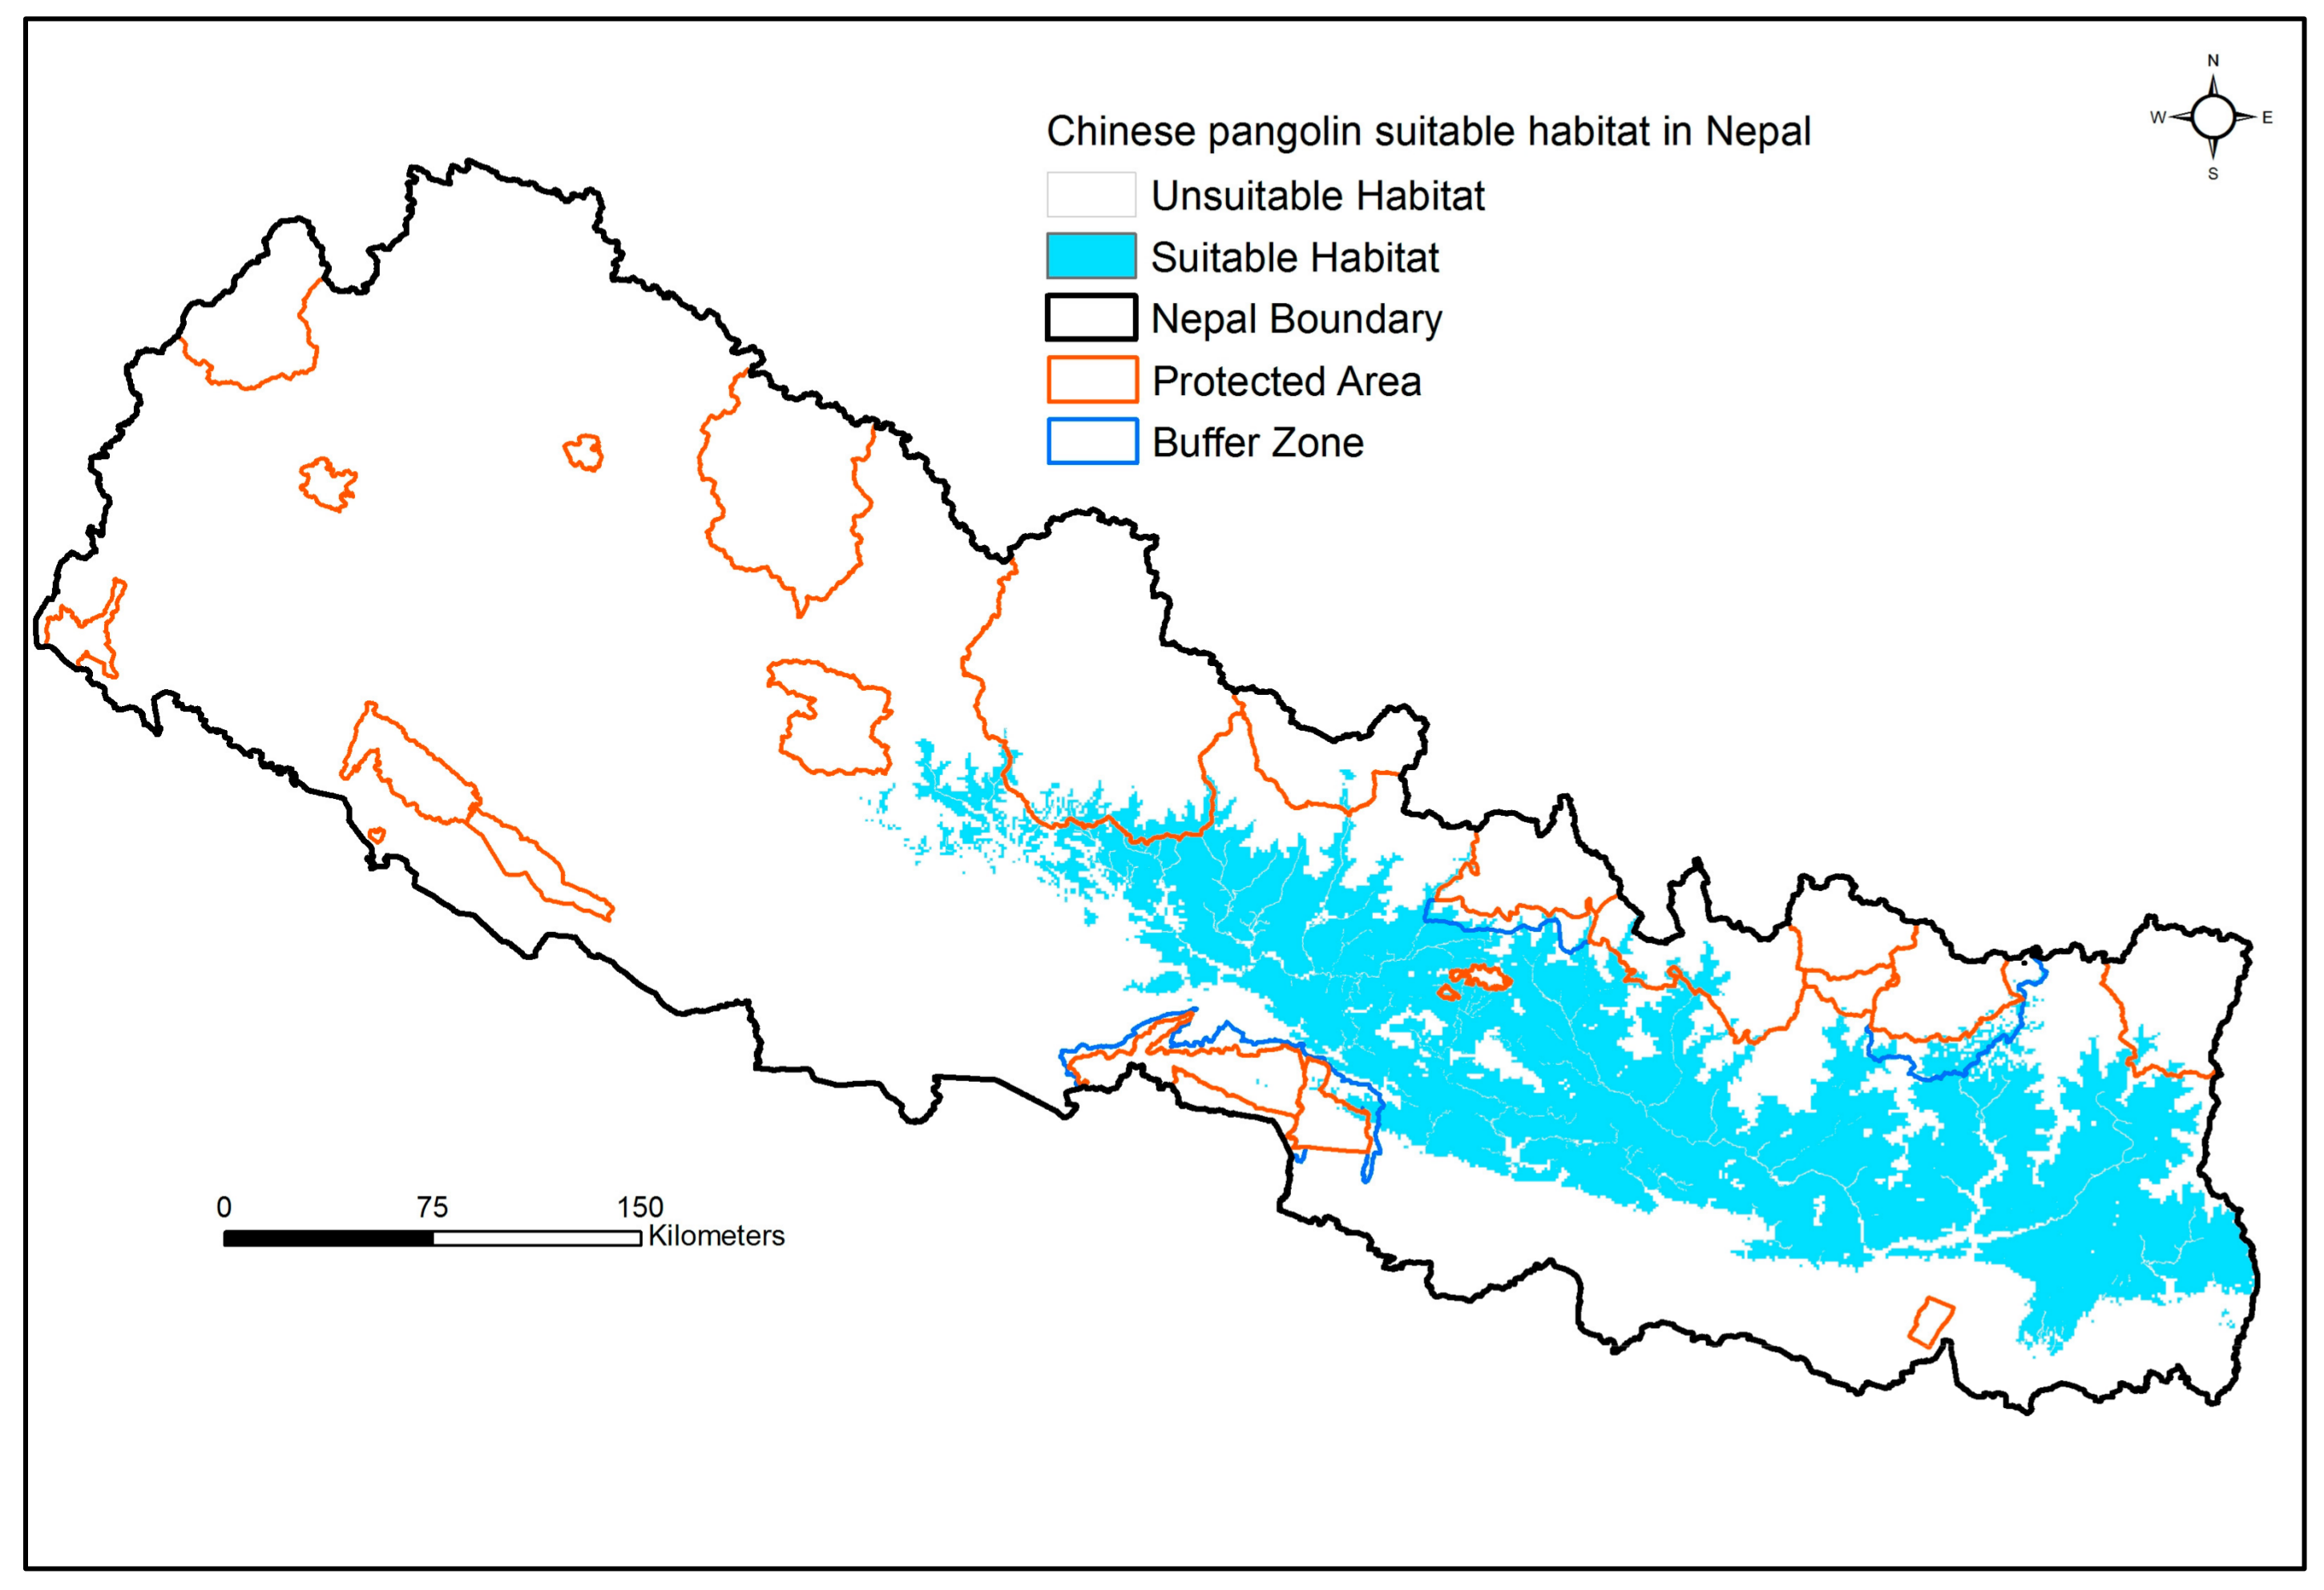
2.1. Study Area

Nepal comprises 147,181 km2 (80°04′ to 88°12′E and 26°22′ to 30°27′N) and is bordered by China and India. Nepal is divided into five physiographic regions of increasing elevation: Tarai, Siwalik, mid-Hill, mid-Mountain, and High Mountain (Himal), with an overall elevational range of 60 to 8848 m [40]. These regions have correspondingly different climates, with that of the Tarai considered tropical, that of the Siwalik considered subtropical, those of the mid-Hills and mid-Mountain considered temperate, and that of the High Mountain consisting of subalpine and alpine climates. At present, Nepal has 77 districts within seven provinces. The official names of all of these provinces are not assigned, except for Bagmati, Gandaki, Karnali, and Sudur Pashchim. We collected Chinese pangolin presence data from 14 districts of eastern to western Nepal, including the Taplejung, Ilam, Dhankuta, Shankhuwasaba, Solukhumbu, Sinhupalchok, Sindhuli, Kavrepalanchok, Ramechhap, Dolakha, Bhaktapur, Kathmandu, Makwanpur, and Gorkha districts (Figure 1).

2.2. Data Collection and Management

We collected presence-only data on Chinese pangolin using transects, plots, and opportunistic observations. We established 137 transects (Figure 2) whose lengths varied from 500 to 1000 m (Mean ±   SD = 554.7   ± 141.93   m ). The transects were in forests, shrublands, and in cultivated lands, and the length of each transect was determined by the physiography of the locality.
Signs of the Chinese pangolin’s occurrence were recorded up to 50 m on either side of the transect. In addition, we found 956 presence-only data from opportunistic surveys where the establishment of transects was not possible. All data were collected during 2008–2019 from eastern to western Nepal in different physiographic regions, from the Siwalik to Mid-mountain regions (Figure 1). Overall, we obtained 3066 occurrence records at elevations ranging from 378 to 2406 m. The Chinese pangolin’s home range size is <1 km2; therefore, we removed more occurrence points of this species through spatial filtering. After spatial filtering for 1 km resolution, only 110 presence locations were available for further analysis (Figure 1), and finally, the distance between two occurrences points was >1 km. We confirmed that these data were of Chinese pangolins because Indian pangolins are known to occur only in a small area of southern Nepal at elevations below 500 m, whereas Chinese pangolins are more widely distributed and reportedly occur below 2000 m [18,41]. To avoid confusion between Indian and Chinese pangolins, we used only direct sightings of Chinese pangolins in areas below 500 m elevation and, whenever possible, confirmed their occurrences through direct communication with key informants. In areas with elevations greater than 500 m, we used presence locations of Chinese pangolins based on direct sightings and indirect observations such as burrows, footprints, and scratches see [29].

2.3. Spatial Modeling

We prepared potential spatial layers of Chinese pangolins by initially selecting 19 bioclimatic variables at an arc resolution of 30 (ca. 1 km2) from Worldclim (www.worldclim.org; [42]) as the environmental layers. From these, we selected seven environmental variables, including Mean Diurnal Range (Bio_2), Iso-thermality (Bio_3), Temperature Seasonality (Bio_4), Mean Temperature of the Warmest Quarter (Bio_10), Precipitation of the Driest Month (Bio_14), Precipitation of the Warmest Quarter (Bio_18), and Precipitation of the Coldest Quarter (Bio_19) (Table S1), based on their statistical importance determined by jackknife analysis (Figure S1) for Chinese pangolin presence data and their correlation values (|r| < 0.70; Figure S2) to avoid model overfitting [43]. We used these environmental layers to estimate the potential distribution of the Chinese pangolin with maximum entropy modeling software (Maxent version 3.3.3 K; [37]). We constructed our Chinese pangolin distribution model with presence-only data and bio-climatic variables.
Maxent uses presence-only data to determine the potential area by using a set of variables using the presence of model species that are satisfied by environmental variables [44]. The software produces a map of habitat suitability from lowest to highest with values ranging from 0 to 1, respectively. Maximum entropy models are commonly used for SDM due to their continuous probabilistic output, threshold flexibility, and applicability for small sample sizes [35,38].
We ran Maxent using 75% of the presence data for calibration and the remaining 25% for model validation [45] with the bootstrapping procedure with 20 replications and a maximum of 500 iterations. We evaluated model validation and accuracy by calculating the Area Under the Curve (AUC) using Receiver Operating Characteristics (ROC) analysis [46]. However, because of criticism of the use of AUC for model evaluation [47], we also evaluated model performance using the True Skill Statistic (TSS) package: \tab TSS\cr; [48]. The TSS values range from -1 to +1, with the greatest value indicating good model performance with perfect discrimination while zero or less indicated no better performance than random. We calculated all of these statistical values using the program R Version 3.3.3 [49]. We converted Maxent probability scores from the Maxent output into the suitable and unsuitable habitats using the Maximum Training Sensitivity and Specificity Logistic Threshold using the raster calculator in QGIS. Maximum Training Sensitivity and Specificity Logistic Threshold is a prominent method for presence-only data because it produces the highest sensitivity values [50]. We used the suitable habitat raster layer to identify the extent of the potential distribution of Chinese pangolins occurring within existing land covers.

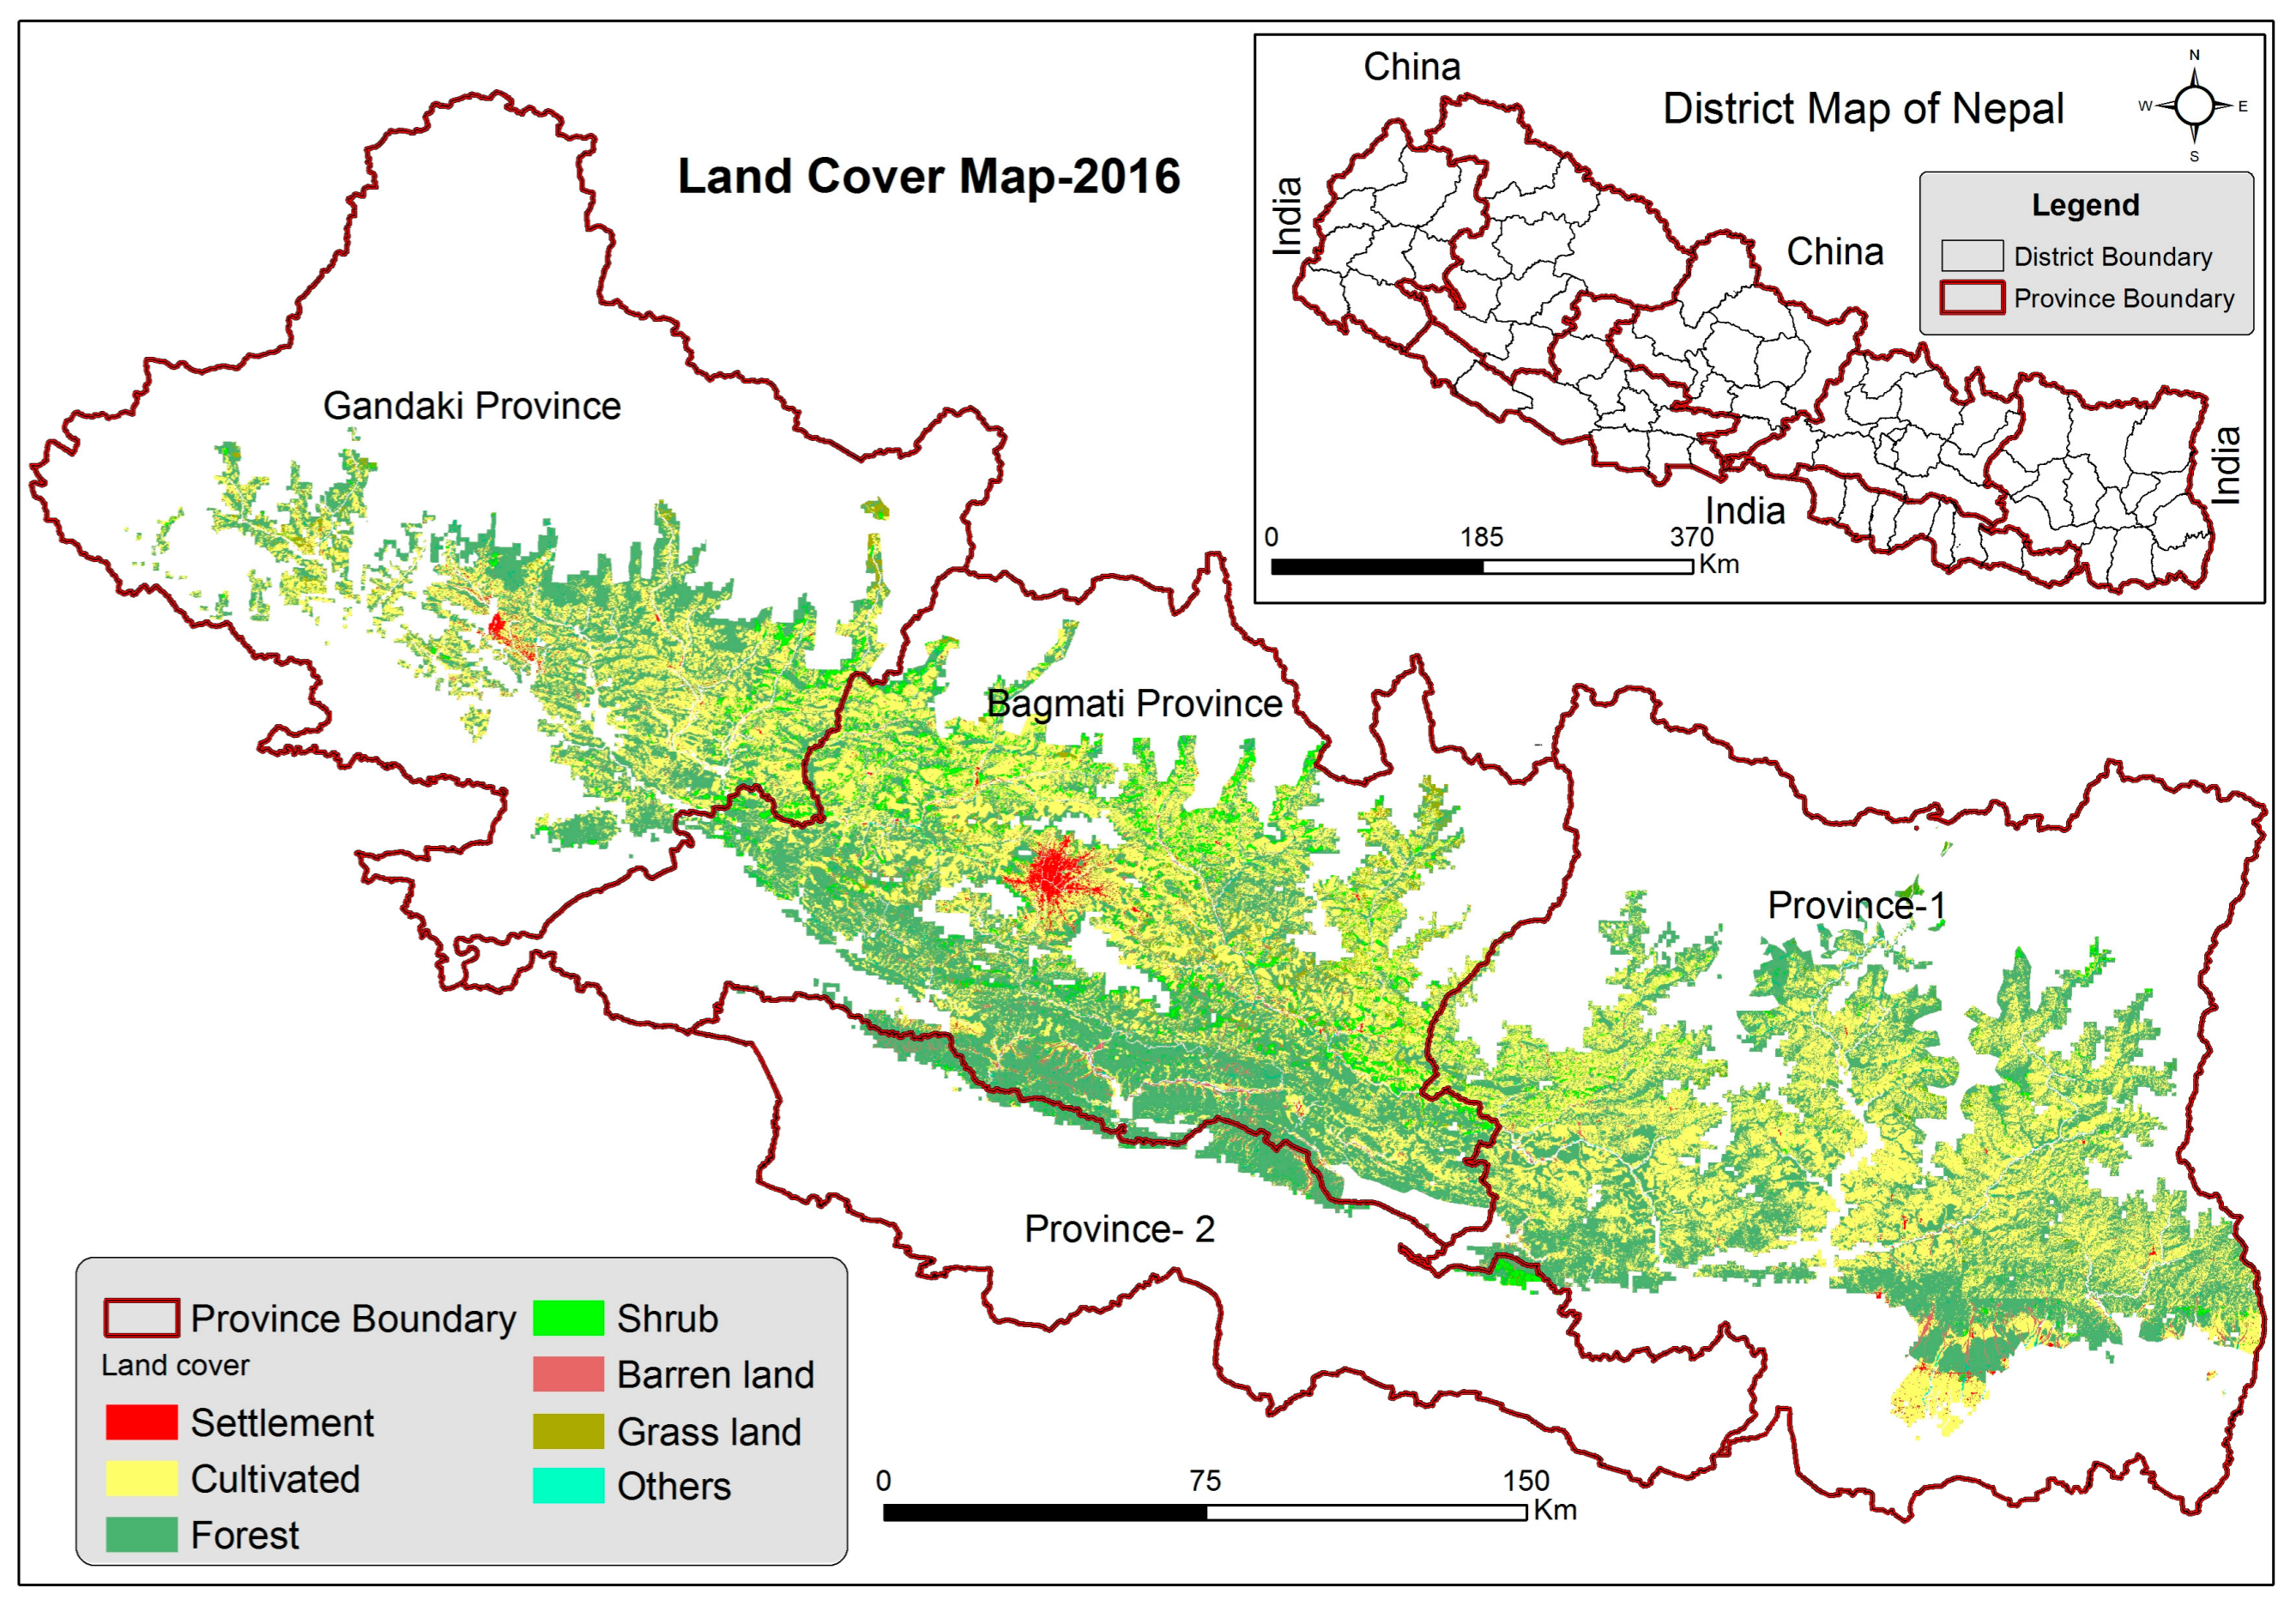
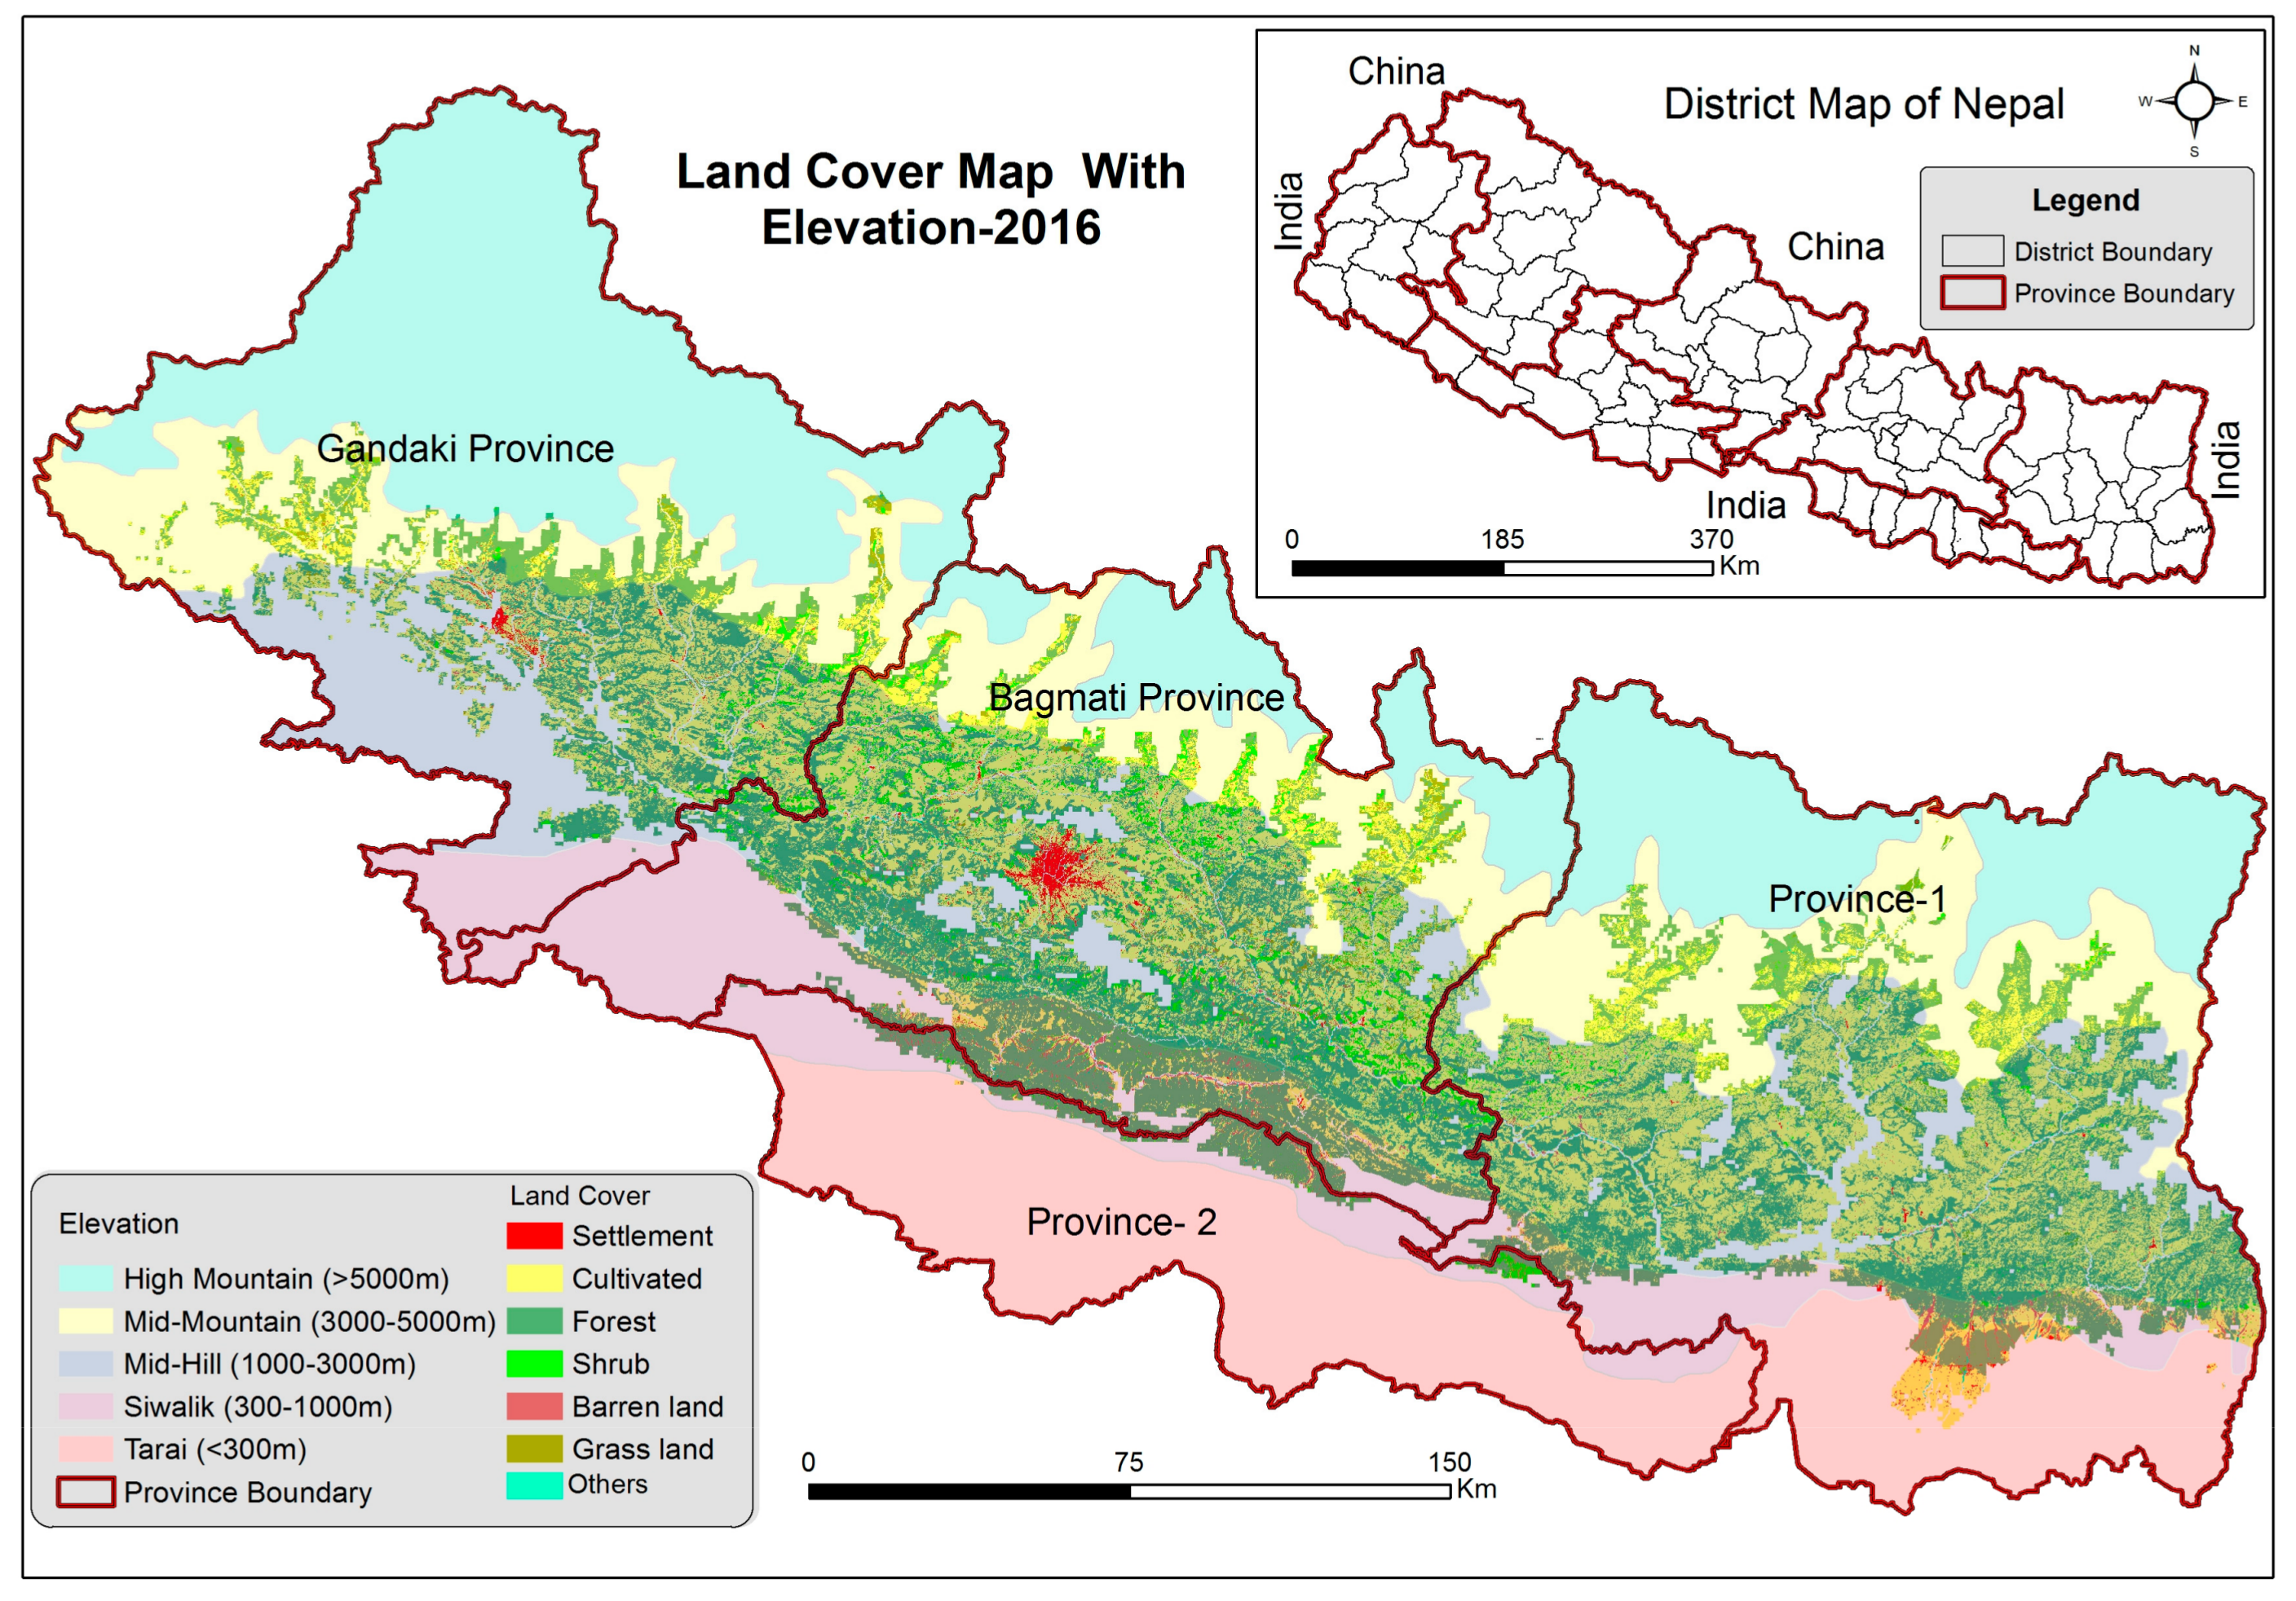
2.4. Land Cover Classification
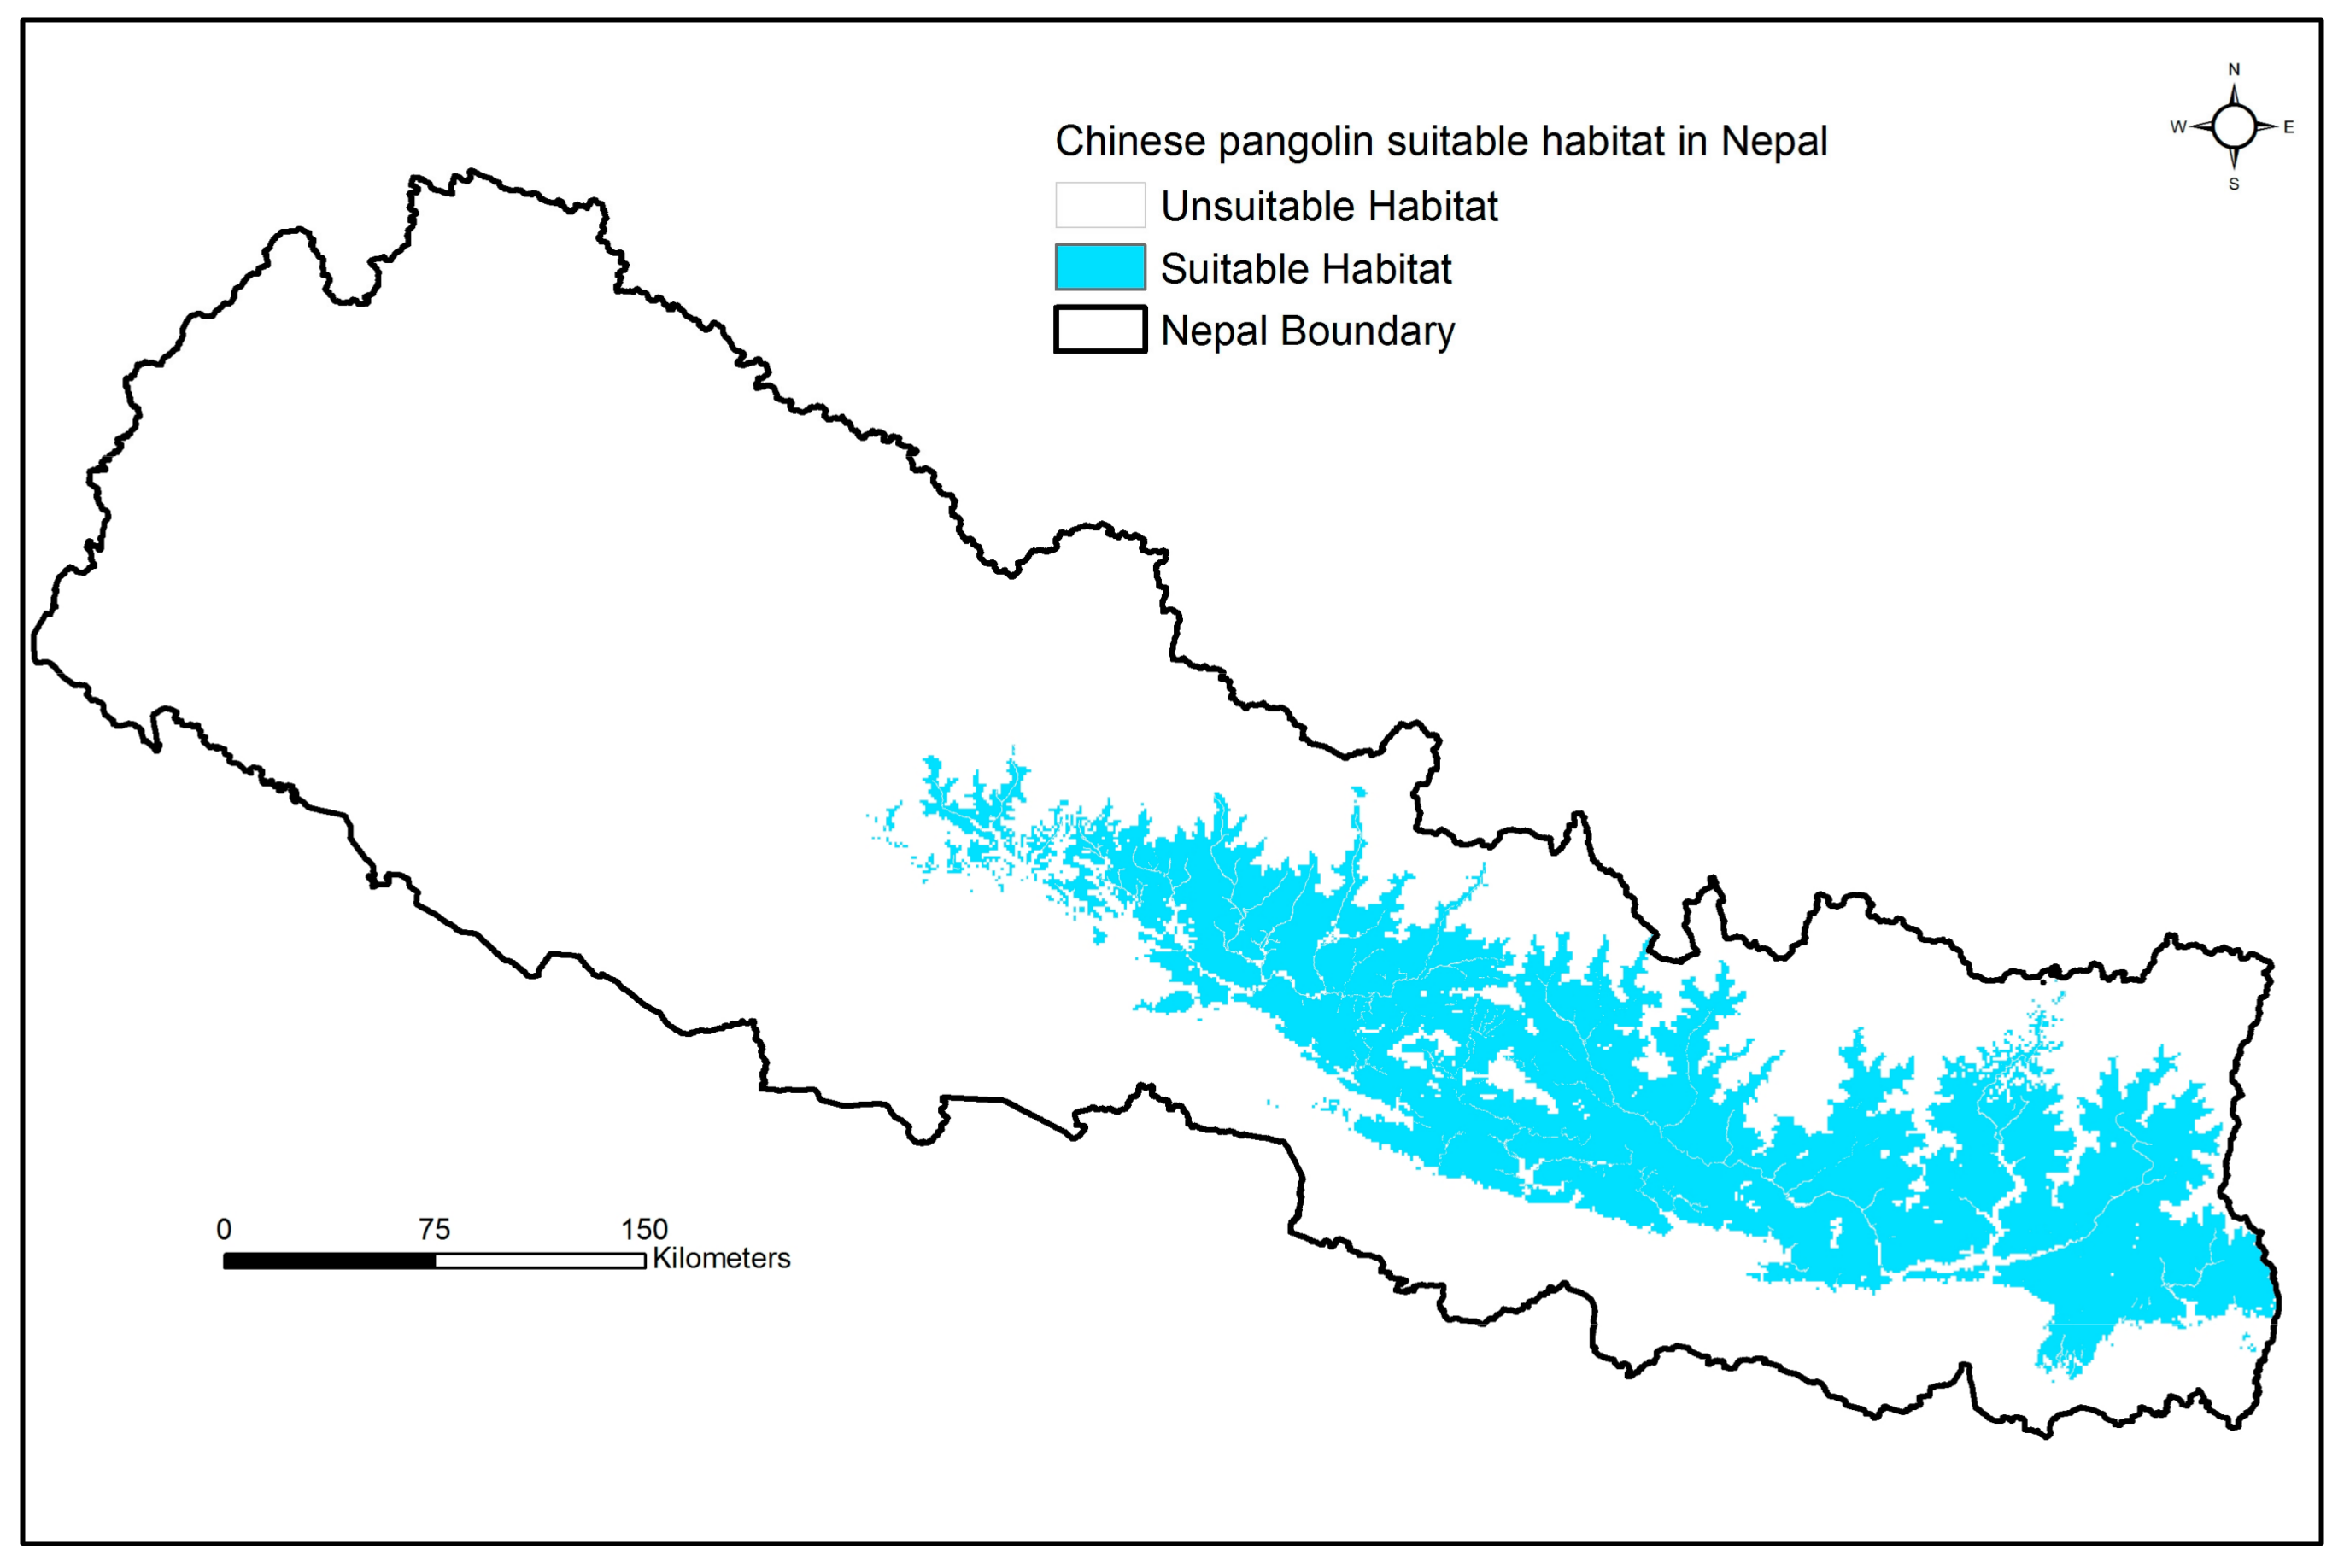
To extract the land cover of this area, we used terrain-corrected (Level 1) 30 m resolution Landsat 8 Operational Land Imager (OLI) images obtained in 2016 to evaluate major land cover (U.S. Geological Survey; https://earthexplorer.usgs.gov; Table S2). We further verified all images, and a Flash Line-of-Sight Atmospheric Analysis of Spectral Hypercubes (FLAASH) has been used for image processing. For the extraction of land cover, we used Support Vector Machine (SVM) [51,52,53] algorithms. Basically, SVM provides a flexible supervised classifier option with higher accuracy than that of the maximum likelihood (ML) classifier [54,55]. We assigned a Radial Basic Function (RBF) with maximum penalty parameters with a sum of 100. We described the classification equations of each kernel based on the section of ENVI version 5.3 (www.exelisvis.com). We created seven land cover classes, including forest, shrubs, cultivated, settlement, barren, grassland, and water bodies such as dams and irrigation canals (Table S3), using the classification scheme developed by Anderson et al. [56].
We evaluated land cover classification accuracy with a confusion matrix [57]. Overall accuracy (OA), user’s accuracy (UA), and producer’s accuracy (PA) were evaluated using field survey information collected during 2015, 2016, 2017, and 2018, as well as historical records including topographical maps developed by the Survey Department of Nepal [58] with scales of 1:25000 and 1:50000, high resolution Google Earth images, and government records and community recall. To collect ground truth data, we used the Global Positioning System (GPS). Using GPS, we validated the land cover against 2450 randomly selected reference points (at least 350) for each class.

3. Results

Model performance was high, based on the area under the ROC curve (AUC), true skill statistics (TSS), sensitivity, and specificity values of 0.95, 0.81, 0.96, and 0.84, respectively. Almost all (97.25%) of the presence locations fell under the predicted climatically suitable habitats shown by the Maxent results (Figure S3). The quantitative relationship of the ecological niche of the Chinese pangolin between predictive variables and the logistic probability of presence (habitat suitability) ranged from 360–534 for Temperature Seasonality (Bio_4), 1 to 29 for Mean Temperature of the Warmest Quarter (Bio_10), and 377–1114 mm for Precipitation of the Warmest Quarter (Bio_18) (Figure S4). Climatic variables Bio_4, Bio_10, and Bio-18 had the greatest contributions to model development (Figure S5).
The model predicted about 28,768 km2 of suitable habitat for the potential occurrences of Chinese pangolins in Nepal (Figure 3). However, of the potential distribution of Chinese pangolins, 12,713 km2 (44%) was in modified land cover, mainly in cultivated land, human settlements/infrastructure developments, roads, landslides, and irrigation canals and dam constructions (Figure 4, Table 1). Of the seven land cover classes, forest cover (48%) and cultivated land (43%) comprised the greatest amounts of potential distribution, followed by shrubs (4%), grasslands (2%), barren land (1%), settlements (1.0%), and others, including water bodies (< 1%) (Figure 4, Table 1).
Among areas of potential distribution, the greatest area (71%) was in the mid-Hill region between 1000 to 3000 m of elevation from eastern to central Nepal (Table 1, Figure 5), followed by the mid-Mountain region (15%) with 3000 to 5000 m of elevation, and 14% in the Tarai and Siwalik regions at below 1000 m of elevation (Figure 5, Table 1). Most of the potential distribution (94%) was predicted outside of existing protected areas (Figure 6).
The Bagmati Province supported the largest area of potential distribution (41%), followed by Province 1 (40%), Gandaki Province (18%), and Province 2 (2%). Comparatively, more potential distribution occurred in forested areas (19%) of total suitable areas in both Province 1 and Bagmati (Figure 4, Table 2), followed by 9% in the Gandaki Province. Among the total suitable areas that are in cultivated land, Province 1 supported the most (19%), followed by the Bagmati Province (16%) and Gandaki Province (8%) (Figure 4 and Figure 5, Table 2). The remaining land covers comprised < 1% of the remaining potential distribution.

4. Discussion

Our Chinese pangolin distribution model performed well and indicated the potential distribution throughout Nepal. We acknowledge that our distribution model was based on the available locations concentrated in the mid-hills of Nepal. It is difficult to obtain occurrence records for low-populated endangered species such as the Chinese pangolin. The knowledge of the ecology and distribution of the Chinese pangolin in Nepal is limited. However, research on captive breeding of the Chinese pangolin has revealed that temperatures between 18–27 are suitable for their survival [59]. The low variation in the Temperature Seasonality of the predicted area of Chinese pangolin habitation in the mid-hill regions of Nepal may support a potential habitat for this species. However, the Chinese pangolin does have a limited ability to regulate body temperature, and they also have a low metabolic rate [60]. The extreme temperature in some months may affect the activities of Chinese pangolins, although they can adjust by staying inside the burrow, where they can dissipate heat through the soil and the burrow entrance [61,62,63]. The physiography in the mountain region is steeper; Chinese pangolins prefer to construct burrows between 30 ° –60 ° steep slopes [64], which may help to maintain a stable diurnal temperature inside the burrows. Under such circumstances, even when air temperatures outside of the burrows are extreme, Chinese pangolins are potentially able to perform normal activities because of the more stable diurnal and seasonal temperatures inside burrows [65].
The forest areas are reported to be a resource for termites and ants [66,67,68,69], common prey species of Chinese pangolins. We found a greater potential distribution of Chinese pangolins in forest lands. This has been corroborated by the findings of other studies in Nepal [27,28,29]. Nepal is rich in wildlife diversity as a consequence of community-based forest management systems [70,71]. The extent of forests and shrubs in the hills and mountainous regions of Nepal is increasing [72], therefore resulting in more extensive refuge areas for both Chinese pangolins and their prey species [73].
The largest area of potential habitats for Chinese pangolins was found in cultivated areas. These areas are rich in ant and termite populations [74]. This is because, in practice, the cultivated lands in Nepal are bordered by trees and shrubs which can also support occurrences of the Chinese pangolin [75,76,77]. However, these areas have been heavily encroached, resulting in habitat fragmentation and the reduced occurrence of the Chinese pangolin [29]. The frequent disturbances by farmers in cultivated land limit burrows for shelter and movement of individuals (HBK, personal observation). Thus, the forests near cultivation have often been observed to be found as highly suitable habitats for Chinese pangolins [29]. Grass- and shrublands, which are important grazing lands for livestock, have a lower suitability than forested lands as Chinese pangolin habitats [78]. This could be due to the low prey availability, high disturbance pressure, and the negative effect of livestock grazing on Chinese pangolins [29].
Though the Chinese pangolin’s greatest potential distribution occurs in hilly and mountainous regions, these areas are currently fragmented by human infrastructure development [79]. The most common infrastructures, including settlements and unplanned road construction, are threatening the mammalian species in Nepal, including Chinese pangolins [29,32,80]. These actions may restrict the distribution of Chinese pangolins. For example, a study in Eastern China documented that 50% of the potential habitat for this species was lost between 1970 and 2000 [81]. Moreover, the cover of potential distribution of Chinese pangolins lies outside the protected areas of Nepal. This may be one of the major threats for the poaching of Chinese pangolins in Nepal. The conservation of the species may also be further curtailed by Nepal’s species conservation strategies/programs, which are mainly focused on protected area management activities. People outside the protected areas use Chinese pangolins meat and scales for their medicinal value (S. Tamang, Sindhupalchok, personal communication; [23,24,82]). Therefore, governmental consideration of additional protected areas, as well as conservation easements to protect Chinese pangolin habitats, is warranted.
Some action towards the conservation of Chinese pangolins is being undertaken. The government has launched the Pangolin Conservation Action Plan for Nepal (2018–2022) [31]. This Action Plan is designed to initiate immediate actions to identify potential habitats and the regular monitoring of populations and suitable habitats, in part to mitigate poaching and illegal trade. Our modeling provides the site-specific baseline information that can be used to prioritize areas for implementation of this Action Plan. In addition to the actions identified, we recommend that the government prioritizes the community-based conservation strategies for the Chinese pangolin. Community-based action, such as active participation of local people in government policy making, resource use, and involvement in awareness programs, would increase the effectiveness of species conservation [83,84,85]. In addition, the forests adjoining cultivated areas in the mid-hills are important for the Chinese pangolin; we recommend limiting anthropogenic disturbances in these areas for the betterment of Chinese pangolin population.

Supplementary Materials

The following are available online at https://0-www-mdpi-com.brum.beds.ac.uk/2071-1050/12/3/1282/s1, Figure S1: Jackknife test for those variables used in Maxent modelling to estimate potential distribution of Chinese pangolin in Nepal, Figure S2: Spearman pairwise correlation coefficients between predictive variables considered in the Chinese pangolin model, Figure S3: Chinese pangolin climatic suitable habitat and occurrence points, Figure S4: Response curves of seven bioclimatic variables in Chinese pangolin’s habitat distribution model, Figure S5: Variable contribution of Maxent modelling to estimate potential distribution of Chinese pangolin in Nepal, Table S1 Predictive climatic variables considered to estimate potential distribution of Chinese pangolin in Nepal, Table S2 Landsat data used in this study, Table S3: A Modified land cover classification scheme.

Author Contributions

Conceptualization—H.P.S., H.B.K.; Formal analysis and data management—H.P.S., B.R., H.B.K.; writing—original draft preparation—H.P.S., B.R., H.B.K.; writing—review and editing—H.P.S., B.R., M.Z., S.S., L.P.P., S.M., R.K., P.K., N.B., L.B., S.D., A.T., N.K., B.K., P.T., B.K.A., S.A., K.B., H.B.K. All authors have read and agreed to the published version of the manuscript.

Funding

The study was supported by the Chinese Research Academy of Environmental Sciences, Rufford Small Grant Foundation (Grant No: 21665-1, 26509-2), Ocean Park Conservation Foundation (Grant No. TM02-1516 and TM03-1617), Taiwan Forestry Bureau, Ensemble Foundation, Fresno Chaffee Zoo Wildlife Conservation Fund, and WWF-Nepal (Grant No: WT60).

Acknowledgments

The Department of National Parks and Wildlife Conservation and Department of Forests permitted this research. The authors thank J.L. Belant and P. Sapkota for their constructive comments to shape the manuscript, as well as K. Parajuli and K. Dahal for their field assistance.

Conflicts of Interest

The authors declare no conflict of interest.

References

  1. Owens, I.P.F.; Bennett, P.M. Ecological basis of extinction risk in birds: Habitat loss versus human persecution and introduced predators. Proc. Natl. Acad. Sci. 2000, 97, 12144–12148. [Google Scholar] [CrossRef] [PubMed] [Green Version]
  2. Thomas, C.D.; Cameron, A.; Green, R.E.; Bakkenes, M.; Beaumont, L.J.; Collingham, Y.C.; Erasmus, B.F.; De Siqueira, M.F.; Grainger, A.; Hannah, L.; et al. Extinction risk from climate change. Nature 2004, 427, 145–148. [Google Scholar] [PubMed]
  3. Sharma, H.P.; Belant, J.L.; Swenson, J.E. Effects of livestock on occurrence of the vulnerable red panda Ailurus fulgens in Rara National Park, Nepal. Oryx 2014, 48, 228–231. [Google Scholar] [CrossRef] [Green Version]
  4. Ceballos, G.; Ehrlich, P.R.; Barnosky, A.D.; García, A.; Pringle, R.M.; Palmer, T.M. Accelerated modern human–induced species losses: entering the sixth mass extinction. Sci. Adv. 2015, 1, 1–5. [Google Scholar] [CrossRef] [PubMed] [Green Version]
  5. WWF [World Wildlife Fund]. In Living Planet Report 2016. Risk and Resilience in a New Era; WWF International: Gland, Switzerland, 2016.
  6. Rodrigues, A.S.L.; Brooks, T.M.; Butchart, S.H.M.; Chanson, J.; Cox, N.; Hoffmann, M.; Stuart, S.N. Spatially explicit trends in the global conservation status of vertebrates. PLoS ONE 2014, 9, 1–17. [Google Scholar] [CrossRef] [PubMed]
  7. Sands, J.P.; DeMaso, S.J.; Schnupp, M.J.; Brennan, L.A. Wildlife Science: Connecting Research with Management. CRC Press: Boca Raton, FL, USA, 2012. [Google Scholar]
  8. Greggor, A.L.; Berger-Tal, O.; Blumstein, D.T.; Angeloni, L.; Bessa-Gomes, C.; Blackwell, B.F.; St Clair, C.C.; Crooks, K.; de Silva, S.; Fernández-Juricic, E.; et al. Research Priorities from Animal Behaviour for Maximising Conservation Progress. Trends Ecol. Evol. 2016, 31, 953–964. [Google Scholar] [CrossRef] [Green Version]
  9. Guisan, A.; Tingley, R.; Baumgartner, J.B.; Naujokaitis-Lewis, I.; Sutcliffe, P.R.; Tulloch, A.I.T.; Regan, T.J.; Brotons, L.; McDonald-Madden, E.; Mantyka-Pringle, C.; et al. Predicting species distributions for conservation decisions. Ecol. Lett. 2013, 16, 1424–1435. [Google Scholar] [CrossRef] [PubMed]
  10. Gavashelishvili, A.; Lukarevskiy, V. Modelling the habitat requirements of leopard Panthera pardus in west and central Asia. J. Appl. Ecol. 2008, 45, 579–588. [Google Scholar] [CrossRef]
  11. Guisan, A.; Thuiller, W. Predicting species distribution: Offering more than simple habitat models. Ecol. Lett. 2005, 8, 993–1009. [Google Scholar] [CrossRef]
  12. Larson, M.A.; Thompson, F.R.; Millspaugh, J.J.; Dijak, W.D.; Shifley, S.R. Linking population viability, habitat suitability, and landscape simulation models for conservation planning. Ecol. Modell. 2004, 180, 103–118. [Google Scholar] [CrossRef]
  13. Martínez-Meyer, E.; Peterson, A.T. Conservatism of ecological niche characteristics in North American plant species over the Pleistocene-to-Recent transition. J. Biogeogr. 2006, 33, 1779–1789. [Google Scholar] [CrossRef]
  14. Austin, M.P.; Meyers, J.A. Current approaches to modelling the environmental niche of eucalypts: Implication for management of forest biodiversity. For. Ecol. Manage. 1996, 85, 95–106. [Google Scholar] [CrossRef]
  15. Srinivasulu, C.; Srinivasulu, B. Checklist of scandents and pholidots (Mammalia: Scandentia and Pholidota) of South Asia. Zoos’ Print J. 2013, 19, 1372–1374. [Google Scholar] [CrossRef]
  16. Challender, D.W.S.; Baillie, J.; Ades, G.; Kaspal, P.; Chan, B.; Khatiwada, A.; Xu, L.; Chin, S.; KC, R.; Nash, H.; et al. Manis pentadactyla. The IUCN Red List of Threatened Species: e.T12764A45222544. 2014. Available online: https://0-dx-doi-org.brum.beds.ac.uk/10.2305/IUCN.UK.2014-2.RLTS.T12764A45222544.en (accessed on 25 October 2019).
  17. Challender, D.W.S.; Waterman, C.; Baillie, J.E.M. Scaling up pangolin conservationIUCN SSC Pangolin Specialist Group Conservation Action Plan. 24 July 2014. Available online: https://www.iucn.org/downloads/scaling_up_pangolin_conservation_280714_v4_1.pdf (accessed on 25 October 2019).
  18. Jnawali, S.R.; Baral, H.S.; Lee, S.; Subedi, N.; Acharya, K.P.; Upadhyay, G.P.; Pandey, M.; Shrestha, R.; Joshi, D.; Lamichhane, B.R.; et al. The Status of Nepal’s Mammals: the National Red List Series. Department of National Parks and Wildlife Conservation: Kathmandu, Nepal, 2011. [Google Scholar]
  19. Corlett, R.T. The Impact of Hunting on the Mammalian Fauna of Tropical Asian Forests. Biotropica 2007, 39, 292–303. [Google Scholar] [CrossRef]
  20. Challender, D.; Waterman, C. Implementation of CITES Decision2 17.239 b) and 17.240 on Pangolins (Manis spp.). Prepared by IUCN for the CITES SecretariatSC69 Doc, 57. 2017. Available online: https://cites.org/sites/default/files/eng/com/sc/69/E-SC69-57-A.pdf (accessed on 26 October 2019).
  21. Heinrich, S.; Wittman, T.A.; Ross, J.V.; Shepherd, C.R.; Challender, D.W.S.; Cassey, P. The Global Trafficking of Pangolins: A comprehensive summary of seizures and trafficking routes from 2010–2015. TRAFFIC. Southeast Asia Regional Office: Petaling Jaya, Selangor, Malaysia, 2017. [Google Scholar]
  22. Acharya, S.; Rayamajhi, S.; Sharma, S.; Upadhaya, S.; Joshi, S.; Lamichhane, S. Anthropogenic threats to survival of the critically endangered Chinese pangolins (Manis pentadactyla) and their habitat in Kavrepalanchowk Nepal. J. Biodiver. Endanger. Species 2018, 6, 218. [Google Scholar]
  23. Katuwal, H.B.; Neupane, K.R.; Adhikari, D.; Sharma, M.; Thapa, S. Pangolins in eastern Nepal: trade and ethno-medicinal importance. J. Threat. Taxa 2015, 7, 7563–7567. [Google Scholar] [CrossRef]
  24. Kaspal, P.; Shah, K.B.; Baral, H.S. Saalak (i.e., Pangolin); Himalayan Nature: Kathmandu, Nepal, 2016. [Google Scholar]
  25. Mohapatra, R.K.; Panda, S.; Acharjyo, L.N.; Nair, M.V.; Challender, D.W. A note on the illegal trade and use of pangolin body parts in India. Traffic Bullet. 2015, 27, 33–40. [Google Scholar]
  26. Newton, P.; Van Thai, N.; Roberton, S.; Bell, D. Pangolins in peril: Using local hunters’ knowledge to conserve elusive species in Vietnam. Endanger. Species Res. 2008, 6, 41–53. [Google Scholar] [CrossRef]
  27. Gurung, J.B. A pangolin survey in Royal Nagarjung Forest in Kathmandu, Nepal. Tiger Paper 1996, 23, 29–32. [Google Scholar]
  28. Bhandari, N.; Chalise, M.K. Habitat and distribution of Chinese pangolin (Manis pentadactyla Linnaeus, 1758) in Nagarjun Forest of Shivapuri-Nagarjun National Park, Nepal. Nepalese J. Zool. 2014, 2, 18–25. [Google Scholar]
  29. Katuwal, H.B.; Sharma, H.P.; Parajuli, K. Anthropogenic impacts on the occurrence of the critically endangered Chinese pangolin (Manis pentadactyla) in Nepal. J. Mammal. 2017, 98, 1667–1673. [Google Scholar] [CrossRef]
  30. Paudel, B.; Zhang, Y.l.; Li, S.-C.; Liu, L.-S.; Wu, X.; Khanal, N.R. Review of studies on land use and land cover change in Nepal. J. Mt. Sci. 2016, 13, 643–660. [Google Scholar] [CrossRef]
  31. DNPWC; DoF. Pangolin Conservation Action Plan for Nepal (2018-2022); Department of National Parks and Wildlife Conservation and Department of Forests: Kathmandu, Nepal, 2018. [Google Scholar]
  32. Benítez-López, A.; Alkemade, R.; Verweij, P.A. The impacts of roads and other infrastructure on mammal and bird populations: a meta-analysis. Biol. Conserv. 2010, 143, 1307–1316. [Google Scholar] [CrossRef] [Green Version]
  33. Canova, L.; Balestrieri, A. Long-term monitoring by roadkill counts of mammal populations living in intensively cultivated landscapes. Biodivers. Conserv. 2019, 28, 97–113. [Google Scholar] [CrossRef]
  34. Schtickzelle, N.; Baguette, M. Behavioural responses to habitat patch boundaries restrict dispersal and generate emigration - patch area relationships in fragmented landscapes. J. Anim. Ecol. 2003, 72, 533–545. [Google Scholar] [CrossRef] [PubMed]
  35. Phillips, S.J.; Anderson, R.P.; Schapire, R.E. Maximum entropy modeling of species geographic distributions. Ecol. Modell. 2006, 6, 231–259. [Google Scholar] [CrossRef] [Green Version]
  36. Phillips, S.J.; Dudík, M.; Schapire, R.E. A maximum entropy approach to species distribution modeling. In Proceedings of the 21st International Conference on Machine Learning; ACM Press: New York, NY, USA, 2004; p. 655. Available online: https://www.cs.princeton.edu/~schapire/papers/maxent_icml.pdf (accessed on 26 October 2019).
  37. Philipps, S.J.; Dudı´k, M. Modeling of species distributions with Maxent: new extensions and a comprehensive evaluation. Ecography 2008, 31, 161–175. [Google Scholar] [CrossRef]
  38. Elith, J.; Phillips, S.J.; Hastie, T.; Dudík, M.; Chee, Y.E.; Yates, C.J. A statistical explanation of MaxEnt for ecologists. Divers. Distrib. 2011, 17, 43–57. [Google Scholar] [CrossRef]
  39. Wilson, K.A.; Carwardine, J.; Possingham, H.P. Setting conservation priorities. Ann. N. Y. Acad. Sci. 2009, 1162, 237–264. [Google Scholar] [CrossRef]
  40. LRMP. Land Resources Mapping Project. Kathmandu, Nepal: Survey Department, His majesty Government of Nepal and Kenting Earth Sciences; Government of Nepal and Government of Canada, Land Resources Mapping Project: Kathmandu, Nepal, 1986.
  41. Baral, H.S.; Shah, K.B. Wild Mammals of Nepal, Himalayan Nature: Kathmandu, Nepal, 2008.
  42. Hijmans, R.J.; Cameron, S.E.; Parra, J.L.; Jones, P.G.; Jarvis, A. Very high resolution interpolated climate surfaces for global land areas. Int. J. Climatol. 2005, 25, 1965–1978. [Google Scholar] [CrossRef]
  43. Peterson, A.T.; Soberón, J.; Pearson, R.G.; Anderson, R.P.; Martínez-Meyer, E.; Nakamura, M.; Araújo, M.B. Ecological niches and geographic distributions (MPB-49). Princeton University Press: Princeton, NJ, USA, 2011; Volume 56. [Google Scholar]
  44. Phillips, S.J.; Dudik, M.; Elith, J.; Graham, C.H.; Lehmann, A.; Leathwick, J.; Ferrier, S. Sample selection bias and presence-only distribution models: implications for background and pseudo-absence data. Ecol. Appl. 2009, 19, 181–197. [Google Scholar] [CrossRef] [PubMed] [Green Version]
  45. Fielding, A.H.; Bell, J.F. A review of methods for the assessment of prediction errors in conservation presence/absence models. Environ. Conserv. 1997, 24, 38–49. [Google Scholar] [CrossRef]
  46. Hajian-Tilaki, K. Receiver operating characteristic (ROC) curve analysis for medical diagnostic test evaluation. Caspian. J. Intern. Med. 2013, 4, 627–635. [Google Scholar]
  47. Lobo, J.M.; Jiménez-valverde, A.; Real, R. AUC: A misleading measure of the performance of predictive distribution models. Glob. Ecol. Biogeogr. 2008, 17, 145–151. [Google Scholar] [CrossRef]
  48. Allouche, O.; Tsoar, A.; Kadmon, R. Assessing the accuracy of species distribution models: Prevalence, kappa and the true skill statistic (TSS). J. Appl. Ecol. 2006, 43, 1223–1232. [Google Scholar] [CrossRef]
  49. R Development Core Team. R. A Language and Environment for Statistical Computing; R Foundation for Statistical Computing: Viena, Austria, 2017. [Google Scholar]
  50. Liu, C.; White, M.; Newell, G. Selecting thresholds for the prediction of species occurrence with presence-only data. J. Biogeogr. 2013, 40, 778–789. [Google Scholar] [CrossRef]
  51. Rimal, B.; Zhang, L.; Keshtkar, H.; Haack, B.; Rijal, S.; Zhang, P. Land use/land cover dynamics and modeling of urban land expansion by the integration of cellular automata and markov chain. ISPRS Int. J. Geo-Inf. 2018, 7, 154. [Google Scholar] [CrossRef] [Green Version]
  52. Schneider, A. Monitoring land cover change in urban and peri-urban areas using dense time stacks of Landsat satellite data and a data mining approach. Remote Sens. Environ. 2012, 124, 689–704. [Google Scholar] [CrossRef]
  53. Kavzoglu, T.; Colkesen, I. A kernel functions analysis for support vector machines for land cover classification. Int. J. Appl. Earth Obs. Geoinf. 2009, 11, 352–359. [Google Scholar] [CrossRef]
  54. Sothe, C.; de Almeida, C.M.; Liesenberg, V.; Schimalski, M.B. Evaluating Sentinel-2 and Landsat-8 data to map sucessional forest stages in a subtropical forest in Southern Brazil. Remote Sens. 2017, 9, 838. [Google Scholar] [CrossRef] [Green Version]
  55. Xiong, J.; Thenkabail, P.S.; Tilton, J.C.; Gumma, M.K.; Teluguntla, P.; Id, A.O.; Id, R.G.C.; Id, K.Y.; Gorelick, N. Nominal 30-m cropland extent map of continental Africa by integrating pixel-based and object-based algorithms using sentinel-2 and landsat-8 data on Google Earth Engine. Remote Sens. 2017, 9, 1065. [Google Scholar] [CrossRef] [Green Version]
  56. Anderson, J.R.; Hardy, E.E.; Roach, J.T.; Witmer, R.E. A Land Use and Land Cover Classification System for Use with Remote Sensor Data; U.S. Geological Survey, 604 South Pickett Street, Alexandria, VA 22304; 1976. Available online: https://pubs.usgs.gov/pp/0964/report.pdf (accessed on 26 October 2019).
  57. Campbell, J.B.; Wynne, R.H. Introduction to Remote Sensing, 5th ed.Guilford Press: New York, NY, USA, 2011. [Google Scholar]
  58. GoN. Topographical Map. Min Bhawan: Kathmandu, Nepal, 1995. [Google Scholar]
  59. Yang, C.W.; Guo, J.C.; Li, Z.W.; Yuan, X.W.; Cai, Y.L.; Fan, Z.Y. Studies on Taiwan Chinese pangolin. Taibei Zoo: Taibei, China, 2001. [Google Scholar]
  60. Heath, M.E.; Hammel, H.T. Body temperature and rate of O2 consumption in Chinese pangolins. Am. J. Physiol. Regul. Integr. Comp. Physiol. 1986, 250, 377–382. [Google Scholar] [CrossRef] [PubMed]
  61. Nikol’skii, A.A. Relative effects of soil and surface air on mammal burrow temperature: a study of the bobac burrow as an example. Gener. Biol. 2002, 382, 25–27. [Google Scholar]
  62. Nikol’skii, A.A.; Khutorskoi, M.D. Thermal characteristics of mammalian burrows in summer (using a burrow of the steppe marmot as an example). Gener. Biol. 2001, 378, 240–243. [Google Scholar]
  63. Nikol’skii, A.A.; Savchenko, G.A. Air temperature changes in a steppe marmot burrow in the summer-autumn period. Russian J. Ecol. 2002, 33, 109–114. [Google Scholar] [CrossRef]
  64. Wu, S.B.; Liu, N.F.; Ma, G.Z.; Xu, Z.R.; Chen, H. Habitat selection by Chinese pangolin (Manis pentadactyla) in winter in Dawuling Natural Reserve. Mammalia 2003, 67, 493–501. [Google Scholar] [CrossRef]
  65. Bao, F.; Wu, S.; Su, C.; Yang, L.; Zhang, F.; Ma, G. Air temperature changes in a burrow of Chinese pangolin, Manis pentadactyla, in winter. Folia Zool. 2013, 62, 42–48. [Google Scholar] [CrossRef]
  66. Okwakol, M.J.N.; Sekamatte, M.B. Review article soil macrofauna research in ecosystems in Uganda. Afr. J. Ecol. 2007, 45, 2–8. [Google Scholar] [CrossRef]
  67. Ellwood, M.D.; Jones, D.T.; Foster, W.A. Canopy ferns in lowland dipterocarp forest support a prolific abundance of ants, termites, and other invertebrates. Biotropica 2002, 34, 575–583. [Google Scholar] [CrossRef]
  68. Eggleton, P.; Bignell, D.E.; Sands, W.A.; Mawdsley, N.A.; Lawton, J.H.; Wood, T.G.; Bignell, N.C. The diversity, abundance and biomass of termites under differing levels of disturbance in the Mbalmayo Forest Reserve, southern Cameroon. Philos. Trans. R. Soc. Lond. B Biol. Sci. 1996, 351, 51–68. [Google Scholar]
  69. Lee, R.H.; Cheung, K.; Fellowes, J.R.; Guenard, B. Insights Into the Chinese Pangolin’s (Manis pentadactyla) diet in a peri-urban habitat: a case study from Hong Kong. Trop. Conserv. Sci. 2017, 10, 1–7. [Google Scholar] [CrossRef] [Green Version]
  70. Shrestha, U.B.; Shrestha, B.B.; Shrestha, S. Biodiversity conservation in community forests of Nepal: Rhetoric and reality. Int. J. Biodivers. Conserv. 2010, 2, 98–104. [Google Scholar]
  71. Kunwar, R.M.; Sharma, S.P. Quantitative analysis of tree species in two community forests of Dolpa district, mid-west Nepal. Himalayan J. Sci. 2004, 2, 23–28. [Google Scholar] [CrossRef]
  72. Reddy, C.S.; Vazeed, P.S.; Satish, K.V.; Saranya, K.R.L.; Jha, C.S.; Krishna Murthy, Y.V.N. Quantifying nationwide land cover and historical changes in forests of Nepal (1930–2014): implications on forest fragmentation. Biodivers. Conserv. 2018, 27, 91–107. [Google Scholar] [CrossRef]
  73. Karawita, H.; Perera, P.; Dayawansa, N.; Dias, S. Dietary composition and foraging habitats of the Indian Pangolin (Manis crassicaudata) in a tropical lowland forest-associated landscape in southwest Sri Lanka. Glob. Ecol. Conserv. 2020, e00880. [Google Scholar] [CrossRef]
  74. Hobbs, R.J.; Saunders, D.A. (Eds.) Reintegrating Fragmented Landscapes: Towards Sustainable Production and Nature Conservation; Springer Science & Business Media: Berlin, Germany, 2012. [Google Scholar]
  75. Carter, A.S.; Gilmour, D.A. Increase in tree cover in private farmland in central Nepal. Mt. Res. Dev. 1989, 9, 381–391. [Google Scholar] [CrossRef]
  76. Acharya, K.P. Linking trees on farms with biodiversity conservation in subsistence farming systems in Nepal. Bioderv. Conserv. 2006, 15, 631–646. [Google Scholar] [CrossRef]
  77. Rimal, B.; Sharma, R.; Kunwar, R.; Keshtkar, H.; Stork, N.E.; Rijal, S.; Rahman, S.A.; Baral, H. Effects of land use and land cover change on ecosystem services in the Koshi River Basin, Eastern Nepal. Ecosyst. Serv. 2019, 38, 100963. [Google Scholar] [CrossRef]
  78. Dhakal, B.; Bigsby, H.; Cullen, R. Impacts of community forestry development on livestock-based livelihood in Nepal. J. Forest Livelihood 2005, 4, 43–49. [Google Scholar]
  79. Gautam, A.P.; Webb, E.L.; Shivakoti, G.P.; Zoebisch, M.A. Land use dynamics and landscape change pattern in a mountain watershed in Nepal. Agric. Ecosyst. Environ. 2003, 99, 83–96. [Google Scholar] [CrossRef]
  80. Clements, G.R.; Lynam, A.J.; Gaveau, D.; Yap, W.L.; Lhota, S.; Goosem, M.; Laurance, S.; Laurance, W.F. Where and how are roads endangering mammals in Southeast Asia’s forests? PLOS ONE 2014, 9, 1–25. [Google Scholar] [CrossRef] [Green Version]
  81. Yang, L.; Chen, M.; Challender, D.W.S.; Waterman, C.; Zhang, C.; Huo, Z.; Liu, H.; Luan, X. Historical data for conservation: reconstructing range changes of Chinese pangolin (Manis pentadactyla) in eastern China (1970–2016). Proc. R. Soc. B Biol. Sci. 2018, 285, 20181084. [Google Scholar] [CrossRef] [Green Version]
  82. Thapa, P.; Khatiwada, A.P.; Nepali, S.C.; Paudel, S. Chinese Pangolin (Manis pentadactyla) in Nangkholyang VDC, Taplejung, Eastern Nepal. Am. J. Zool. Res. 2014, 2, 16–21. [Google Scholar]
  83. Bajracharya, S.B.; Furley, P.A.; Newton, A.C. Impacts of community-based conservation on local communities in the Annapurna Conservation Area, Nepal. Biodivers. Conserv. 2006, 15, 2765–2786. [Google Scholar] [CrossRef]
  84. Budhathoki, P. Linking communities with conservation in developing countries: Buffer zone management initiatives in Nepal. Oryx 2004, 38, 334–341. [Google Scholar] [CrossRef] [Green Version]
  85. Sharma, H.P.; Belant, J.L.; Shaner, P.J.L. Attitudes towards conservation of the Endangered red panda Ailurus fulgens in Nepal: A case study in protected and non-protected areas. Oryx 2019, 53, 542–547. [Google Scholar] [CrossRef]
Figure 1. Distribution of Chinese pangolin (Manis pentadactyla) occurrence locations in Nepal during 2008–2019. Only Chinese pangolin occurrence districts and the names of the provinces along with the physiographic regions are provided in the figure.
Sustainability 12 01282 g001
Figure 2. Established transects during the Chinese pangolin (Manis pentadactyla) survey in Central Nepal. Chinese pangolin presence (red color) and absence (green color) transects are shown.
Sustainability 12 01282 g002
Figure 3. Potential suitable habitat of the Chinese pangolin (Manis pentadactyla) in Nepal.
Sustainability 12 01282 g003
Figure 4. Chinese pangolin’s (Manis pentadactyla) potential suitable habitat with existing land cover in Nepal.
Sustainability 12 01282 g004
Figure 5. Chinese pangolin’s (Manis pentadactyla) potential suitable habitat with existing land cover and physiographic divisions in Nepal.
Sustainability 12 01282 g005
Figure 6. Chinese pangolin’s (Manis pentadactyla) potential suitable habitat with existing protected areas of Nepal.
Sustainability 12 01282 g006
Table 1. Chinese pangolin’s (Manis pentadactyla) predicted suitable bioclimatic range in different land covers according to Nepal’s physiographic division; the suitable habitat is encroached upon by settlements, cultivated land, barren land, and water bodies in Nepal.
Land Cover TypeChinese Pangolin’s Potential Suitable Habitat (Km2)Total Area (Km2)
Tarai < 300 mSiwalik 300–1000 mMid-hill 1000–3000 mMid-mountain 3000–5000 mHigh mountain > 5000 m
Settlements17.5410.68245.6014.010.00287.83
Cultivated260.64578.839868.281571.900.0412279.69
Forest189.692683.968841.472223.886.5713945.56
Shrub1.8893.97877.04255.100.371228.36
Barren24.27143.43179.6715.220.13362.72
Grassland0.1325.24323.27168.102.22518.96
Others7.7121.9186.6528.640.31145.22
Total501.873558.0120421.984276.849.6428768.35
Table 2. Chinese pangolin’s (Manis pentadactyla) predicted suitable bioclimatic range in different land use in Nepal according to province. Suitable habitats are encroached upon by settlements, cultivated land, barren land, and water bodies in Nepal.
Land Cover TypeChinese Pangolin’s Suitable Habitat (Km2)Total Area (km2)
Province 1Province 2Bagmati Province Gandaki Province
Settlement35.450.26187.6864.44287.83
Cultivated5452.4129.614576.032223.1012281.16
Forest5358.27527.415506.592551.5513943.83
Bush190.0455.46815.11167.951228.57
Barren120.1227.33192.3222.91362.68
Grassland69.242.48341.76105.54519.02
Others53.703.5572.2315.78145.25
Total11279.23646.1111691.725151.2928768.35

