An Informatization Scheme for Construction and Demolition Waste Supervision and Management in China

1
Fujian Provincial Key Laboratory of Advanced Technology Informatization in Civil Engineering, Fujian University of Technology, Fuzhou 350118, China
2
School of Civil Engineering, Fujian University of Technology, Fuzhou 350118, China
*
Author to whom correspondence should be addressed.
Sustainability 2020, 12(4), 1672; https://0-doi-org.brum.beds.ac.uk/10.3390/su12041672
Submission received: 29 January 2020
/
Revised: 16 February 2020
/
Accepted: 20 February 2020
/
Published: 23 February 2020
Abstract
:China is in a development period of urbanization construction, while its environment is threatened by an increasing amount of construction and demolition (C&D) waste. Due to the excessive pursuit of profits and a general lack of environmental awareness of stakeholders, illegal behaviors such as illegal dumping universally exist in the waste disposal process. Meanwhile, supervision departments face many challenges in collaborative management and decision-making, which lead to inefficiencies in C&D waste supervision and management in China. To address the above challenges, we propose an informatization scheme integrating multiple technologies, which will contribute to real-time monitoring of illegal behaviors in the waste disposal process, accurate data collection for evaluating the performance of stakeholders, and the enhancement of the collaboration between supervisory departments. A case study of the Ningbo Construction Waste Transportation Supervision System is introduced to verify the feasibility and effectiveness of the proposed scheme; results show that the total number of illegal cases has decreased from 510 to 89 per year since the system was put into operation.
1. Introduction
China is in a development period of urbanization construction. With the advancement of urbanization and shanty town transformation, urban buildings are being newly built, renovated, expanded, and demolished, which produces billions of tons of construction and demolition (C&D) waste every year [1]. C&D waste is a type of solid waste with complex components that not only affects the appearance of the city but also threatens the ecological environment. If it is not handled properly, it causes severe pollution to the environment and a negative social impact [2].
C&D waste management involves many stakeholders [3], such as construction companies, waste transport companies and their drivers, and the disposal facilities (e.g., transfer stations or landfills). The performance of the stakeholders directly affects the effectiveness of the C&D waste management. However, similar to other developing countries, construction industry stakeholders in China excessively pursue economic interests but generally lack environmental awareness, and illegal behaviors wildly occur in the waste disposal process [2]. For instance, despite the employment relationship between transport companies and vehicle drivers, drivers’ salaries are usually calculated by the tonnage of transport. Thus, drivers must earn more profits by increasing the volume of transport, while ignoring environmental protection and safety factors [4]. Some drivers who lack legal awareness exhibit several illegal behaviors, such as overloading, speeding, reverse driving, and irregular turning in unsupervised areas. Illegal dumping of C&D waste is also a perennial problem [5]. On the one hand, to reduce transport costs and dumping fees, some drivers dump C&D waste randomly in inappropriate areas along the way. On the other hand, there are also illegal waste disposal facilities that accept the C&D waste at a low cost. Additionally, due to negligence in transportation, scattering C&D waste along the way also threatens city environments. Due to the surreptitious nature, these illegal behaviors are difficult to monitor by law enforcement officers. To address these issues, government departments must play a leading role and take strong measures in the supervision of C&D waste [6,7].
C&D waste management is a multi-disciplinary field, an effective management performance depends on efficient collaboration between different supervision departments [8,9]. For China, multiple government departments are separately involved in different C&D waste management processes [2]. For instance, the Housing and Urban Construction Bureau mainly supervises C&D waste management of construction sites, and the Urban Management and Law Enforcement is responsible for the supervision of C&D waste transportation and punishment of illegal behaviors. The statistics of construction waste production and environmental assessment are under the supervision of the Ecological Environment Bureau, and the road pollution caused by the transportation of C&D waste is cleaned up under the supervision of the Environmental Sanitation Bureau. However, due to lack of a data sharing mechanisms, collaboration between them is difficult [10]. Gottschalk [11] pointed out that information asymmetry among public organizations may have a negative impact on the information poor, and the integration of information across organizational boundaries will help to mobilize limited resources and develop inter-organizational relationships. Casalino et al. [12] highlighted the importance of data interoperability for public departments, and argued that establishing a public information system for data search services will contribute to their collaboration. Therefore, it is necessary to develop a C&D waste supervision information system for realizing data sharing and collaboration among different supervision departments.
Developing a set of key performance indicators (KPIs) is necessary for estimating the performance of the C&D waste stakeholders. For instance, the waste generation rate (WGR) is usually considered to be a KPI for benchmarking waste management performance [13], which should be obtained through multi-dimensional analytics of a large scale of waste disposal records. However, there is no technical benchmark for the quantitative evaluation of the WGR in China yet, and the prediction of waste generation only depends on subjective judgment. For this reason, it is also difficult to enact a C&D waste reduction evaluation mechanism for the construction companies. In the past few years, application of big data technologies to improve the performance of C&D waste management has gradually attracted the interest of scholars. Lu et al. [13] developed a set of KPIs/WGRs as benchmarks for C&D waste management performance by mining 2,212,026 waste disposal records generated from 5764 projects undertaken in Hong Kong, and applied them to compare the performance between the public and private sectors [14]. Most recently, inspired by using big data to combat urban crime, Lu [5] proposed an approach to identify illegal construction waste dumping by mining more than nine million waste disposal records. Other scholars have studied big data methods for C&D waste analytics. For instance, Bilal [15] introduced a conceptual framework of a big data architecture and validated it for exploratory analytics of 200,000 waste records from 900 completed projects. Lee et al. [16] developed a hybrid estimation model combined artificial neural networks with ant colony optimization to predict the quantity and cost of waste in the early stage of construction. Although previous studies attempted to extract the value from C&D waste disposal data, data acquisition in China still faces many challenges. Waste disposal data is usually obtained manually, which requires more effort and time and is incomplete, slow, and prone to error. Moreover, the data is provided by stakeholders, which means there may be regulatory loopholes that compromise the authenticity of the data [17]. Therefore, a real-time and high-quality data acquisition scheme still requires further study.
As sensor technologies become increasingly ubiquitous in road vehicles, the application of the Internet of Things (IoT) provides an opportunity to improve the logistic management performance. Hopkins and Hawking [18] proposed an IoT-based scheme for a large logistics firm to improve driver safety, save operating costs and reduce environmental impact. In their approach, remote monitoring centers receive the real-time sensor data from the vehicles, capturing the likes of speed, location, braking, and engine data to send proactive alerts to drivers regarding possible upcoming hazards, while camera-based technologies are adopted to improve fatigue management and capture the evidence of important driving events. Wang et al. [19] developed a real-time vehicle management system integrated with IoT technologies such as Radio Frequency Identification (RFID), Geographical Information System (GIS), and Global Positioning System (GPS) to plan and schedule the vehicles’ optimum routings using real-time information in logistics or distribution services. Other researches attempt to establish an IoT-based theoretical model of a logistics management system; for example, Tu et al. [20] proposed a unified IoT framework to model the dynamics of distributed IoT processes, IoT devices, and IoT objects. On this basis, they presented an IoT-based cyber-physical system framework and evaluated its performance. Chen et al. [21] proposed an IoT-based framework for a logistic operation process, enterprises can develop their own cloud-based logistic management information systems based on this framework. In last decade, the application of IoT in logistics has aroused research interest of construction supply chain management (CSCM). Shin et al. [22] proposed a framework to manage the information of construction supply chain based on RFID and wireless sensor network technologies, and on this basis, Ergen et al. [23] further developed a simulation model to calculate the benefits of investment in the above approach; the simulation results indicate significant reductions in task durations and improvements in the efficiency of the process. Zhong et al. [24] developed a multi-dimensional IoT-enabled Building Information Modelling (BIM) platform to achieve real-time visibility and traceability in whole processes of prefabricated construction, and then adopted an actual construction project in Hong Kong to verify the effectiveness of the proposed approach. However, current application of IoT technologies in the CSCM mainly focuses on the delivery of material and components [25]. As an important part of supply chain in a construction project life cycle, C&D waste transportation has received little attention. In fact, an IoT-based approach will probably contribute to the real-time monitoring and data collection of the C&D waste transportation process.
This study proposed an informatization scheme integrating multiple technologies for C&D waste supervision and management in China, which will contribute to real-time monitoring of the waste disposal process for identifying potential illegal behaviors, accurate data collection for performance evaluation of the stakeholders, and data sharing between supervision departments for enhancing their coordination. The structure of this paper is as follows. An overview of the relevant technologies adopted in this scheme and the correlations among them is provided in Section 2. In Section 3, the framework of the proposed informatization scheme is illustrated from the perspective of physical and logical architectures. System functional analysis and a detailed design scheme are presented in Section 4. In Section 5, we presented a case study to verify the feasibility and implementation effect of the proposed scheme, followed by conclusions and prospects in Section 6.
2. Material and Methods
To better understand the material and methods of this study, an overview of the relevant technologies and correlations among them is provided in this section.
2.1. Sensor Technology
A sensor is a device capable of sensing a measured object and converting this information into usable output signals according to certain rules. A sensor consists of a sensitive element, conversion element, and conversion circuit. Sensor technology identifies, compares, classifies, and judges the input feature information set using a correlation between the measured object and the feature information [26]. Therefore, the function and quality of a sensor determines the quality of the measured object information acquired by the sensor system. At present, as the sensing layer components of the Internet of Things, sensors with network transmission functions have been widely used in remote monitoring or automatic control fields [27].
2.2. Video License Plate Recognition
Video license plate recognition (VLPR) is an application of computer video image recognition technology [28]. VLPR recognizes the unique license plate number of each vehicle through the analysis of the vehicle image or video sequence captured by a camera based on technologies such as image preprocessing, feature extraction, and character recognition.
2.3. Face Recognition
Face recognition is another application of computer video image recognition technology. Unlike VLPR, face recognition relies on more accurate recognition algorithms. The major challenge of face recognition is that it regards human faces, which may be similar or mutable, as biological features. Therefore, it was once considered to be one of the most difficult research topics in the field of artificial intelligence [29]. With the continuous improvement of intelligent recognition algorithms (e.g., feature-based recognition algorithms, appearance-based recognition algorithms, template-based recognition algorithms, and recognition algorithms using neural networks), the current face recognition technology has achieved high precision.
2.4. Global Positioning System
The global positioning system (GPS) is a real-time positioning and navigation system that uses satellite positioning. It consists of three parts: the GPS constellation, ground monitoring system, and user receiver. The ground monitoring system can obtain the precise position of the receiver by measuring the distance between a satellite with a known position and the user’s receiver and synthesize the data of several satellites [30]. Due to the high precision and reliable positioning service, a vehicle monitoring scheme can be built based on the GPS technology [31].
2.5. Mobile Communication Technology
Mobile communication is a communication mode between mobile and fixed-point objects or between mobile objects [32]. Since the cellular network technology was proposed by the Bell lab in the 1970s, the mobile communication system has entered a rapid development period. In the early 1990s, the European Telecommunication Standards Association proposed the Global System for Mobile Communications standard based on digital signals [33], which marked the birth of the 2nd Generation (2G) mobile communication system. From then on, the mobile communication network could transmit multimedia data. The 2G system was upgraded to 3rd and 4th generation technologies, and the 5th Generation (5G) mobile communication system will be ushered in soon, which will support higher speed and more reliable mobile data transmission [34]. The mobile communication network with seamless coverage and convenient access provides a solid material foundation for the practical application of the Internet of Things.
2.6. Mobile Digital Video Recorder
Mobile Digital Video Recorder (MDVR) is multiple camera video and audio recording systems that are installed within a vehicle to record and transmit an integrated data stream captured within and exterior to a vehicle [35]. In addition to supporting video capture and duplex voice calls it can also integrate data from sensors and GPS receivers through external serial ports and interconnect with a mobile network base station to achieve transmission of the data stream.
2.7. Geographic Information System
The Geographic Information System (GIS) is a computer system for analyzing and processing geographic data, which involves geoscience, cartography, remote sensing, and computer science [36]. It integrates unique visualization effects and the geographic analysis function of maps using general database operations (e.g., query and statistical analysis). Because the GPS provides geodetic coordinates in longitude and latitude format, the GIS can analyze and simulate geographic data and processes in space [37]. The GPS receiver transmits positioning data to the server through the mobile communication network and displays the status and trajectory of mobile objects in real time on an electronic map with GIS technology [38].
2.8. Big Data Analysis
Big data analysis refers to the collection, integration and analysis of large-scale data to extract valuable rules and knowledge that supports decision-making. Compared with traditional statistical analysis, big data analysis [39] utilizes all the data instead of requiring random sampling, accepts the data complexity and does not pursue accuracy, and focuses on discovering correlation rather than causality. The mainstream big data analysis techniques can be summarized as follows.
- Data mining: a process of discovering potential and valuable information through technical means, such as statistical analysis, online analytical processing, case-based reasoning, machine learning, text mining, and pattern recognition.
- Data visualization: the intuitive display of attributes or variables of the data by means of graphics and images, making it possible for either data analysts or ordinary users to gain more insights from the big data. For instance, by integrating with GIS technology, the spatial distribution of big data can be displayed by an electronic map.
- Predictive analysis: making qualitative trend judgments through data visualization or establishing a predictive model to quantitatively predict future trends based on historical data.
The data quality determines the effectiveness of the big data analysis, since real-time and accurate acquisition of the required data is critical. Compared with artificial input or semi-automated data acquisition, big data analysis is more reliable in that it interconnects real-time data streams from widely distributed sensors to data centers through the Internet of Things [15].
2.9. Cloud Computing
In its early stage, cloud computing was a distributed computing technology that decomposed a large data computing process into numerous small programs and processed them using multiple servers on the Internet. Currently, the concept of cloud computing has expanded to include distributed data storage and application services [40] that integrate computing technologies such as distributed computing, parallel computing, network storage, load balance, and virtualization. Combined with Internet of Things technology, cloud computing has been widely adopted in the field of remote monitoring [41] and acts as a technical solution for the real-time analysis and storage for monitoring data streams [42].
3. Framework of Proposed Informatization Scheme
3.1. Physical Architecture of Informatization Scheme
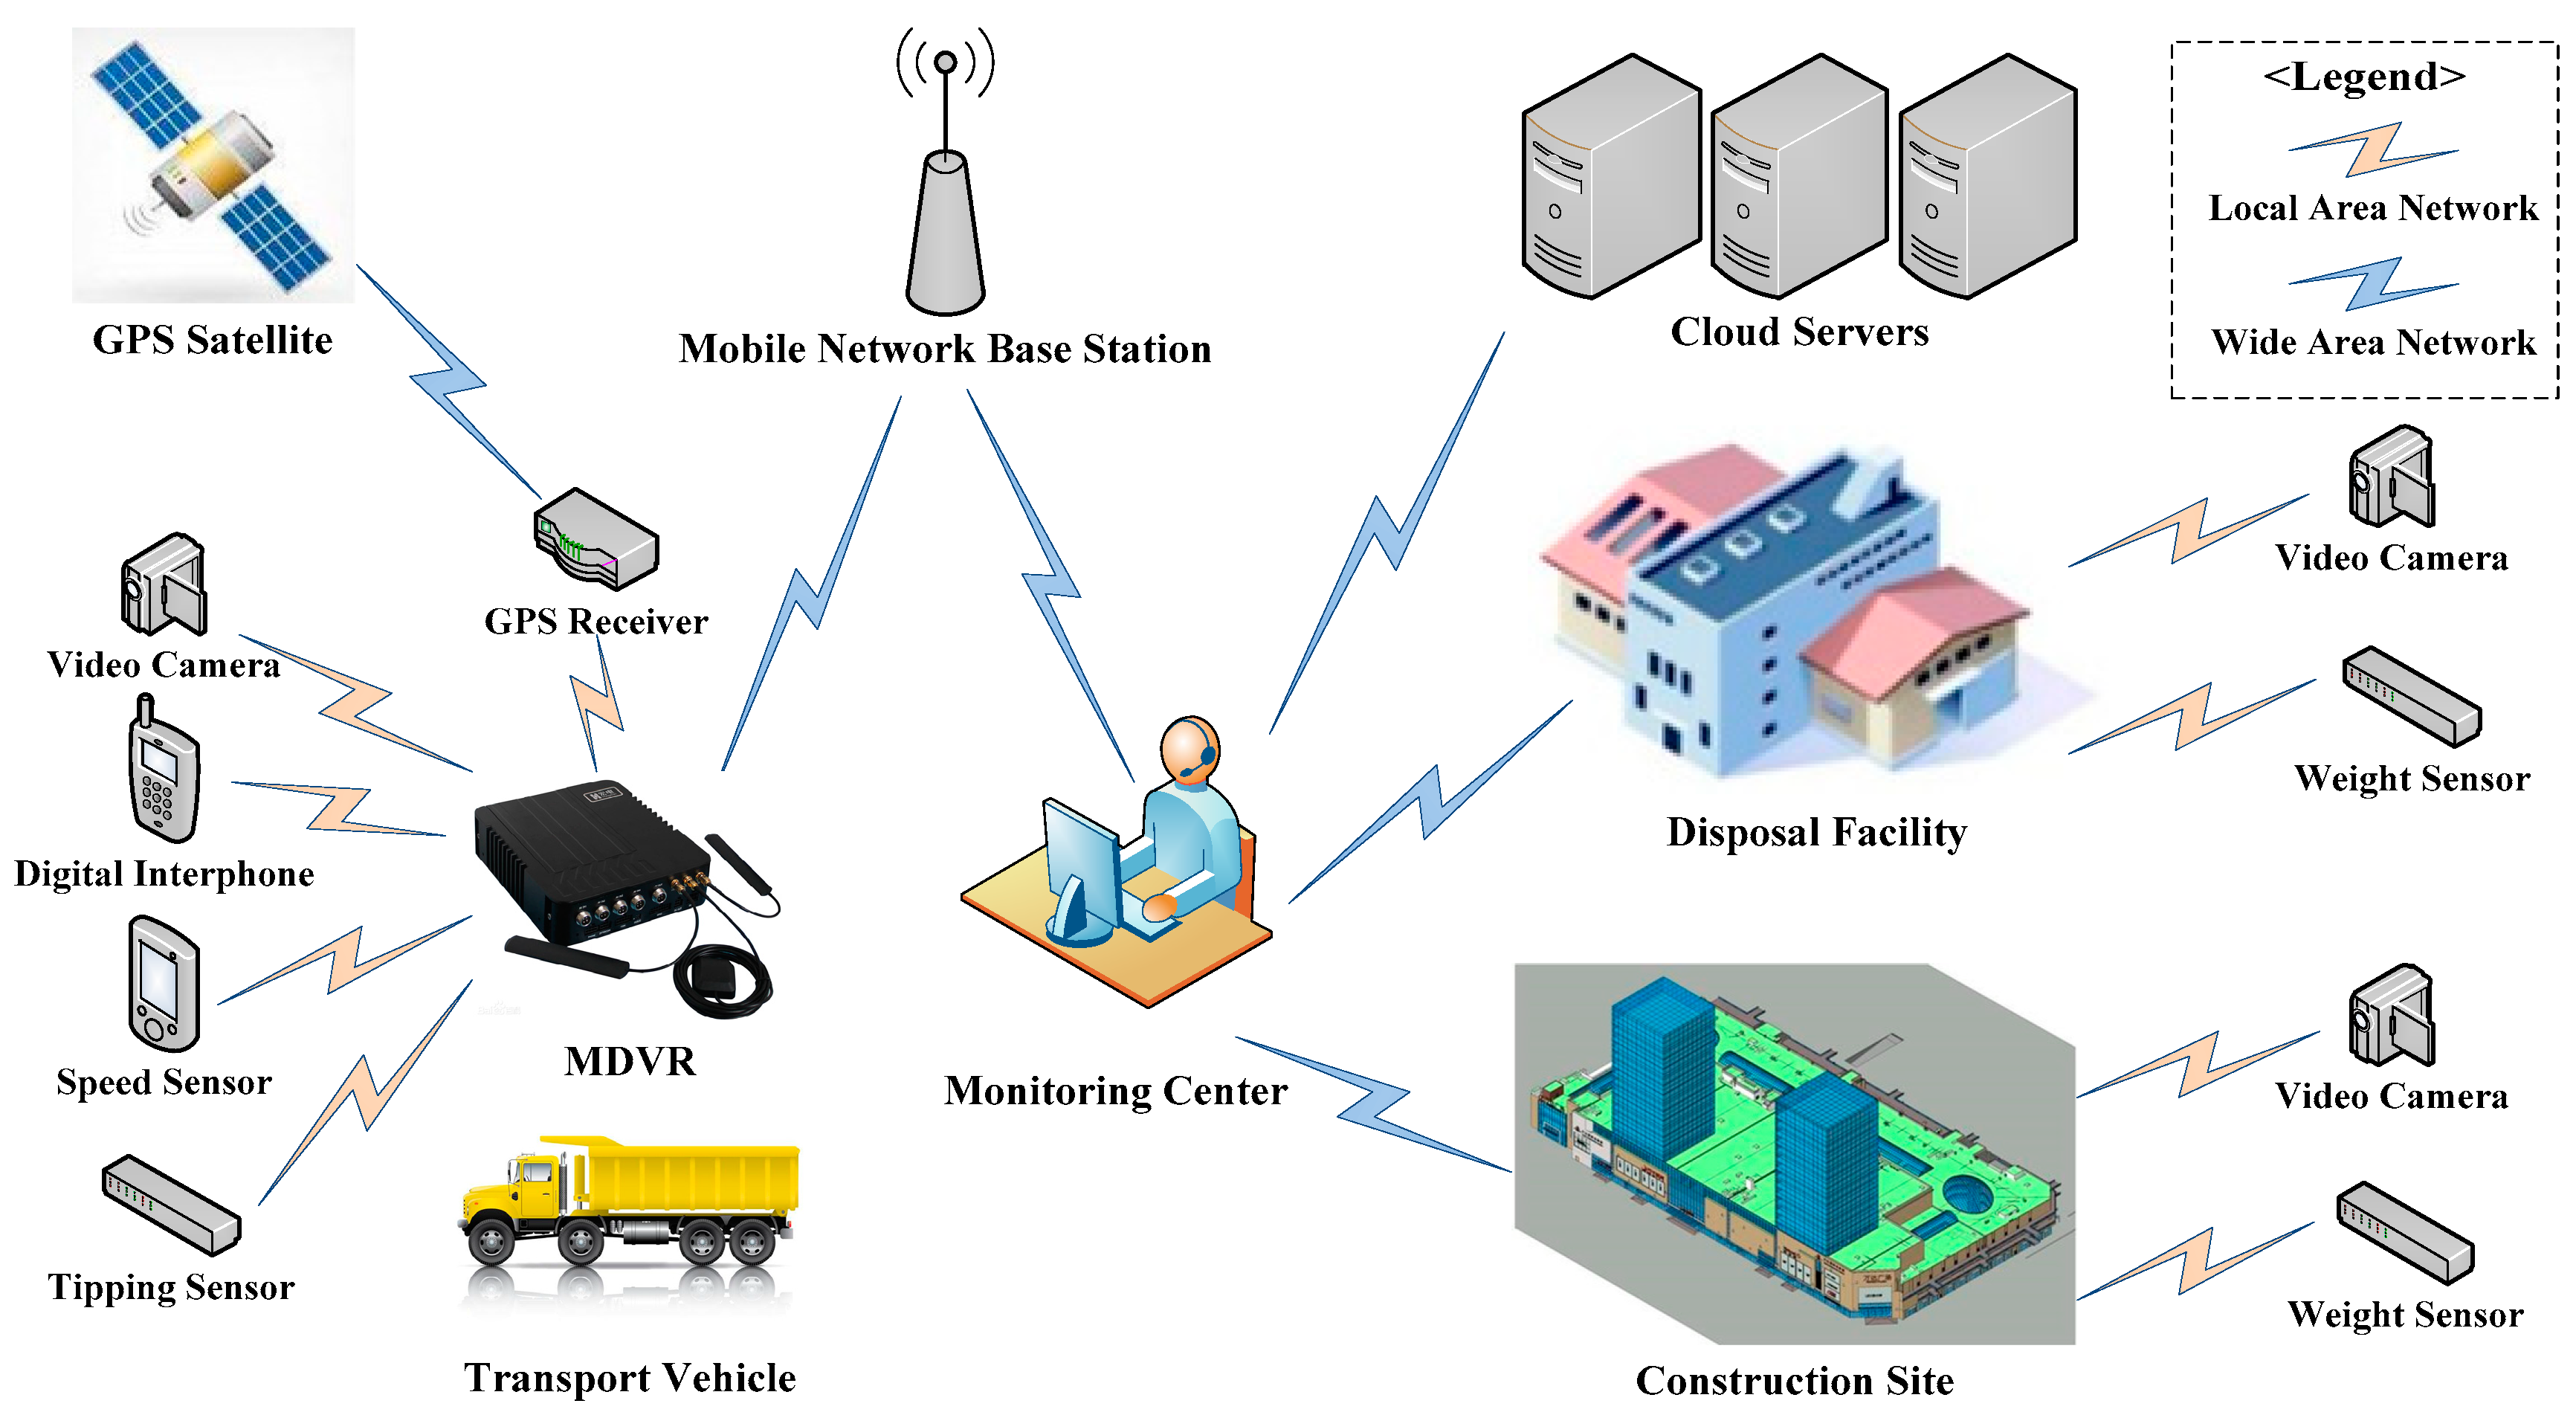
The physical architecture of an information system refers to the spatial topology of its hardware, network, and participants [43]. The physical architecture of the proposed informatization scheme is presented in Figure 1, and the main monitored objects are the construction sites, disposal facilities, vehicles, and drivers. The construction site and disposal facility are fixed monitored objects. They are equipped with a VLPR camera [28] and vehicle weight sensor [26] at their entrances and interconnected to the monitoring center through the Internet [27]. The vehicle and driver are mobile monitored objects, and each vehicle has an installed MDVR integrated with external devices [35], which are the GPS receiver for vehicle satellite positioning [31], a camera for driver face recognition and driving recording [29], digital interphones for communication between the driver and monitoring center, and sensors for the vehicle speed monitoring and vehicle tipping operation monitoring. The mobile network base station receives signals from the MDVR and interconnects with the monitoring center [33] through the telecommunication network. All monitoring data is stored in cloud servers for big data analysis and application [25].
3.2. Logical Architecture of Informatization Scheme
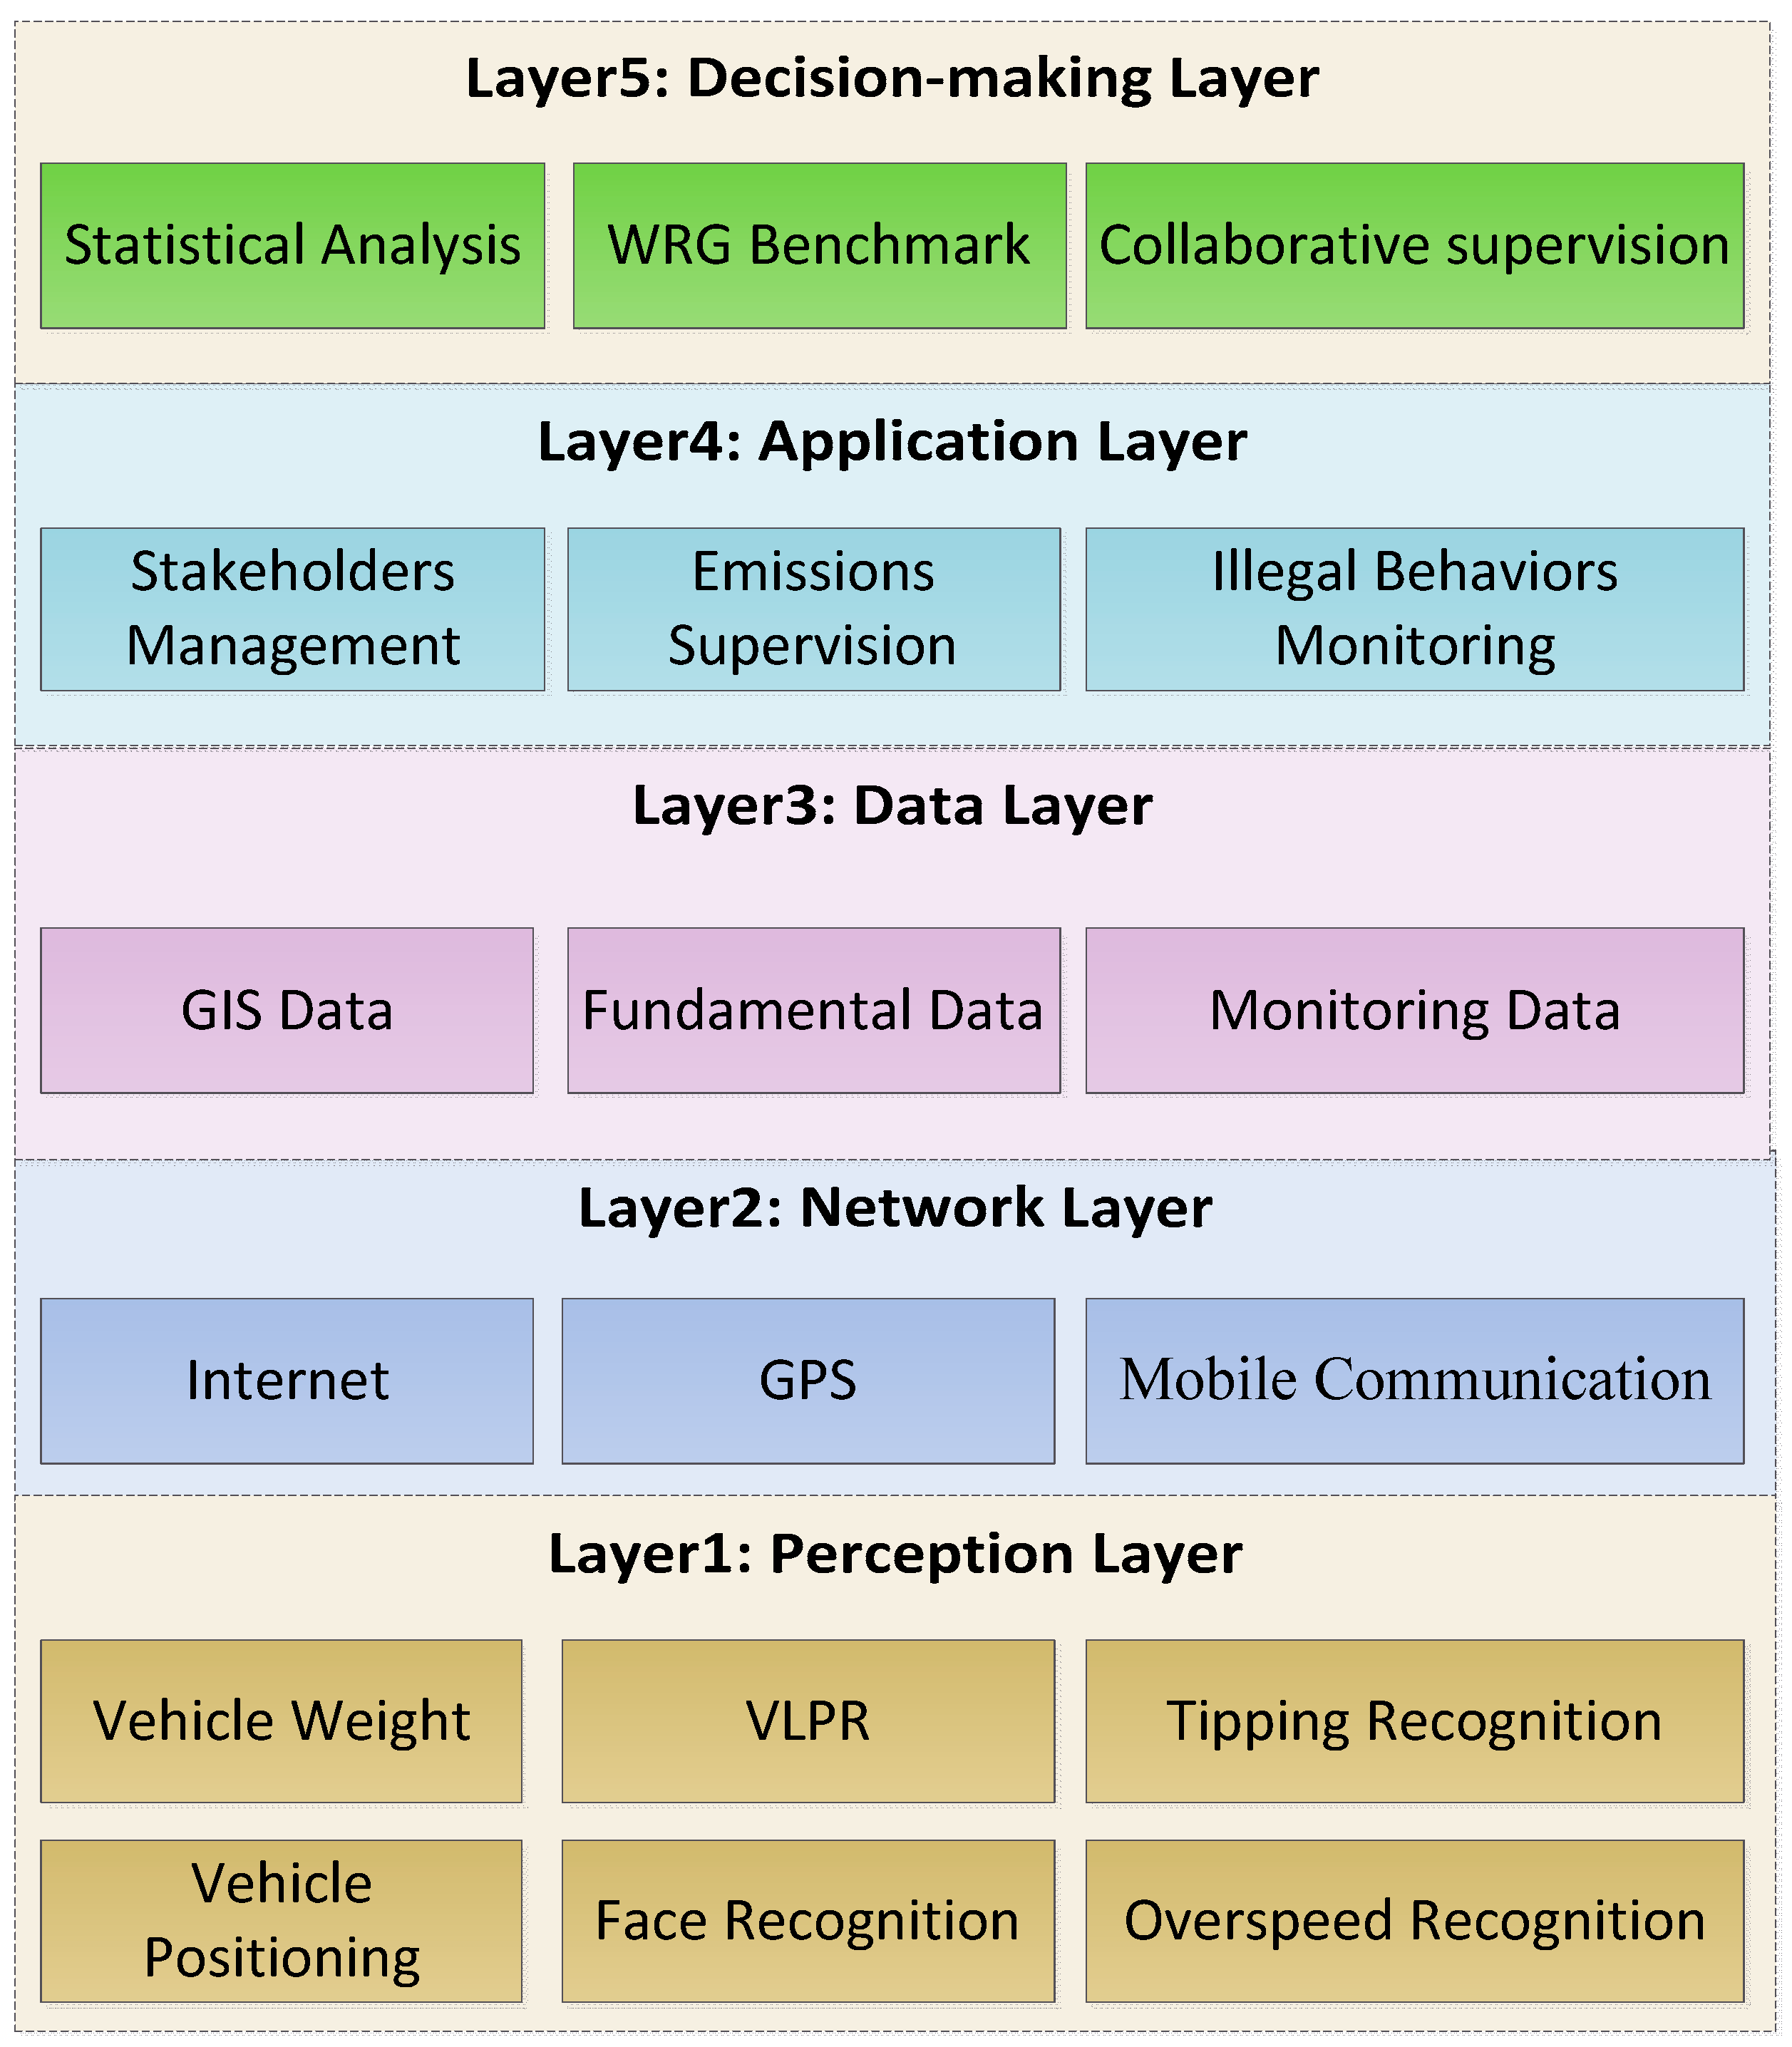
The logical architecture of the information system is a functional framework, which divides the system into several logical units and achieves their respective functions. As shown in Figure 2, the logical architecture of the proposed informatization scheme is divided into five layers: the perception layer, network layer, data layer, application layer, and decision-making layer.
(a) Perception layer
The perception layer is located at the bottom of the logical architecture, which is mainly responsible for the data acquisition. Devices in the perception layer such as sensors, video cameras and GPS receivers capture the attributes or status information of the corresponding monitored objects.
(b) Network layer
The network layer consists of Internet, GPS, and mobile communication network. This layer is responsible for transferring the data acquired by the perception layer to the data layer safely and reliably.
(c) Data layer
There are three types of data integrated in the data layer, which are deployed on the cloud servers. Fundamental data include the basic information of construction sites, waste disposal facilities, transportation companies, vehicles and drivers, and the waste disposal records associated with them, whereas the monitoring data are real-time data streams captured from the monitoring objects. They all must be integrated with the GIS data to achieve data visualization based on the electronic map.
(d) Application layer
The application layer is responsible for providing services to the users of the system, i.e., the supervisory departments. This layer includes a series of application programs customized to the user requirements, for instance, management of the C&D waste stakeholders, supervision of waste emissions, and identification of illegal behaviors during the transport process. These will be further discussed in Section 5.
(e) Decision-making layer
In the decision-making layer, multiple techniques are applied to analyze the C&D waste throughput and the benchmark of the WGR, which supports the decision-making of supervisory departments. In addition, the integration of big data and GIS technology provides visualization support for the monitoring center to coordinate different supervision departments.
4. Functional Analysis and Scheme Design
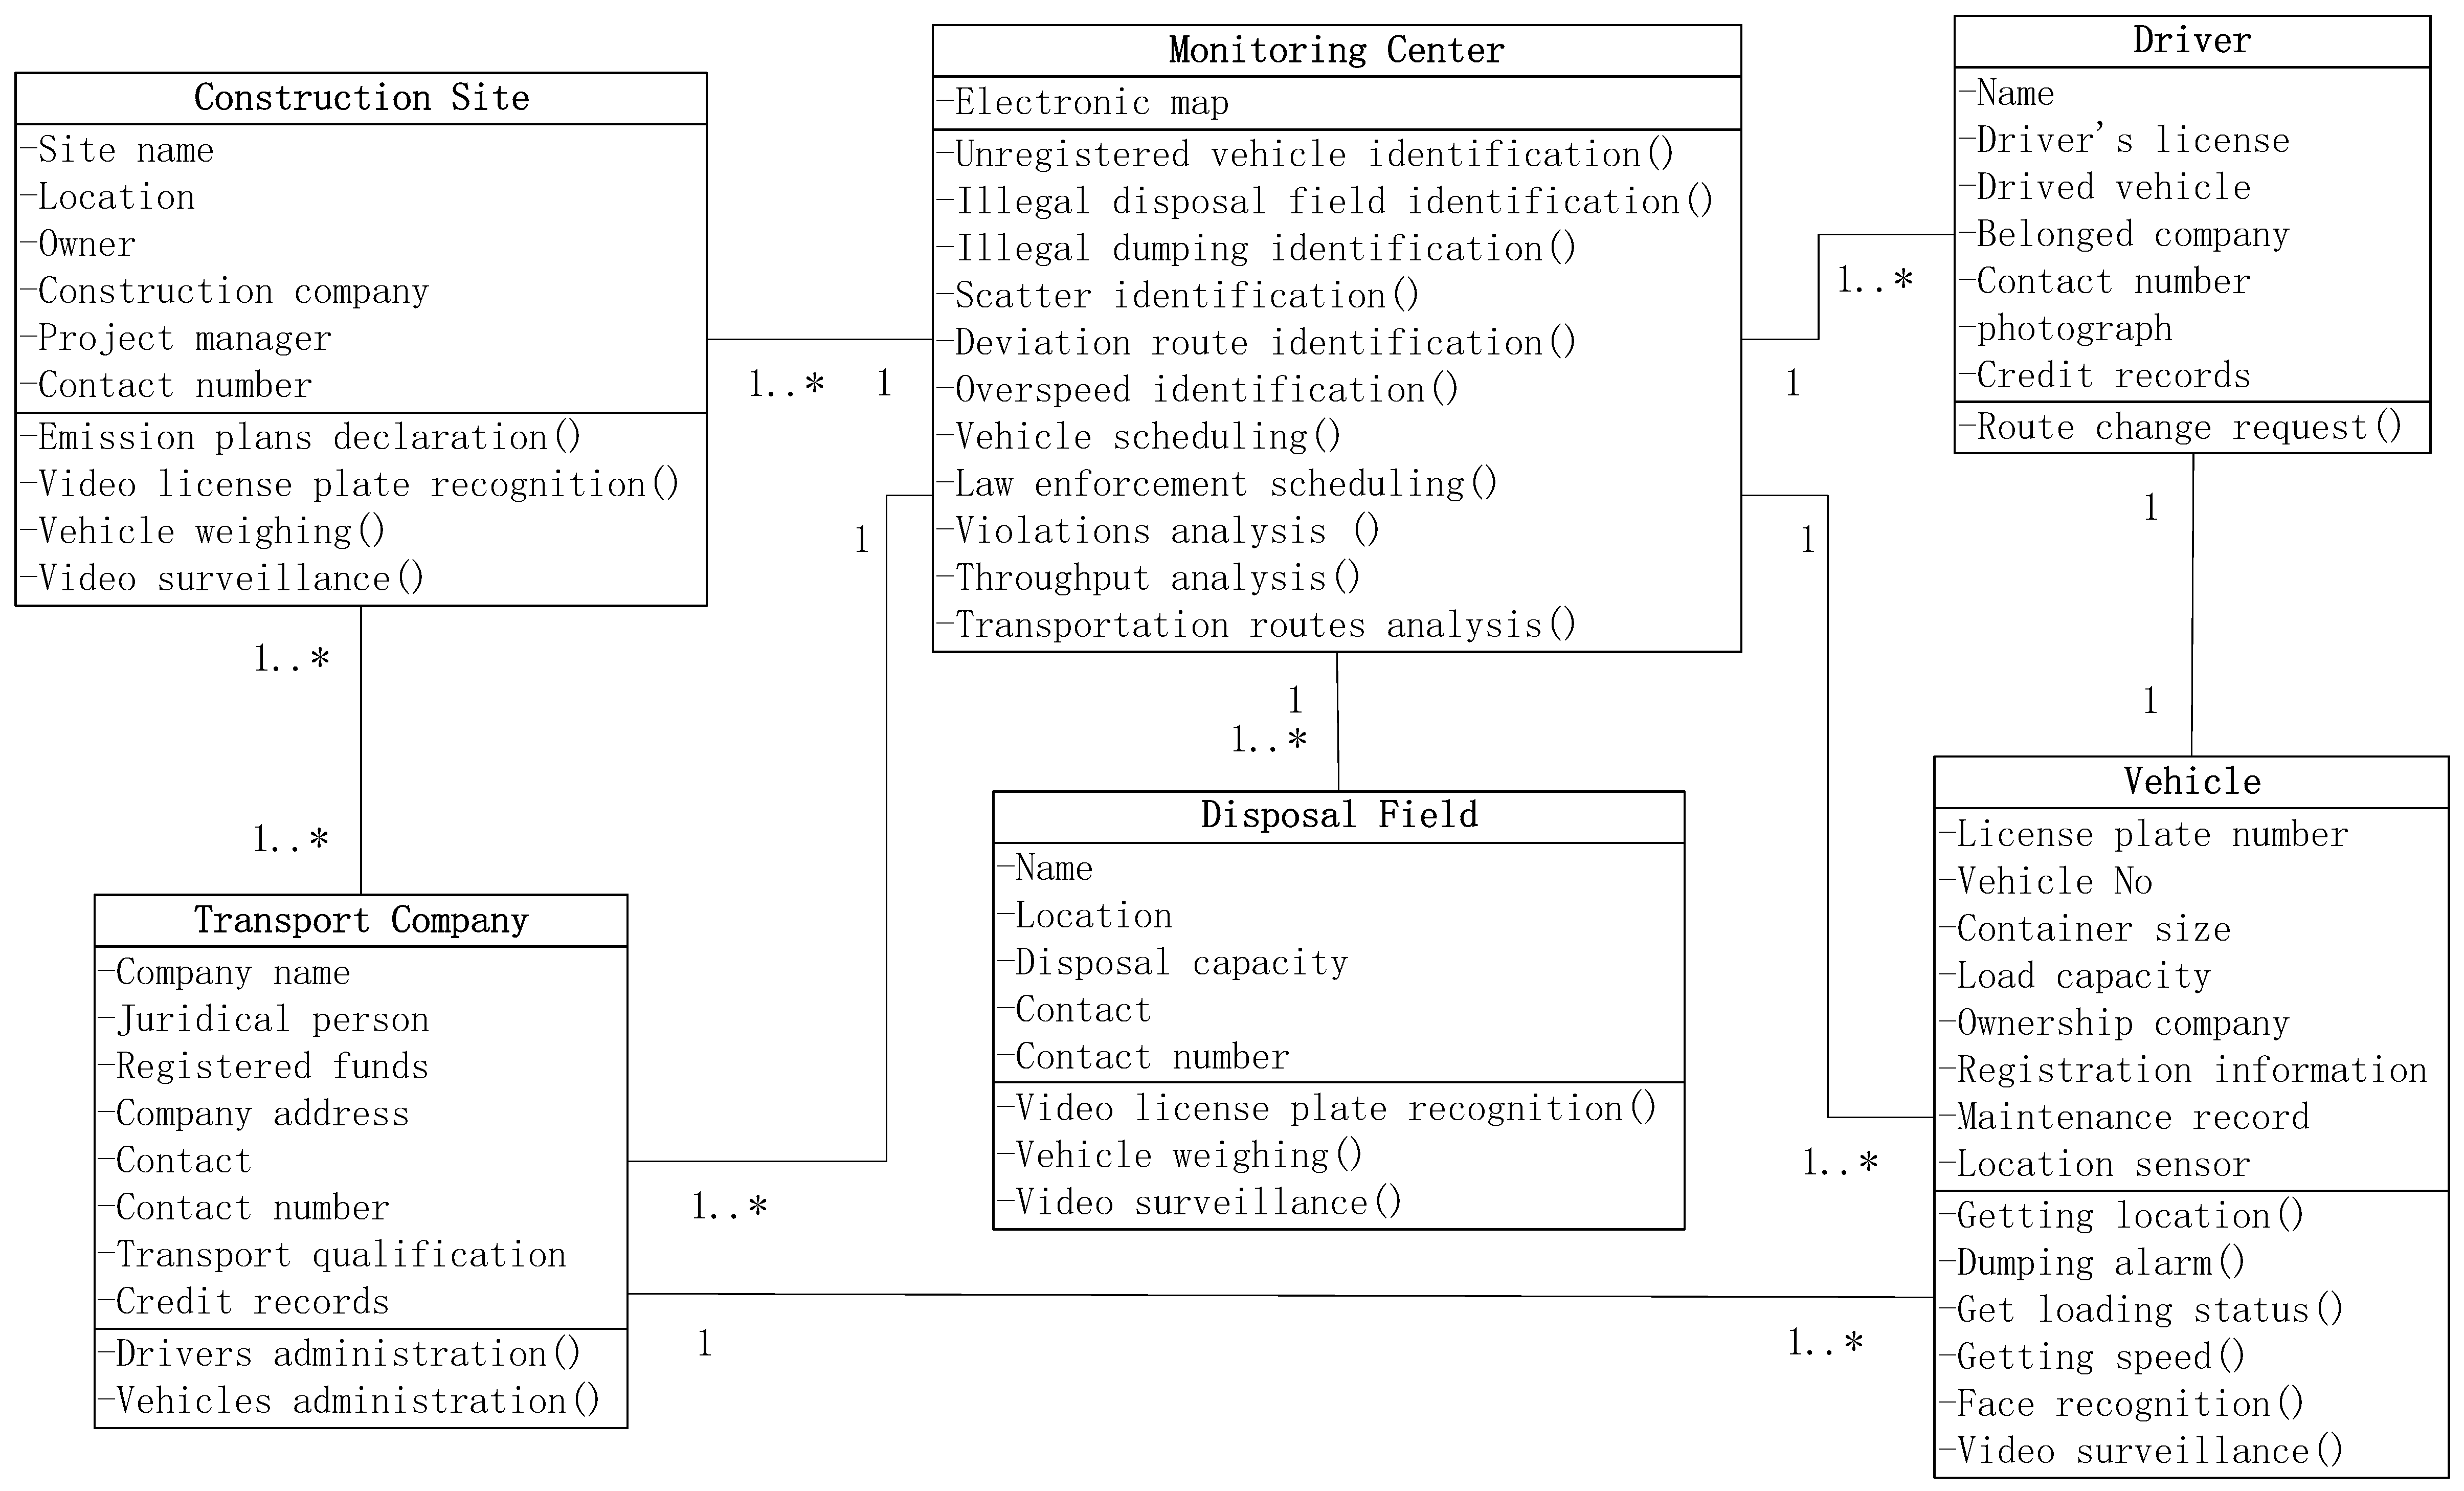
In this study, we adopted the object-oriented method for requirement analysis and scheme design, and unified modeling language (UML) for system modeling [43]. In object-oriented analysis and design methodology, a class is an abstraction of objects with common characteristics in the real world, which encapsulates the common attributes and methods of such objects. A class diagram is a static structure that describes the attributes and methods of classes and the relationship between classes. Figure 3 shows the class diagram of the proposed informatization scheme.
4.1. Information Management of C&D Waste Stakeholders
In addition to the monitoring center, there are five classes of the main stakeholders (monitoring objects) in C&D waste disposal: the construction site, disposal facility, transport company, vehicle, and driver, whose attributes are shown in Figure 3. Their basic information requires maintenance of the system, including new information, modification, deletion, and inquiry operations.
4.2. Supervision of C&D Waste Emissions
4.2.1. Declaration and Acceptance of C&D Waste Emission Plans
After a project is submitted for construction, the construction company should submit a master plan for C&D waste emission into the information system, and the contract with the registered transport companies should also be uploaded. The supervisory department accepts this after verification and designates disposal facilities and preset transportation routes for the vehicles.
4.2.2. Data Collection of Actual Waste Emissions
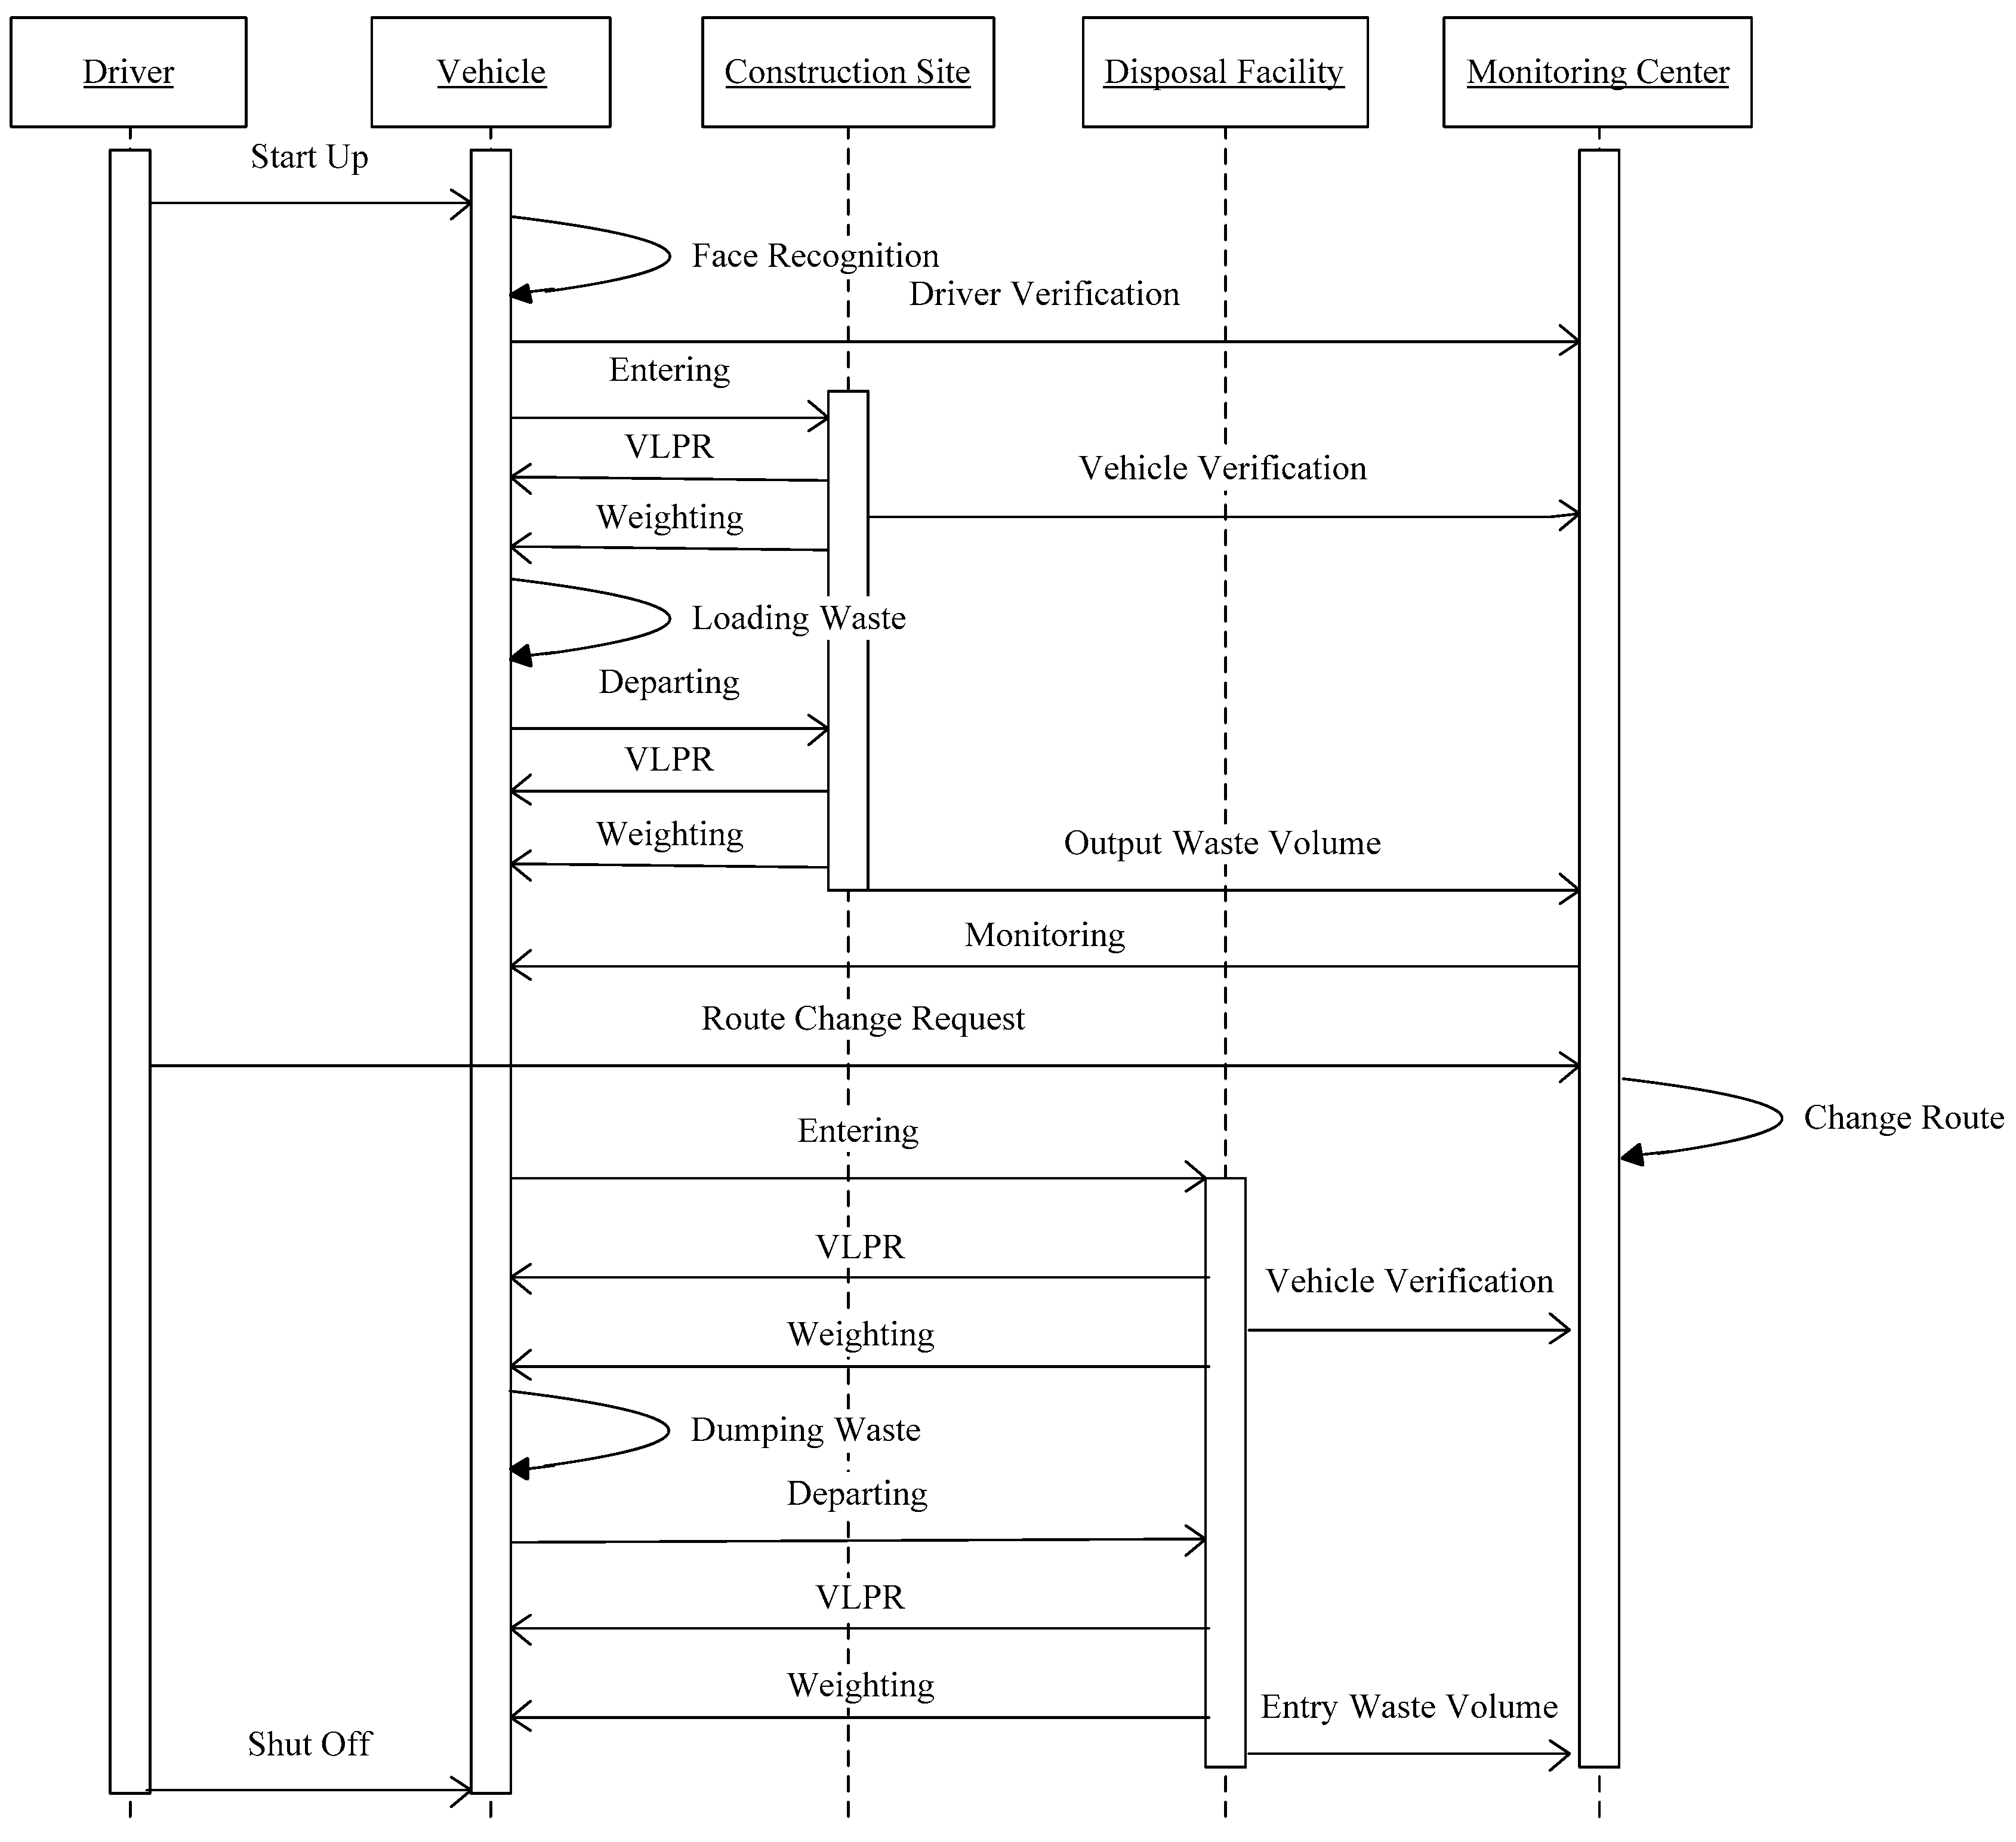
In this scheme, each C&D waste disposal process is supervised by the monitoring center. Figure 4 shows the sequence diagram of the supervision process. Whenever a vehicle enters or departs from a construction site, it goes through two stages: video license plate recognition (VLPR) and vehicle weighing. When a vehicle enters the construction site, the VLPR identifies whether the vehicle has been registered or not, and the vehicle is identified again when it has loaded waste and departs from the construction site. The output waste volume is the difference between the departure and entering weights. When a vehicle enters a disposal facility, it undergoes a similar VLPR and weighing process to calculate the entry waste volume. The records of the C&D waste emissions are stored for future data analysis.
4.3. Supervision of Illegal Behaviors in Waste Transportation Process
The whole process of waste transportation is monitored. Once illegal behaviors occur, the monitoring center will receive alarm information. Using the GIS, the location of illegal behaviors can be accurately located, which is convenient for law enforcement officers to collect evidence on the spot.
4.3.1. Identity Authentication of the Drivers
As shown in Figure 4, before a driver starts a vehicle, he or she must first authenticate him- or herself through the face recognition system, which compares the face image collected with images in the monitoring center database in turn and confirms that the current driver is legally registered. Otherwise, the vehicle is not able to start.
4.3.2. Illegal Dumping
When a vehicle is dumped, the container tipping sensor mounted on the vehicle captures the signal and sends it to the monitoring center. If the vehicle is in a non-designated position, this is considered to be potentially illegal dumping behavior.
4.3.3. Scattering Waste during Transit
In theory, the weight of a vehicle leaving a construction site should be equal to that entering a disposal facility. Once exceeding the allowable error range, the vehicle is considered to have scattered waste along the way.
4.3.4. Illegal Driving
Due to potential environmental pollution and security threats, waste transportation routes should avoid crowded commercial and residential areas. In this scheme, if the vehicle trajectory deviates from the prescribed route, the monitoring center will receive alarm information. As shown in Figure 4, if drivers must change transport routes for special reasons, they can make a request to the monitoring center. After obtaining permission, the route can be changed. Moreover, exceeding the speed limit, overloading and other illegal driving behaviors are captured by the monitoring center through sensor data.
4.3.5. Illegal Transport Vehicles
In addition to waste transport vehicles, there are many construction material transport vehicles entering and leaving a construction site, which makes it difficult to identify the illegal transportation of construction waste. In this scheme, the VLPR can identify unregistered vehicles, and the weight sensor will weigh each vehicle when entering or leaving the site. If an unregistered vehicle leaves the site heavier than it enters, it is considered a potential illegal waste transport vehicle.
4.3.6. Illegal Disposal Facilities
By tracking and locating vehicles, suspected illegal disposal facilities can be identified, and the monitoring center will obtain their exact locations through GIS.
4.3.7. Building Credit Evaluation Mechanism of Illegal Behaviors
Through the statistical analysis of the illegal behaviors, the credit evaluation mechanism of transport companies and the drivers can be established. All illegal behavior records are stored in the database. Drivers and transport companies that have committed serious or excessive amounts of illegal activities will be blacklisted.
4.4. Big Data Analysis and Application
4.4.1. Throughput Analysis of C&D Waste
In this scheme, the information system can collect real-time data of the waste emission of each construction site as well as waste collection from each disposal facility. Accurate collection of C&D waste throughput data is convenient for the monitoring center to perform statistical analysis of the waste emissions with multiple dimensions, such as times and regions, which provides a decision-making basis for disposal facility scheduling and transportation route planning. By comparing and analyzing the planned and actual waste emissions from construction sites, it is possible for the supervisory department to evaluate the performance of construction companies and help them determine the causes of the deviation. In addition, tracing waste throughput data also makes it convenient for the monitoring center to distinguish unusual situations. For instance, within a certain period of time, all waste transported from the construction sites should be approximately equal to the amount of waste received at the disposal facilities. If this is not the case, the monitoring center will analyze the throughput data to determine which transport process has problems.
4.4.2. Development of Waste Generation Rate Benchmark
As mentioned in the Introduction, the benchmark of the WGR is a quantitative standard for controlling C&D waste emissions that reflects the average waste generation capacity of construction sites in the region. It establishes a quantitative relationship between the C&D WGR and multiple factors, such as the project type, building structural type, and project location product system [13]. Based on big data technologies, the WGR for different types of projects can be formulated through analysis of historical data. In future work, the WGR can act as a scoring criterion for project tendering and an environmental protection KPI of the construction companies. Moreover, combined with the work breakdown structure, bill of quantities, and project schedule, the benchmark of the WGR could also be applied for predicting the future C&D waste generation amount.
4.4.3. Supporting Data Sharing and Cooperative Supervision among Multiple Departments
This scheme establishes a data sharing mechanism for multiple supervision departments, which enables them to extract data of interest for an in-depth analysis. Furthermore, it can also provide data visualization support for the collaboration of different supervision departments. Combined with big data and GIS technology, busy transportation routes or high-incidence areas of illegal behaviors can be displayed in the form of a heat map. On this basis, the monitoring center can coordinate relevant departments to dispatch law enforcement forces to strengthen onsite supervision or dispatch road sweepers to dispose of scattered waste.
5. Case Study
In this Section, we choose Ningbo City in Zhejiang Province as a study case to verify the feasibility and implementation effect of the proposed informatization scheme. Ningbo is an important port city along the southeast coast of China. With the rapid development of the economy in recent decades, the urbanization rate is constantly increasing and the construction industry develops rapidly. According to the government statistical report [44], the total output value of the construction industry in Ningbo was 491.5 billion Chinese Yuan in 2018, however, with the generation of 26 million tons of construction waste. The construction waste management in Ningbo also faces challenges of a high incidence of illegal cases, difficulty in accurate collection of waste disposal data, and difficulties in coordination between supervision departments. In order to reinforce the supervision and management of construction waste, Urban Management and Law Enforcement in cooperation with the Housing and Urban Construction Bureau and the Ecological Environment Bureau developed Ningbo Construction Waste Transportation Supervision System, and then put it into operation in early 2017. The technical measures, application situations and further improvement directions are discussed as follows.
5.1. Technical Measures
As of 2019, there are 3818 construction sites in progress and 1873 C&D waste disposal facilities (including backfilling sites, landfills, transfer stations and recycling plants) in Ningbo, each of them supervised by Ningbo Construction Waste Transportation Supervision System. As shown in Figure 5, a camera for video license plate recognition and a weight sensor for vehicle weighing are set up at the entrance of each construction site and disposal facility, and the data they collect will be transmitted to the monitoring center through the Internet for analysis of the waste loading amount of each shift of the vehicle, as well as the throughput of the construction site and disposal facilities.
There are 102 C&D waste transportation companies in Ningbo that have a total of 3327 transport vehicles. All the transport vehicles have been retrofitted by installing sensors and GPS receivers for monitoring their behaviors during transportation. Figure 6 presents the sensors installed in a transport vehicle; as shown in Figure 6a, the tipping sensor is installed under container of the vehicle [45], which outputs the high level when vehicle is dumping, otherwise it outputs the low level. Figure 6b shows the speed sensor, which is mounted on the drive axle housing of the vehicle, and its signal wire is installed in the shield so as to eliminate the electromagnetic and radio-frequency interference caused by the high-voltage live wire or other electronic equipment [46]. A video camera is installed in the cockpit for driver face recognition, and the GPS receiver is used for vehicle positioning, as shown in Figure 7a,b. All the above devices are connected to the MDVR device (Figure 8), which is responsible for integrating all the collected data and transmitting them to the monitoring center through a mobile network base station.
The configurations of the software development environment of the Ningbo Construction Waste Transportation Supervision System are listed in Table 1. Visual Studio was adopted as the development tool of the application software because it has rich graphic components and supports the efficient development of application programs in C# language. Due to a better compatibility with Visual Studio, SQL Server was adopted as the database management system for storage of the fundamental data and monitoring data. ArcGIS is used to establish the GIS platform integration with GPS data [47]; it can also provide the application program interface (API) for customer development based on Visual Studio and access the SQL Server database through simple configurations. The application software is deployed on the cloud platform based on the Windows Azure operating system, supporting remote access of the users.
5.2. Application Situation
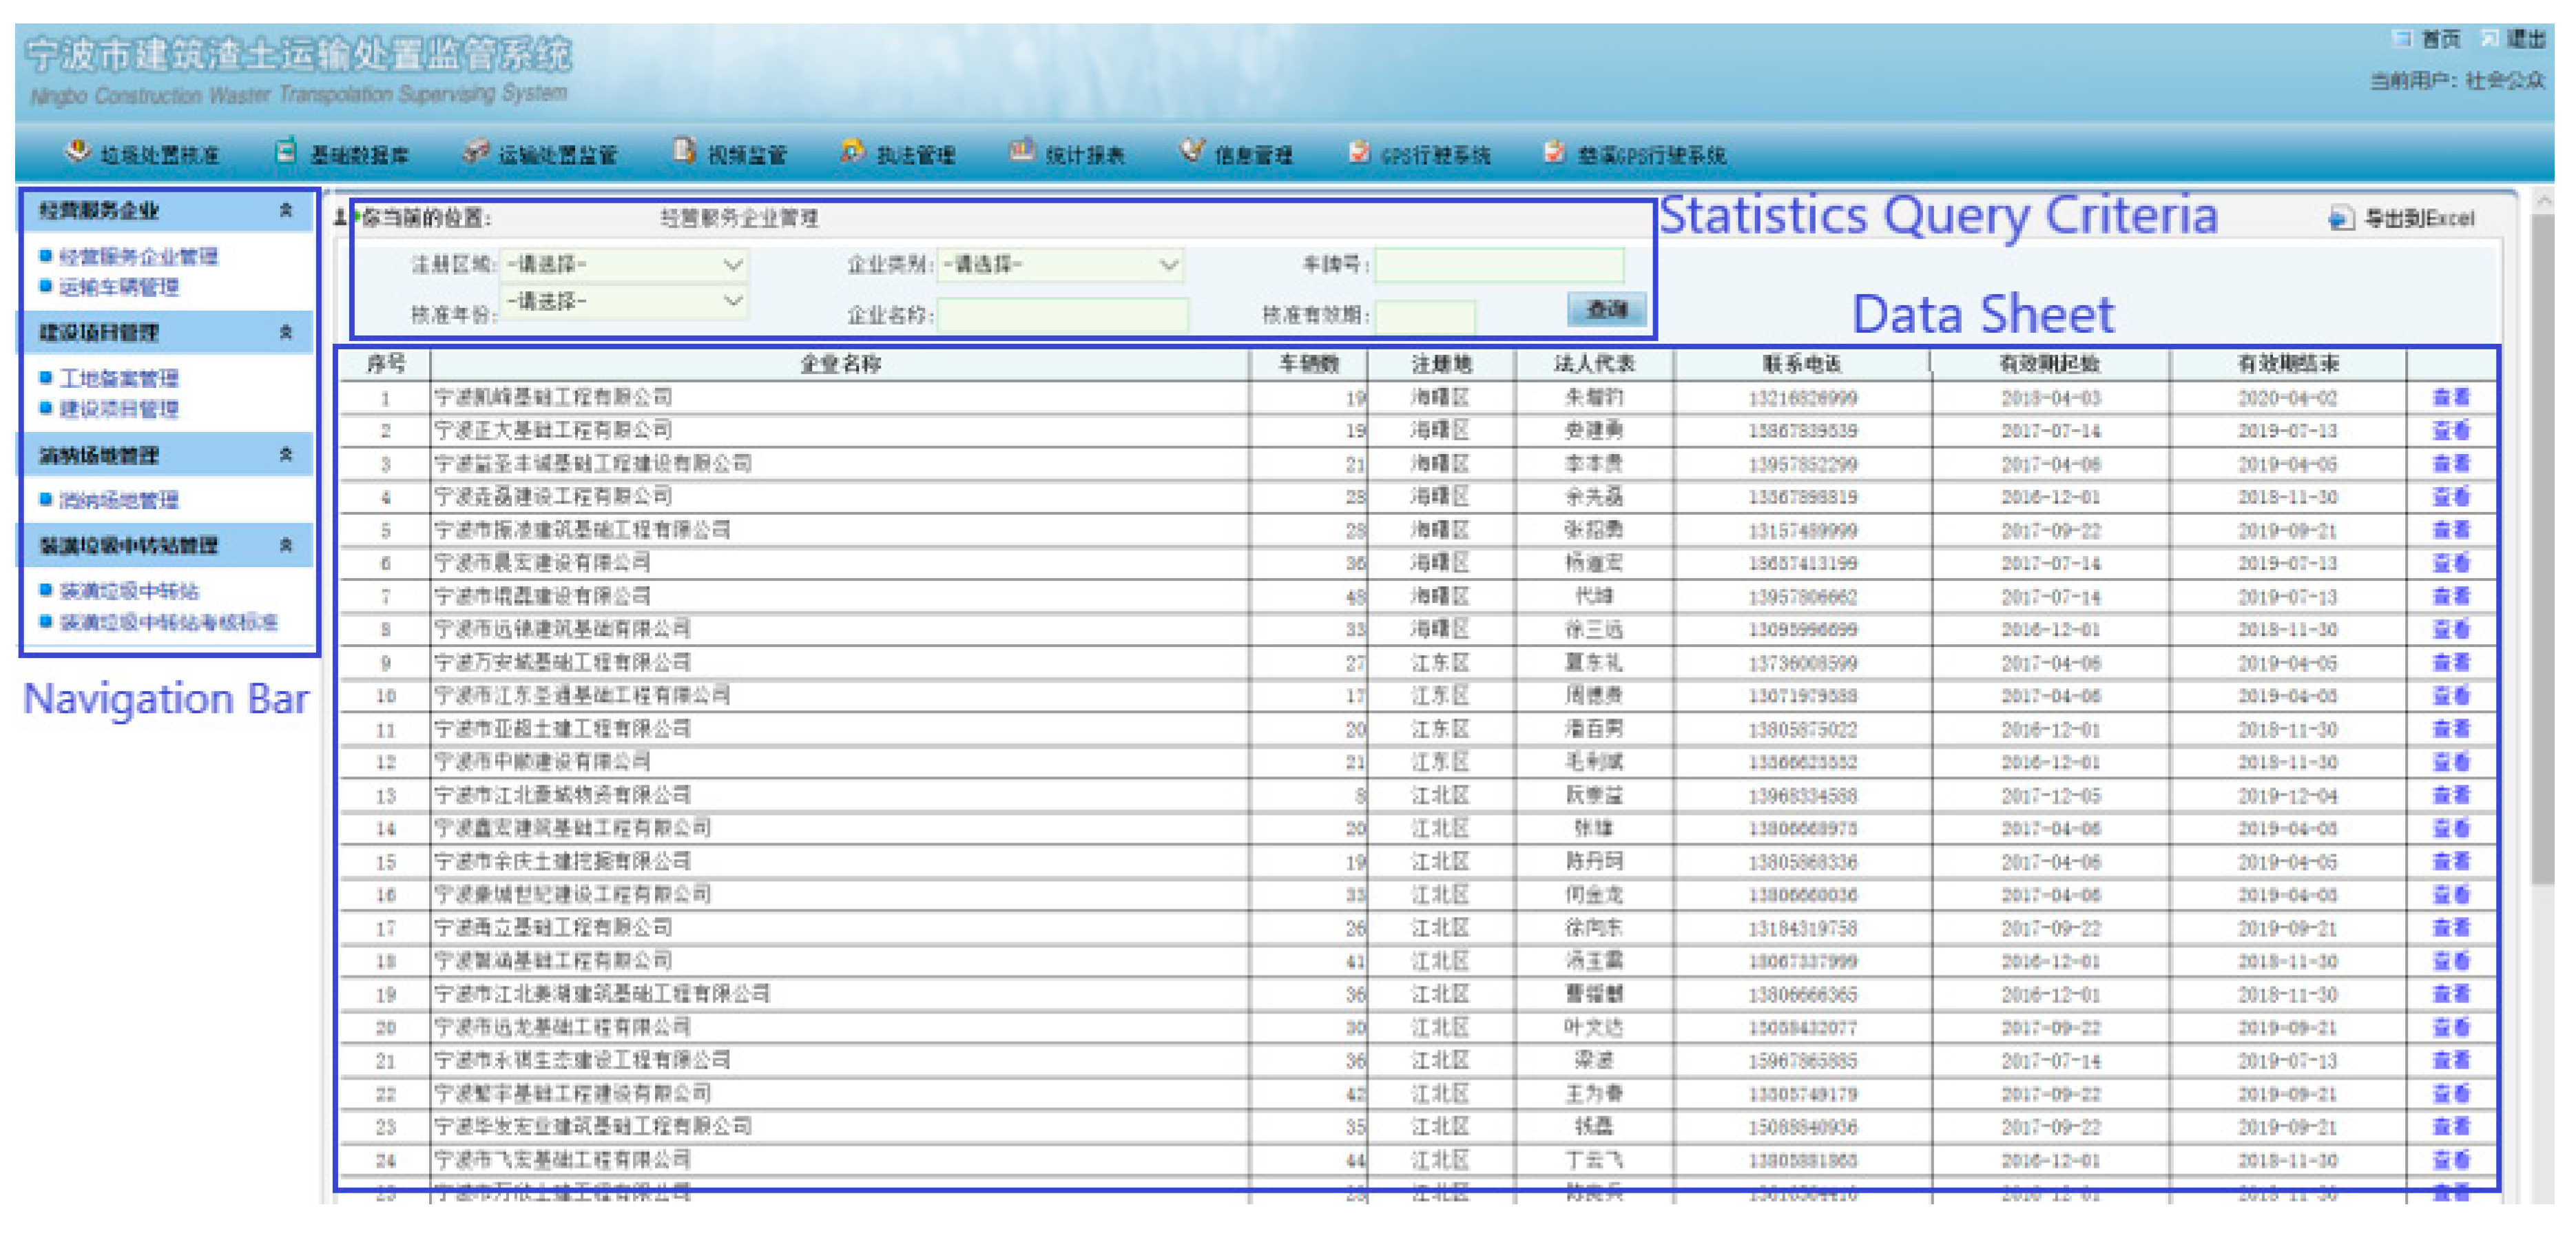
The supervision scope of the Ningbo Construction Waste Transportation Supervision System covers all stakeholders involved in the construction waste disposal within the jurisdiction of the city, including construction sites, disposal facilities, transport companies, vehicles and drivers. Figure 9 shows the interface of their fundamental data management with functions of addition, editing, verification and statistical analysis. According to the division of management authority, the data of construction sites and disposal facilities are managed by the Housing and Urban Construction Bureau, while the data of transportation companies, vehicles and drivers are managed by the Urban Management and Law Enforcement, and all these data are shared between supervision departments.
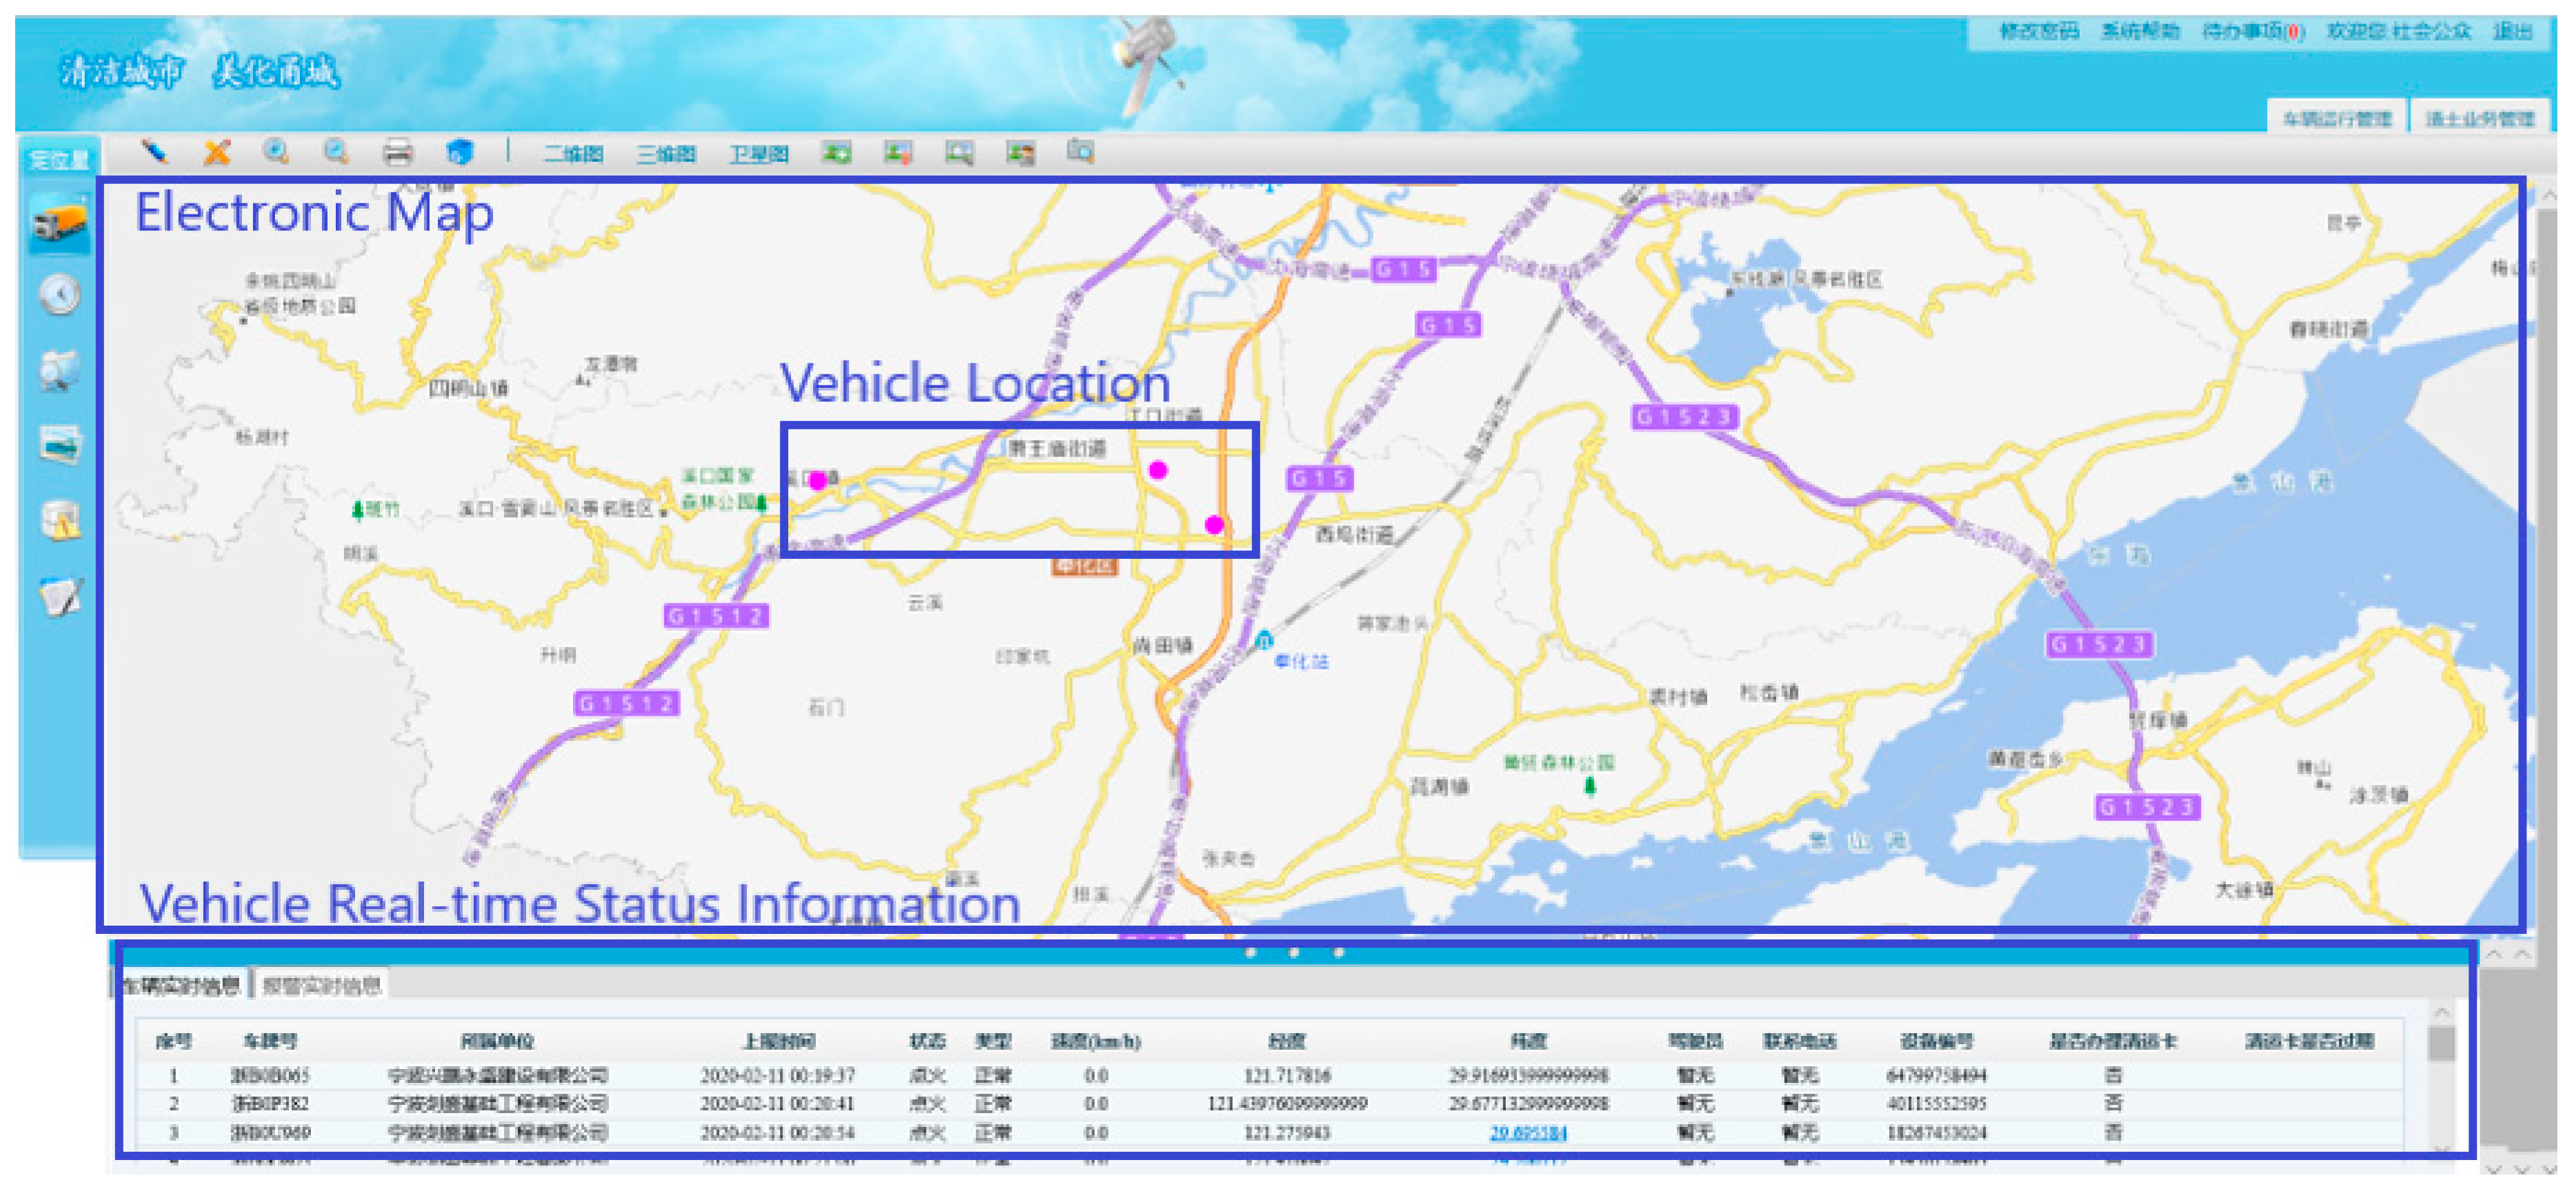
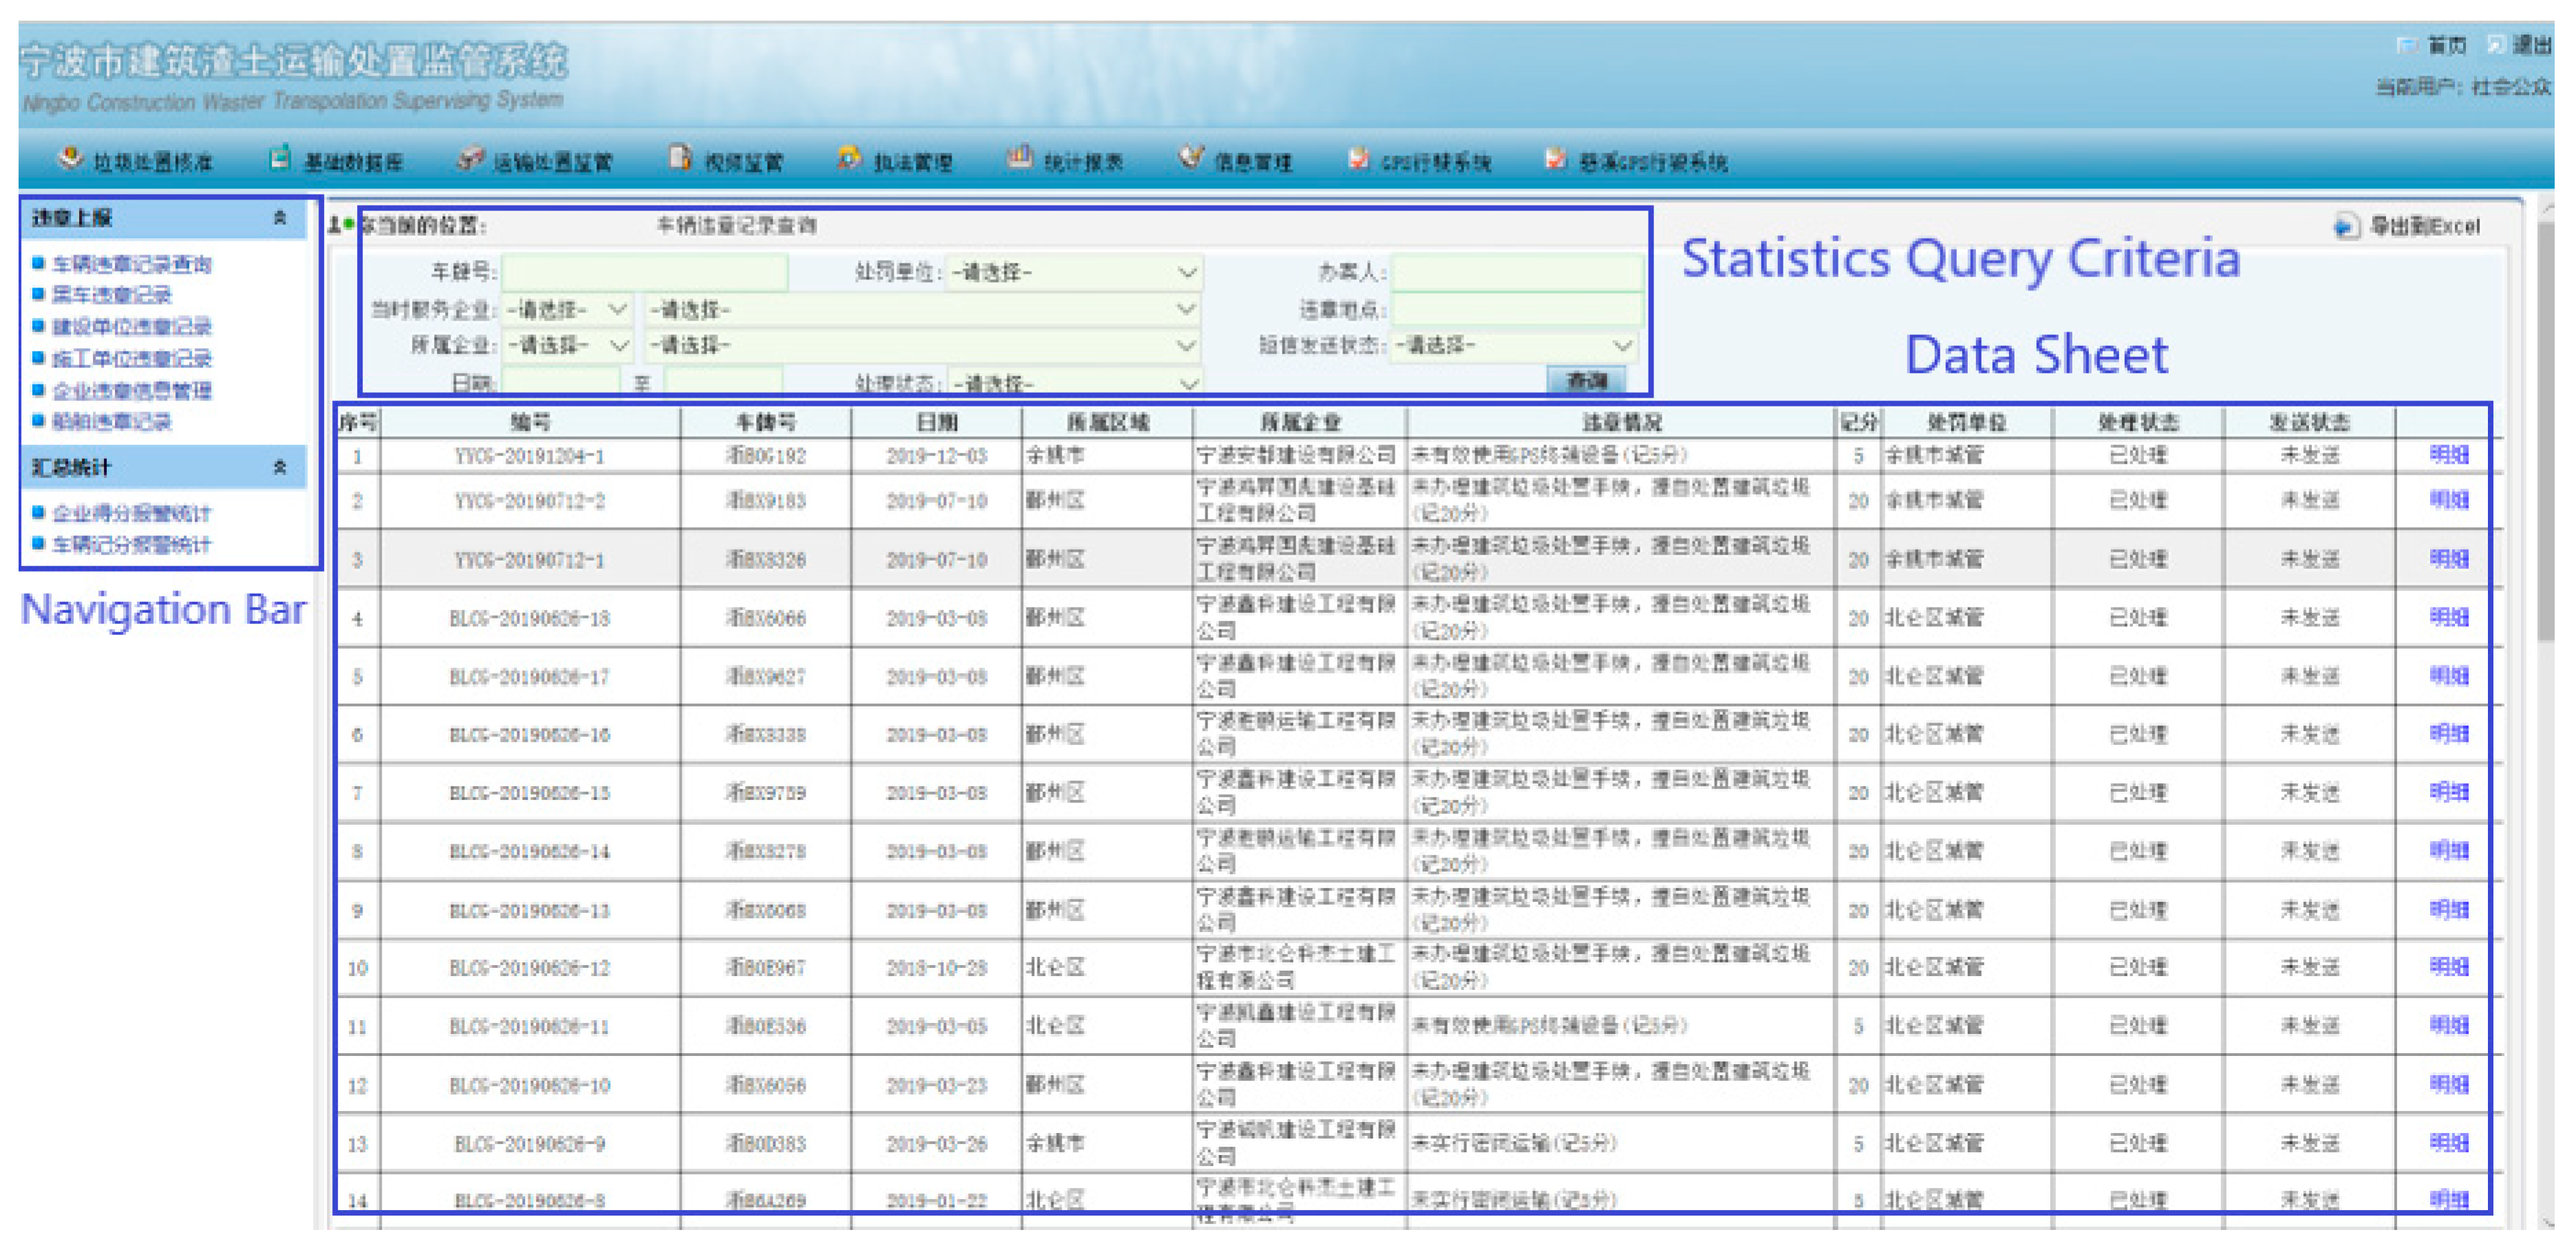
Figure 10 shows the interface of transport vehicle monitoring. The specific locations of the vehicle are shown on the electronic map based on ArcGIS, and the real-time status monitored, such as the operation status, speed, longitude and latitude, current driver and contact number, is shown on the lower part of the interface. A benefit from the real-time monitoring function of the system is that illegal behaviors can be quickly identified. Once a vehicle is monitored for suspected violations, its location and status information will flash in a highlighted color to remind the relevant law enforcement. The illegal case management interface is shown in Figure 11, which supports multi-dimensional statistical analysis of the illegal record data, for instance, by date or place of the illegal case, illegal type, affiliated transport company and law enforcement department, etc. Table 2 presents the statistical data of different types of illegal cases investigated, based on the Ningbo Construction Waste Transportation Supervision System between 2017 and 2019. Obviously, the number of all types of illegal cases has decreased significantly year by year. According to our inference, the stakeholders have been increasingly conscious of the fact that their behaviors are being monitored by supervision departments, so that they have to consciously abide by the relevant laws and regulations.
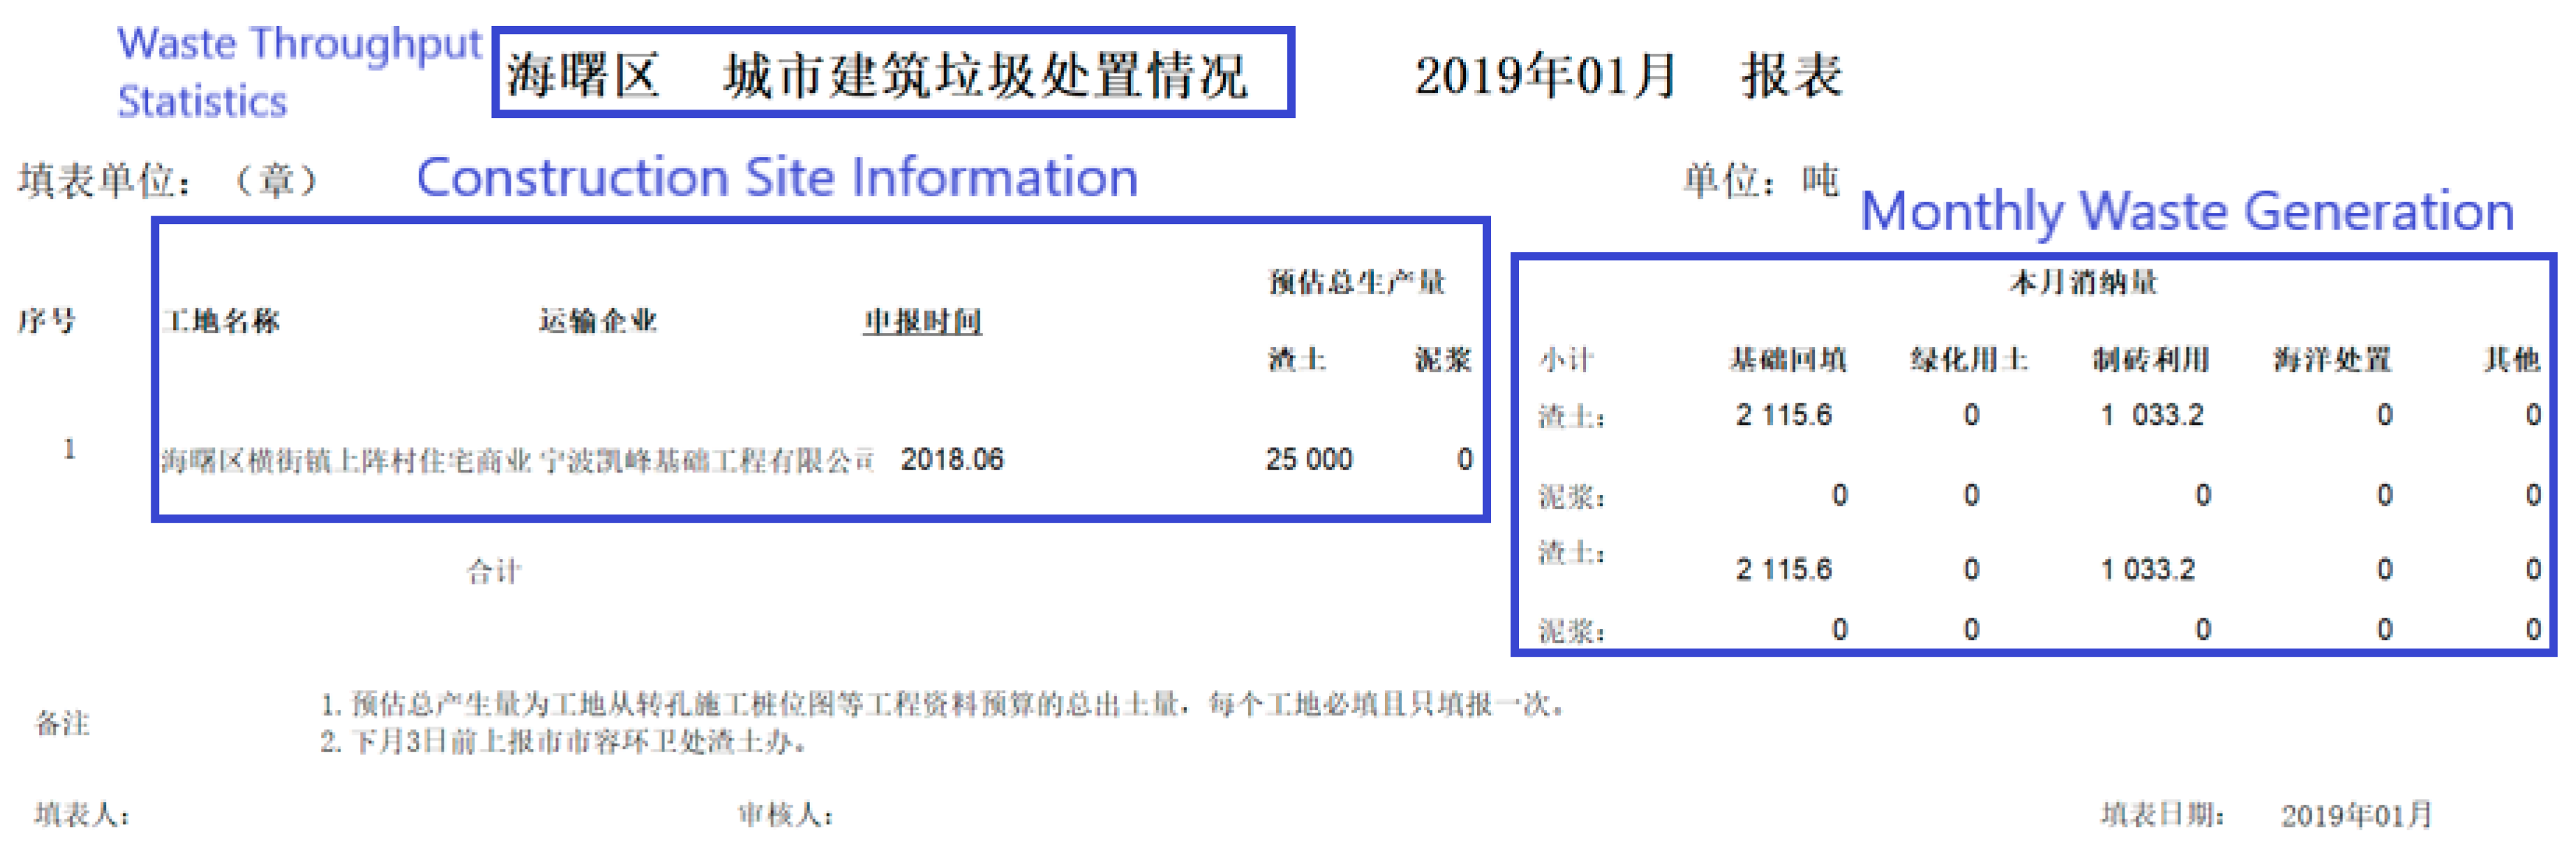
In the Ningbo Construction Waste Transportation Supervision System, each waste disposal record is directly collected from the construction site and disposal facilities, including information such as disposal time, transport vehicle and transport route. Therefore, it is possible to carry out multi-dimensional statistical analysis of waste throughput. Figure 12 is a monthly waste generation statistics report of a construction site automatically generated by the system, which will be delivered to the Housing and Urban Construction Bureau and Ecological Environment Bureau for performance evaluation.
5.3. Further Improvement Directions
Although the implementation of the Ningbo Construction Waste Transportation Supervision System has improved the collaboration among different departments and their supervision efficiency, there are still some limitations needing further improvement. For example, the application of big data is limited to statistical analysis, and the capabilities of knowledge discovery and visual decision support are still weak. Further study should focus on developing the data analysis algorithms for this field, as well as the data visualization methods based on GIS technology.
6. Conclusions and Prospects
An informatization scheme involving multiple technologies was proposed from a domain application prospective and integration methodology. This scheme can monitor the C&D waste disposal process and identify potential illegal behaviors in real time. It will accurately collect waste disposal records and gradually accumulate a big data set for evaluating the performance of stakeholders. Finally, the establishment of a centralized monitoring and data sharing mechanism will promote effective coordination among different supervision departments and efficient arrangement of their activities. A case study of the Ningbo Construction Waste Transportation Supervision System was introduced to verify the feasibility and effectiveness of the proposed scheme; results show that the implementation of the system has improved the coordinated supervision capability, and the total number of illegal cases has decreased from 510 to 89 per year since the system was put into operation. Although the informatization scheme proposed in this paper is mainly aimed at the supervision and management of C&D waste in mainland China, it can also act as a reference for other developing countries.
Further research is required to establish interoperability with external systems. On one hand, the current scheme mainly serves the municipal governments and promotes data interoperability with superior governments as necessary. On the other hand, it is also meaningful for sharing monitoring data with the stakeholders to help them improve their performance in C&D waste management and minimization, e.g., by establishing interoperability with BIM for minimizing waste emissions in the design phase. Moreover, data analysis algorithms and data visualization methods need further study to fully utilize the data set collected in this scheme for better knowledge discovery and decision making.
Improvements of the informatization and management mechanism are mutually reinforcing. A limitation of this study is that we mainly focused on development of the informatization scheme, and the promotion of the management mechanisms needs further study. For instance, further discussion is needed on which department will lead the monitoring center and coordinate other supervisory departments or whether the monitoring center can be established as an independent body.
Author Contributions
In this paper, Z.Y. developed the research ideas and organized the research flow; Z.Y., C.W. and L.Z. implemented the research program and collected data; and L.F. participated in the case study analysis; and Z.Y. completed the writing. All authors were involved in the preparation and validation of the manuscript, and have read and agree to the published version of the manuscript.
Funding
This research was funded by the National Natural Science Foundation of China, grant number 51274131, and the Initial Scientific Research Fund in the Fujian University of Technology, grant number GY-Z18147.
Acknowledgments
The research was sponsored by the National Natural Science Foundation of China [grant number 51274131] and the Initial Scientific Research Fund in the Fujian University of Technology [grant number GY-Z18147]. The authors are grateful for their support. The contribution of this research was based on previous studies, and the authors of this paper express their heartfelt thanks to the authors of all listed previous works. Moreover, we also thank Urban Management and Law Enforcement of Ningbo for providing data for the case study in this paper.
Conflicts of Interest
The authors declare no conflict of interest.
Abbreviations
| API | Application Program Interface |
| BIM | Building Information Modelling |
| C&D | Construction and Demolition |
| CSCM | Construction supply chain management |
| GIS | Geographic Information System |
| GPS | Global Positioning System |
| IoT | Internet of Things |
| KPI | Key Performance Indicator |
| MDVR | Mobile Digital Video Recorder |
| RFID | Radio Frequency Identification |
| UML | Unified Modeling Language |
| VLPR | Video License Plate Recognition |
| WGR | Waste Generation Rate |
References
- Yuan, H.; Shen, L.; Wang, J. Major obstacles to improving the performance of waste management in China’s construction industry. Facilities 2011, 29, 224–242. [Google Scholar] [CrossRef]
- Luangcharoenrat, C.; Intrachooto, S.; Peansupap, V.; Sutthinarakorn, W. Factors influencing construction waste generation in building construction: Thailand’s perspective. Sustainability 2019, 11, 3638. [Google Scholar] [CrossRef] [Green Version]
- Ding, Z.; Gong, W.; Li, S.; Wu, Z. System dynamics versus agent-based modeling: A review of complexity simulation in construction waste management. Sustainability 2018, 10, 2484. [Google Scholar] [CrossRef] [Green Version]
- Yuan, H. Critical management measures contributing to construction waste management: Evidence from construction projects in China. Proj. Manag. J. 2013, 44, 101–112. [Google Scholar] [CrossRef]
- Lu, W. Big data analytics to identify illegal construction waste dumping: A Hong Kong study. Resour. Conserv. Recycl. 2019, 141, 264–272. [Google Scholar] [CrossRef]
- Saucedo Martinez, J.A.; Mendoza, A.; Vazquez, A.; del Rosario, M. Collection of Solid Waste in Municipal Areas: Urban Logistics. Sustainability 2019, 11, 5442. [Google Scholar] [CrossRef] [Green Version]
- Wu, Z.; Ann, T.W.; Shen, L. Investigating the determinants of contractor’s construction and demolition waste management behavior in Mainland China. Waste Manag. 2017, 60, 290–300. [Google Scholar] [CrossRef]
- Yuan, H. A SWOT analysis of successful construction waste management. J. Clean. Prod. 2013, 39, 1–8. [Google Scholar] [CrossRef]
- Freitas, L.A.; Magrini, A. Waste management in industrial construction: Investigating contributions from industrial ecology. Sustainability 2017, 9, 1251. [Google Scholar] [CrossRef] [Green Version]
- Yuan, H. Barriers and countermeasures for managing construction and demolition waste: A case of Shenzhen in China. J. Clean. Prod. 2017, 157, 84–93. [Google Scholar] [CrossRef]
- Gottschalk, P. Maturity levels for interoperability in digital government. Gov. Inf. Q. 2009, 26, 75–81. [Google Scholar] [CrossRef]
- Casalino, N.; Cavallari, M.; De Marco, M.; Gatti, M.; Taranto, G. Defining a Model for Effective e-Government Services and an Inter-organizational Cooperation in Public Sector. ICEIS 2014, 2, 400–408. [Google Scholar]
- Lu, W.; Chen, X.; Peng, Y.; Shen, L. Benchmarking construction waste management performance using big data. Resour. Conserv. Recycl. 2015, 105, 49–58. [Google Scholar] [CrossRef] [Green Version]
- Lu, W.; Chen, X.; Ho, D.C.; Wang, H. Analysis of the construction waste management performance in Hong Kong: The public and private sectors compared using big data. J. Clean. Prod. 2016, 112, 521–531. [Google Scholar] [CrossRef] [Green Version]
- Bilal, M.; Oyedele, L.O.; Akinade, O.O.; Ajayi, S.O.; Alaka, H.A.; Owolabi, H.A.; Qadir, J.; Pasha, M.; Bello, S.A. Big data architecture for construction waste analytics (CWA): A conceptual framework. J. Build. Eng. 2016, 6, 144–156. [Google Scholar] [CrossRef]
- Lee, D.; Kim, S.; Kim, S. Development of hybrid model for estimating construction waste for multifamily residential buildings using artificial neural networks and ant colony optimization. Sustainability 2016, 8, 870. [Google Scholar] [CrossRef] [Green Version]
- You, Z.; Wu, C. A framework for data-driven informatization of the construction company. Adv. Eng. Inform. 2019, 39, 269–277. [Google Scholar] [CrossRef]
- Hopkins, J.; Hawking, P. Big data analytics and IoT in logistics: A case study. Int. J. Logist. Manag. 2018, 29, 575–591. [Google Scholar] [CrossRef]
- Wang, Y.; Ho, O.K.; Huang, G.Q.; Li, D. Study on vehicle management in logistics based on RFID, GPS and GIS. Int. J. Internet Manuf. Serv. 2008, 1, 294–304. [Google Scholar] [CrossRef]
- Tu, M.; Lim, M.K.; Yang, M.F. IoT-based production logistics and supply chain system–Part 1. Ind. Manag. Data Syst. 2018, 118, 65–95. [Google Scholar] [CrossRef]
- Chen, S.L.; Chen, Y.Y.; Hsu, C. A new approach to integrate internet-of-things and software-as-a-service model for logistic systems: A case study. Sensors 2014, 14, 6144–6164. [Google Scholar] [CrossRef] [PubMed] [Green Version]
- Shin, T.H.; Chin, S.; Yoon, S.W.; Kwon, S.W. A service-oriented integrated information framework for RFID/WSN-based intelligent construction supply chain management. Autom. Constr. 2011, 20, 706–715. [Google Scholar] [CrossRef]
- Ergen, E.; Demiralp, G.; Guven, G. Determining the benefits of an RFID-based system for tracking pre-fabricated components in a supply chain. In Computing in Civil Engineering; American Society of Civil Engineers: Reston, VA, USA, 2011; pp. 291–298. [Google Scholar]
- Zhong, R.Y.; Peng, Y.; Xue, F.; Fang, J.; Zou, W.; Luo, H.; Huang, G.Q. Prefabricated construction enabled by the Internet-of-Things. Autom. Constr. 2017, 76, 59–70. [Google Scholar] [CrossRef]
- Zeng, N.; Liu, Y.; Mao, C.; König, M. Investigating the relationship between construction supply chain integration and sustainable use of material: Evidence from China. Sustainability 2018, 10, 3581. [Google Scholar] [CrossRef] [Green Version]
- Madakam, S.; Ramaswamy, R.; Tripathi, S. Internet of Things (IoT): A literature review. J. Comput. Commun. 2015, 3, 164. [Google Scholar] [CrossRef] [Green Version]
- Li, X.; Li, D.; Wan, J.; Vasilakos, A.V.; Lai, C.F.; Wang, S. A review of industrial wireless networks in the context of industry 4.0. Wirel. Netw. 2017, 23, 23–41. [Google Scholar] [CrossRef]
- Puranic, A.; Deepak, K.T.; Umadevi, V. Vehicle number plate recognition system: A literature review and implementation using template matching. Int. J. Comput. Appl. 2016, 134, 12–16. [Google Scholar] [CrossRef]
- Arya, S.; Pratap, N.; Bhatia, K. Future of face recognition: A review. Procedia Comput. Sci. 2015, 58, 578–585. [Google Scholar] [CrossRef] [Green Version]
- Bock, Y.; Melgar, D. Physical applications of GPS geodesy: A review. Rep. Prog. Phys. 2016, 79, 106801. [Google Scholar] [CrossRef]
- Kumar, B.H.; Tehseen, S.F.; Thanveer, S.; Krishna, G.V.; Akram, S.M. Vehicle monitoring and tracking system using gps and gsm technologies. Int. Res. J. Eng. Technol. 2016, 3, 2395-0072. [Google Scholar]
- Gawas, A.U. An overview on evolution of mobile wireless communication networks: 1G-6G. Int. J. Recent Innov. Trends Comput. Commun. 2015, 3, 3130–3133. [Google Scholar]
- Jiang, D.; Liu, G. An overview of 5G requirements. In 5G Mobile Communications; Springer: Berlin, Germany, 2017; pp. 3–26. [Google Scholar]
- Xiang, W.; Zheng, K.; Shen, X.S. (Eds.) 5G Mobile Communications; Springer: Berlin, Germany, 2016. [Google Scholar]
- Silvernail, W.B.; Snow, J.; Glenn, J.; Ridgway, D.; Huang, J.; Church, C.; Singla, O.; Kehle, P. Mobile Digital Video Recording System. U.S. Patent No. 7,768,548 3 August 2010. [Google Scholar]
- Maguire, D.J. An overview and definition of GIS. Geogr. Inf. Syst. Princ. Appl. 1991, 1, 9–20. [Google Scholar]
- Cox, A.B.; Gifford, F. An overview to geographic information systems. J. Acad. Librariansh. 1997, 23, 449–461. [Google Scholar] [CrossRef]
- Xue, Y.; Cracknell, A.P.; Guo, H.D. Telegeoprocessing: The integration of remote sensing, geographic information system (GIS), global positioning system (GPS) and telecommunication. Int. J. Remote Sens. 2002, 23, 1851–1893. [Google Scholar] [CrossRef]
- Mayer-Schönberger, V.; Cukier, K. Big Data: A Revolution That Will Transform How We Live, Work, and Think. Houghton Mifflin Harcourt; Oxford University Press: Oxford, UK, 2013. [Google Scholar]
- Marinescu, D.C. Cloud Computing: Theory and Practice; Morgan Kaufmann: San Francisco, CA, USA, 2017. [Google Scholar]
- Botta, A.; De Donato, W.; Persico, V.; Pescapé, A. Integration of cloud computing and internet of things: A survey. Future Gener. Comput. Syst. 2016, 56, 684–700. [Google Scholar] [CrossRef]
- Hashem, I.A.T.; Yaqoob, I.; Anuar, N.B.; Mokhtar, S.; Gani, A.; Khan, S.U. The rise of “big data” on cloud computing: Review and open research issues. Inf. Syst. 2015, 47, 98–115. [Google Scholar] [CrossRef]
- Ramsin, R.; Paige, R.F. Process-centered review of object oriented software development methodologies. Acm Comput. Surv. (Csur) 2008, 40, 1–89. [Google Scholar] [CrossRef]
- Ningbo Municipal Statistics Bureau. 2018 Ningbo National Economic and Social Development Statistical Bulletin. 2019. Available online: http://tjj.ningbo.gov.cn/art/2019/2/2/art_18617_3583429.html (accessed on 2 February 2019).
- Campbell, S.; O’Mahony, N.; Krpalcova, L.; Riordan, D.; Walsh, J.; Murphy, A.; Ryan, C. Sensor technology in autonomous vehicles: A review. In Proceedings of the 2018 29th Irish Signals and Systems Conference (ISSC), Belfast, UK, 21–22 June 2018; pp. 1–4. [Google Scholar]
- Ahmed, Q.; Arasu, M.; Zhang, J.; Rizzoni, G. Sensors installation guide to monitor automatic transmission performance. IFAC PapersOnLine 2016, 49, 736–741. [Google Scholar] [CrossRef]
- Li, H.; Chen, Z.; Yong, L.; Kong, S.C.W. Application of integrated GPS and GIS technology for reducing construction waste and improving construction efficiency. Autom. Constr. 2005, 14, 323–331. [Google Scholar] [CrossRef]
Figure 1.
Physical architecture of the proposed informatization scheme.

Figure 2.
Logical architecture of the proposed informatization scheme.

Figure 3.
Class diagram of the proposed informatization scheme.

Figure 4.
Sequence diagram of the monitoring process.

Figure 5.
Entrance of the construction site.

Figure 6.
Sensors installed in the transport vehicle.

Figure 7.
Sensors installed in the cockpit.

Figure 8.
Mobile digital video recorder.

Figure 9.
Fundamental data management.

Figure 10.
Transport vehicles monitoring.

Figure 11.
Statistical analysis of illegal cases.

Figure 12.
Statistical report of waste generation.


Table 1.
Software development environment.
| Development Tool | Visual Studio 2010 |
|---|---|
| Database management system | SQL Server 2008 |
| GIS platform | ArcGIS 9.3 |
| Operating system | Windows Azure |
Table 2.
Statistics of illegal cases between 2017 and 2019.
| Illegal Type | 2017 | 2018 | 2019 |
|---|---|---|---|
| Illegal dumping | 211 | 174 | 28 |
| Scattering waste | 57 | 28 | 7 |
| Illegal driving | 73 | 61 | 6 |
| Illegal transport vehicles | 169 | 79 | 38 |
| Total | 510 | 342 | 89 |
© 2020 by the authors. Licensee MDPI, Basel, Switzerland. This article is an open access article distributed under the terms and conditions of the Creative Commons Attribution (CC BY) license (http://creativecommons.org/licenses/by/4.0/).
Share and Cite
MDPI and ACS Style
You, Z.; Wu, C.; Zheng, L.; Feng, L. An Informatization Scheme for Construction and Demolition Waste Supervision and Management in China. Sustainability 2020, 12, 1672. https://0-doi-org.brum.beds.ac.uk/10.3390/su12041672
AMA Style
You Z, Wu C, Zheng L, Feng L. An Informatization Scheme for Construction and Demolition Waste Supervision and Management in China. Sustainability. 2020; 12(4):1672. https://0-doi-org.brum.beds.ac.uk/10.3390/su12041672
Chicago/Turabian StyleYou, Zhijia, Chen Wu, Lianqiong Zheng, and Lingjun Feng. 2020. "An Informatization Scheme for Construction and Demolition Waste Supervision and Management in China" Sustainability 12, no. 4: 1672. https://0-doi-org.brum.beds.ac.uk/10.3390/su12041672
Note that from the first issue of 2016, this journal uses article numbers instead of page numbers. See further details here.