Article

Quantitative Assessment of the Impact of Human Activities on Terrestrial Net Primary Productivity in the Yangtze River Delta

1
International Institute for Earth System Science, School of Geography and Ocean Science, Jiangsu Provincial Key Laboratory of Geographic Information Science and Technology, Nanjing University, Nanjing 210023, China
2
School of Public Administration, Nanjing University of Finance and Economics, Nanjing 210023, China
3
Jiangsu Center for Collaborative Innovation in Geographic Information Resource Development and Application, Nanjing 210023, China
4
School of Geographical Sciences, Fujian Normal University, Fuzhou 350117, China
5
Institute of Agricultural Resources and Regional Planning, Chinese Academy of Agricultural Sciences, Beijing 100081, China
*
Author to whom correspondence should be addressed.
Sustainability 2020, 12(4), 1697; https://0-doi-org.brum.beds.ac.uk/10.3390/su12041697
Submission received: 23 January 2020 / Revised: 20 February 2020 / Accepted: 21 February 2020 / Published: 24 February 2020

Abstract

:
The continuous growth of the economy and population have promoted increasing consumption of natural resources, and raised concerns regarding the upper limits of the terrestrial ecosystems with biomass accessible for humanity. Here, human appropriation of net primary production (HANPP) was employed to assess the influence of human activities on terrestrial net primary production (NPP), and a detailed method was introduced to simulate the magnitude and trends of HANPP in the Yangtze River Delta. The results showed that the total HANPP of the Yangtze River Delta increased from 102.3 Tg C yr−1 to 142.2 Tg C yr−1, during 2005–2015, with an average of 121.3 Tg C yr−1. NPP changes induced by harvest (HANPPharv) made the dominant contribution of 79.9% to the total HANPP, and the increase of HANPPharv in cropland was the main driver of total HANPP growth, which was significantly correlated with the improvement in agricultural production conditions, such as total agricultural machinery power and effective irrigation area. The proportion of HANPP ranged from 59.3% to 72.4% of potential NPP during 2005–2015 in the Yangtze River Delta, and distinguishable differences in the proportions were found among the four provinces in the Yangtze River Delta. Shanghai had the largest proportion of 84.3%, while Zhejiang had the lowest proportion of 32.0%.

1. Introduction

Terrestrial ecosystems are the basic resource for the sustainable development of human society. How to assess the status and change trends of terrestrial ecosystems objectively and comprehensively has become one of the key issues related to the sustainable development of human society. The Millennium Ecosystem Assessment (MA) launched by the United Nations was the first to assess the status and trends of the world’s ecosystems, and found that 60% of the world’s ecosystem services are in a state of degradation or unsustainable use [1]. Then, numbers of methods were conducted to assess the ecosystems, including the indicators evaluation frameworks, i.e., driver–pressure–state–impact–response (DPSIR) [2] and biophysical measurement methods, i.e., ecological footprint [3], material flow analysis [4], energy analysis [5], etc. However, it is hard to make comparisons with the results of these methods because of their different dimensions. Net primary production (NPP) is the key component of the global carbon cycle [6], and provides a measurable and unified boundary for terrestrial ecosystems [7]. Extensive research on NPP has shown that human activities have become the major factor affecting NPP changes [8], and NPP has been selected as an indicator to assess the impact of human activities on terrestrial ecosystems [9,10,11,12].
Numerous studies have used the difference between potential NPP and actual NPP to assess the impact of human activities on terrestrial ecosystems. Zika and Erb [13] used this method to estimate the NPP loss in the process of global dry land degradation caused by human activities. Xu et al. [14,15] used the trends of the difference between potential NPP and actual NPP to identify the relative roles of human activities in desertification. This method has also been widely used to assess the impact of human activities on land degradation or desertification in areas of the Shiyang River Basin [16,17,18], Heihe Basin [19], Qinghai-Tibet Plateau [20], Northwest China [21], Xilingol grassland [22] and agricultural and pastoral transitional zones in northern China [23]. Some studies have further differentiated the contributions of land conversion and management alternatives to the changes in NPP in Inner Mongolian grassland [24] and the Loess Plateau grassland [25]. These studies provided important references for research on the impact of human activities on terrestrial NPP. However, these methods did not consider the human harvest in NPP losses. Human appropriation of net primary production (HANPP) provides a way to assess the impact of human activities on terrestrial ecosystems, considering the difference between potential NPP and actual NPP as well as the impact of human harvests, it reflects in depth the intensity of land use influenced by human activities [26]. Now, a number of studies have been conducted to improve the estimation methods [27,28,29,30,31,32], to analyze the magnitude, pattern and driving mechanism of HANPP in different countries and regions [33,34,35,36,37,38,39,40], and to underpin sustainability in delta systems [41].
HANPP was used to measure the impact of human activities on the terrestrial NPP in the Yangtze River Delta. The aim of this study is to estimate the magnitude and pattern of HANPP in the Yangtze River Delta, to analyze the trends and driving forces of HANPP from 2005–2015, to reveal the differences in HANPP between the Yangtze River Delta and different countries and regions with different level of economic development and technological development, and to discuss the uncertainties in the HANPP calculation. This study provides deeper insights into the research of sustainable development in the Yangtze River Delta and will be of great significance for formulating and evaluating the ecological protection policies for the Yangtze River Delta.

2. Materials and Methods
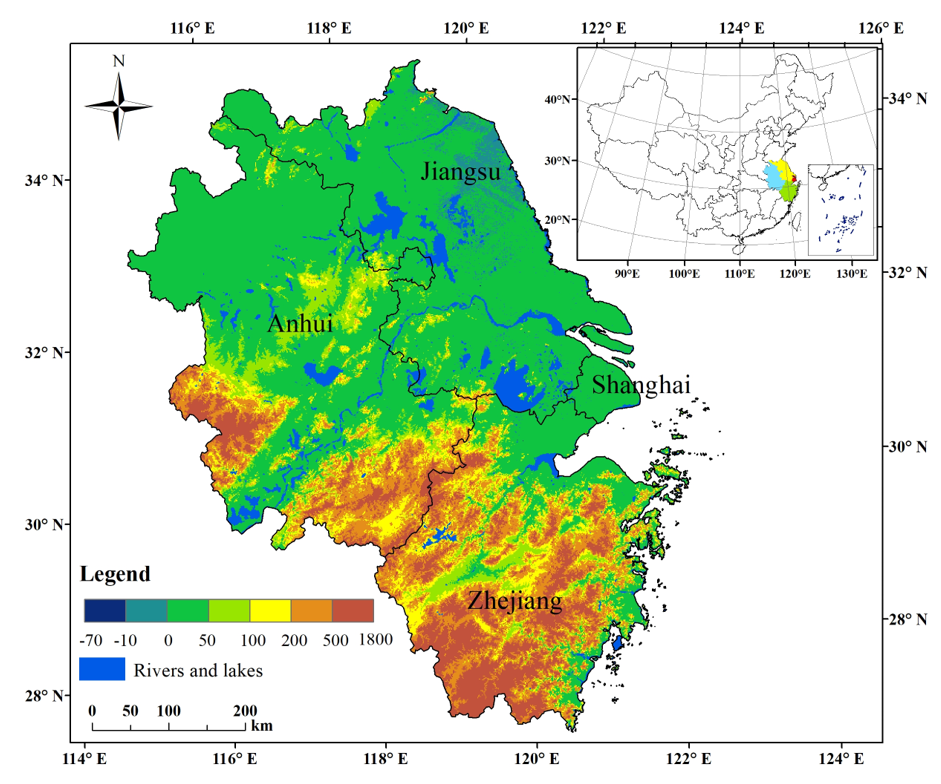
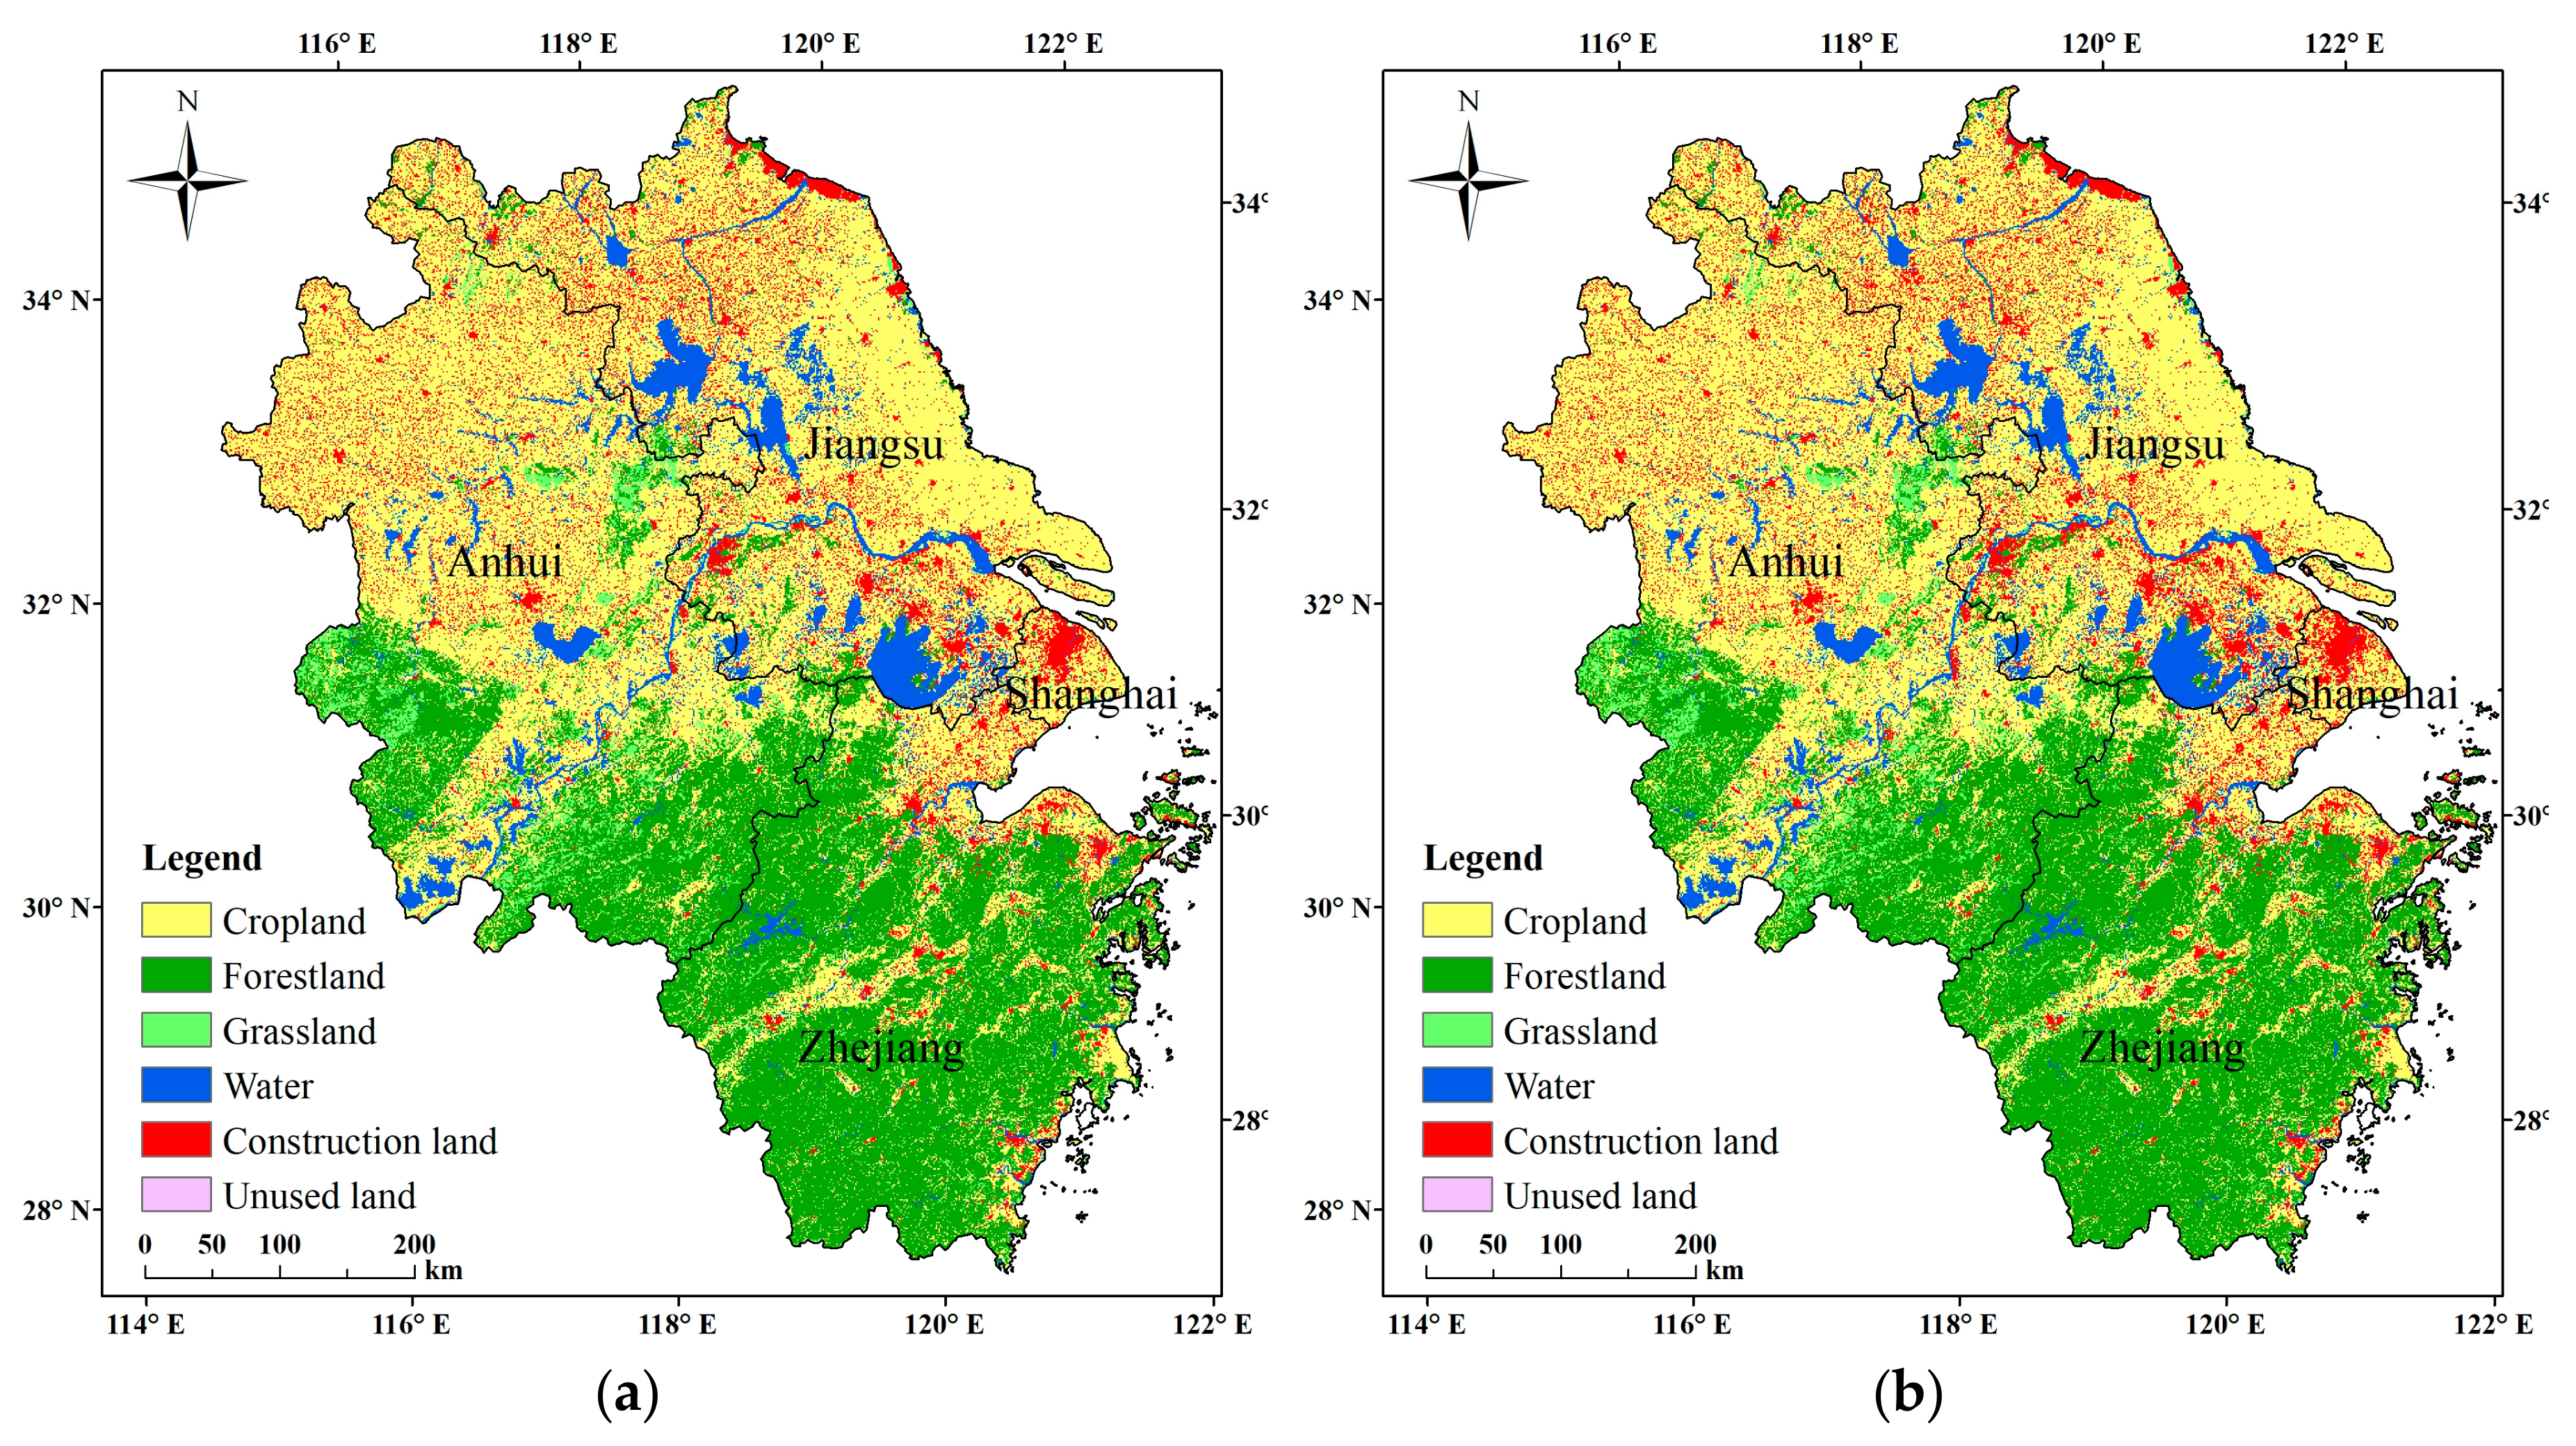
2.1. Study Area

The Yangtze River Delta is located in the coastal areas of eastern China. As one of China’s most economically active, open and innovative regions, the Yangtze River Delta boasts strategic significance in the country’s modernization and further opening. According to the outline of the integrated regional development plan of the Yangtze River Delta issued in December 2019, the Yangtze River Delta consists of 4 districts, namely Shanghai, Jiangsu, Zhejiang and Anhui, with a total land area of 358,000 km2, accounting for approximately 3.7% of China’s total land area. By the end of 2018, the total population in this area was 225 million, accounting for 16.2% of China’s total population, with a gross domestic product (GDP) of CNY 21,150 billion, accounting for 23.5% of China’s GDP [42].
The Yangtze River Delta is located in the subtropical monsoon climate zone, where abundant precipitation and warm temperatures are suitable for vegetation growth, and it is a major grain crop and economic crop production area in China. The annual average precipitation in this area is 1011–1630 mm, and the annual average temperature is 16.3–17.5 °C [43]. The terrain of this area is shown in Figure 1. The elevation ranges from −70 m to 1800 m, and ascends from northeast to southwest. The physiognomy of this area consists of plain, hill and mountain, and plains are widely distributed in north and east, while hills and mountains are mainly distributed in the southeast and southwest. Vegetation cover in this area is mainly cultivated crops and forest. However, the spatial distribution of land use and land cover in the Yangtze River Delta varies distinctly from south to north. Forestland is the dominant land use type in Zhejiang, and Jiangsu is dominated by cropland, while Shanghai has a high proportion of construction land. Owing to the diversified land use types and different economic conditions, it is representative to study the impact of human activities on terrestrial NPP in the Yangtze River Delta.

2.2. Defintion and Calculation of Human Appropriation of Net Primary Production (HANPP)

HANPP is an integrated socio-ecological indicator to quantify human domination of ecosystems, and assess the extent of human activities affecting NPP in ecosystems. The use of different definitions of HANPP in different studies explains the large range of HANPP results [26]. We defined HANPP based on the method outlined in Haberl et al. [28], which is the basis for most of the relative studies. In this definition, HANPP can be calculated by the sum of productivity changes resulting from land conversion and land use (HANPPluc) and harvest (HANPPharv), or by subtracting the remaining NPP in the ecosystem after human appropriation (NPPeco) from the NPP of potential vegetation without human interference (NPPpot). HANPPluc was calculated by subtracting the NPP of the actual prevailing vegetation (NPPact) from NPPpot. The equations are as follows.
H A N P P = N P P p o t N P P e c o =   H A N P P l u c + H A N P P h a r v
H A N P P l u c = N P P p o t N P P ac t

2.3. Estimation of HANPPharv

HANPPharv denotes all types of biomass harvested or destroyed during harvest within one year. HANPPharv in our estimation included harvest through crop harvest, wood harvest, grazing, and harvest in construction land. As human-induced fire is rare in the Yangtze River Delta, NPP for burning biomass was assumed to be zero. HANPPharv of different land use types are given in gram carbon per year (g C year−1), and 1 gram dry matter biomass generally equals 0.45 g C.
(1) The biomass harvest from cropland consisted of primary crops, crop residues and belowground NPP. The fresh weight of crop production was converted into dry matter by using crop-specific water content. Crop residues were extrapolated from the crop-specific harvest indices. Belowground NPP was assumed to be destroyed during harvest and calculated using the ratio of belowground to aboveground NPP:
NPPact_crop = ∑(Ycrop,i × (1 − MCcrop,i) / HIi × (1+(R/S)i ) )
where Ycrop is the economic yield of crops, MCcrop is the water content, HI is the harvest index, and R/S is the ratio of belowground to aboveground NPP. Details about the MCcrop, HI and R/S of different crops can be found in the literature [28].
(2) The biomass harvest from forest was calculated based on wood and bamboo production, farmers’ self-use of felling and fuel wood. Wood density was used to convert volumes of wood harvest to dry matter. The recovery rate was used to extrapolate bark and harvest losses from the harvested volumes. Wood density was assigned as 0.5 t C m−3 according to data on the Asian Pacific in the literature [28]. The recovery rate of wood and farmers’ self-use of felling was designated as 0.48, and that of fuel wood was 0.72. The fresh weight of normal bamboo of stump diameter was designated as 19.2 kg, and the water content of bamboo was designated as 0.44 [44].
HANPPharv_forest = (Ywood × d) / r + Ybamb × W × (1 - MCbamb)
where Y is the wood or bamboo harvest, d is wood density, r is recovery factor, W is the fresh weight of normal bamboo of stump diameter, and MCbamb is the water content of bamboo.
(3) The biomass harvest from grassland was estimated as the difference between livestock feed demand and feed supply. Owing to the lack of robust information on commercial or supplementary feeds, we assumed that the feed supply of grassland was equal to the crop residues used as feed. The conversion coefficient of crop residues to feed was assumed to be 25% [45]. Feed demand was calculated separately for 6 livestock species, i.e., cattle and buffaloes, goats and sheep, horses, asses, mules, and camels. The yearly production amount of each livestock type was converted into standard sheep units outlined in Table 1 [46]. Livestock in this study was divided into young livestock and adult livestock, and the coefficient of adult sheep was 1. Each sheep unit needed 1.8 kg of dry-matter coarse forage per day.
(4) The biomass harvest from construction land, e.g., biomass harvested during gardening or infrastructure maintenance, was assumed to be 50% of the aboveground NPPact. The harvest from unused land was assumed to be zero.

2.4. Estimation of HANPPluc

Annual NPPpot in the Yangtze River Delta was estimated using the Lund–Potsdam–Jena dynamic global vegetation model (LPJ) [9,47], which is a process-based biogeography-biogeochemistry model. Compared with empirical models, such as the Miami model [48], Chikugo model [49], Thornthwaite Memorial model [50], and light-use efficiency model, such as the global production efficiency model (GLOPEM) model [51], the process-based ecological model fully considered the processes of vegetation photosynthesis, respiration, and soil organic decomposition and the impact of population competition and natural disturbance on vegetation growth. This model could simulate the evolution and replacement process of vegetation growth, development and extinction and was selected to calculate the NPPpot in this study.
Annual NPPact can be calculated by light-use efficiency models such as the Carnegie Ames Stanford Approach (CASA) model [52] or by process-based ecological models such as the process-based boreal ecosystem productivity simulator (BEPS) model [53], while NPPpot and NPPact estimated in the same model framework can reduce the uncertainties of HANPPluc [27]. The NPPact of the Yangtze River Delta from 2005 to 2015 was calculated on the basis of LPJ runs, combined with statistical data and land use data. The NPPact of different land use types were estimated as below.
(1) The NPPact of cropland was defined as the sum of the harvest for crop production and reharvest losses due to herbivory and weeds. The harvest for crop production is noted in Section 2.3. The reharvest losses were estimated as the proportion of the harvest, and the proportion was designated as 0.23 according to that in Asian Pacific data [28].
(2) The NPPact of grassland was estimated by considering the effect of soil degradation on the corresponding NPPpot. Soil degradation data were obtained from the Global Assessment of Human-induced Soil Degradation (GLASOD) database. According to the soil degradation degrees 1–4 of GLASOD, NPPact was assumed to be 75%, 55%, 45% and 15% of NPPpot, respectively.
(3) The NPPact of forests was assumed to be equal to the NPPpot, and we did not consider the effects of forest management on improving forest NPP. The NPPact of unused land was also assumed to be equal to the NPPpot. The NPPact of construction land was assumed to be one-third of the NPPpot, and The NPPact of water was assumed to be zero.

2.5. Analysis Methods

2.5.1. Spatial Allocation Methods

NPPact of cropland and HANPPharv of cropland, forestland and grassland were calculated by the statistical data at the provincial scale. In order to analyze the influence of land use change on HANPP, the results of NPPact and HANPPharv at a provincial scale were allocated to the grid cells as follows:
R a i = V N P P l u , i i = 1 n N P P l u , i
where V is the HANPPharv or NPPact of the different land use types in different provinces, Ra is the grid value allocated by V, and NPPlu,i is the grid value of potential NPP or actual NPP. The spatial allocation of NPPact on cropland to grid cells is based on potential NPP calculated by LPJ. The spatial allocation of HANPPharv on cropland, forestland and grassland to grid cells were based on the corresponding actual NPP.

2.5.2. Land Use Transfer Matrix

The land use transfer matrix can be used to describe the mutual transfer process of different land use types at the start and the end of study period, which can explore the information of land use changes [54]. The mathematical formula is as follows:
s i j = s 11 s 12 s 1 n s 21 s 22 s 2 n s n 1 s n 2 s n n
where s is the area of land use; n is the number of land use type; i and j are land use types at the start and the end of the study period respectively; sij is the area transferring from land use type i to j.

2.6. Datasets

The dataset used in this study included LPJ-driven data, agricultural statistical data, and land use and land cover data.
The LPJ model was driven by meteorological data, annual CO2 data, and soil texture data. Monthly mean meteorological data, including monthly mean air temperature and precipitation at a spatial resolution of 0.1° × 0.1° from 2005 to 2015, were derived from the Cold and Arid Regions Science Data Center [55]. Monthly cloud cover and the number of wet days at a spatial resolution of 0.5° × 0.5° were taken from the Climate Research Unit (CRU), University of East Anglia, called CRU TS3.25 [56,57]. The annual historical global atmospheric CO2 data from 2005 to 2015 were obtained from the Mauna Loa observatory [58]. The soil texture data were retrieved from the Food and Agriculture Organization (FAO) soil data set [59]. All the data were interpolated to a resolution of 1000 m. Details about the model protocol can be found in the paper [60].
Land use and land cover data in the year of 2005, 2010 and 2015, as shown in Figure 2, were taken from the resource and environment data cloud platform of the Chinese Academy of Sciences called the remote sensing monitoring data of land use in China [61]. In this study, the land use and land cover types were classified into cropland, forestland, grassland, water, construction land and unused land, and the averaged percentages of each land use type in the Yangtze River Delta were 50.7%, 28.8%, 3.3%, 6.5%, 10.7% and less than 0.001%, respectively. Detailed land use structure of the study area is described in Table 2, and significant differences of the land use structure were found among the four provinces. Cropland accounted for 66.9% of the total area in Jiangsu, while Zhejiang was dominated by forestland at a proportion of 64.0%. The proportion of construction land to the total land area in Shanghai was approximately 32.6%. Cropland and forestland in Anhui accounted for more than 80% of the total land area. Land use change from 2005 to 2015 was characterized as the significant expansion of construction land. Figure 2d shows the spatial pattern of expanded areas of different land use types during 2005–2015. The net expanded area of construction land in the Yangtze River Delta was approximately 6365 km2 (the difference of construction land transfers from other land use types and to other land use types), with an average annual growth rate of 1.9%. Cropland was the major source of construction land expansion, and accounted for 87.2% of that, followed by forestland (9.0%) and water (2.7%). Overall, land use change in the Yangtze River Delta showed the trends of reduction of cropland and increase of construction land.
The agricultural statistical data for the 4 provinces in the Yangtze River Delta during 2005–2015 included crop yield, forestry production, and numbers of livestock. Yield data for 12 crops, i.e., rice, wheat, corn, soybean, potato, peanut, rapeseed, sesame, cotton, jute, sugarcane and vegetables, were taken from the China statistical yearbook [62]. Forestry production data, including wood and bamboo production, farmers’ self-use felling and fuel wood, were taken from the China Forestry Statistical Yearbook [63]. Data on the numbers of both breeding and slaughtered livestock were taken from the China Agriculture Yearbook [64].

3. Results

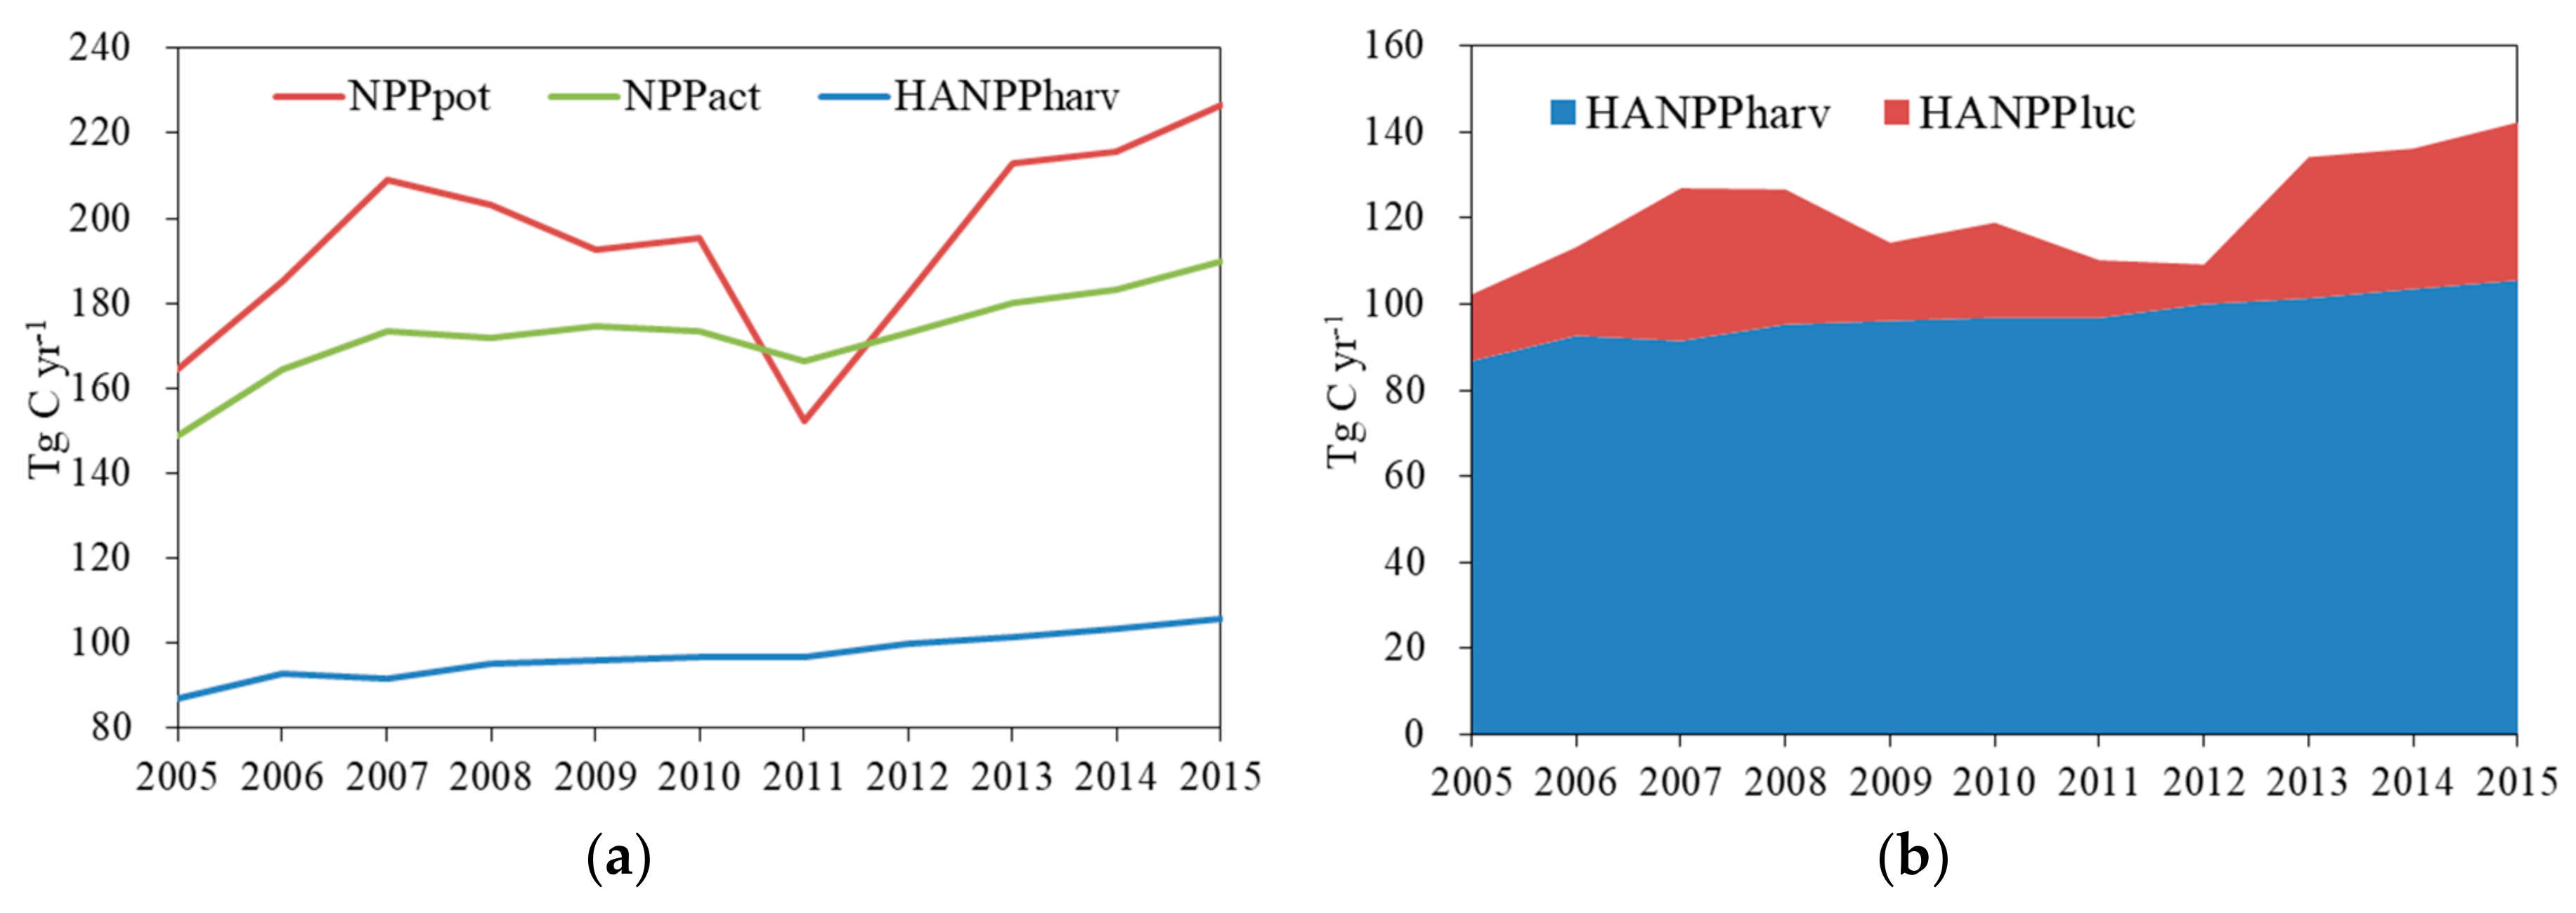
3.1. NPPpot, NPPact and HANPPharv

The total NPPpot calculated by LPJ in the Yangtze River Delta changed with fluctuations from 152.3 Tg C yr−1 to 226.7 Tg C yr−1, during 2005–2015, with an average of 194.5 Tg C yr−1. The total NPPact changed from 148.9 Tg C yr−1 to 183.1 Tg C yr−1 during the same period, with an average of 172.7 Tg C yr−1. The total HANPPharv was, obviously, less than NPPpot and NPPact, ranging from 86.8 Tg C yr−1 to 105.6 Tg C yr−1, and the average value was 97.0 Tg C yr−1. However, the total HANPPharv was significantly greater than HANPPluc which changed from 9.2 Tg C yr−1 to 36.7 Tg C yr−1.
As shown in Figure 3a, NPPact and HANPPharv demonstrated gradually increasing trends from 2005 to 2015, and the increasing rates have been 2.6 and 1.1 Tg C yr−1 respectively, since 2005. Large interannual variability was exhibited in the estimate of NPPpot, especially in 2011, when the NPPpot value was at its minimum. The reason for this was that the worst drought event in the last 50 years occurred in the area of the lower-middle reaches (including Jiangsu and Anhui provinces) of the Yangtze River [65].

3.2. HANPP in the Yangtze River Delta

The total calculated HANPP in the Yangtze River Delta changed from 102.3 Tg C yr−1 to 142.2 Tg C yr−1, during 2005–2015, with an average of 121.3 Tg C yr−1. HANPP had slightly increasing trends and has increased at a rate of 1.7 Tg C yr−1 since 2005. HANPPharv contributed the most (79.9%) to the total HANPP, while HANPPluc only accounted for 21.1% of the total HANPP (Figure 3b). Cropland made a substantial contribution, which was approximately 83.7%, to the total HANPPharv, while the proportion of grassland, forestland and construction land that contributed to the total HANPPharv were nearly equivalent but far less than that of the cropland (Table 3).
The total HANPP accounted for 59.3% to 72.4% of the total NPPpot, with an average of 63.4%, which showed a fluctuating upward trend in the Yangtze River Delta from 2005 to 2015. The HANPP efficiency (HANPPharv/HANPP) ranged from 72.1% to 91.6% in the Yangtze River Delta during 2005–2015, and the average HANPP efficiency was 80.4%, with no obvious variation trend.

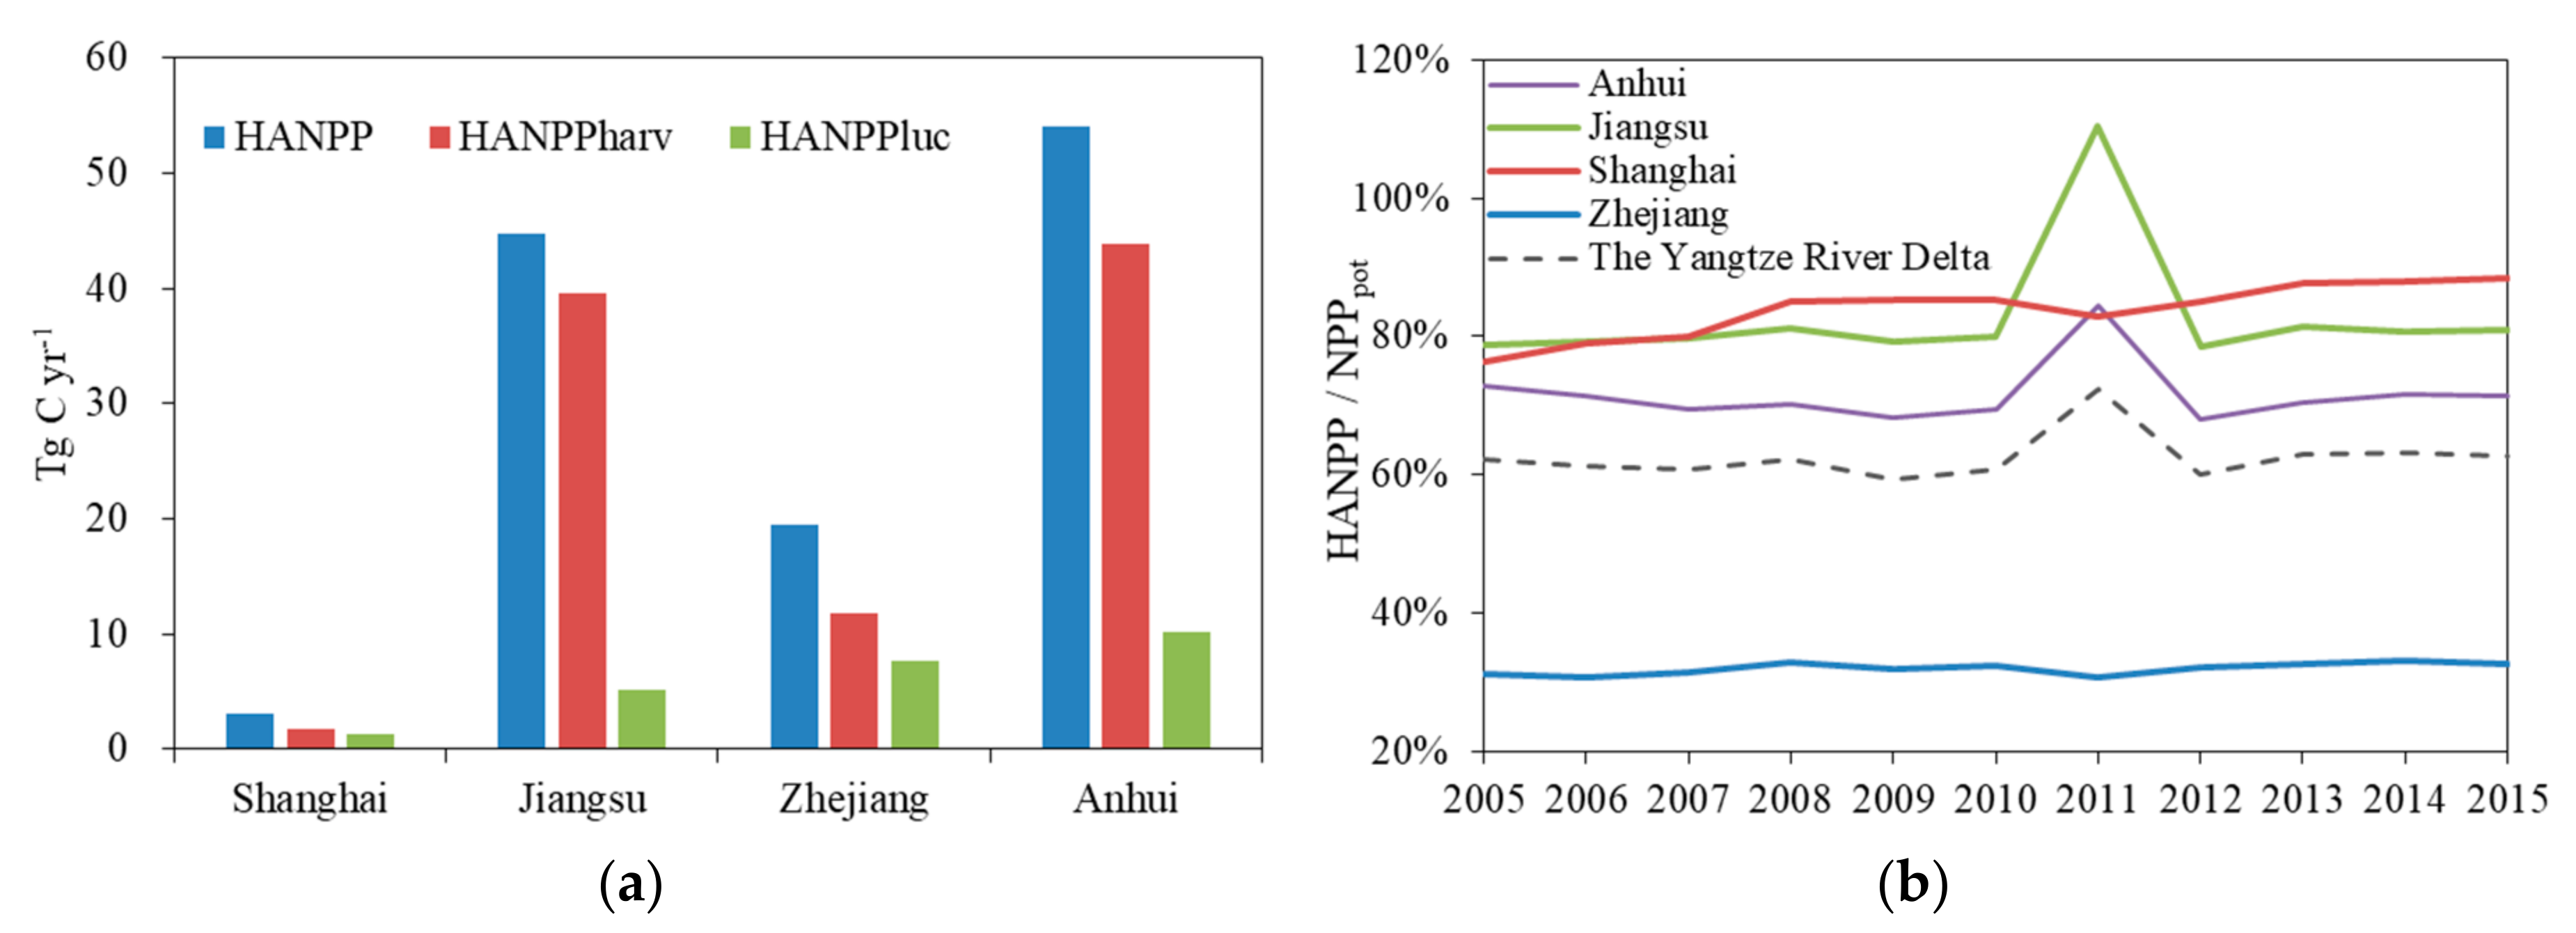
3.3. Regional Differences in HANPP

Figure 4a shows that Anhui and Jiangsu provinces contributed the most (44.7% and 38.0%) to the total HANPP, followed by Zhejiang (16.1%), and Shanghai contributed the least to the total HANPP at 2.5%. Similarly, Anhui and Jiangsu were also the main provinces that contributed to the total HANPPharv, followed by Zhejiang and Shanghai. However, small difference existed in HANPPluc among Anhui, Jiangsu and Zhejiang provinces. HANPP efficiencies in Jiangsu and Anhui provinces were 88.4% and 81.2%, which meant the vast majority of terrestrial NPP was used for human purposes in the two provinces, while the HANPP efficiencies in Zhejiang and Shanghai were 60.5% and 57.8%.
Figure 4(b) shows that distinguishable differences in HANPP as a percentage of NPPpot (HANPP/NPPpot) were found among the different provinces in the Yangtze River Delta during 2005–2015. The averaged percentages for Shanghai, Jiangsu and Anhui were 84.3%, 82.4 and 71.3%, respectively, which were larger than the value (62.4%) for the Yangtze River Delta. Shanghai had the largest proportion of HANPP/NPPpot, and an obvious increasing trend was presented from 2005 at 76.3% to 2015 at 88.4%. However, the interannual variability in HANPP/NPPpot in Jiangsu and Anhui provinces was minimal except in the worst drought year of 2011. Of the provinces, Zhejiang province had the lowest proportion of HANPP/NPPpot in the Yangtze River Delta, with an average value of 32.0%.

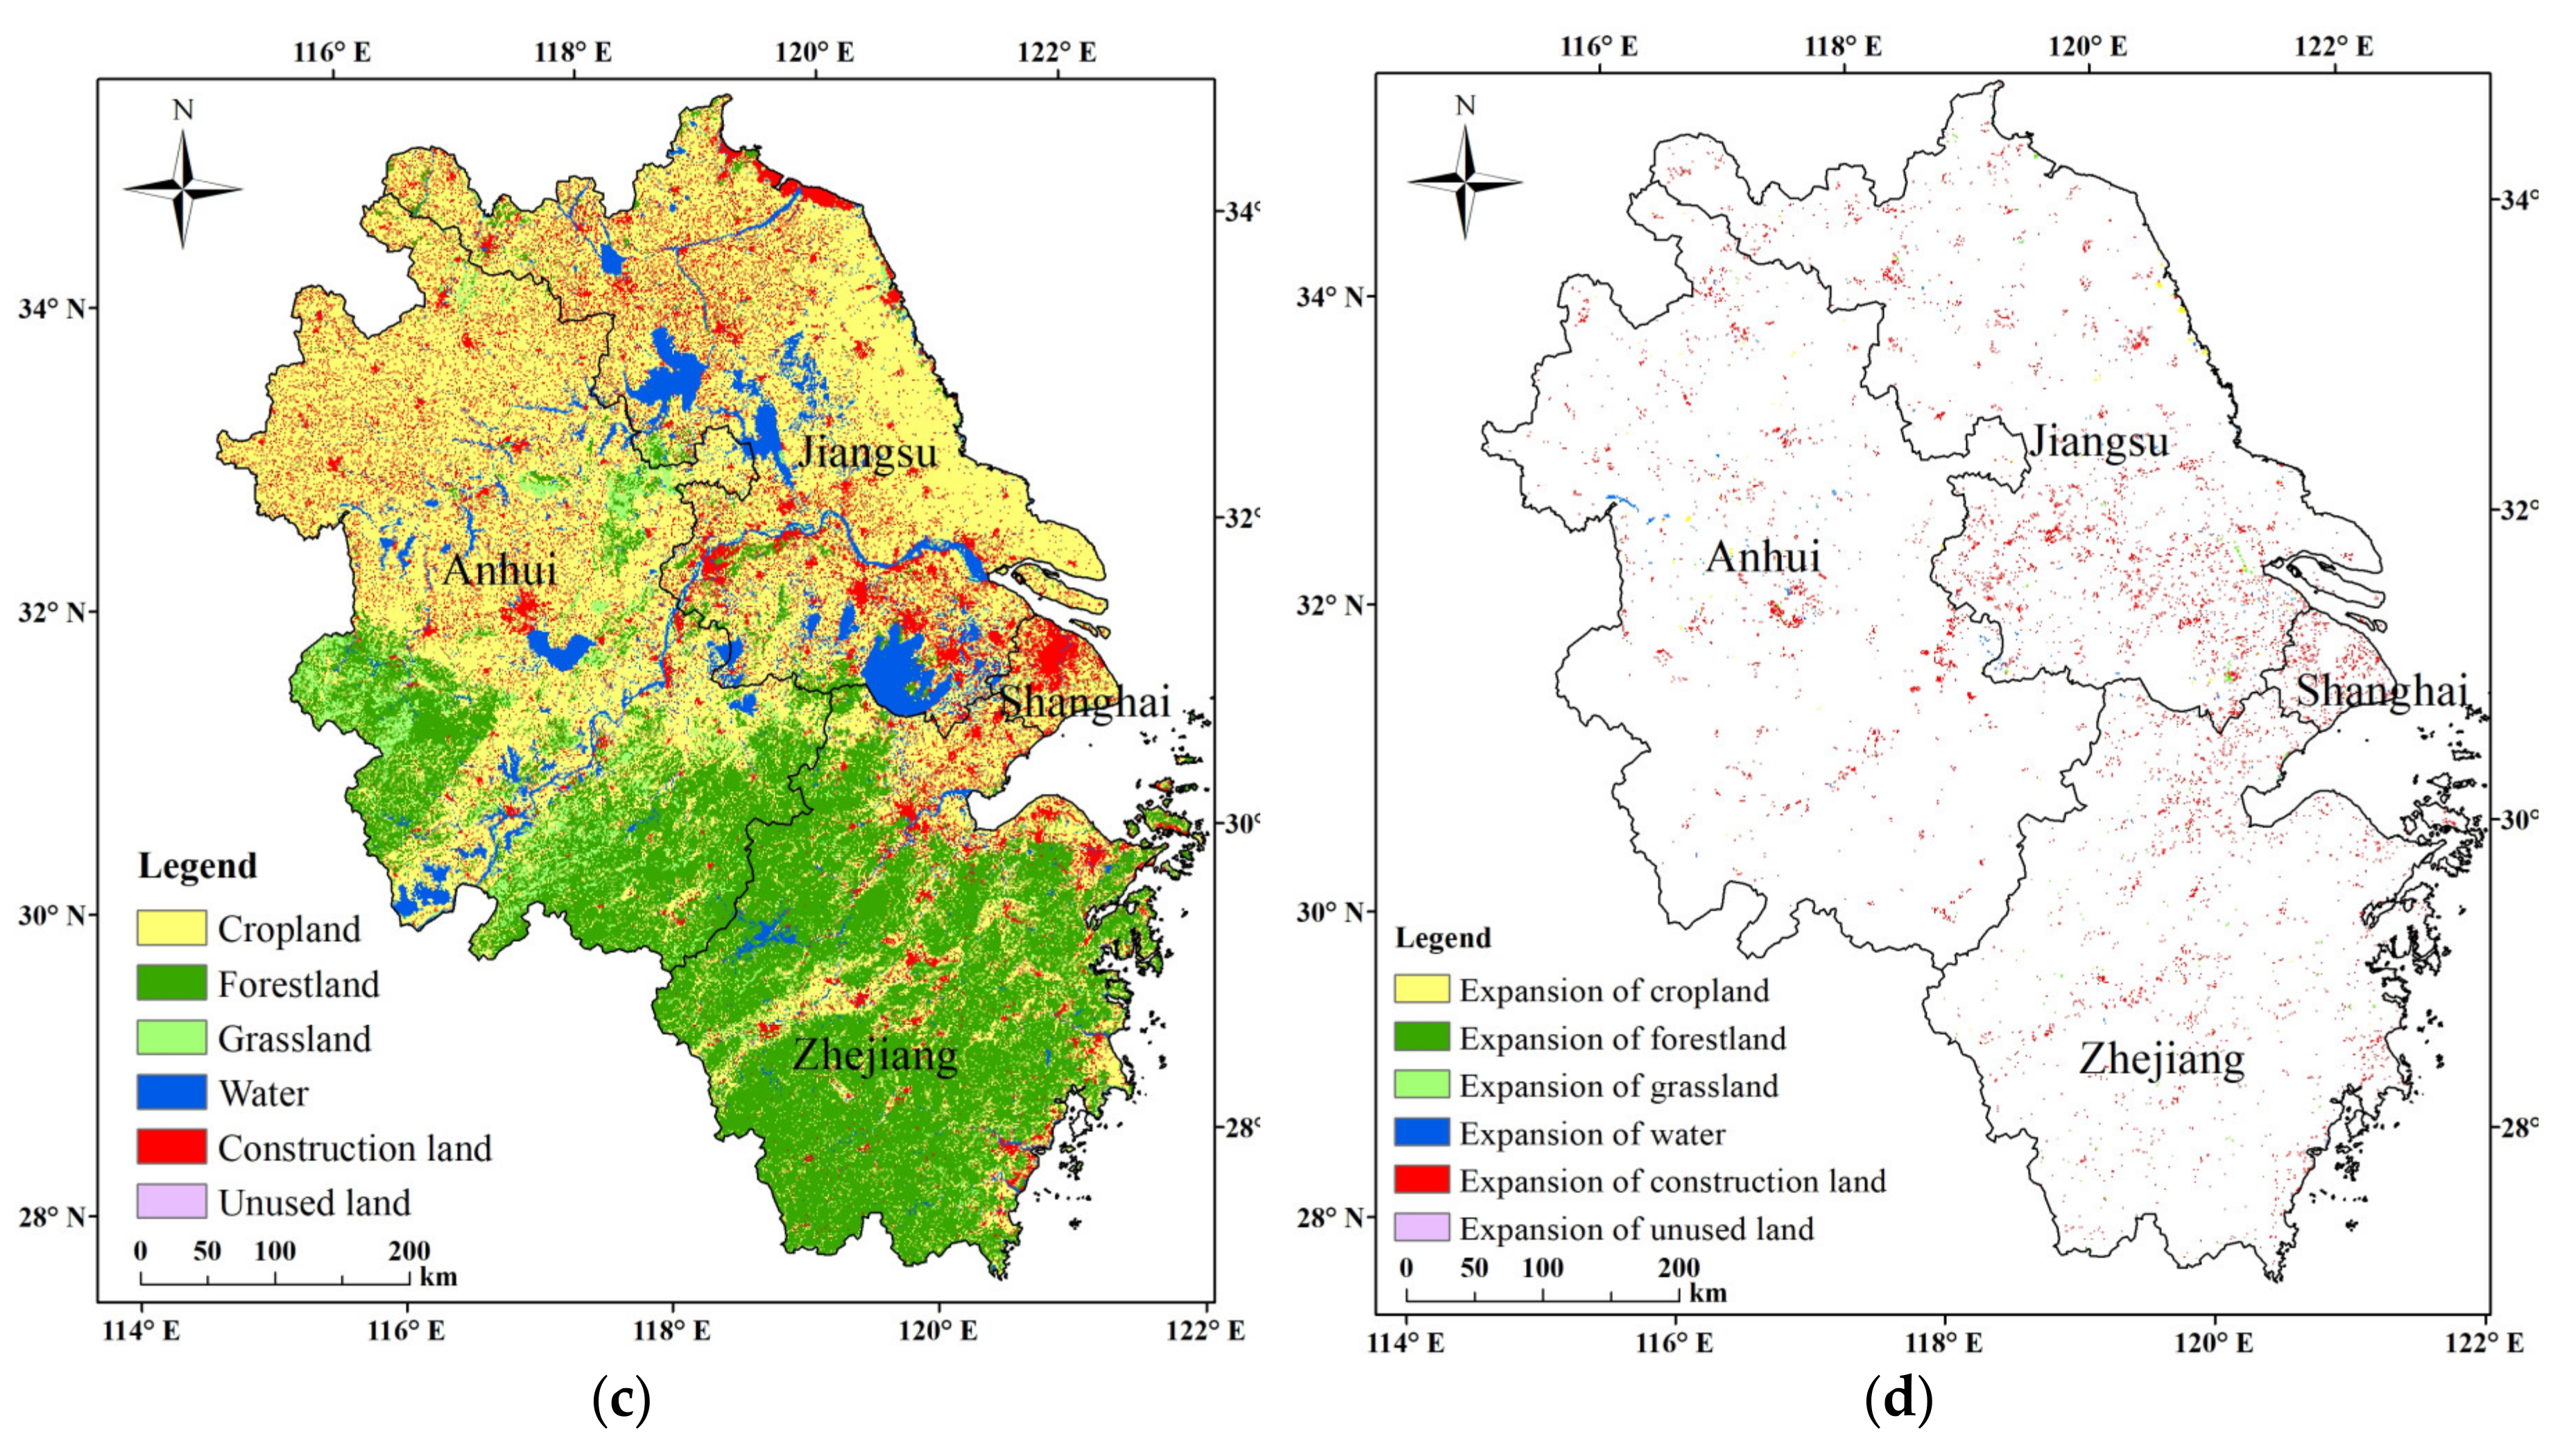
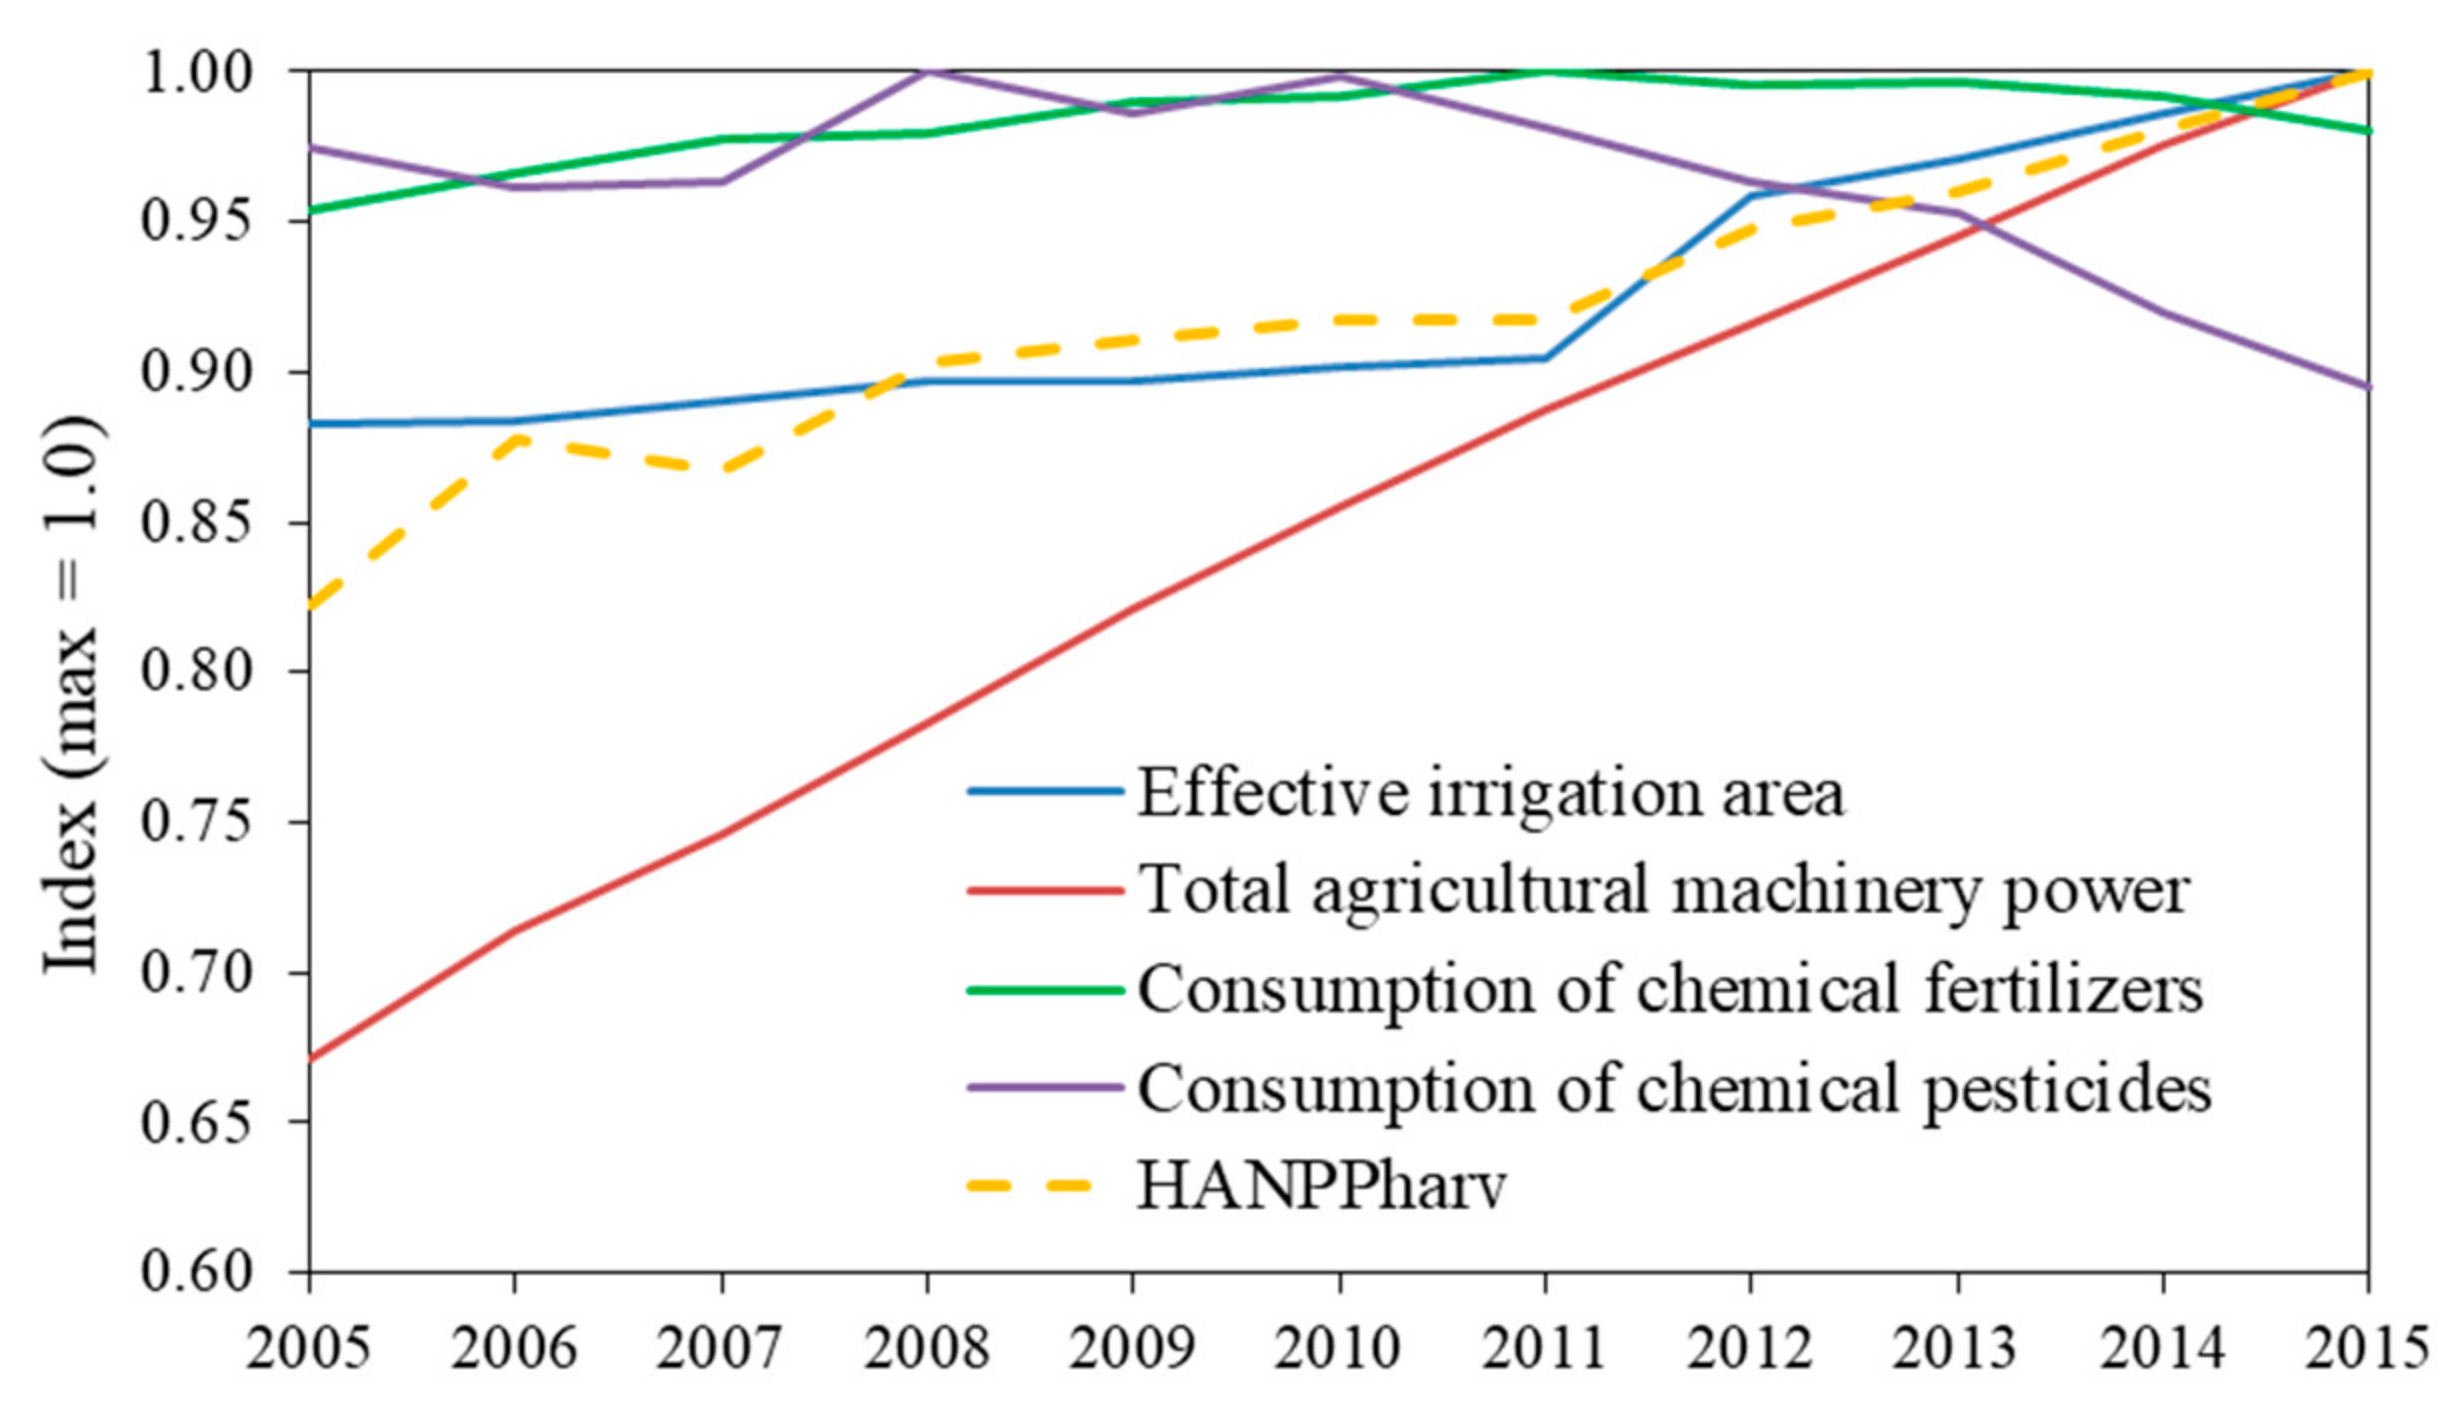
3.4. Influence of Land Use Change on HANPP

Land use-induced HANPP changes were divided into that in unchanged land use and in changed land use in this study. HANPP changes in changed land use was denoted as the increase or decrease of HANPP on the areas where land use types changed during 2005–2015. HANPP changes in unchanged land use was denoted as the increase or decrease of HANPP on the areas where land use types did not change, which was mainly caused by land intensification or soil degradation, etc. As the land use transfer matrix of the Yangtze River Delta from 2005 to 2015 shows in Table 4, the unchanged land use area accounted for 97.8% of the total area, and the changed land use area only accounted for 2.2%. Land use changes in the Yangtze River Delta were mainly driven by the expansion of construction land, and the dominant land use transition patterns were the conversions of cropland and forestland to construction land.
Using the averaged HANPP over the period of 2005–2007 and 2013–2015 as the HANPP value in 2005 and 2015, respectively, we calculated the HANPP transfer matrix of the Yangtze River Delta from 2005 to 2015. As shown in Table 5, the total HANPP increased 13.28 Tg C yr−1 during 2005–2015 in the Yangtze River Delta, and this increase was mainly driven by unchanged land use, and the increased HANPP induced by unchanged land use was 12.82 Tg C yr−1, accounting for 96.5% of the total increase. Cropland made the largest contribution to the HANPP increase induced by unchanged land use, at the proportion of 78.2% (10.02 Tg C yr−1). Under the condition that HANPPharv accounted for approximately 80% of the total HANPP, the HANPP increase in the Yangtze River Delta was mainly driven by the increase of HANPPharv in the cropland.
The increased HANPP induced by changed land use was 0.46 Tg C yr−1 (3.5%) and mostly occurred during the change from cropland, forestland and water area to construction land, and the increase resulting from the conversion of cropland to construction land was the largest, with a value of 0.13 Tg C yr−1.

4. Discussion

4.1. Comparison with Previous Studies

The proportion of HANPP/NPPpot is an important indicator to assess the intensity of land use influenced by human activities, and also a comparable indicator in different countries and regions. The higher the proportion, the more NPP that is appropriated by humans, and the less NPP that remains for other species. At the same time, the higher the proportion, the larger the intensity of land use. As shown in Table 6, distinct differences in the proportion of HANPP/NPPpot were found in different countries and regions. The proportion increased from 13% to 25% during 1910–2010 in global terrestrial ecosystems [34], which was close to Africa (14%–20%) during 1980–2005 [40] and less than that in Europe (44%–43%) during 1990–2006 [66]. The differences were also striking in countries with different levels of economic development. In most developed European countries, such as the United Kingdom and Germany, HANPP exceeded 50% of NPPpot, and exhibited a decreasing trend [38,67]. These countries generally had a large proportion of cropland and a high level of agricultural modernization, they farmed good lands and abandoned marginal lands, and then expanded forest on marginal lands. Moreover, these countries invested a substantial amount in nature protection. These factors caused the proportion of HANPP/NPPpot to decrease. In the developing countries China and Philippines, the proportion of HANPP/NPPpot has shown a continuously increasing trend [68,69]. Extensive deforestation, improvements in agricultural technology and urbanization might be the main reasons.
The HANPP increased from 59% in 2005 to 72% in 2015 of NPPpot in the Yangtze River Delta, which was comparable to the amount in developed countries in Europe. Similar to developed countries, the Yangtze River Delta is an economically developed and highly agriculturally modernized area of China, and a high land utilization ratio and land productivity resulted in the proportion of HANPP/NPPpot being high. As described above, the increase of HANPPharv in the cropland was the main driver of the HANPP increase in the Yangtze River Delta. We found that the increase of HANPPharv in cropland was correlated with the improvement of agricultural production conditions. During 2005–2015, the total agricultural machinery power and effective irrigation area increased remarkably in the Yangtze River Delta [62], as shown in Figure 5, which had a significant correlation with the trends of total HANPPharv, and the Pearson coefficients were 0.97 and 0.91, respectively. The consumption of chemical fertilizers and pesticides increased before 2010 and then decreased [62]. Precision fertilization and organic fertilizer substitution resulted in a reduced consumption of chemical fertilizers and pesticides with a positive effect on improving soil quality and increasing agricultural productivity. In particular, an increase in effective irrigation area could alleviate the negative effect of climate change on the HANPPharv of cropland. For instance, the worst drought in the lower-middle reaches area of the Yangtze River caused the potential NPP to decrease significantly in the Yangtze River Delta, whereas the actual NPP did not decrease significantly.
The difference was that, with the development of the economy and concentration of the population, the Yangtze River Delta experienced rapid urbanization, and a large amount of cropland was converted to construction land instead of forestland, resulting in the proportion of HANPP/NPPpot not declining as that in developed countries. With the increase of urbanization and improvement of residents’ consumption level in the Yangtze River Delta in the future, HANPP will continue to grow under current conditions. More concerns must be given to the negative effects of increased human activities in the Yangtze River Delta, such as the soil degradation, soil and groundwater pollution induced by consumption of chemical fertilizers and pesticides, although the consumption of chemical fertilizers and pesticides has declined since 2010.

4.2. Uncertainties in These Calculations

HANPP was calculated as the sum of HANPPluc and HANPPharv in this study, and the uncertainties in these calculations include two parts.
One part of the uncertainty was the calculation of HANPPluc. Some studies have used different methods to calculate NPPpot and NPPact. For example, Chen et al. [68] used the Zhouguangsheng model to calculate NPPpot and MOD17A3 production to represent the NPPact. Zhang, et al. [72] used the Miami model and CASA model to calculate NPPpot and NPPact respectively. It was difficult to distinguish the difference in NPPpot and NPPact resulting from HANPPluc or model structure. In this study, we calculated the NPPpot and NPPact in the same model framework, which was introduced in Section 2.3. However, we assumed that the NPPact of forests was equal to NPPpot , which is reasonable in natural forests with fewer anthropogenic disturbances but unclear in artificial forests. Generally, scientific forest management would improve NPPact and make it greater than NPPpot.
The other part of the uncertainty was the calculation of HANPPharv. Although the proportion of grassland in the Yangtze River Delta was small, large uncertainties still existed in the calculation of grassland HANPPharv. First, most livestock were raised on intensive farms in the Yangtze River Delta, and the statistical data did not distinguish between the intensively farmed livestock and naturally grazing livestock. Second, the commercial or supplementary feeds were not included in the feed supply, which are one of the most important sources of livestock feed in the study area. We only calculated the crop residues used as feed in the feed supply, which would overestimate HANPPharv.

5. Conclusions

An ecological indicator defined as HANPP was employed to analyze the terrestrial ecosystem NPP appropriated by humans in the Yangtze River Delta. The influence of land use change on HANPP and the uncertainties in the HANPP calculation were also discussed. The main findings of this study are as follows:
(1) The total HANPP of the Yangtze River Delta increased from 102.3 Tg C yr−1 to 142.2 Tg C yr−1, during 2005–2015, with an average of 121.3 Tg C yr−1. HANPPharv made the contribution of 79.9% to the total HANPP, and cropland was the dominant land use type contributing to the total HANPPharv. Anhui and Jiangsu provinces accounted for 82.7% of the total HANPP in the Yangtze River Delta, and Shanghai only accounted for 2.5%.
(2) As per the percentage of NPPpot, the differences in the magnitude and trends of HANPP were remarkable in the different countries and regions that have different economic development levels as well as science and technology levels. HANPP ranged from 59.3% to 72.4% of NPPpot during 2005–2015 in the Yangtze River Delta, which was comparable to that of developed countries. With the development of rapid urbanization, a large amount of cropland was converted to construction land as opposed to forests, which made the proportion of HANPP/NPPpot did not declining as that in developed countries.
(3) The total HANPP increased 13.28 Tg C yr−1 during 2005–2015 in the Yangtze River Delta, and the increase was mainly driven by the increase of HANPPharv in cropland. Furthermore, the increase of HANPPharv in cropland was significantly correlated with the improvement of agricultural production conditions, such as the total agricultural machinery power and effective irrigation area. Unchanged land use-induced changes in HANPP were the main causes of the HANPP increase and accounted for 96.5% of the total increase. Correspondingly, the increment induced by changed land use only accounted for 3.5%, and the conversion of cropland to construction land was the main type of conversion.

Author Contributions

Conceptualization, Q.H., F.Z. and Y.J; methodology, Q.H. and Y.J.; data curation, Q.H., H.O., Q.Z. and F.Z.; formal analysis, Q.H., F.Z., Q.Z. and Y.J.; writing-original draft preparation, Q.H.; writing―review and editing, Q.H., F.Z., Q.Z., H.O. and Y.J. All authors contributed extensively to this work. All authors have read and agreed to the published version of the manuscript.

Funding

This study was funded by Fundamental Research Funds for Central Non-profit Scientific Institution (No. 1610132020030), National Natural Science Foundation of China (No. 41701393), Natural Science Foundation of Jiangsu Province for Youth (No. BK20170641), and China Postdoctoral Science Foundation (No. 2017M621698).

Conflicts of Interest

The authors declare no conflict of interest.

References

  1. The Millennium Ecosystem Assessment. Ecosystems and Human Well-Being: Synthesis; Island Press: Washington, DC, USA, 2005. [Google Scholar]
  2. United Nations Environment Programme. Globe Environment Outlook 5: Environment for the Future We want; Progress Press Ltd: Mriehel, Malta, 2012. [Google Scholar]
  3. Wackernagel, M.; Schulz, N.B.; Deumling, D.; Linares, A.C.; Jenkins, M.; Kapos, V.; Monfreda, C.; Loh, J.; Myers, N.; Norgaard, R.; et al. Tracking the ecological overshoot of the human economy. Proc. Natl. Acad. Sci. USA 2002, 99, 9266–9271. [Google Scholar] [CrossRef] [Green Version]
  4. Adriaanse, A.; Bringezu, S.; Hammond, A. Resource Flows: The Material Basis of Industrial Economies; World Resources Institute: Washington, DC, USA, 1997. [Google Scholar]
  5. Brown, M.T.; Ulgiati, S. Emergy-based indices and ratios to evaluate sustainability: Monitoring economies and technology toward environmentally sound innovation. Ecol. Eng. 1997, 9, 51–69. [Google Scholar] [CrossRef]
  6. Koffi, E.N.; Rayner, P.J.; Scholze, M.; Beer, C. Atmospheric constraints on gross primary productivity and net ecosystem productivity: Results from a carbon-cycle data assimilation system. Glob. Biogeochem. Cycles 2012, 26, 104–105. [Google Scholar] [CrossRef] [Green Version]
  7. Running, S.W. A Measurable Planetary Boundary for the Biosphere. Science 2012, 337, 1458–1459. [Google Scholar] [CrossRef] [PubMed] [Green Version]
  8. Defries, R.S.; Field, C.B.; Fung, I.; Collatz, G.L.; Bounoua, L. Combining satellite data and biogeochemical models to estimate global effects of human-induced land cover change on carbon emissions and primary productivity. Glob. Biogeochem. Cycles 1999, 13, 803–815. [Google Scholar] [CrossRef]
  9. Sitch, S.; Smith, B.; Prentice, I.C.; Arneth, A.; Bondeau, A.; Cramer, W.; Kaplan, J.O.; Levis, S.; Lucht, W.; Sykes, M.T.; et al. Evaluation of ecosystem dynamics, plant geography and terrestrial carbon cycling in the LPJ dynamic global vegetation model. Glob. Chang. Biol. 2003, 9, 161–185. [Google Scholar] [CrossRef]
  10. Buyantuyev, A.; Wu, J. Urbanization alters spatiotemporal patterns of ecosystem primary production: A case study of the Phoenix metropolitan region, USA. J. Arid Environ. 2009, 73, 512–520. [Google Scholar] [CrossRef]
  11. Fu, Y.; Lu, X.; Zhao, Y.; Zeng, X.; Xia, L. Assessment impacts of weather and land use/land cover (LULC) change on urban vegetation net primary productivity (NPP): A case study in Guangzhou, China. Remote Sens. 2013, 5, 4125–4144. [Google Scholar] [CrossRef] [Green Version]
  12. Li, J.; Wang, Z.; Lai, C.; Wu, X.; Zeng, Z.; Chen, X.; Lian, Y. Response of net primary production to land use and land cover change in mainland China since the late 1980s. Sci. Total Environ. 2018, 639, 237–247. [Google Scholar] [CrossRef]
  13. Zika, M.; Erb, K.H. The global loss of net primary production resulting from human–induced soil degradation in drylands. Ecol. Econ. 2009, 69, 310–318. [Google Scholar] [CrossRef]
  14. Xu, D.Y.; Kang, X.W.; Liu, Z.L.; Zhuang, D.F.; Pan, J.J. The relative roles of climate change and human activities in the process of desertification in the Ordos region. Sci. China 2009, 39, 516–528. (In Chinese) [Google Scholar]
  15. Xu, D.; Song, A.; Li, D.; Ding, X.; Wang, Z. Assessing the relative role of climate change and human activities in desertification of North China from 1981 to 2010. Front. Earth Sci. 2019, 13, 43–54. [Google Scholar] [CrossRef]
  16. Zhang, C.; Wang, X.; Li, J.; Hua, T. Roles of climate changes and human interventions in land degradation: A case study by net primary productivity analysis in China’s Shiyanghe Basin. Environ. Earth Sci. 2011, 64, 2183–2193. [Google Scholar] [CrossRef]
  17. Li, C.H.; Fan, Y.P.; Cao, H.Y.; Han, H. Impact of human activities on net primary productivity based on the CASA model: A case study of the Shiyang River Basin. Arid Land Geogr. 2018, 41, 144–153. (In Chinese) [Google Scholar]
  18. Li, C.H.; Zhao, J.; Shi, Y.F.; Hu, X. The impact of human activities on net productivity based on the coefficient of variation: A case study of the Shiyang River Basin. Acta Ecol. Sin. 2016, 36, 4034–4044. (In Chinese) [Google Scholar]
  19. Zhou, W.; Sun, Z.; Li, J.; Gang, C.; Zhang, C. Desertification dynamic and the relative roles of climate change and human activities in desertification in the Heihe River Basin based on NPP. J. Arid Land 2013, 5, 465–479. [Google Scholar] [CrossRef] [Green Version]
  20. Li, Q.; Zhang, C.; Shen, Y.; Jia, W.; Li, J. Quantitative assessment of the relative roles of climate change and human activities in desertification processes on the Qinghai-Tibet Plateau based on net primary productivity. Catena 2016, 147, 789–796. [Google Scholar] [CrossRef]
  21. Zhou, W.; Gang, C.; Zhou, F.; Li, J.; Dong, X.; Zhao, C. Quantitative assessment of the individual contribution of climate and human factors to desertification in northwest China using net primary productivity as an indicator. Ecol. Indic. 2015, 48, 560–569. [Google Scholar] [CrossRef]
  22. Zhang, J.; Ren, H. Effects of human activities on net primary productivity in the Xilingol grassland. J. Nat. Resour. 2017, 32, 1125–1133. (In Chinese) [Google Scholar]
  23. Du, J.; Yu, D. Impact of climate change and human activities on net primary productivity of grassland in agro–pastoral transitional zone in northern China. J. Beijing Norm. Univ. 2018, 54, 365–372. (In Chinese) [Google Scholar]
  24. Mu, S.J.; Zhou, S.; Chen, Y.; Li, J.; Ju, W.M.; Odeh, I. Assessing the impact of restoration-induced land conversion and management alternatives on net primary productivity in Inner Mongolian grassland, China. Glob. Planet Chang. 2013, 108, 29–41. [Google Scholar] [CrossRef]
  25. Gang, C.; Zhao, W.; Zhao, T.; Zhang, Y.; Gao, X.; Wen, Z. The impacts of land conversion and management measures on the grassland net primary productivity over the Loess Plateau, Northern China. Sci. Total Environ. 2018, 645, 827–836. [Google Scholar] [CrossRef] [PubMed]
  26. Haberl, H.; Erb, K.H.; Krausmann, F. Human appropriation of net primary production: Patterns, trends, and planetary boundaries. Annu. Rev. Environ. Resour. 2014, 39, 363–391. [Google Scholar] [CrossRef]
  27. Haberl, H. Human appropriation of net primary production as an environmental indicator: Implications for sustainable development. Ambio 1997, 26, 143–146. [Google Scholar]
  28. Haberl, H.; Erb, K.H.; Krausmann, F.; Gaube, V.; Bondeau, A.; Plutzar, C.; Gingrich, S.; Lucht, W.; Kowalski, M.F. Quantifying and mapping the human appropriation of net primary production in earth’s terrestrial ecosystems. Proc. Natl. Acad. Sci. USA 2007, 104, 12942–12947. [Google Scholar] [CrossRef] [Green Version]
  29. Whittaker, R.H.; Likens, G.E. Primary production: The biosphere and man. Hum. Ecol. 1973, 1, 357–369. [Google Scholar] [CrossRef]
  30. Vitousek, P.M.; Ehrlich, P.R.; Ehrlich, A.H.; Matson, P.A. Human appropriation of the products of photosynthesis. BioScience 1986, 36, 368–373. [Google Scholar] [CrossRef]
  31. Wright, D.H. Human impacts on energy flow through natural ecosystems, and implications for species endangerment. Ambio 1990, 19, 189–194. [Google Scholar]
  32. Imhoff, M.L.; Bounoua, L.; Ricketts, T.; Loucks, C.; Harriss, R.; Lawrence, W.T. Global patterns in human consumption of net primary production. Nature 2004, 429, 870–873. [Google Scholar] [CrossRef] [Green Version]
  33. Krausmann, F. Land use and industrial modernization: An empirical analysis of human influence on the functioning of ecosystems in Austria 1830–1995. Land Use Policy 2001, 18, 17–26. [Google Scholar] [CrossRef]
  34. Krausmann, F.; Erb, K.H.; Gingrich, S.; Haberl, H.; Bondeau, A.; Gaube, V.; Lauk, C.; Plutzar, C.; Searchinger, T.D. Global human appropriation of net primary production doubled in the 20th century. Proc. Natl. Acad. Sci. USA 2013, 110, 10324–10329. [Google Scholar] [CrossRef] [PubMed] [Green Version]
  35. Schwarzlmüller, E. Human appropriation of aboveground net primary production in Spain, 1955–2003: An empirical analysis of the industrialization of land use. Ecol. Econ. 2009, 69, 282–291. [Google Scholar] [CrossRef]
  36. Niedertscheider, M.; Gingrich, S.; Erb, K.H. Changes in land use in South Africa between 1961 and 2006: An integrated socio–ecological analysis based on the human appropriation of net primary production framework. Reg. Environ. Chang. 2012, 12, 715–727. [Google Scholar] [CrossRef] [Green Version]
  37. Niedertscheider, M.; Erb, K.H. Land system change in Italy from 1884 to 2007: Analysing the North–South divergence on the basis of an integrated indicator framework. Land Use Policy 2014, 39, 366–375. [Google Scholar] [CrossRef] [PubMed] [Green Version]
  38. Niedertscheider, M.; Kuemmerle, T.; Müller, D.; Erb, K.H. Exploring the effects of drastic institutional and socio-economic changes on land system dynamics in Germany between 1883 and 2007. Glob. Environ. Chang. 2014, 28, 98–108. [Google Scholar] [CrossRef] [PubMed] [Green Version]
  39. Fetzel, T.; Gradwohl, M.; Erb, K.H. Conversion, intensification, and abandonment: A human appropriation of net primary production approach to analyze historic land-use dynamics in New Zealand 1860–2005. Ecol. Econ. 2014, 97, 201–208. [Google Scholar] [CrossRef]
  40. Fetzel, T.; Niedertscheider, M.; Haberl, H.; Kuemmerle, T.; Erb, K.H. Patterns and changes of land use and land-use efficiency in Africa 1980–2005: An analysis based on the human appropriation of net primary production framework. Reg. Environ. Chang. 2016, 16, 1507–1520. [Google Scholar] [CrossRef]
  41. Cardoch, L.; Day, J.W., Jr.; Ibàñez, C. Net primary productivity as an indicator of sustainability in the Ebro and Mississippi deltas. Ecol. Appl. 2002, 12, 1044–1055. [Google Scholar] [CrossRef]
  42. National Bureau of Statistics of China. China Statistical Yearbooks Database 2018. Available online: http://www.stats.gov.cn/tjsj/ndsj/2018/indexch.htm (accessed on 16 November 2019).
  43. Yuan, J.; Xu, Y.P.; Xiang, J.; Wu, L.; Wang, D.Q. Spatiotemporal variation of vegetation coverage and its associated influence factor analysis in the Yangtze River Delta, eastern China. Environ. Sci. Pollut. Res. 2019, 26, 32866–32879. [Google Scholar] [CrossRef]
  44. Hu, A.T. The method of phyllostachys pubescens measurement and the application of the normal bamboo of stump diameter. Hunan For. Sci. Technol. 1987, 1, 16–19. (In Chinese) [Google Scholar]
  45. Zhang, Y.; Zhang, Y.; Pan, L.; Tang, S.; Huang, D. Analysis on current situation of herbivorous livestock forage supply/demand in China. Chin. J. Anim. Sci. 2014, 50, 12–16. (In Chinese) [Google Scholar]
  46. Li, J.X. The Study on Forage Supply and Demand in China’s Different Areas and Suggestions; Chinese Academy of Agricultural Sciences: Beijing, China, 2012. (In Chinese) [Google Scholar]
  47. Gerten, D.; Schaphoff, S.; Haberlandt, U.; Lucht, W.; Sitch, S. Terrestrial vegetation and water balance -hydrological evaluation of a dynamic global vegetation model. J. Hydrol. 2004, 286, 249–270. [Google Scholar] [CrossRef]
  48. Lieth, H. Primary production: Terrestrial ecosystems. Hum. Ecol. 1973, 1, 303–332. [Google Scholar] [CrossRef]
  49. Uchijima, Z.; Seino, H. Agroclimatic evaluation of net primary productivity of natural vegetations. J. Agric. Meteorol. 1985, 40, 343–352. [Google Scholar] [CrossRef]
  50. Lieth, H. Evapotranspiration and primary productivity: CW Thornthwaite memorial model. Pub. Climatol. 1972, 25, 37–46. [Google Scholar]
  51. Prince, S.D.; Goward, S.N. Global primary production: A remote sensing approach. J. Biogeogr. 1995, 22, 815–835. [Google Scholar] [CrossRef]
  52. Potter, C.S.; Randerson, J.T.; Field, C.B.; Matson, P.A.; Vitousek, P.M.; Mooney, H.A.; Klooster, S.A. Terrestrial ecosystem production: A process model based on global satellite and surface data. Glob. Biogeochem. Cycles 1993, 7, 811–841. [Google Scholar] [CrossRef]
  53. Liu, J.; Chen, J.M.; Cihlar, J.; Park, W.M. A process-based boreal ecosystem productivity simulator using remote sensing inputs. Remote Sens. Environ. 1997, 62, 158–175. [Google Scholar] [CrossRef]
  54. Zhu, H.Y.; Li, X.B. Discussion on the index method of regional land use change. Acta Geogr. Sin. 2003, 25, 643–650. (In Chinese) [Google Scholar]
  55. He, J.; Yang, K. China Meteorological forcing dataset. Cold Arid Reg. Sci. Data Cent. Lanzhou 2011. [Google Scholar] [CrossRef]
  56. Harris, I.; Jones, P.D.; Osborn, T.J.; Lister, D.H. Updated high-resolution grids of monthly climatic observations–the CRU TS3. 10 Dataset. Int. J. Clim. 2014, 34, 623–642. [Google Scholar] [CrossRef] [Green Version]
  57. Mitchell, T.D.; Jones, P.D. An improved method of constructing a database of monthly climate observations and associated high-resolution grids. Int. J. Clim. 2005, 25, 693–712. [Google Scholar] [CrossRef]
  58. Keeling, C.D.; Piper, S.C.; Bacastow, R.B.; Wahlen, M.; Whorf, T.P.; Heimann, M.; Meijer, H.A. Exchanges of Atmospheric CO2 and 13CO2 with the Terrestrial Biosphere and Oceans from 1978 to 2000 I. Global Aspects 2001, 1, 1–28. [Google Scholar]
  59. Zöbler, L. A world soil file for global climate modelling. NASA Tech. Memo 1986, 87802, 33. [Google Scholar]
  60. Huang, Q.; Ju, W.M.; Zhang, F.Y.; Zhang, Q. Roles of climate change and increasing CO2 in driving changes of net primary productivity in China simulated using a dynamic global vegetation model. Sustainability 2019, 11, 4176. [Google Scholar] [CrossRef] [Green Version]
  61. Remote Sensing Monitoring Data of Land Use in China. Available online: http://www.resdc.cn (accessed on 5 November 2018).
  62. National Bureau of Statistics of China. China Statistical Yearbook Database (2005–2015). Available online: http://www.stats.gov.cn/tjsj/ndsj/ (accessed on 18 March 2019).
  63. National Forestry and Grassland Administration. China Forestry Statistical Yearbook Database (2005–2015). Available online: http://www.forestry.gov.cn/data.html (accessed on 20 March 2019).
  64. Ministry of Agriculture of China. China Agriculture Yearbook Database (2005–2015). Available online: http://tongji.cnki.net/kns55/navi/HomePage.aspx?id=N2013060001&name=YZGNV&floor=1 (accessed on 21 March 2019).
  65. Xu, J.P.; Wang, W.; Cai, X.J.; Xu, Z.L.; Xu, J.X. A comparison of the rossby wave activities and circulation features of the drought in winter-spring of 2011 and in summer of 2013 over mid-lower reaches of the Yangtze River basin. J. Trop. Meteorol. 2017, 33, 992–999. [Google Scholar]
  66. Plutzar, C.; Kroisleitner, C.; Haberl, H.; Fetzel, T.; Bulgheroni, C.; Beringer, T.; Hoster, P.; Kastner, T.; Kuemmerle, T.; Lauk, C.; et al. Changes in the spatial patterns of human appropriation of net primary production (HANPP) in Europe 1990–2006. Reg. Environ. Chang. 2015, 41, 1–14. [Google Scholar] [CrossRef]
  67. Musel, A. Human appropriation of net primary production in the United Kingdom, 1800–2000: Changes in society’s impact on ecological energy flows during the agrarian-industrial transition. Ecol. Econ. 2009, 69, 270–281. [Google Scholar] [CrossRef]
  68. Chen, A.; Li, R.; Wang, H.; He, B. Quantitative assessment of human appropriation of aboveground net primary production in China. Ecol. Model 2015, 312, 54–60. [Google Scholar] [CrossRef] [Green Version]
  69. Kastner, T. Trajectories in human domination of ecosystems: Human appropriation of net primary production in the Philippines during the 20th century. Ecol. Econ. 2009, 69, 260–269. [Google Scholar] [CrossRef]
  70. Kohlheb, N.; Krausmann, F. Land use change, biomass production and HANPP: The case of Hungary 1961–2005. Ecol. Econ. 2009, 69, 292–300. [Google Scholar] [CrossRef]
  71. Zhang, Y.; Pan, Y.; Zhang, X.; Wu, J.X.; Yu, C.Q.; Li, M.; Wu, J.S. Patterns and dynamics of the human appropriation of net primary production and its components in Tibet. J. Environ. Manag. 2018, 210, 280–289. [Google Scholar] [CrossRef] [PubMed]
  72. Zhang, F.Y.; Pu, L.J.; Huang, Q. Quantitative assessment of the human appropriation of net primary production (HANPP) in the coastal areas of Jiangsu, China. Sustainability 2015, 7, 15857–15870. [Google Scholar] [CrossRef]
Figure 1. The geographical locations and topography of the Yangtze River Delta
Sustainability 12 01697 g001
Figure 2. Spatial distribution of land use in the Yangtze River Delta in (a) 2005, (b) 2010, (c) 2015 and (d) expansion of different land use types during 2005–2015. The total expanded area of six land use types (transferred from other land use types) shown in (d) was 7346 km2, and the expanded area of construction land was 6498 km2, accounted for 88.5% of the total expanded area, followed by water (4.8%), and cropland (2.8%), grassland (2.7%), forestland (0.7%) and unused land (0.5%) accounted for very small proportions of the total expanded area. Expanded construction land mainly located in south of Jiangsu province, Shanghai and north of Zhejiang province.
Sustainability 12 01697 g002aSustainability 12 01697 g002b
Figure 3. The temporal variation in the total (a) NPPpot and NPPact, (b) HANPPluc and HANPPharv in the Yangtze River Delta from 2005 to 2015 (Tg C yr−1).
Sustainability 12 01697 g003
Figure 4. (a) The average total HANPP, HANPPharv and HANPPluc; (b) the variation in the HANPP/NPPpot from 2005 to 2015 (Tg C yr−1), in the four provinces in the Yangtze River Delta.
Sustainability 12 01697 g004
Figure 5. Trends in cropland HANPPharv and agricultural production conditions in the Yangtze River Delta from 2005 to 2015. The index is defined as the value in each year divide by the maximum value from 2005 to 2015, and the maximum index is 1.0.
Sustainability 12 01697 g005
Table 1. The coefficient of one sheep unit for livestock.
LivestockCowHorseDonkeyMuleCamelSheep
young livestock
adult livestock
2.52.522.53.50.7
555471
Table 2. Land use structure of the Yangtze River Delta from 2005 to 2015 (km2).
ProvinceCroplandForestlandGrasslandWaterConstruction LandUnused Land
Jiangsu67,430 (66.9%)3386 (3.4%)789 (0.8%)12,444 (12.3%)16,695 (16.6%)22 (0.0%)
Anhui79,901 (57.0%)32,383 (23.1%)8299 (5.9%)7332 (5.2%)12,297 (8.8%)14 (0.0%)
Shanghai3809 (61.4%)100 (1.6%)8 (0.1%)266 (4.3%)2024 (32.6%)0 (0.0%)
Zhejiang25,403 (25.1%)64,855 (64.0%)2231 (2.2%)2521 (2.5%)6219 (6.1%)82 (0.1%)
Total176,543 (50.7%)100,724 (28.8%)11,327 (3.3%)22,562 (6.5%)37,235 (10.7%)118 (0.0%)
Table 3. HANPPharv of different land use types from 2005 to 2015 (Tg C yr−1).
YearCroplandForestlandGrasslandConstruction LandTotal
Tg C yr−1%Tg C yr−1%Tg C yr−1%Tg C yr−1%
200573.184.2%4.45.0%7.08.1%2.22.5%86.8
200678.284.3%4.75.1%6.97.4%2.93.1%92.7
200776.683.8%4.85.2%6.77.3%3.33.6%91.5
200879.283.1%5.75.9%6.77.0%3.84.0%95.3
200980.884.0%4.95.1%6.97.2%3.53.7%96.1
201080.483.0%5.65.8%7.17.3%3.73.8%96.9
201181.784.3%5.75.9%6.87.0%2.72.7%96.8
201283.983.9%5.75.7%6.86.8%3.63.6%100.0
201384.182.9%5.75.6%6.96.9%4.74.6%101.4
201486.283.3%5.55.3%7.06.8%4.84.6%103.6
201587.983.3%5.35.1%7.26.8%5.14.8%105.6
Table 4. Land use transfer matrix for the Yangtze River Delta from 2005 to 2015 (km2).
TypeCroplandForestlandGrasslandWaterConstruction LandUnused Land
cropland173,4323831311563618
forestland9100,3127355775
grassland14711,16910921
water9427922,17319314
construction land871222133,9752
unused land01030102
Table 5. HANPP transfer matrix of the Yangtze River Delta from 2005 to 2015 (10−3 Tg C yr−1).
TypeCroplandForestlandGrasslandWaterConstruction LandUnused Land
cropland10,019.4−15.3−1.9−144.9133.9−8.6
forestland4.31151.119.7−0.3270.2−0.4
grassland4.5−2.073.1−2.915.0−0.4
water52.10.138.10.094.70.0
construction land8.7−0.41.2−9.61583.1−1.0
unused land0.00.20.00.00.00.0
Table 6. Comparison of the HANPP estimated in this study with previous studies.
AreaPeriodHANPP % of NPPpotReferences
Global1910–200513–25 (↑)[34]
Europe1990–200644–43 (↓)[66]
Africa1980–200514–20 (↑)[40]
Austria1950–199560–50 (↓)[33]
United Kingdom1800–200071–68 (↓)[67]
Italy1884–200778–56 (↓)[37]
Germany1883-200775–65 (↓)[38]
Spain1955–200367–61 (↓)[35]
Hungary1961–200567–49 (↓)[70]
New Zealand1860–200534–32 (↓)[39]
South Africa1961–200621–25 (↑)[36]
Philippines1910–200335–62 (↑)[69]
China2001–201049–58 (↑)[68]
Tibet1989–20157–14 (↑)[71]
The Yangtze River Delta2005–201559–72 (↑)this study

