A Structural Equation Model of Success in Drinking Water Source Protection Programs


1
Graduate School of Engineering Science and Technology, National Yunlin University of Science and Technology, Yunlin 64002, Taiwan
2
Graduate School of Engineering Science and Technology/Department of Civil and Construction Engineering, National Yunlin University of Science and Technology, Yunlin 64002, Taiwan
3
Graduate School of Environmental, Health and Safety Engineering, National Yunlin University of Science and Technology, Yunlin 64002, Taiwan
*
Author to whom correspondence should be addressed.
Sustainability 2020, 12(4), 1698; https://0-doi-org.brum.beds.ac.uk/10.3390/su12041698
Submission received: 21 January 2020
/
Revised: 19 February 2020
/
Accepted: 20 February 2020
/
Published: 24 February 2020
Abstract
:The management structures put in place for the protection of drinking water sources are multifaceted and include a range of government agencies, landholders and regulatory agencies. While source protection is widely practiced in the water industry, there is limited research on underlying constructs that support successful outcomes in drinking water source protection (DWSP) programs. This study builds on current research by further investigating the following proposed critical success factors (CSFs) for source protection: CSF1: policy and government agency support of source protection; CSF2: catchment condition information and risk monitoring; CSF3: support of operational field activities; and CSF4: response to water quality threats. This study uses structural equation modeling (SEM) to confirm the associations amongst the four CSFs. The results show that policy and government agency support for DWSP has a significant influence over how water service providers (WSPs) plan operational activities for risk management. This emphasizes the importance of the role policy and government agencies have in supporting DWSP. The relationships between the CSFs, which typically fall under the responsibility of WSPs, show that information on catchment condition influences operational activities for risk management, and these mediate the influence over response to water quality threats. The response to threats also showed a strong relationship with the function of monitoring catchment risk. The resulting SEM framework provides new insights into the underlying structures that influence outcomes in catchment management and source protection.
1. Introduction
Ensuring safe drinking water requires a holistic catchment-to-tap approach to risk management [1]. The multiple barrier approach is considered internationally the best practice for risk management in the drinking water supply. Drinking water quality barriers include treatment technologies, distribution management and security and source protection. The under-performance of any barrier in the system must be treated as a call to action by operators [2]. Source protection has long been recognized as the first barrier in the supply of safe drinking water. Through protection of drinking water sources, the level of contamination of water that needs to be managed by downstream barriers can be maintained within acceptable levels [3].
The safe management of drinking water supplies requires a sound understanding of applicable science, appropriate policy and a well-defined understanding of system risks [4]. While source protection is widely practiced in the water industry and seen as the best practice for the protection of public health, there is limited research on critical success factors (CSFs) for successful outcomes in catchment management and drinking water source protection (DWSP) programs. CSFs are the key items in a larger system that must work well to ensure the ongoing effectiveness of a process [5]. Identifying CSFs for complex management structures involving multiple parties to guide and measure positive outcomes has been used in research areas including project management [6], education [7] and construction safety. This study investigates the latent relationships between CSFs shown to influence the effectiveness of programs for protecting surface water catchments using a structural equation model (SEM).
The SEM method supports the examination of the hypothetical relationships between variables and verifies the relationship statistically [8]. This approach has been used in a variety of safety-related research, including safety culture and construction safety, where there is a complex mix of policy, operations and multiple agencies [9,10]. A deeper understanding of CSFs which influence DWSP program success using SEM can help guide better practice for multi-agency management of water catchments for control of water quality and public health risks in drinking water supplies. This study focuses on source protection practices in Taiwan, supported with information from the Australian and Greek water industries.
Active protection of surface water catchments for drinking water systems is effective in protecting public health through reducing illness associated with drinking water contamination [3]. The long-standing practice of drinking water source protection has proven effective in reducing the pathogen and organic matter loads on downstream treatment processes, in turn reducing public health risks associated with gastric illness, as well as lowering the potential for the formation of potentially harmful disinfection by products [4]. In addition to public health outcomes, the protection of drinking water sources has significant financial and economic benefits for consumers and the wider community. Many examples exist where catchment protection for drinking water quality has resulted in significant savings through avoided spending on treatment infrastructure. In the case of the Catskills watershed, which is the major water source for New York City, an investment of $1.5 billion USD over 10 years for watershed protection prevented at least $6 billion in capital costs for water filtration [11].
Catchment areas are a unique asset in the water supply chain, in that the water service provider (WSP) often has little direct control over the catchment management structures. Control is often limited due to an absence of direct ownership of catchment land and a multitude of land managers, as well as the combination of management agency involvement and multiple land management objectives. As a result, the WSP has limited influence over the land uses and activities that pose a risk to water quality within the catchment area. Furthermore, the drinking water catchment areas and the water contained within hold multiple environmental, social, cultural and economic values to the wider community [12]. The wide range of community values results in a broad range of stakeholder groups involved in catchment management. Therefore, the responsibility of source protection in Taiwan extends beyond water agencies [13] and requires a wider consideration of all the stakeholders involved in catchment management.
The complex arrangement of stakeholder groups calls for robust management programs to assess public health risks and implement risk control strategies, as well as identify and respond to emerging threats to drinking water quality outcomes. Although source protection is seen as the best practice for the protection of public health, there is limited research on underlying structures which support successful outcomes for the implementation of drinking water source protection (DWSP) programs. To date, much of the information provided comes from the viewpoints of a select group of recognized subject matter experts. This study builds on the current body of literature on source protection, based on the perceptions of a broader sample of source protection professionals.
The work of Merrett et al. [14] first examined CSFs for DWSP programs based on 20 process hazard controls (PHCs) for safety in DWSP programs. The criteria represent groups of common controls at a program level to address process hazards that have the potential to influence the success of DWSP programs. The PHCs were derived from a comprehensive process hazard analysis of the safety control structure for the management of typical surface water catchment used for the public drinking water supply. The initial hazard analysis process identified 222 countermeasures to control system level hazards based on common functions of drinking source protection. The 222 countermeasures were then grouped based on common functions and themes. The resulting 20 PHC groups were then validated by industry professionals and experts using a web-based questionnaire. The questionnaire results were then further subjected to principle components analysis (PCA) to create a simplified set of latent variables for representing the CSFs. The study established the following four CSFs: policy and government agency support of source protection (CSF1); catchment condition information and risk monitoring (CSF2); support of operational field activities (CSF3); and response to water quality threats (CSF4).
Policy and government agency support (CSF1) plays a major role in setting the fundamental safeguards for protecting drinking water quality in catchment areas [4]. Government mandated policy and regulations both explicitly specify and indirectly influence the acceptable land uses and activities that occur within drinking water catchment areas. Therefore, support from government policy and the agencies that implement them has a significant influence over the outcomes of DWSP programs. As catchment areas contain a mix of private and public land uses there are often a mix of natural resource management agencies involved in implementing regulations and policies, which can influence water quality outcomes. The role of government policy and regulation sets the scene for the controls over activities and land uses which impact on water quality outcomes. The policies in place for protection of drinking water sources are often at odds with the desires of major community groups. When investigating the public desire for expansion of recreation in West Australian drinking water catchments, Syme and Nancarrow [15] found that a significant portion of the community wanted to see a relaxation of policy so as to enable more recreational access in controlled catchments. Such relaxations in policy positions have the potential to result in a decline in catchment condition and on drinking water quality.
The process of policy review, development and implementation phases’ change can take years to complete. Policy development and revision is usually triggered in one of two ways. The first and most common way is through incremental change in response to various advocacy efforts from different stakeholders. The second trigger is the crisis arising from major events that are often disastrous, such as the severe contamination and associated widespread public illness experienced in Walkerton, Ontario, Canada in 2000 [16]. The outcomes of the Walkerton tragedy have influenced the policy and practice of the international water industry. Typically, a WSP has limited direct influence over the policies in place and the activities of agencies involved in policy implementation. Therefore, to influence policy outcomes a WSP must actively engage with the government on the development of policy and the agencies involved in policy implementation.
From an operational perspective, the actions of government agencies involved in natural resource management activities within drinking water catchments have a significant influence over water quality outcomes. Effective protection of drinking water sources requires agencies involved in policy development to understand the influences their respective roles have on overall drinking water quality outcomes and associated public health implications. For successful outcomes there needs to be a collaborative relationship between policy makers, WSPs and the natural resource management agencies operating in drinking water catchments.
Catchment condition information and risk monitoring (CSF2) captures the information the WSP uses to assess catchment risk levels and plan commensurate risk control activities. The risk assessment process is dependent upon having ready access to reliable data relating to both water quality and activities that pose risks to drinking water quality. The process of evaluating and understanding catchment risk is critical to the design and implementation of preventative measures for assuring water safety [17]. For drinking water sources, the widely accepted best practice approach consists of a combination of both water quality monitoring and surveillance [18]. Operational monitoring of water supplies plays a crucial role in providing information to guide the WSP’s management measures required to protect public health (e.g., source protection and treatment technologies). While the need for such monitoring is well understood, there is limited published literature on the effectiveness of such monitoring in practice [19], and the factors that influence the effectiveness of real-world practice. In the water industry, water quality sampling is a long-standing practice for informing risk management; however, sampling can be inherently problematic in providing accurate and timely information due to the lag between sampling, analysis and receiving the results. In the case of pathogens, consumers can potentially be exposed to harmful pathogens prior to completing any testing or receiving laboratory results. Therefore, frequent sampling of the final product water alone is not a reliable sole strategy for verifying the safety of the water supplied [18]. The observational information captured during catchment surveillance provides valuable information on potential threats to drinking water quality and the effectiveness of controls implemented [20]. Observational information can also be obtained from the various agencies and agents operating in a drinking water catchment area. The use of water quality results and observational information in combination provides a more detailed picture of catchment risk. Such an approach is recognized as good practice internationally and has been included in national drinking water guidelines such as the Australian Drinking Water Guidelines (ADWG) [21]. The ADWG provides a single framework for both water quality monitoring and observational monitoring, which covers planning of monitoring activities based on risk, setting targets and responding to targets violations.
Support of operational field activities (CSF3) is centered around the operators’ use of available catchment information for planning field operations that are required to monitor and protect the drinking water source. Risk factors within catchment areas by nature are typically spatially and temporally transient [3]. The complex nature of surface water catchments and the activities that occur within them makes monitoring catchment condition a very labor-intensive activity. Maximizing the outcomes for DWSP requires planning operational activities using the most up-to-date and accurate catchment information available. Another important aspect is the role of training for field staff. With the need to execute a diverse range of tasks on a daily basis and advances in source protection practices, continual training provides an important role in supporting the required field activities to protect drinking water quality.
Response to water quality threats (CSF4) relates to the response actions taken when threats to drinking water quality are identified. The actions cover the investigation, remediation and verification of the effectiveness of the response. For the protection of public health, a WSP must be able to effectively identify and respond to a range of threats to drinking water quality in the catchment area. Often enforcement of regulatory controls is used for the control of human access, land use, polluting activities etc., which need to be actively enforced to be successful. The effective enforcement of regulatory controls for the protection of drinking water sources is dependent upon multiple agencies working together for a common goal [3]. The other type of threat considered is emerging threats associated with the discovery of potential health impacts from certain compounds or pathogens of concern.
The Present Study
This study builds on the current body of literature on source protection in Taiwan and internationally, by investigating the underlying relationships between CSFs for DWSP programs based on the opinions of industry practitioners. The approach of using SEM for investigating underlying structures is frequently used for understanding latent structures and relationships that cannot be easily measured directly [10].
The CSFs proposed in Merrett et al. [14] provided a novel perspective on factors that influence DWSP outcomes for the safety of public drinking water sources. Following from the establishment of CSFs for DWSP programs, the objective of this study is to examine the underlying relationships between the four CSFs identified using SEM. Understanding the relationships between CSFs can provide greater awareness of the relationships between factors which influence the success in implementing DWSP programs. Establishing a detailed understanding of the underlying constructs between the four CSFs can help support organizations involved in drinking water source protection effectively plan catchment management activities.
2. Materials and Methods
2.1. Participants
This study uses the same survey dataset collected for the CSFs of DWSP programs study by Merrett et al. [14]. The initial collection of data was done using targeted surveys based on the 20 PHCs derived from system level countermeasures for the process hazards in managing DWSP programs. The respondents of the survey mostly included industry specialists and professionals in Taiwan with relevant experience in working with DWSP programs. To provide for international perspective, copies of the questionnaires were also sent to industry specialists and professionals in Australia and Greece. Obtaining the point of view from different countries provides a point of comparison with a cross-section of international industry practices. The structure of the questionnaire used a 5-point Likert-type scale for respondents to rank statements based on their personal perceptions, using a scale ranging from 1, for strongly disagree, to 5, for strongly agree, and 3 for neutral. The web-based questionnaire was distributed using an email link to selected professionals working in drinking water source protection. The questionnaire information and questions were provided in both traditional Mandarin and English. The translation was completed by a bilingual translator and further verified by a second bilingual translator familiar with the terminology of the industry. A total of 61 survey responses were received, which included 40 responses from Taiwan, 13 responses from Australia and eight responses from Greece. The limited number of responses received was attributed to the specific nature of the field and the limited number of available professionals.
The background of the respondents plays an import role in ensuring data is suitable for further analysis. The summarized background data for the 61 respondents is shown in Table 1. Some 56% of respondents had 5 years or more experience in drinking water source protection, with 28% reporting experience gained over 10 or more years. The “operations support” role type was the most represented role, accounting for 41% of all respondents, with the next most represented role being technical/scientific support, accounting for 30% of all responses. The remaining roles included strategy and planning as well as other roles, which accounted for the remaining 29% of responses. Also shown in Table 1, the most frequent organization type reported was government agency, accounting for 41% of all responses. With Taiwan being the most represented country, the large number of respondents from government agencies is likely due to the of role catchment protection management falling to government agencies. As expected, WSP was also a well-represented organization type, accounting for 31% of all responses. The remaining organizations include research/university, consulting and other, accounting for 9%, 4% and 4%, respectively. Given the diversity of backgrounds among the respondents, the survey was considered to provide a suitable representation of drinking water source protection practice within Taiwan, further supported by responses from Australia and Greece.
2.2. Meaures
Prior to commencing analysis of the questionnaire responses using CFA and SEM, the reliability of the responses was assessed. For all the responses received combined, the Cronbach’s α is 0.92, which indicates an acceptable result [22,23]. The diversity of the respondent’s backgrounds in experience, countries, organizations and roles presents an opportunity for the responses to differ and influence the results of further analysis. An assessment of the potential differences in responses to the 20 PHC factors due to the respondents’ background was completed using ANOVA (Table 2). For all the responses to be used in combination there should be a limited significant difference based on the background characteristics of the questionnaire responses. The ANOVA results showed at the p ≤ 0.05 significance level that there are five significant results found for respondents’ background characteristics of country, role type and years of experience in source protection. At the p ≤ 0.01 significance level, there is a significant result for PHC item eight, based on the respondents’ role types. Some difference in responses is not unexpected, given the diverse backgrounds, and in this study the results were considered acceptable for further analysis.
As shown in Table 3, the mean scores of the survey responses for each PHC factor range from 3.34 to 4.54’ the higher values indicate that respondents agree the factor is important in contributing to successful outcomes in DWSP programs. In this case the consistently high mean scores indicate that based on the opinions of the 61 responses from source protection specialists and experts, the 20 PHC factors are strongly related to successful outcomes in DWSP programs.
The final CSFs in the study by Merrett et al. [14] were established by using PCA to analyze the responses provided to the questionnaires. PCA is a useful technique for building a more easily understood construct for management frameworks [24]. The PCA methodology supports the identification of groups of related variables through a process of reducing a multitude of variables into a smaller set of relatively independent variables [25]. In the initial PCA results, PHC factor 18 “Water quality data is essential in planning field operations to reduce risk to drinking water quality” was removed after not making the cutoff factor loading of 0.55. The resulting CSFs and the associated PHC factors are shown in Table 4.
2.3. SEM Framework for Drinking Water Source Protection
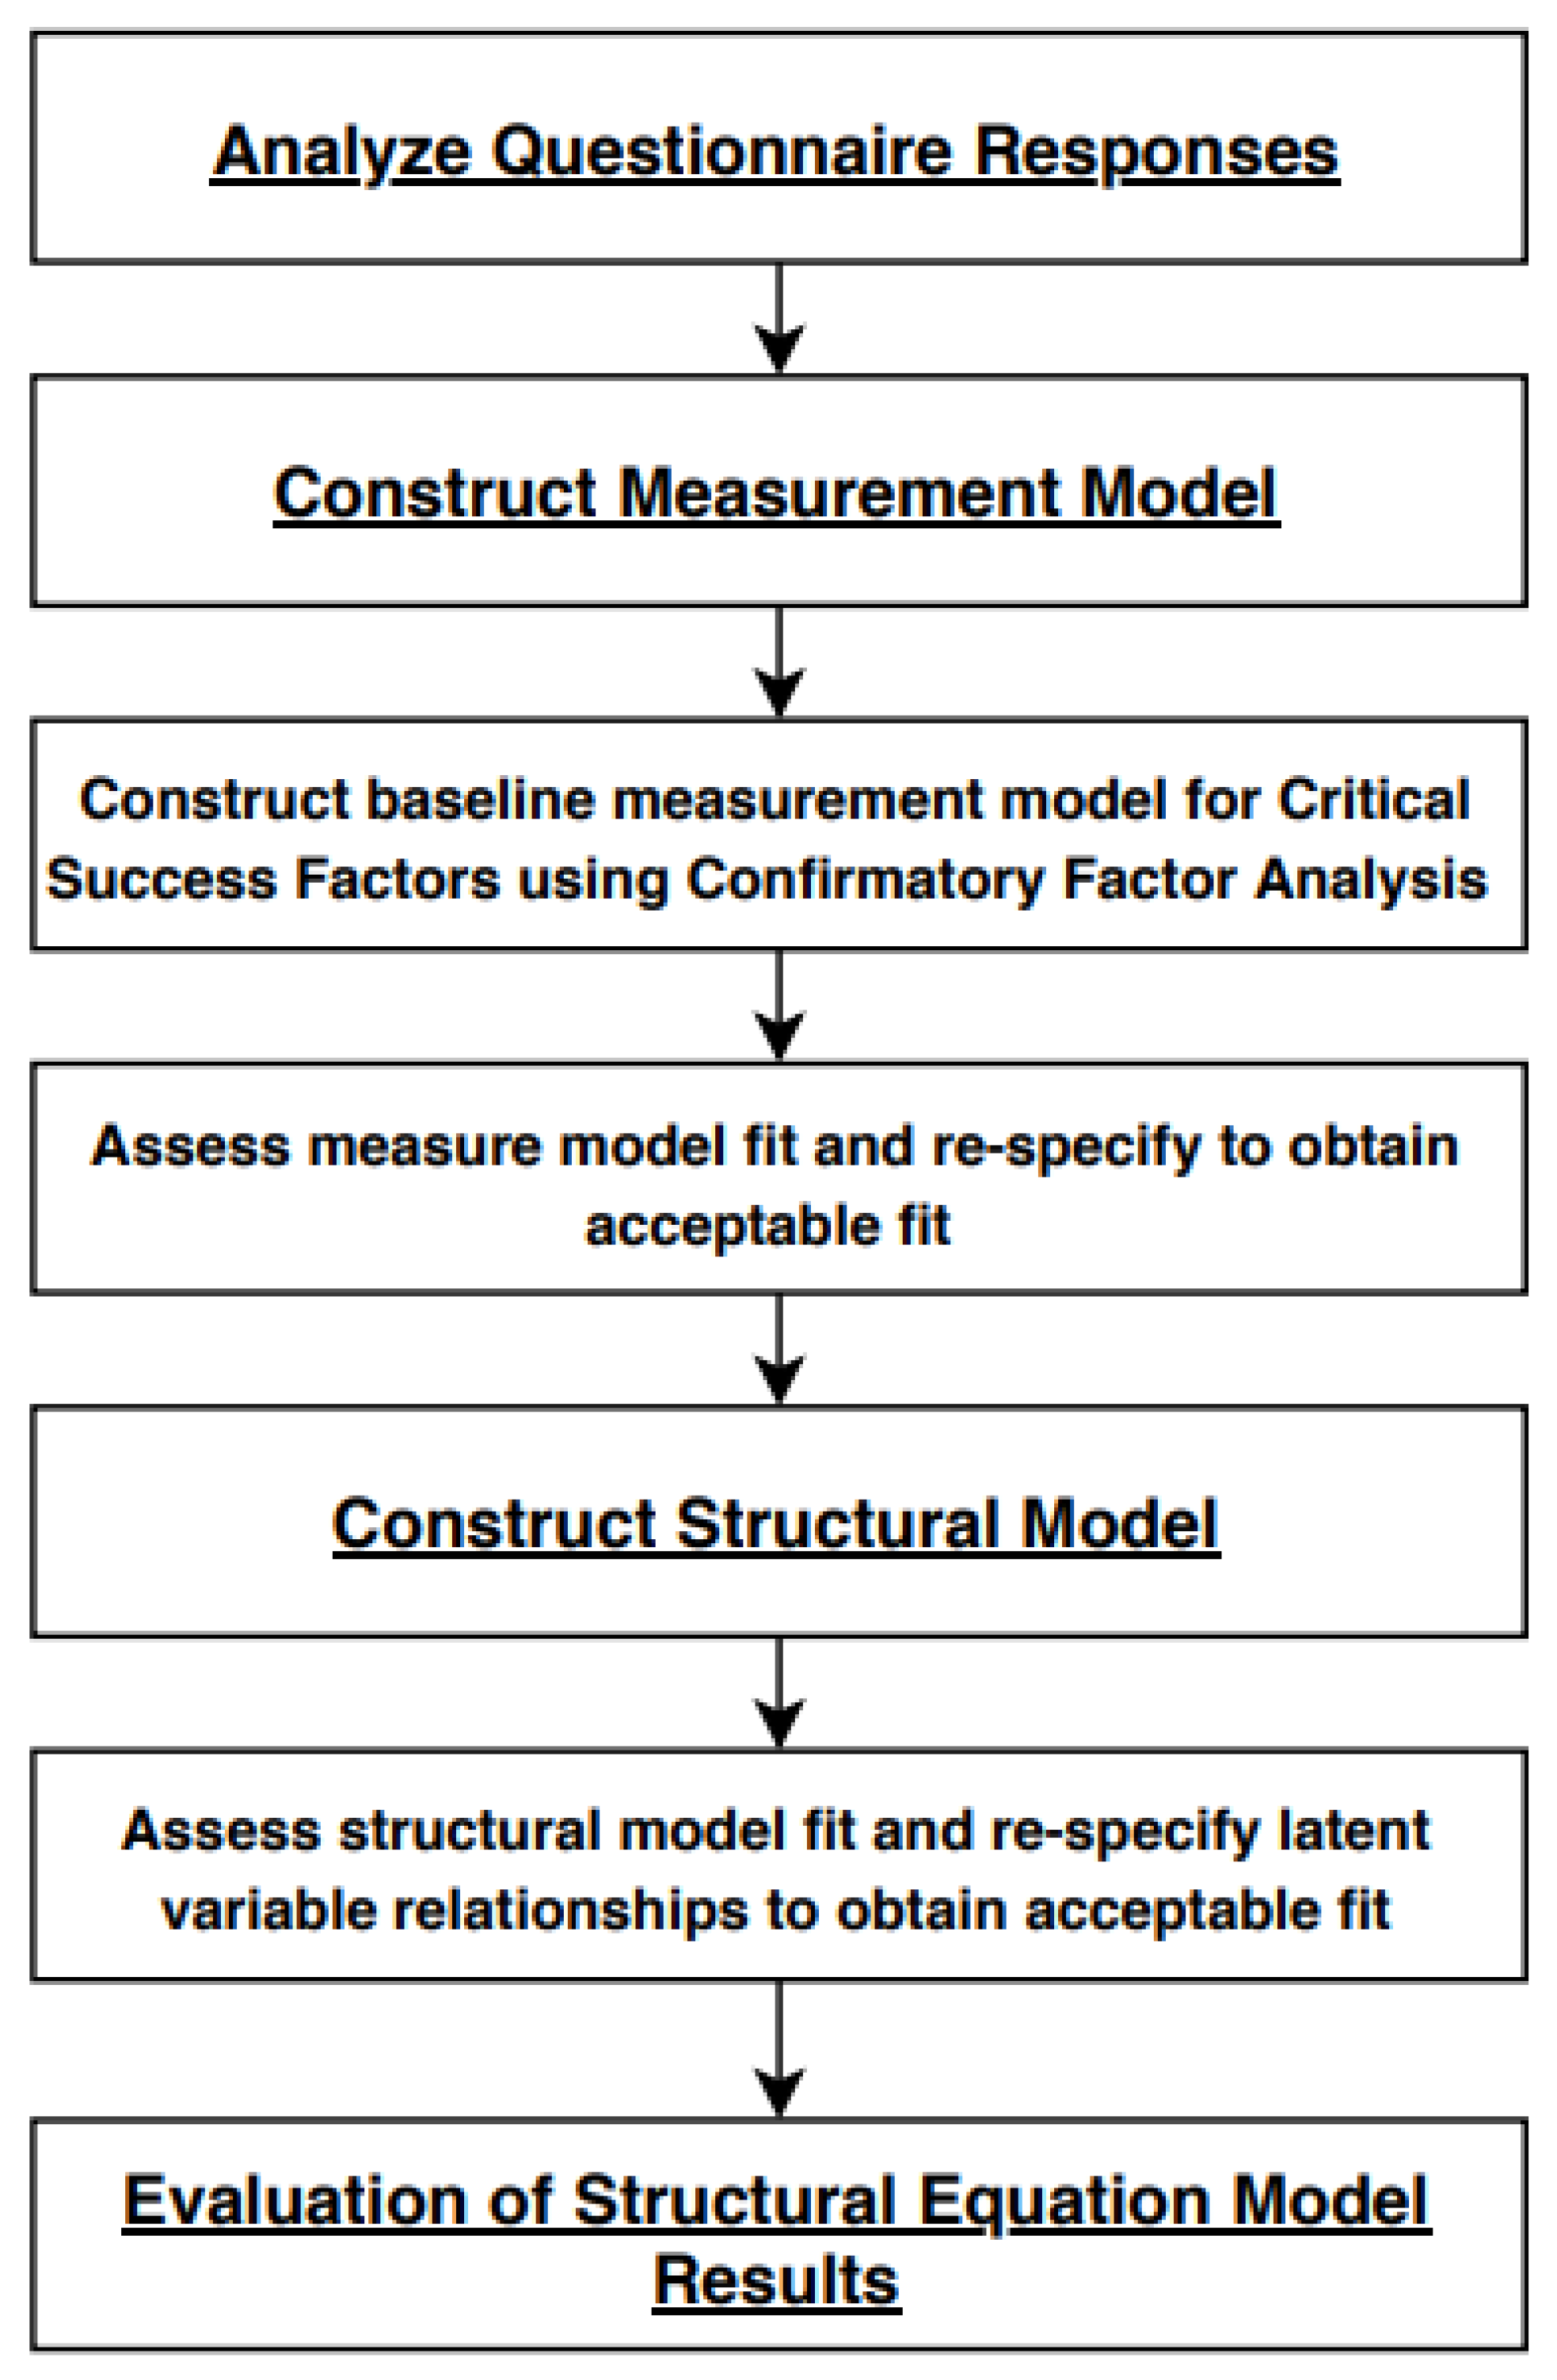
The approach to SEM in this study uses a two-step method, which involves the combination of two related methodologies: a measurement model followed by a proposed structural model. The purpose of the measurement model is to examine the validity of the factorial structure. The following structural model serves to model relationships amongst the latent variables by examining explained and unexplained variance [26]. The SEM process is analogous to creating a system of simultaneous linear regression models to confirm the relationships between the model variables [27,28]. In this study, in order to test the proposed hypothetical model, two statistical analyses were performed. The first is a measurement model constructed using confirmatory factor analysis (CFA), followed by a structural model. Typically, CFA is used to test if the specified construct influences responses as expected [29]. This step was required as the proposed CSFs were established using PCA rather than factor analysis. For this study, CFA was conducted to confirm the data structure for the four CSFs and finalize the criteria prior to undertaking an SEM of the hypothetical structural model. The following structural model is interested in both the variable loadings and the path analysis of the selected framework. The workflow of the analysis process for this study is shown in Figure 1. All statistical analysis was completed using the IBM AMOS (version 18) software package.
2.4. Measurement and Structural Model Development
The CFA process is a statistical method used to test the reduction of multiple observed variables into a smaller number of latent variables through investigating the covariance between the observed variables [30]. The CFA structure is set a priori, based on hypotheses made about the relationship between the factors [31]. As this study follows from the work presented in Merrett et al. [14], the structure for the CFA followed the structure of the four proposed CSFs based on PCA. Therefore, the latent variables used are the four CSFs “Policy and government agency support of source protection”, “Catchment risk monitoring and information”, “Support of operational field activities” and “Response to water quality threats”. The corresponding observed endogenous variables are the 19 PHCs identified from a process hazard analysis of DWSP.
Once a reliable measurement model was established, the next step was to create a structural model. In SEM, a structural model is a valuable tool for the development of theories and construct validation [28]. The SEM process involves examining the ability of the four latent variables to fit the data sample. The statistical techniques used in SEM enables an assessment of both the direct and indirect effects of the individual variables on the other variables in the model [32].
3. Results
3.1. Measurement Model
For any SEM to be considered meaningful, a reliable measurement model needs to be established. In this study, CFA was used to assess the reliability of the measurement model. For the CFA the latent variables selected are the four CSFs proposed by Merrett et al. [14], being: CSF1: Policy and government agency support of source protection; CSF2: Catchment condition information and risk monitoring; CSF3: Support of operational field activities; and CSF4: Response to water quality threats. The reliability of the CFA and SEM is based on a selection of relevant goodness of fit (GOF) indices. The GOF indices recommended by Jackson et al. [31] for this type of application include the root mean square error of approximation (RMSEA), the ratio of Chi squared and degrees of freedom (χ2/df ratio) with the p-value, comparative fit index (CFI) and incremental fit index (IFI). Another consideration is the sample size required for a reliable result. Many authors have suggested various recommend sample sizes, however there is no agreement on a rule of thumb for an adequate sample size due to a multiplicity of factors which influence model reliability. With the modest sample size of 61 respondents, the RMSEA value is useful in assessing the validity of the model and maintaining low type I error rates, as the RMSEA test is largely unaffected by the sample size [33]. For RMSEA a value of >0.1 indicates the model is a poor fit [25] and ideally should be <0.6–0.8 [30]. The recommend value for the ratio of Chi squared and degrees of freedom (χ2/df ratio) is <2. The value for the CFI and IFI should be above 0.90 [34] and ideally be equal to or above 0.95 [30].
As shown in Table 5, the CFA GOF results for the model based on the four CSFs and the associated factors showed the model did not provide a very good fit when first assessed based on the original data structure. All indices apart from the Chi squared and degrees of freedom (χ2/df) ratio failed to meet the minimum requirements for a reliable model. To achieve an acceptable model fit, the model had to re-specified. Re-specification is frequently required to ensure a reliable model; however, the process must be based on both statistical and model logic considerations [28]. The re-specification of the model in the CFA was based on removing the paths with lower factor loadings and a consideration of the overall model logic. To maintain the validity of the model, the miminum requirement of two indicators per factor [34] was maintained so as to ensure construct validity. Two of the factors removed include “Regular surveillance of human activities in catchment areas is essential to manage risk to drinking water quality” and “Real time information on catchment activities is required for effective control of risk to drinking water quality” from CSF2: “Catchment risk monitoring and information”.“Continuous training of field staff is critical to effective catchment operations for the protection of drinking water” from CSF3: “Support of operational field activities” was also removed as part of the re-specification of the final model.
The information for the CFA standardized factor loadings and squared multiple correlation (R2) for the final measurement model is provided in Table 6. The path coefficients in this case are all significant at p ≤ 0.05 and are positive values supporting their contribution to the overall construct. The convergent validity of the model was supported by the squared multiple regression (R2) values in the model. In the final measurement model, except for three paths, the R2 values are all above 0.5 with many at 0.7 or above. The covariance values shown in Table 7 show that the relationships between the four latent variables are all significant at p ≤ 0.05, with positive relationships shown between all factors. The final measurement model was found to be of sufficient reliability to continue with constructing a structural model.
3.2. Structural Model
Following the establishment of a reliable measurement model by means of CFA, the next step was to test the construct of the relationship between the variables in delivering drinking water source protection outcomes. To test the model structure, the starting point involved developing a model represented with bidirectional arrows among the four latent factors (CSF1: Policy and government agency support of source protection, CSF2: Catchment condition information and risk monitoring, CSF3: Support of operational field activities and CSF4: Response to water quality threats). This reflects the potential for each of the latent variables to correlate with each other. Iteratively, in each run the arrows showing links with low correlation values were re-adjusted or removed from the model. In interpreting the results, the model with the best fit should demonstrate the directional influences of the underlying structure [35]. Several model runs were made until a good fit was found that also logically fit the conceptual model.
The structural model was developed based on a series of logical assumptions made about the actions and responsibilities of the relevant government authorities, natural resource management agencies and water service providers involved in managing drinking water catchments. The structure proposed and tested focuses on the policy role of government and the environmental protection roles of natural resource management agencies in establishing the foundations for the framework for monitoring risk and provision of risk information between government agencies and the WSP, through setting policy and supporting drinking water quality objectives from catchment management activities. Following from the role of the government are the WSP’s functions of monitoring risk factors, reviewing risk related data and planning appropriate responses to protect drinking water quality. Also included in the development of the structural model are the relationships related to the function of supporting operational field activities in relation to the response to water quality threats. The next factor in the process is the execution and support of operational activities to collect catchment data so as to measure the levels of risk in the catchment area. The final step in the conceptual model is the relationship between response actions taken when threats to drinking water are identified.
The selected best fit structural model with path coefficients and multiple regression values is shown in Figure 2. The key elements of understanding a SEM are the directional arrows, which denote the direction of the assumed relationship. In the fitted structural model, the path coefficients were all significant at the p < 0.05 level. The associated GOF indices of the final measurement model are all within the critical limits for GOF, indicating the acceptability of the final model fit (Table 8). In the construction of the structural model, the correlation between the policy and three previous latent factors is representative of how information is collected, processed and acted on in source protection programs.
When establishing the relationship between CSF1: Policy and government agency support of source protection and the other CSFs, several different structures were tested based on a series of logical assumptions. Initially it was proposed that CSF1: Policy and government agency support of source protection would directly correlate with CSF4: Response to water quality threats due to the relationship with catchment outcomes. That is, planned operational activities are influenced by what is permissible within the drinking water catchment, which relates back to the regulatory and policy arrangements of public drinking water source catchments. However, the direct correlation of CSF1: Policy and government agency support of source protection with CSF4: Response to water quality threats was not found to be significant at the 0.05 probability level. Instead, the model shows that that CSF1: Policy and government agency support of source protection is correlated with CSF2: Catchment condition information and risk monitoring. This relationship illustrates the important role that policy and the actions of natural resource management agencies have for understanding the drinking water quality risks in catchment areas and the provision of information to WSP. Interestingly, the relationship between CSF1: Policy and government support and CSF2: Catchment condition information and risk monitoring had the lowest path coefficient value (0.31) of the structural model, as well as the lowest R2 value (0.26). This may be due in part to the challenge of directly matching the policy and the actions of government agencies with the practices of WSP and drinking water catchments managers. There appears to be the potential for a number of factors not included in the model, which influences the relationships between government agencies and the WSPs in managing drinking water catchments.
For WSPs to respond to water quality threats effectively, it is fundamental to effectively source protection. The structural model shows that CSF2: Catchment condition information and risk monitoring has a significant relationship with both CSF3: Support of operational field activities and CSF4: Response to water quality threats (with path coefficients of 0.65 and 0.35, respectively). This relationship illustrates the risk-based approach to the management of drinking water risk, as well as the importance of supporting field-based operations for responding to water quality threats. The model also tested the influence of CSF3: Support of operational field activities on CSF4: Response to water quality threats. The theory was that the WSP support of field activities would influence the response to water quality threats. The structural model shows the path coefficient as 0.39 with an R2 value of 0.44. The results show that while there is a significant correlation between CSF2: Catchment condition information and risk monitoring and CSF4: Response to water quality threats, there is a mediation effect from CSF3: Support of operational field activities.
4. Conclusions
The practice of drinking water source protection involves a complex mix of factors for successful outcomes. With such a mix of factors involved in successful outcomes, agencies involved in the supply must be able to identify which factors are key and how they relate to each other. This study confirmed the underlying relationships between four proposed DWSP program CSFs (CSF1: Policy and government agency support of source protection, CSF2: Catchment condition information and risk monitoring, CSF3: Support of operational field activities and CSF4: Response to water quality threats). To better understand the underlying relationships between the four CSFs, CFA was used to develop a reliable measurement model followed by a structural model. This approach allowed the establishment of a meaningful SEM through the testing of all assumptions simultaneously based on theory. The resulting SEM framework provides information on the underlying structures that support successful outcomes in drinking water source protection, based on the perceptions of a limited sample of professionals in Taiwan, Australia and Greece. Such insight has not been offered in previous studies on the topic of drinking water source protection. Moreover, the results also show the structure of the relationships between individual CSFs.
The results of the final structural model show that the relationships between the three CSFs for functions which are typically under the control of the WSP (CSF2: Catchment condition information and risk monitoring, CSF3: Support of operational field activities and CSF4: Response to water quality threats) are positively correlated. The SEM results indicate that CSF2: Catchment condition information and risk monitoring is the leading CSF in relationship with CSF3: Support of operational field activities and CSF 4: Response to water quality threats. Leading the model, CSF2: Catchment condition information and risk monitoring has a positive relationship with the operational and risk response functions in catchment management. The results of the measurement model support the widely endorsed industry approach of risk-based management of drinking water catchments. In the common industry approach to risk-based management, government policy and natural resource management practices set the baseline protection framework, and the WSP is focused on collecting information on catchment condition and assessing risk, which triggers the need for intervention when the risk is too high. Furthermore, the structural model supports using risk information from a variety of sources, specifically natural resource management agencies.
The final SEM shows that the relationship of CSF1: Policy and government agency support of source protection with the other CSFs was not as strong as was originally hypothesized. Given the importance of the government’s role for setting the base requirements for catchment protection and the role of natural resource management agencies in controlling potentially polluting activities, the influence was expected to be more pronounced in the structural model. Such a relationship suggests a disconnect between the efforts of policy and regulation with operational management of drinking water sources. Further research on the relationship between government policy, the functions of natural resource management agencies and WSPs for the protection of drinking water sources could guide initiatives to further strengthen DWSP outcomes.
While this study provides a novel approach to investigating the relationships between CSFs for DWSP programs, there are key limitations that need to be considered in future research. The limited sample sizes of questionnaire respondents from each country limit the generalizability of the findings presented. Furthermore, a possible bias in the final results exists as most data was collected from Taiwan, with limited representation from Australia and Greece. Further research needs to consider the role each country has in the magnitude of responses. Nonetheless, this study highlights the value of SEM in investigating conceptual models for DWSP programs.
Author Contributions
Conceptualization, H.C.M., W.T.C. and J.J.H.; methodology, H.C.M., W.T.C. and J.J.H.; software, H.C.M.; formal analysis, H.C.M.; resources, W.T.C. and J.J.H.; writing—original draft preparation, H.C.M.; writing—review and editing, H.C.M. and W.T.C. All authors have read and agreed to the published version of the manuscript.
Funding
This research received no external funding.
Acknowledgments
The authors would like to thank the drinking water source protection professionals who contributed their valuable opinions to the questionnaires. Furthermore, the authors wish to thank the reviewers for their insightful comments and feedback, which greatly improved the quality of this paper.
Conflicts of Interest
The authors declare no conflict of interest.
References
- Bartram, J.; Corrales, L.; Davison, A.; Deere, D.; Drury, D.; Gordon, B.; Howard, G.; Rinehold, A.; Stevens, M. Water Safety Plan Manual: Step-by-step Risk Management for Drinking-water Suppliers; World Health Organisation: Geneva, Switzerland, 2009; pp. 1–5. ISBN 978-924-1-56263-8. [Google Scholar]
- Hrudey, S.E.; Hrudey, E.J.; Pollard, S.J.T. Risk management for assuring safe drinking water. Environ. Int. 2006, 32, 948–957. [Google Scholar] [CrossRef] [PubMed] [Green Version]
- Rickert, B.; Chorus, I.; Schmoll, O. Protecting Surface Water for Health. Identifying, Assessing and Managing Drinking-water Quality Risks in Surface-water Catchments; World Health Organisation: Geneva, Switzerland, 2016; ISBN 978-92-4-151055-4. [Google Scholar]
- Davies, J.M.; Mazumder, A. Health and environmental policy issues in Canada: The role of watershed management in sustaining clean drinking water quality at surface sources. J. Environ. Manag. 2003, 68, 273–286. [Google Scholar] [CrossRef]
- Boyton, A.C.; Zmund, R.W. An assessment of critical success factors. Sloan Manag. Rev. 1984, 25, 17–27. [Google Scholar]
- Yalegama, S.; Chileshe, N.; Ma, T. Critical success factors for community-driven developmentprojects: A Sri Lankan community perspective. Int. J. Proj. Manag. 2016, 34, 643–659. [Google Scholar] [CrossRef]
- Volery, T.; Lord, D. Critical success factors in online education. Int. J. Educ. Manag. 2000, 14, 216–223. [Google Scholar] [CrossRef] [Green Version]
- Hair, J.F.; Black, B.; Babin, B.; Anderson, R.E.; Tatham, R.L. Multivariate Data Analysis, 6th ed.; Macmillan: New York, NY, USA, 2006; p. 928. [Google Scholar]
- Chinda, T.; Mohamed, S. Structural equation model of construction safety culture. Eng. Constr. Archit. Manag. 2008, 15, 114–131. [Google Scholar] [CrossRef]
- Chen, W.T.; Lu, C.S.; Liu, S.S.; Wang, M.S. Measuring the perception of safety among Taiwan construction managers. J. Civ. Eng. Manag. 2013, 19, 37–48. [Google Scholar] [CrossRef] [Green Version]
- Postel, S.L.; Thompson, B.H. Watershed protection: Capturing the benefits of nature’s water supply services. Nat. Resour. Forum 2005, 98, 98–105. [Google Scholar] [CrossRef]
- Falkenmark, M.; Gottschalk, L.; Lundqvist, J.; Wouters, P. Towards integrated catchment management: Increasing the dialouge between scientists, policy-makers and stakeholders. Water Resour. Dev. 2004, 20, 297–309. [Google Scholar] [CrossRef]
- Chang, E.E.; Chiang, P.C.; Chao, S.H.; Chuang, C.L. Development and implementation of source water quality standards in Taiwan, ROC. Chemosphere 1999, 39, 1317–1332. [Google Scholar] [CrossRef]
- Merrett, H.C.; Chen, W.T.; Horng, J.J. A Systems Analysis Approach to Identifying Critical Success Factors in Drinking Water Source Protection Programs. Sustainability 2019, 11, 2606. [Google Scholar] [CrossRef] [Green Version]
- Syme, G.J.; Nancarrow, B.E. Incorporating community and mulitple perspectives in the development of acceptable drinking water source protection policy in catchments facing demands. J. Environ. Manag. 2013, 129, 112–123. [Google Scholar] [CrossRef] [PubMed]
- O’Connor, D.R. Report on the Walkerton Inquiry: The Events of May 2000 and Related Issues. Available online: http://www.archives.gov.on.ca/en/e_records/walkerton/index.html (accessed on 13 February 2020).
- Pollard, S.J.T.; Strutt, J.E.; Macgillivray, B.H.; Hamilton, P.D.; Hrudey, S.E. Risk analysis and management in water utility sector: A review of drivers, tools and techniques. Process. Saf. Environ. Prot. 2004, 82, 453–462. [Google Scholar] [CrossRef] [Green Version]
- World Health Organisation. Guidelines for Drinking Water Quality: Fourth Edition Incorporating the First Addendum; World Health Organisation: Geneva, Switzerland, 2017; ISBN 978-92-4-154995-0. [Google Scholar]
- Crocker, J.; Bartram, J. Comparison and cost analysis of drinking water quality monitoring requirements versus practice in seven developing countries. Int. J. Environ. Res. Public Health 2014, 11, 7333–7346. [Google Scholar] [CrossRef] [PubMed]
- Lance, C.; Schulte, J. “Surveillance”. In Watershed management for drinking water protection, America and Australia; Davis, C., Ed.; AWWA and AWA: Washington, DC, USA, 2008. [Google Scholar]
- NHMRC, NRMMC. Australian Drinking Water Guidelines Paper 6 National Water Quality Management Strategy; National Health and Medical Research Council, National Resource Management Ministerial Council, Commonwealth of Australia: Canberra, Australia, 2011; ISBN 186-496-5118. [Google Scholar]
- Hinton, P.R.; McMurray, I.; Brownlow, C. SPSS Explained; Routledge: New York, NY, USA, 2004; ISBN 978-1-315-79729-8. [Google Scholar]
- Nunnally, J.C. Psychometric Theory; McGraw Hill: New York, NY, USA, 1978; ISBN-10 0070474656; ISBN-13 9780070474659. [Google Scholar]
- Li, Y.; Ning, Y.; Chen, W.T. Critical Success Factors for Safety Management of High-Rise Building Construction Projects in China. Adv. Civ. Eng. 2018. [Google Scholar] [CrossRef]
- Tabachnick, B.G.; Fidell, L.S. Using Multivariate Statistics; Pearson: New York, NY, USA, 2013; ISBN-10: 0-205-89081-4. [Google Scholar]
- Byrne, B.M. Structural Equation Modeling with EQS and EQS/Windows: Basic Concepts, Applications and Programming; Sage: Thousand Oaks, CA, USA, 1994. [Google Scholar]
- Wong, P.S.; Cheung, S.O. Structural equation model of trust and partnering success. J. Manag. Eng. 2005, 21, 70–80. [Google Scholar] [CrossRef]
- Anderson, J.C.; Gerbing, D.W. Structural Equation Modeling in practice: A review and recommended two step approach. Psychol. Bull. 1988, 103, 411–423. [Google Scholar] [CrossRef]
- DeCoster, J. Overview of Factor Analysis. 1998. Available online: http://www.stat-help.com/factor.pdf (accessed on 5 January 2020).
- Schreiber, J.B.; Nora, A.; Stage, F.K.; Barlow, E.A.; King, J. Reporting Structural Equation Modeling and Confirmatory Factor Analysis Results: A Review. J. Educ. Res. 2006, 99, 323–327. [Google Scholar] [CrossRef]
- Jackson, D.L.; Gillaspy Jr, J.A.; Purc-Stephenson, R. Reporting practices in confirmatory factor analysis: An overview and some recommendations. Psychol. Methods 2009, 14, 6–23. [Google Scholar] [CrossRef]
- Maruyama, G.M. Basics of Structural Equation Modelling; Sage: Thousand Oaks, CA, USA, 1997. [Google Scholar]
- Wolf, E.J.; Harrington, K.M.; Clark, S.L.; Miller, M.W. Sample size requirements for structural equation models: An evaluation of power, bias and solution propriety. Educ. Psychol. Meas. 2013, 76, 913–934. [Google Scholar] [CrossRef] [PubMed]
- Kline, R.B. Principle and practice of Structural Equation Modeling; The Guildford Press: New York, NJ, USA, 2011. [Google Scholar]
- Clissold, G. Understanding Safety Performance Using Safety Climate and Psychological Climate; Department of Management, Monash University: Melbourne, Australia, 2004; ISSN 1327-5216. [Google Scholar]
Figure 1.
Overview of core elements of the structural equation modeling (SEM) workflow used.

Figure 2.
Fitted structural model for success in drinking water source protection programs with standardized regression weights and the R2 for latent variables shown in underlined italics.
Figure 2.
Fitted structural model for success in drinking water source protection programs with standardized regression weights and the R2 for latent variables shown in underlined italics.


Table 1.
Summary of respondents’ background information, including: years of experience in catchment management and source protection; respondents’ reported role type in their respective organizations; and organizational affiliation reported by respondents.
Table 1.
Summary of respondents’ background information, including: years of experience in catchment management and source protection; respondents’ reported role type in their respective organizations; and organizational affiliation reported by respondents.
| Characteristic Items | Number of Responses | Percent of All Responses | |
|---|---|---|---|
| Reported Years of Relevant Experience | <5 | 27 | 44% |
| 5–10 | 17 | 28% | |
| 10–20 | 14 | 23% | |
| >20 | 3 | 5% | |
| Total | 61 | 100% | |
| Reported Role Type | Operations support | 25 | 41% |
| Strategy and policy | 10 | 16% | |
| Technical/Scientific support | 18 | 30% | |
| Water quality planning | 3 | 5% | |
| Other | 5 | 8% | |
| Total | 61 | 100% | |
| Reported Organization Type | Government Agency | 25 | 41% |
| Water Service Provider | 19 | 31% | |
| Research/University | 9 | 14% | |
| Consulting | 4 | 7% | |
| Other | 4 | 7% | |
| Total | 61 | 100% |
Table 2.
ANOVA results for comparison of all groups.
| PHC | Country (df = 2) | Role (df = 4) | Experience (df = 3) | Organization (df = 4) | ||||
|---|---|---|---|---|---|---|---|---|
| F-Test | Sig. | F-Test | Sig. | F-Test | Sig. | F-Test | Sig. | |
| 1 | 2.898 | 0.063 | 1.458 | 0.210 | 2.618 | 0.060 | 0.767 | 0.551 |
| 2 | 1.004 | 0.373 | 1.289 | 0.278 | 1.629 | 0.193 | 2.948 | 0.028 |
| 3 | 0.940 | 0.397 | 1.156 | 0.343 | 1.456 | 0.236 | 1.195 | 0.323 |
| 4 | 1.590 | 0.213 | 2.140 | 0.063 | 1.226 | 0.309 | 3.287 | 0.017 * |
| 5 | 0.702 | 0.500 | 2.573 | 0.029 | 1.071 | 0.369 | 1.514 | 0.211 |
| 6 | 2.174 | 0.123 | 1.559 | 0.177 | 2.047 | 0.118 | 3.047 | 0.024 |
| 7 | 0.328 | 0.722 | 1.518 | 0.190 | 4.145 | 0.011 * | 3.647 | 0.011 * |
| 8 | 1.934 | 0.154 | 3.521 | 0.005 ** | 1.513 | 0.221 | 2.143 | 0.087 |
| 9 | 3.565 | 0.035 * | 2.006 | 0.081 | 2.099 | 0.110 | 2.301 | 0.070 |
| 10 | 0.443 | 0.645 | 0.321 | 0.923 | 0.195 | 0.899 | 1.561 | 0.197 |
| 11 | 1.721 | 0.188 | 0.714 | 0.640 | 0.868 | 0.463 | 2.003 | 0.106 |
| 12 | 0.394 | 0.676 | 0.831 | 0.552 | 1.024 | 0.389 | 0.528 | 0.715 |
| 13 | 0.437 | 0.648 | 1.678 | 0.144 | 0.443 | 0.723 | 0.486 | 0.746 |
| 14 | 2.326 | 0.107 | 0.473 | 0.825 | 0.912 | 0.441 | 0.639 | 0.637 |
| 15 | 1.455 | 0.242 | 0.686 | 0.661 | 1.576 | 0.205 | 2.246 | 0.076 |
| 16 | 0.453 | 0.638 | 0.160 | 0.986 | 0.247 | 0.863 | 1.265 | 0.295 |
| 17 | 4.723 | 0.013 * | 1.453 | 0.212 | 1.511 | 0.222 | 0.771 | 0.549 |
| 18 | 1.445 | 0.244 | 1.064 | 0.396 | 0.776 | 0.512 | 0.623 | 0.648 |
| 19 | 3.891 | 0.026 | 2.592 | 0.028 | 1.222 | 0.310 | 0.845 | 0.503 |
| 20 | 2.736 | 0.073 | 0.931 | 0.480 | 0.497 | 0.686 | 2.648 | 0.043 |
* significant at the p ≤ 0.050 level ** significant at the p ≤ 0.010 level; df = degrees of freedom within the group; PHC = process hazard control.
Table 3.
The mean value for responses to the 20 PHC factors and corresponding rank.
| Process Hazard Control Factor | Mean Score | Standard Deviation | Rank |
|---|---|---|---|
| 3.61 | 0.96 | 14 |
| 3.61 | 1.04 | 13 |
| 3.34 | 1.03 | 19 |
| 3.69 | 0.94 | 12 |
| 3.54 | 0.87 | 15 |
| 3.34 | 0.96 | 19 |
| 3.39 | 1.01 | 18 |
| 3.41 | 1.04 | 17 |
| 3.48 | 1.15 | 16 |
| 4.54 | 0.76 | 1 |
| 4.48 | 0.85 | 2 |
| 4.46 | 0.76 | 3 |
| 3.77 | 0.88 | 11 |
| 4.41 | 0.69 | 4 |
| 4.23 | 0.88 | 6 |
| 4.02 | 0.85 | 10 |
| 4.20 | 0.83 | 7 |
| 4.18 | 0.72 | 8 |
| 4.07 | 0.96 | 9 |
| 4.28 | 0.73 | 5 |
Table 4.
Critical success factors (CSFs) and associated process hazard control (PHC) factors representing the base model for success in drinking water source protection programs.
Table 4.
Critical success factors (CSFs) and associated process hazard control (PHC) factors representing the base model for success in drinking water source protection programs.
| Critical Success Factor (CSF) | Process Hazard Control (PHC) Factor |
|---|---|
| CSF 1: Policy and Government Agency Support of Source Protection | 6: Natural Resource Management agencies support the protection of drinking water catchments |
| 2: Government agencies actively implement policy for the protection of drinking water quality catchments | |
| 5: Natural Resource Management agencies have a good understanding of drinking water catchment management principles | |
| 7: Natural Resource Management agencies use their authority to manage activities within in drinking water catchments | |
| 3: Government provides timely policy responses to emerging threats to drinking water catchments | |
| 1: Current government policies provide robust protection of drinking water catchments | |
| 9: Natural Resource Management agencies see drinking water management agencies as key stakeholders | |
| 4: Government engaging with relevant stakeholders when developing or reviewing policy for the protection of drinking water catchments | |
| 8: Natural Resource Management agencies effectiveness in managing risk of natural disasters (i.e., Fire, flood, erosion/landslides) | |
| CSF 2: Catchment Condition Information and Risk monitoring | 10: Effective catchment management planning requires current land use information |
| 11: Observational information on catchment condition is critical to the catchment management planning process | |
| 12: Effective catchment management planning requires water quality monitoring data | |
| 14: Regular surveillance of human activities in catchment areas is essential to manage risk to drinking water quality | |
| 15: Real time information on catchment activities is required for effective control of risk to drinking water quality | |
| CSF 3: Support of Operational Field Activities | 19: Engagement with private landholders is essential in reducing risk in drinking water catchments. |
| 20: Continuous training of field staff is critical to effective catchment operations for the protection of drinking water | |
| 17: Data collected through inspections/surveillance is valuable in planning operations to reduce risk to drinking water quality | |
| CSF 4: Response to Water Quality Threats | 13: Best practice catchment management planning practices can identify and manage emerging threats to drinking water quality |
| 16: Enforcement of legal controls over activities in drinking water catchments are effective in reducing drinking water quality risk |
Table 5.
Goodness of fit (GOF) indices for the baseline and fitted CFA measurement model.
| Model Fit Indices | Minimum Acceptable Limit | Baseline Model | Final Measurement Model |
|---|---|---|---|
| χ2/df | <2 | 1.72 | 1.31 (p = 0.021) |
| RMSEA | <0.10 | 0.11 | 0.07 |
| CFI | ≥0.95 | 0.85 | 0.95 |
| IFI | ≥0.95 | 0.86 | 0.95 |
Table 6.
Regression paths, standardized coefficients and squared multiple correlations for the best fit model.
Table 6.
Regression paths, standardized coefficients and squared multiple correlations for the best fit model.
| Regression Path | Standardized Coefficient | Squared Multiple Correlation |
|---|---|---|
| CSF1: Policy and Government Agency Support of Source Protection | ||
| 6: Natural Resource Management agencies support the protection of drinking water catchments | 0.86 | 0.74 |
| 2: Government agencies actively implement policy for the protection of drinking water quality catchments | 0.78 | 0.60 |
| 5: Natural Resource Management agencies have a good understanding of drinking water catchment management principles. | 0.70 | 0.49 |
| 7: Natural Resource Management agencies use their authority to manage activities within in drinking water catchments | 0.76 | 0.57 |
| 3: Government provides timely policy responses to emerging threats to drinking water catchments. | 0.72 | 0.52 |
| 1: Current government policies provide robust protection of drinking water catchments | 0.75 | 0.56 |
| 9: Natural Resource Management agencies see drinking water management agencies as key stakeholders | 0.77 | 0.60 |
| 4: Government engaging with relevant stakeholders when developing or reviewing policy for the protection of drinking water catchments | 0.67 | 0.45 |
| 8: Natural Resource Management agencies effectiveness in managing risk of natural disasters (i.e., Fire, flood, erosion/landslides) | 0.65 | 0.43 |
| CSF2: Catchment Condition Information and Risk Monitoring | ||
| 10: Effective catchment management planning requires current land use information | 0.91 | 0.83 |
| 11: Observational information on catchment condition is critical to the catchment management planning process | 0.96 | 0.92 |
| 12: Effective catchment management planning requires water quality monitoring data | 0.89 | 0.78 |
| CSF3: Support of Operational Field Activities | ||
| 19: Engagement with private landholders is essential in reducing risk in drinking water catchments. | 0.98 | 0.37 |
| 17: Data collected through inspections/surveillance is valuable in planning operations to reduce risk to drinking water quality | 0.61 | 0.97 |
| CSF4: Response to Water Quality Threats | ||
| 13: Best practice catchment management planning practices can identify and manage emerging threats to drinking water quality | 0.76 | 0.59 |
| 16: Enforcement of legal controls over activities in drinking water catchments are effective in reducing drinking water quality risk | 0.77 | 0.58 |
Table 7.
The values for covariance between latent variables in the measurement model.
| Latent Variable Pairs | Estimate | p Value | ||
|---|---|---|---|---|
| CSF1: Policy and Government Agency Support of Source Protection | <--> | CSF2: Catchment Condition Information and Risk Monitoring | 0.19 | 0.028 * |
| CSF2: Catchment Condition Information and Risk Monitoring | <--> | CSF3: Support of Operational Field Activities | 0.26 | 0.006 * |
| CSF4: Response to Water Quality Threats | <--> | CSF3: Support of Operational Field Activities | 0.23 | 0.013 * |
| CSF4: Response to Water Quality Threats | <--> | CSF1: Policy and Government Agency Support of Source Protection | 0.19 | 0.039 * |
| CSF1: Policy and Government Agency Support of Source Protection | <--> | CSF3: Support of Operational Field Activities | 0.17 | 0.037 * |
| CSF4: Response to Water Quality Threats | <--> | CSF2: Catchment Condition Information and Risk Monitoring | 0.28 | 0.002 * |
* p-value significant at p ≤ 0.05.
Table 8.
Results for the goodness of fit (GOF) indices for the fitted structural model.
| Goodness of Fit Indices | Acceptable Limit | Fitted Structural Model |
|---|---|---|
| χ2/df | <2 | 1.40(p = 0.009) |
| RMSEA | <0.10 | 0.08 |
| CFI | ≥0.95 | 0.95 |
| IFI | ≥0.95 | 0.95 |
© 2020 by the authors. Licensee MDPI, Basel, Switzerland. This article is an open access article distributed under the terms and conditions of the Creative Commons Attribution (CC BY) license (http://creativecommons.org/licenses/by/4.0/).
Share and Cite
MDPI and ACS Style
Merrett, H.C.; Chen, W.T.; Horng, J.J. A Structural Equation Model of Success in Drinking Water Source Protection Programs. Sustainability 2020, 12, 1698. https://0-doi-org.brum.beds.ac.uk/10.3390/su12041698
AMA Style
Merrett HC, Chen WT, Horng JJ. A Structural Equation Model of Success in Drinking Water Source Protection Programs. Sustainability. 2020; 12(4):1698. https://0-doi-org.brum.beds.ac.uk/10.3390/su12041698
Chicago/Turabian StyleMerrett, Hew Cameron, Wei Tong Chen, and Jao Jia Horng. 2020. "A Structural Equation Model of Success in Drinking Water Source Protection Programs" Sustainability 12, no. 4: 1698. https://0-doi-org.brum.beds.ac.uk/10.3390/su12041698
Note that from the first issue of 2016, this journal uses article numbers instead of page numbers. See further details here.