Article

Economic Valuation of Earth’s Critical Zone: A Pilot Study of the Zhangxi Catchment, China

1
School of Earth and Environment, University of Leeds, Leeds LS2 9JT, UK
2
Health Economics Group, University of Exeter Medical School, University of Exeter, Exeter EX1 2LU, UK
3
State Key Laboratory of Pollution Control and Resource Reuse, School of Environment, Nanjing University, Nanjing 210046, China
4
State Key Laboratory of Urban and Regional Ecology, Research Center for Eco-Environmental Sciences, Chinese Academy of Sciences, Beijing 100085, China
5
Key Laboratory of Urban Environment and Health, Institute of Urban Environment, Chinese Academy of Sciences, Ningbo 315830, China
6
Key Laboratory of Surficial Geochemistry, Ministry Education, Nanjing University, Nanjing 210023, China
7
Global Food and Environment Institute, University of Leeds, Leeds LS2 9JT, UK
*
Author to whom correspondence should be addressed.
Sustainability 2020, 12(4), 1699; https://0-doi-org.brum.beds.ac.uk/10.3390/su12041699
Submission received: 17 January 2020 / Revised: 18 February 2020 / Accepted: 19 February 2020 / Published: 24 February 2020
(This article belongs to the Section Economic and Business Aspects of Sustainability)

Abstract

:
Earth’s critical zone is the physical layer contained between the top of the vegetation canopy and the depth of the circulating groundwater below the land surface. The critical zone is defined within the study of Earth natural sciences as the unique terrestrial biophysical system that supplies most life-sustaining resources for humans. A feature of this specific physical system that is defined by geographical locale is the interactions of people with the vertically-connected biophysical flows and transformations (energy, material, biodiversity) that contribute to human welfare by delivering, both directly and indirectly, critical zone services to humankind. We have characterized these interactions by considering the full extent of the critical zone through the application of economic valuation methods. We estimated the current economic value of 14 critical zone services for 5 biophysical components of Earth’s critical zone, based on data collected from the Zhangxi catchment of Ningbo city located in the Yangtze River Delta region of China and from several additional published studies. For the full vertical extent of Earth’s critical zone bounded by the Zhangxi catchment, the value, most of which is outside the market, was estimated to be USD 116 million in 2018. Valuation of goods and services was delineated for benefits arising from key components of the critical zone physical system. The estimated value of the atmospheric component of Earth’s critical zone was USD 5 million; the vegetation component value was USD 96 million; the soil component value was USD 8 million; the surface water component value was USD 5 million; and the groundwater component value was USD 2 million. Because of the nature of the uncertainties and lack of data for the full range of identified services, these values are considered a minimum estimate. Gross domestic product in the Zhangxi catchment was around USD 431 million in 2018. These results illustrate, for one location, the range of services that arise when considering the full depth of Earth’s critical zone, the data needs for valuing this range of services, and the conceptual and potential methodological advances, and the challenges, that exist at the disciplinary interface between Earth natural sciences and applied economics.

1. Introduction

The Earth is a very efficient, least-cost provider of human life-support services [1]. Earth’s critical zone, defined by the US National Research Council (NRC, 2001) as the “heterogeneous, near surface environment in which complex interactions involving rock, soil, water, air, and living organisms regulate the natural habitat and determine the availability of life sustaining resources”, is the terrestrial component of Earth systems, which supplies most of our life-sustaining resources [2]. The critical zone defines a specific physical system that is bounded below by the surface of unaltered bedrock and above by the top of the vegetation canopy. Within the critical zone and more generally, ecosystem services represent the benefits that humans obtain from ecosystem functions that can be considered the stocks of materials, energy, or information that exist at a point in time and generate a flow of services to enhance human welfare [3,4]. The human use of this flow of services may or may not leave the original stock intact [1]. However, modern day societies and economic development are becoming increasingly vulnerable to the continued erosion of the stocks and flows of essential ecosystem services [5,6,7]. For example, changing evapotranspiration rates are causing water storage shortfalls in regions without producing improvements in human comfort [8]. Therefore, the protection and restoration of ecosystem stocks and flows, and the enhancement of ecosystem services, has become a pressing global issue. As ecosystem services are largely nonmarket goods and the non-living (abiotic) resources and processes that provide ecosystem services (e.g., geodiversity) are persistently neglected in international and national policies, the vast majority of ecosystem services are often excluded from formal economic decision-making and therefore risk being undervalued and overused [3,4]. Economic valuation of ecosystem services is an attempt to address these deficiencies [1], and many studies have been conducted on valuing ecosystem services, while most of these studies are focused mainly on economic valuation of tangible services arising at the land surface such as tourism or on food provisioning conducted by soil and vegetation and surface water supplies. The economic value of ecosystem services derived from Earth’s critical zone as the principal terrestrial provider of life sustaining resources has, to date, been relatively neglected [9,10].
In concept, the valuation of Earth’s critical zone services arising from stocks and flows occurring through the full vertical extent of the defined physical system offers the potential for a more complete understanding of its status and role as human habitat in supporting economic development, governing the impact of human activity on the Earth system, and improving human well-being [3]. This awareness offers potential to help decision-makers in the commercial and policy arenas seek reasonable methods of resources allocation and ecosystem management for the mitigation of the major environmental risks and for the development of a sustainable and resilient society by more optimal utilization of the full range of Earth’s critical zone services [11,12].
Given the comprehensive inventory of stock and flows within Earth’s critical zone, two steps are required to estimate the economic value of critical zone services. The first step is to identify the ecosystem services derived from Earth’s critical zone and the second is to monetize the identified critical zone services. Earth’s critical zone can be classified into five interacting biophysical components: atmosphere (lower boundary layer), vegetation, soil, surface water, and groundwater, which all deliver a variety of critical zone services to humans. Critical zone services are defined as the wide range of human benefits provided by the specific complete physical system of Earth’s critical zone. Atmosphere provides air that we breathe and can be used to generate power for human needs. It cleans the air and disperses air pollution. It also provides aesthetic, sensual, intrinsic, and existence value to humans. More than 99% of human food (calories) comes from terrestrial vegetation and soil [13]. Vegetation provides the majority of biological raw materials for humans. Vegetation fixes carbon and regulates climate through the function of CO2 fixation and O2 production by photosynthesis. It filters and cleans the atmosphere of particulate materials and regulates the water cycle. It also controls erosion and biodiversity and supports pollination. It contributes substantially to the visual impact of the landscape for recreation and tourism, knowledge systems, cultural diversity, and educational, aesthetic, spiritual, and symbolic value. Soil provides food, water, raw materials, and a building platform for humans. Soil stores carbon, regulates greenhouse gases and water, filters nutrients and contaminants from groundwater recharge and surface water discharge, and maintains habitat and a rich microbial genetic biodiversity. Soil and the shallow geosphere support landscapes for recreation and tourism services, knowledge systems, cultural diversity, educational and aesthetic values, and spiritual and symbolic value. Surface water provides fresh water, food, and raw and abiotic materials. It purifies water, regulates floods, retains sediment, regulates greenhouse gases and climate, and controls aquatic biodiversity. It also provides recreation and tourism services, knowledge systems, cultural diversity, educational and aesthetic value, and spiritual and symbolic value. Groundwater provides freshwater and subsurface biodiversity and genetic resources. It purifies water, helps regulate hydrology and climate impacts including flood storage and regulation. It also contributes to recreation and tourism services, knowledge systems, cultural diversity, educational and aesthetic values, and spiritual and symbolic value. Groundwater also represents the shallow geosphere environment that acts as an archaeological repository to store and protect historical cultural information. The economic value of some of these individual ecosystem services has been estimated using market-based and non-market based approaches; however, many of them have been somewhat ignored in the literature [1,3,5].
This study addresses research gaps by synthesizing the current knowledge of ecosystem services derived from the interacting critical zone components of atmosphere, vegetation, soil, surface water, and groundwater. We propose that defining the critical zone as a specific physical system offers the potential to define a more comprehensive and systematic conceptualization of terrestrial ecosystem stocks and flows as the basis for economic valuation methods that can be used for site-specific applications. This is illustrated with a case study of the Zhangxi catchment in the Yangtze River Delta region of east China. Specifically, we analyze definitions and methods for assessing and valuing goods and services derived from Earth’s critical zone, based on Earth observation, modelling, published statistics, and literature datasets, to estimate the economic value of Earth’s critical zone services at the study location. Although here, upfront, we state that we have not represented all possible multiple services of Earth’s critical zone due to uncertainties and lack of data, this study addresses dominant, recognized benefits and costs and provides the first estimation of the economic value of Earth’s critical zone.
This paper is structured as follows: Section 2 discusses the materials and methods to measure the economic value of Earth’s critical zone; Section 3 explains the definitions and datasets of fourteen selected critical zone services to valuate in the Zhangxi catchment; Section 4 describes the estimated economic value of Earth’s critical zone; Section 5 discusses the implications, limitations, uncertainties, and caveats of the economic valuation of Earth’s critical zone; and Section 6 summarizes the key outcomes of the study.

2. Materials and Methods
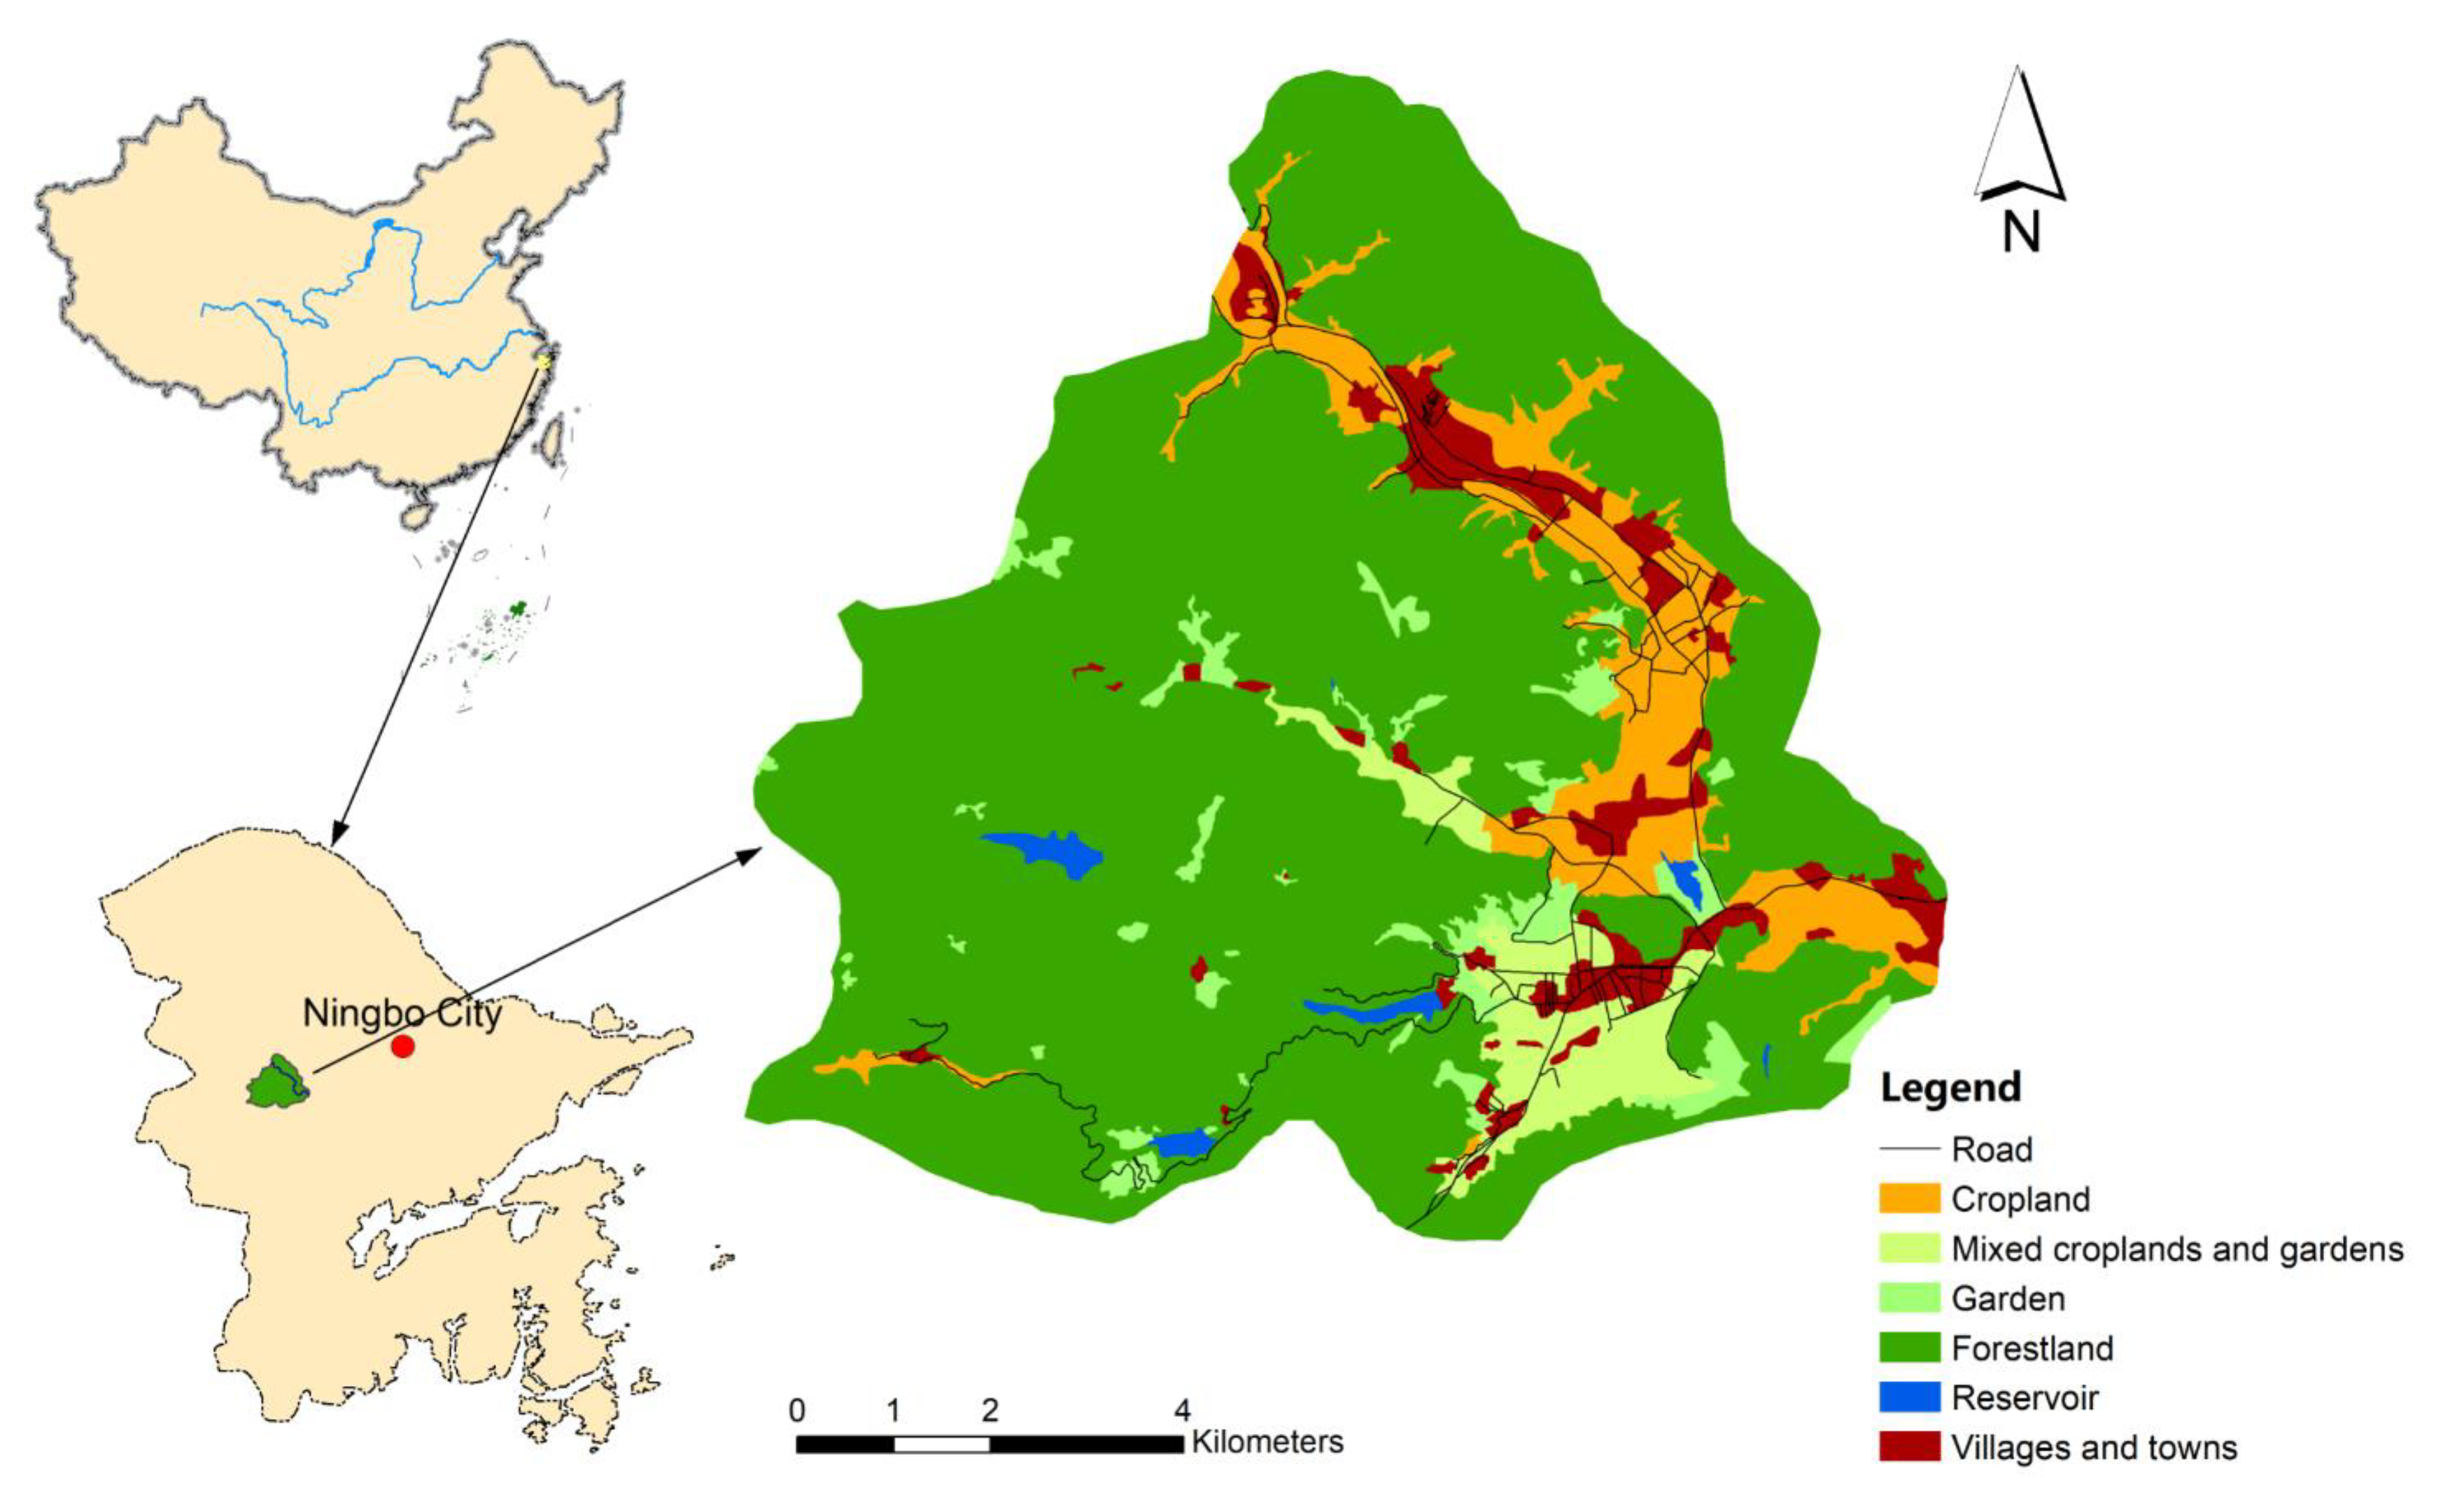
2.1. Study Area

The study area is located in the Zhangxi catchment (29°45′ N–29°51′ N, 121°13′ E–121°20′ E) within Ningbo city, a pilot city of rapid urbanization in the Yangtze delta, Eastern China. The catchment occupies an area of 91.59 km2 and has a subtropical monsoon climate. The highest mean monthly temperature is in July (28.0 °C) and the lowest is in January (4.7 °C), and the mean annual cumulative precipitation is 1480 mm. Forest is the main land cover (76.98%), and the remaining land use types are cropland (8.98%), mixed cropland and gardens (4.22%), garden (3.85%), reservoir (0.8%), and villages and towns (5.17%) (Figure 1; Location of study area and land use map of the Zhangxi catchment). The rational for selecting the Zhangxi catchment as a study focus was its (1) location as a rural catchment at the expanding urban fringe of Ningbo city, (2) potential to provide study sites of agricultural practices to reduce mineral fertilizer use in conventional wheat-rice and horticulture rotations, (3) representative characteristics of a pre-urbanisation zone as a baseline for rapid social and environmental change accompanying rapid population growth in East China [14], and because of data availability.

2.2. Data Sources and Key Assumptions

This study has drawn on three datasets collected and maintained by a wide range of institutional partners. The land-use dataset that includes information on the areas of cropland, mixed croplands and gardens, garden, forestland, reservoir, and villages and towns was provided by the State Key Laboratory of Urban and Regional Ecology, Research Center for Eco-Environmental Sciences, the Chinese Academy of Sciences (CAS). A large part of biophysical datasets of Earth’s critical zone services were measured, modeled, and provided by the Chinese Academy of Sciences (CAS), the Institute of Urban Environment, and Nanjing University. Biophysical data that were not provided by the institutional partners were gathered from a range of publications, reports, and government documents that include the following: The climatic adjustment value was obtained from Xie et al. [15]. The socio-economic data were taken from the Statistical Yearbook of the towns of Zhangshui and Yinjiang, 2018, and the population, GDP, and the output and production value of agricultural products were provided for 2018 by Haishu district government statistics bureau.
The following assumptions are made: (1) The selected biophysical indicators are a reasonable proxy for Earth’s critical zone services. The output of individual types of major agricultural products (vegetables and melons) are good proxies for the service flow of food production provided by vegetation, (2) the biophysical values provide a good approximation of the corresponding Earth’s critical zone services; for example, the quantity of air breathed by individual people (5475 m3 per year) is a good approximation for the service flows of clean air for human health, (3) the unit value chosen to transfer the biophysical value into economic value is an appropriate representation of the value of the service; for example, the social cost of carbon is a good substitution of the value of carbon sequestration, (4) the economic value of each individual critical zone service can be added together to reach the total economic value of Earth’s critical zone because they represent joint products (different services and different aspects of different services) of the Earth’s critical zone, which collectively support human welfare.

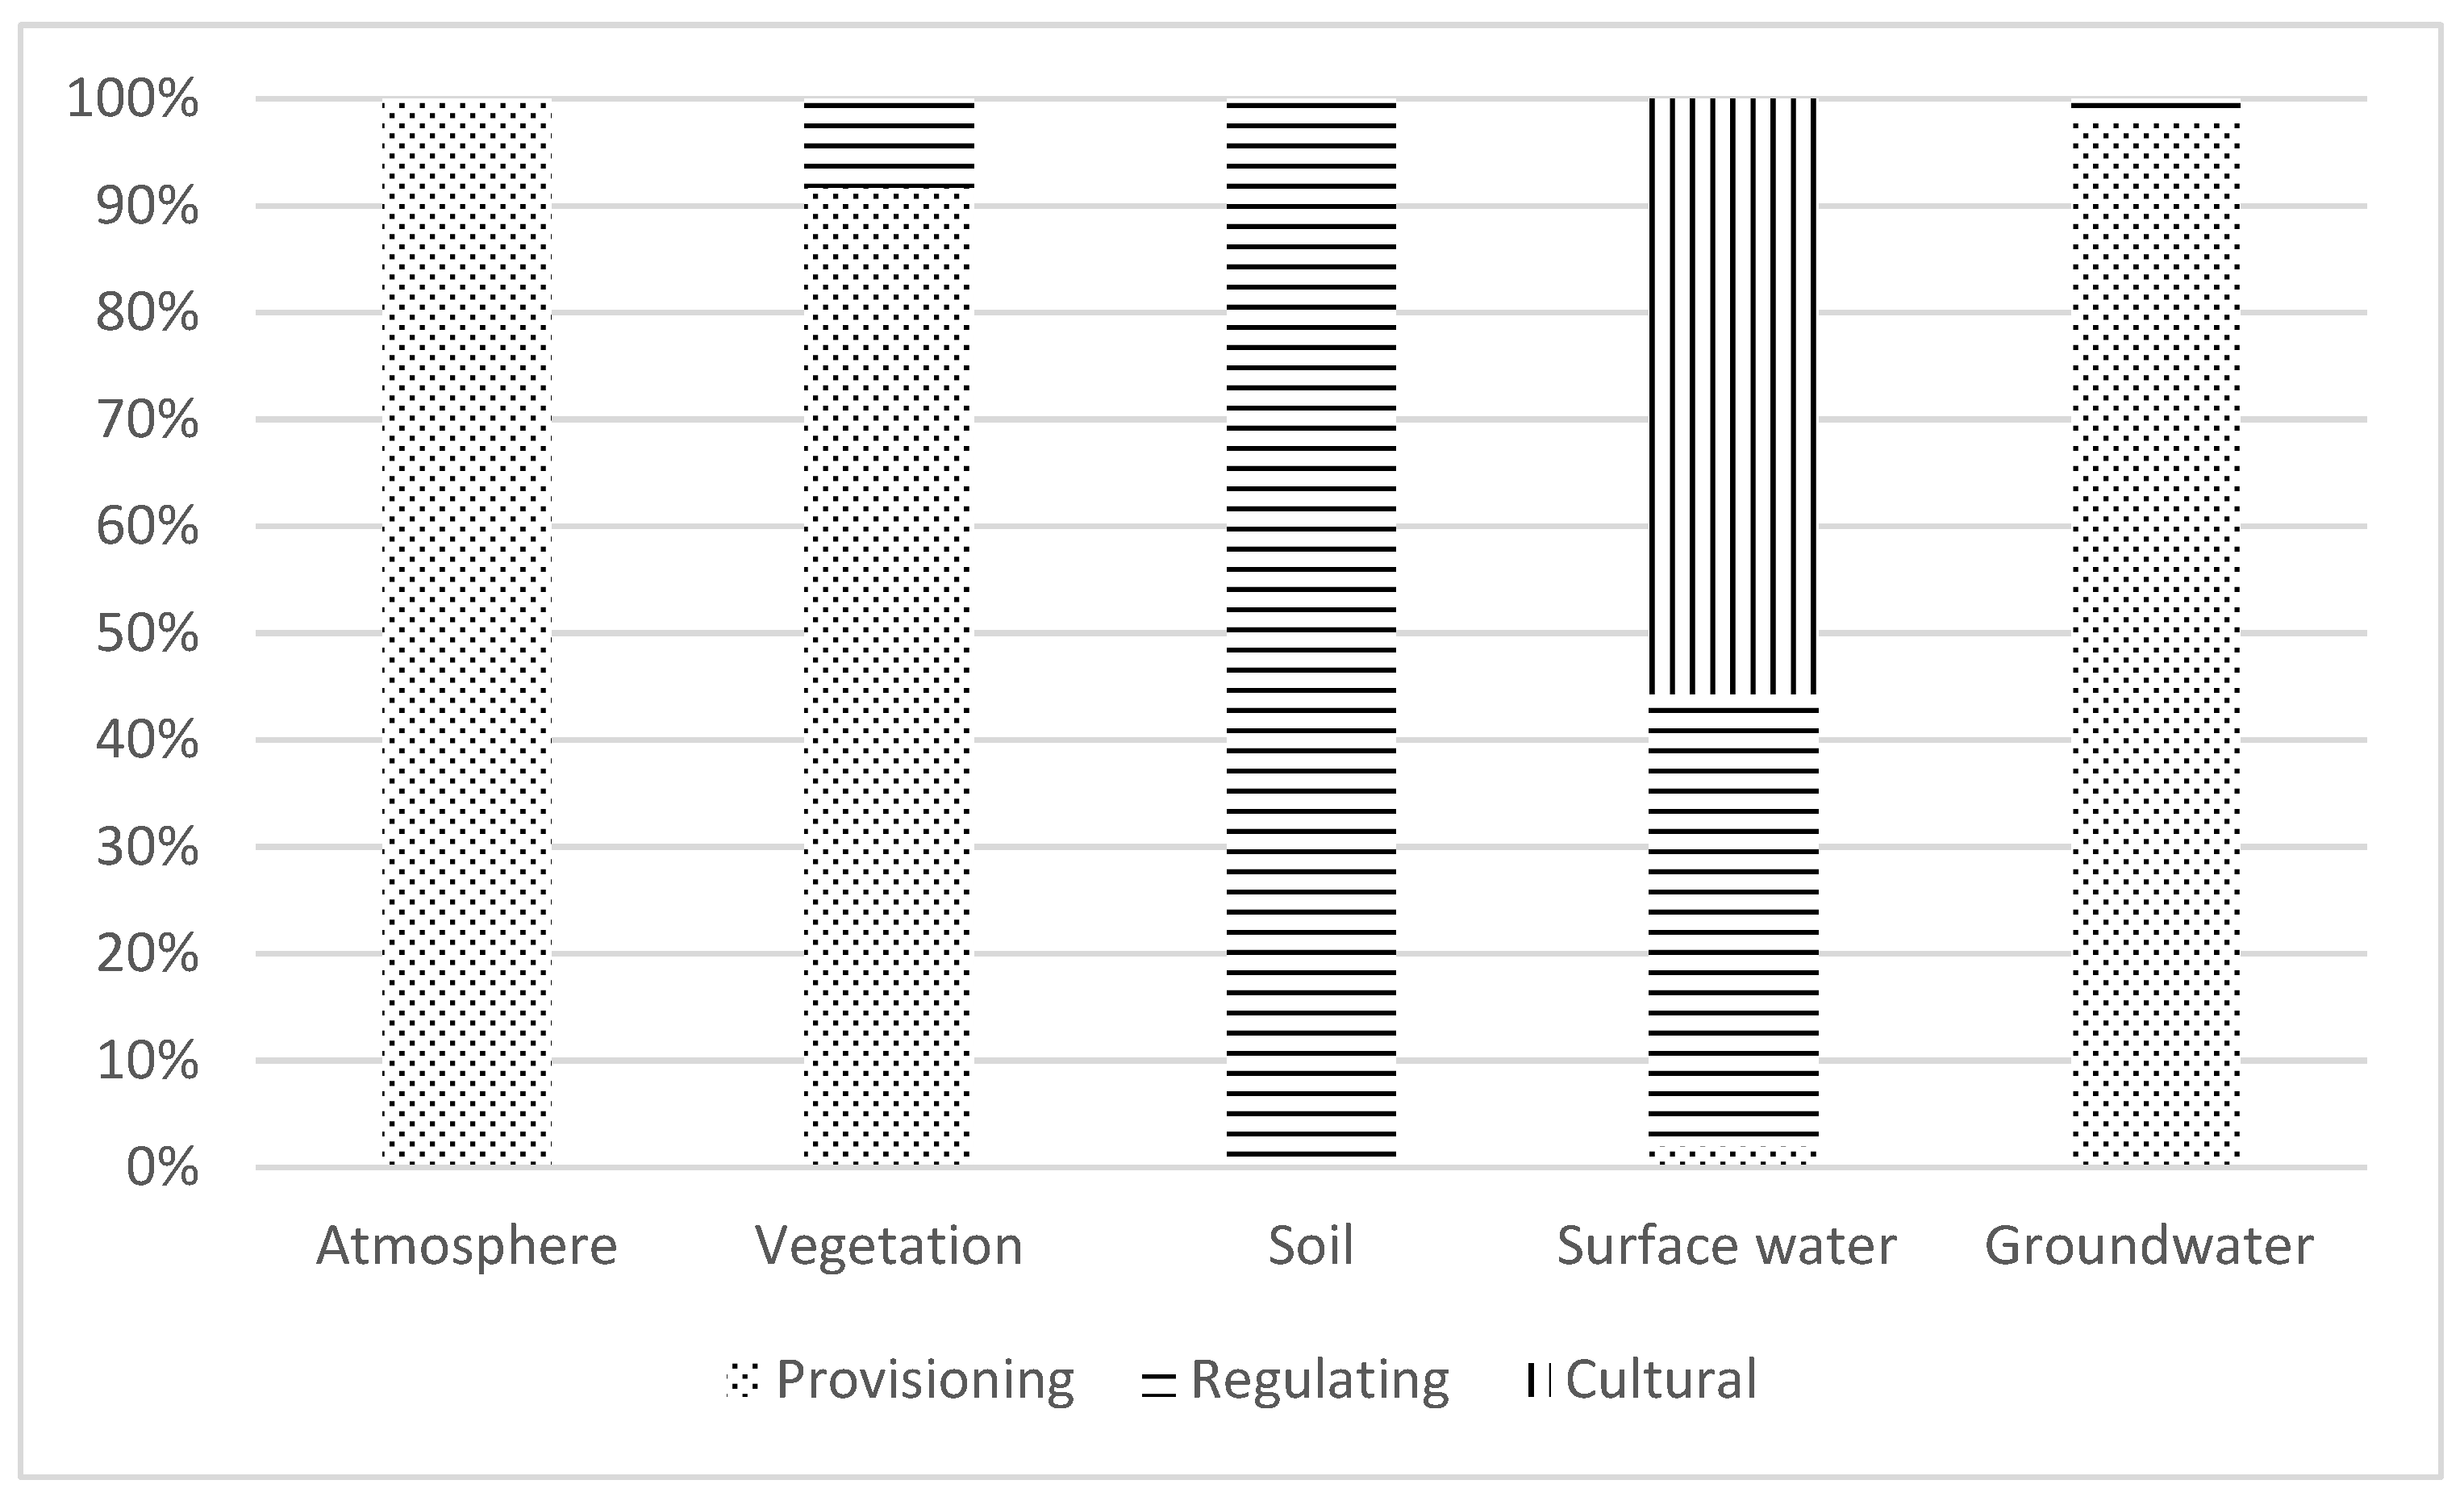
2.3. Economic Valuation of Earth’s Critical Zone Services

The economic valuation of Earth’s critical zone services in the Zhangxi catchment was based on partial equilibrium theory, which determines the total economic value of Earth’s critical zone as the sum of values for all identified critical zone services. A number of previously published studies have adopted this methodology to provide the economic value of ecosystem services derived from a specific ecosystem of particular interest [16,17]. We defined the economic valuation of Earth’s critical zone services in the Zhangxi catchment through the following formula:
C Z V = i = 1 n Q i × P i
C Z V is the total economic value (USD) of Earth’s critical zone services at the scale of the whole catchment, Q i is the biophysical value of Earth’s critical zone service type   i , P i is the unit value (US dollars, noted as USD or $ unless otherwise stated) of Earth’s critical zone service type   i , and n is the number of evaluated critical zone services. The exchange rate used to convert between CNY and USD where needed was 1:6.62 (annual average price) for 2018. This data was derived from the National Bureau of Statistics of China: Annual Data—Statistic Yearbook—Foreign Trade and Economic Cooperation—Reference Exchange of Renminbi (Period Average).
The critical zone services defined here include goods and services that are provisioned for human benefit by the natural processes and functions of Earth’s critical zone during a certain period of time. The Earth’s critical zone services represented in this study are:
  • Air that humans breathe provided by the atmosphere;
  • Food production;
  • Climate regulation;
  • Waste treatment;
  • Water regulation;
  • Erosion control;
  • Biological control provided by vegetation;
  • Carbon sequestration in land;
  • Filtering of nutrients and contaminants provided by soil;
  • Water storage and supply;
  • Surface water purification and waste treatment;
  • Recreation and tourism services provided by surface water;
  • Freshwater storage and supply;
  • Water purification and waste treatment provided by groundwater.
The definitions, assessment, and valuing methods of these selected critical zone services are detailed below. These services are not the complete spectrum of services derived from Earth’s critical zone that have been identified to date, but they provide a significant proportion of the dominant services that contribute to the economic value of Earth’s critical zone, both in the specific context of the Zhangxi catchment, and generally. Our approach in this case represents a best available minimum value for Earth’s critical zone services.
The unit value that refers to the economic value per unit of goods or services per unit time (e.g., USD·person−1·year−1) of Earth’s critical zone services defines the price associated with a good or service arising from the stocks of materials, energy, or information that generate a flow of services to enhance human welfare at a specific scale. It can refer, for example, to the current price of a product in the market, the value of an object, or the aggregate value of one type of service that benefits many users annually. The unit value of Earth’s critical zone services can be measured by monetary valuation methods including market-based and non-market based approaches.

3. Critical Zone Services Chosen for Economic Valuation in the Zhangxi Catchment

Fourteen critical zone services were chosen for the economic valuation of Earth’s critical zone of the Zhangxi catchment based on awareness of the dominant goods and services, the data available for the site, and the structure and functions emphasized in the specific physical system of Earth’s critical zone. The number of services selected, associated with the identified stocks contained within specific biophysical compartments of the critical zone, and the flows arising from these stocks included one associated with atmospheric services, six vegetation services, two soil services, three surface water services, and two groundwater services. We classified these selected critical zone services into three categories, defined in the Millennium Ecosystem Assessment, which are: provisioning, regulation, and cultural services [18].

3.1. Atmospheric Services

Air That Humans Breathe

One of the critical provisioning services of atmosphere is air that humans breathe. Earth’s critical zone provides clean air that humans breathe within the near-surface atmospheric boundary layer. Air that humans breathe is of particular interest because of multiple factors including the supply of O2 for human metabolism, the content of N2 to dilute O2 levels to levels that do not spontaneously combust biomass, and the supply of air free from potentially toxic gases and particulates that otherwise pose health risks to humans. The volume of air breathed by humans was considered as a proxy for the service of air that humans breathe. For the Zhangxi catchment, the metric chosen for this service was the volume of air inhaled by people in m3·person−1·year−1, that is, the quantity of air inhaled by individuals annually in the catchment. The data were obtained from literature that illustrated that each person inhales approximately 15 m3 of air per day, equivalent to 5475 m3 of air per year [19,20]. The yearly amount of inhaled air for the population of the Zhangxi catchment was calculated by multiplying the total population in the Zhangxi catchment by the annual amount of inhaled air per individual (5475 m3·person−1·year−1). The economic method chosen for converting the biophysical value of air that human breathe to economic value was value transfer. After detailed review, few studies were found to have evaluated the economic value of the air that we breathe (Table 1). Here, we employed the value of the provisioning of clean air as the avoided cost of reducing the air pollution (mainly refers to particulate matter, defined as PM2.5 [21]), that is, $0.018 m3·person−1·day−1 as the unit value of air that we breathe.

3.2. Vegetation Services

3.2.1. Food Production

Food production is one of the most important provisioning services of Earth’s critical zone. The vegetation of Earth’s critical zone has the ability to support human life by providing cereals, fruits, and vegetables. Vegetation provides food to humans through the function of CO2 fixation and O2 production by photosynthesis. The vegetation canopy accounts for 19.9% ± 16.7% of the Earth’s critical zone full depth, which is estimated to vary with location globally generally from 0 to 59.9 m (geospatially weighted mean, 5.6 m [25]). For the Zhangxi catchment, the vegetation produces a plethora of different foods to humans in the form of arable crops, vegetables, and fruits. Yield was assessed as a proxy for the service flow of food production. The metric chosen for this service is yield in kg·ha−1·year−1, that is, the production of arable crops, vegetables, and melons (the dominant fruit that is produced) per hectare per year in the catchment. The yield for each food category was linked to the area of the corresponding land-use category. The economic method chosen for converting the biophysical value of food production into economic values utilized market prices. The total economic value of food production derived from vegetation in the Zhangxi catchment was provided by the Haishu district government statistics bureau for 2018. In China, the local government collects both yield and market price data for each food category and reports to the upper government, which aggregates the total economic value according to the food category. In the Zhangxi catchment, the local government of the towns of Zhangshui and Yinjiang collect the datasets of food yields and their market prices and provide the total economic value of food production derived from vegetation to Haishu district government, and Haishu district government aggregates the total economic value of food production from the towns of Zhangshui and Yinjiang. As the Haishu district government did not have detailed biophysical values of food production (yields), nor the market prices for individual products, the statistical output value of agriculture products (mainly including crops and vegetables) is assumed to reflect the total economic value of food production derived from vegetation.

3.2.2. Climate Regulation

One of the significant regulating services of the critical zone is climate regulation, which generally refers to temperature and evapotranspiration. The vegetation of Earth’s critical zone absorbs CO2 in the air through the function of photosynthesis to produce stocks of living biomass. The carbon sequestration and storage in the vegetation of Earth’s critical zone can prevent the release of substantial amounts of CO2 into the atmosphere and, thus, contribute to climate change mitigation. Vegetation also alters the solar radiation flux and thermal balance of the Earth surface through shading and evapotranspiration. For the Zhangxi catchment, the climatic adjustment ecosystem value of forest in terrestrial China was selected as a proxy for the service of climate regulation. The metric chosen for this service is USD·ha−1·year−1; that is, the climatic adjustment value of forest per unit area in China’s terrestrial ecosystem per year. Xie et al. estimated that the climatic adjustment value of forest per unit area of terrestrial ecosystem of China was 360.89 USD·ha−1·year−1 [15]. The forest area is based on land use and land cover data for the Zhangxi catchment. The beneficiaries are local citizens and local and regional authorities, as local citizens have access to forest areas and vegetation shading during hot periods and national policy units benefit from the role of the Zhangxi catchment forests to contribute to China’s international treaty obligations and targets for climate regulation. Global citizens benefit from the conservation of forests and the reduced release of greenhouse gases to atmosphere contributing to global climate change that would occur if the Zhangxi forests were destroyed, for example, by urbanization.

3.2.3. Waste Treatment

Waste treatment is also an important regulating service of vegetation. Vegetation has the ability to absorb, filter, remove, breakdown, and regulate air pollutant (e.g., PM10, pollutant gases, and noise) levels in the lower atmosphere to maintain clean air and aesthetically valued clear visibility. For the Zhangxi catchment, the dust-trapping (mainly refers to particulate matter with a diameter larger than 10 microns) capacity of broad-leaved forest was assessed as a proxy for the service of waste treatment. The dust-trapping capacity of vegetation is used to measure the service of waste treatment for a number of reasons. The vegetation of the Zhangxi catchment belongs to the subtropical evergreen broad-leaved forest zone. Dust in the atmosphere is a well-known health hazard, even at low concentrations. The capture of dust by vegetation reduces atmospheric concentrations and indirectly decreases health risks that result from direct exposure. It is one of the best documented pollutants in China. The metric applied was kg·ha−1·year−1; that is, the quantity of dust (kg) trapped by broad-leaved forest (ha−1) annually. According to the national biodiversity research report of China, the dust-trapping capacity of broad-leaved forest is 10,110 kg·ha−1·year−1. The economic valuation of unit value of waste treatment is the avoided cost method. The avoided cost method applied is based on the cost of mitigating dust in the atmosphere. This data comes from previous literature; see Nie et al. for detailed information [26]. The beneficiaries are local citizens and authorities, as local people are able to breathe the clean air and local authorities are responsible for carrying out pollution mitigation projects.

3.2.4. Water Regulation

Water regulation is another critical regulating service of vegetation. Vegetation acts as a vital barrier for water flow through water retention and storage, thereby lessening the impact of storm, flood, drought, erosion events, and other aspects of habitat response to environmental variability [27,28]. Storm protection and flood mitigation do not remove the risk of storms or flooding, but lower the likelihood of damage and reduce the need for man-made storm/flood-protection structures. For the Zhangxi catchment, canopy interception, which accounts for a certain percentage of precipitation flow, was assessed as a proxy for the vegetation service of water regulation. Canopy interception refers to the whole process of precipitation (including precipitation, snowfall, frost, fog, and other precipitation processes) in which some water is received by vegetation (including forests, shrubs, weeds, and other surface coverings) and directly evaporated without water entering the soil. The metrics chosen for this service is mm·ha−1 year−1. Data of precipitation were collected from the State Key Laboratory of Urban and Regional Ecology, the Research Center for Eco-Environmental Sciences, and the Chinese Academy of Sciences (CAS), while the percentage of precipitation regulated by canopy was obtained from literature sources. In a study area that had a similar vegetation coverage and climate to that of the Zhangxi catchment, it was estimated that the canopy intercepted approximately 13% of precipitation [29]. As local and regional authorities are responsible for carrying out flood mitigation infrastructure, they are the beneficiaries of water regulation service. The avoided cost method, which bases the value of the service on the costs that would be incurred in the absence of the service, is employed to estimate the economic value of water regulation.

3.2.5. Erosion Control

Erosion control is regarded as one of the vital regulating services of vegetation. The vegetation of Earth’s critical zone has the ability to maintain soil stocks by reducing the physical impact of raindrops, slowing the flow of runoff, promoting the permeability of the soil through root growth, reducing wind erosion, and absorbing through plant uptake water that would otherwise contribute to soil erosion susceptibility. For the Zhangxi catchment, the soil erosion modulus was chosen as a proxy for the service of erosion control. The conservative soil erosion modulus in non-forest areas of China, whose value was 1500 t·km−2·year−1, was transferred as the erosion modulus of bare land in the Zhangxi catchment [30]. The actual soil erosion modulus with land cover in the Zhangxi catchment was 440 t km−2·year−1 [31]. The service of erosion control is the difference between these two values of soil erosion status. The beneficiaries of erosion control are local citizens and authorities, as the local citizens gain livelihood from the soil productivity and the local authorities are responsible for conducting soil protection projects. The method of economic valuation is the avoided cost. The market price of sediment dredging was used as the avoided cost of erosion control, and it ranged from a low of $1.96 t−1 to a high of $5.44 t−1 for 2018 [32].

3.2.6. Biological Control

Biological control is a regulating service and it refers to vegetation provision of habitat for multiple plants and animals to maintain biodiversity and a functioning ecosystem. The majority of agricultural pests that could affect food supply are controlled by natural enemies in a healthy system. Biological control is based on biodiversity, and the benefits of biological control belong to the non-use value of biodiversity. Willingness to pay is employed to estimate the benefits of biological control; however, this method is subject to human subjective preferences. For the Zhangxi catchment, the Shannon–Wiener index of vegetation was assessed as a proxy for the service of biological control. The Shannon–Wiener index is a well-accepted indicator of species diversity in an ecosystem, and the measurement formula is H = i = 1 n p i log p i , where p i is the proportion of species, i, in the population. It cannot only reflect the richness of species in the forest, but also express the balance of species distribution. The estimated Shannon–Wiener index of forest in the Zhangshui and Yinjiang town districts was 0.21 and 0.57, respectively [33]. The beneficiaries are local and regional authorities, as they are responsible for carrying out biodiversity protection projects. The method of economic valuation is that of value transfer, which uses economic estimates from previous studies of ecosystems comparable to the Zhangxi catchment to value services provided by the ecosystem of interest. Table 2 shows the classification value corresponding to the Shannon–Wiener index of species conservation. The unit price of each category of the Shannon–Wiener index of forest is the reference unit price provided by China State Forestry Administration [15].

3.3. Soil Services

3.3.1. Carbon Sequestration

Soil carbon sequestration is one of the vital regulating services of soils and refers to the long-term storage of carbon, either deep beneath the surface or in the near-surface soil layers. This service is supported by soil structure and macro porosity, which reflect soil carbon accumulation and organic matter stabilization, nutrient status (C:N ratio and nutrient availability), soil micro fauna diversity, and microbial diversity including denitrifier and methanotrophs populations. Carbon sequestration is of interest for multiple reasons. Soil carbon plays an important role in the stability and fertility of soils, and soils are an important sink for atmospheric carbon globally, particularly the storage of C derived from plant biomass when vegetation eventually dies. The soils in the Zhangxi catchment are under threat because of rapid urbanization and intensive land use. For the Zhangxi catchment, total carbon stored in the soil was assessed as a proxy for the service of carbon sequestration. The metric chosen for this service is kg C·ha−1·year−1; that is, the carbon stored in the soil. Data on carbon sequestration (total carbon g·kg−1 between the top 0–10 cm and 10–20 cm of soil) were provided by project partners at the Chinese Academy of Sciences on the Zhangxi catchment and were translated into an economic value using the replacement cost method. The replacement cost method applied is based on the social cost of carbon. Annual net C that flows into (sink from atmosphere) or from (source to atmosphere) the soil would have been a better proxy for this service. However, these proxy values were not available for the site at the catchment scale. The beneficiaries are local and regional authorities, as they are responsible for carrying out soil carbon sequestration projects to protect soil fertility and meet greenhouse gas emissions commitments. The estimated total carbon stocks in the top 10 cm of soils are in the range of 3.88 to 62.7 g·kg−1, with an average of 19.1 g·kg−1, while the total carbon between 10 and 20 cm of soils are in the range of 0.03 to 27.77 g·kg−1, with an average of 13.9 g·kg−1. The global social cost of carbon that reflects the benefits of climate change mitigation was estimated based on reported values in the literature, including meta-analysis studies, and ranged from 31.4 to 80.9 USD·t−1 C, with a mean of 50 USD·t−1 C [34,35].

3.3.2. Filtering of Nutrients and Contaminants

Soils have the ability to absorb and retain plant nutrients (including N and P in different forms) and contaminants (pathogens, pesticides, deposition of atmospheric pollution, industrial pollutants) by physical trapping in pores and by weakly or strongly binding them to organic or mineral soil constituents, and thereby avoiding their release into water bodies such as groundwater, lakes, and rivers in order to regulate the quality of subterranean and surface water reserves [27,28,29]. This service is considered as an important regulating service of soil, which we term filtering of nutrients and contaminants. For the Zhangxi catchment, the total nitrogen the soil retains was assessed as a proxy for the service of filtering nutrients and contaminants. Total nitrogen is of particular interest because dissolved inorganic N compounds, particularly nitrates, in supplies of drinking water are a well-known health hazard, and nitrate in aquifers and surface waters is a well-known environmental hazard that can lead to eutrophication. Well-functioning soils can retain and transform nitrates to forms that are retained in soil organic matter and on mineral surfaces or stored in other plant available forms, thereby preventing their release to waterways. In the absence of this service, the city would have to adopt physical-chemical treatments to remove the nitrates from the drinking water. The data on total nitrogen (TN) were provided at Zhangxi catchment scale by partners at the Chinese Academy of Sciences Research Centre for Eco-Environmental Sciences, who engage in water quality monitoring research at the site. The metric representing the service is the content of total nitrogen in the soil in g·kg−1. The avoided cost method, which refers to not having to pay for the removal of all of the nitrogen retained in soil because the soil can prevent the nitrate from entering the river or aquifer drinking water supply, is used to translate their biophysical value into an economic value.

3.4. Surface Water Services

3.4.1. Water Storage and Supply

The main provisioning service of surface water is water storage and supply. Water retained in lakes, rivers, and wetlands are the principal surface water sources to provide water for industrial, agricultural, and domestic use. Water storage and supply is of specific concern because clean water is critical to human existence. For the Zhangxi catchment, daily direct water demand from the Zhangxi River was chosen as a proxy for the service of surface water storage and supply. The metric chosen for this service is m3 water·day−1; that is the volume of surface water consumed (including domestic, agricultural, and industrial consumption) in the towns of Zhangshui and Yinjiang per day. The data on daily direct water demand in the towns of Zhangshui and Yinjiang were collected from the Haishu yearbook, provided by the People’s Government Office, Haishu District, Ningbo, China. The market price method applied is based on the average price of water for domestic use in the Zhangxi catchment. The beneficiaries are local residents and government authorities. The daily direct surface water demand in the towns of Zhangshui and Yinjiang is 2000 m3·day−1 and 1800 m3·day−1, respectively. The price of domestic water in Ningbo, which includes the towns of Zhangshui and Yinjiang, is $0.07 m−3.

3.4.2. Water Purification and Waste Treatment

One of the critical regulating services of surface water is water purification and waste treatment. Surface water bodies have the ability to absorb, decompose, filter, remediate, trap, sequester, store, and accumulate sewage discharges, pesticide residues, and industrial pollutants. The amount of chemical oxygen demand (COD) and ammonia nitrogen, mainly from sewage, that is removed by surface water processes was chosen as a proxy for the service of surface water purification and waste treatment. Water purification and waste treatment is of particular interest for multiple reasons. A large amount of pollutants (mainly COD and ammonia nitrogen) discharges into the Zhangxi River every year. In-stream processes play an important role in purifying these pollutants and supplying high-quality water to humans. The metric chosen for this service is kg COD year−1 and kg ammonia nitrogen year−1 removed by surface water. Data on COD and ammonia nitrogen were collected from the literature [36]. The pollutant loadings of COD and ammonia nitrogen derived from the local residents, agricultural non-point sources, and industry was estimated to be 157,000 kg·year−1, 3100 kg·year−1, 30,000 kg·year−1, 12,100 kg·year−1, 140 kg·year−1, and 3000 kg·year−1, respectively [36]. Although the removal rate of COD and ammonia nitrogen measured by monitoring data of the Zhangxi catchment could be a more precise approximation of the biophysical value of water purification and waste treatment provided by surface water, the project partners have not focused on this topic yet. According to the literature [37,38], the estimated removal rate of COD of surface water (including rivers, lakes, and wetland) is in the range of 53.66% to 90%, while the estimated removal rate of ammonia nitrogen for surface water is in the range of 61.8% to 90.9%. We adopt the median values of 71.83% and 76.35% to assess the biophysical value of COD and ammonia nitrogen removal by surface water, respectively. The avoided cost based on water treatment technology is adopted to measure the economic value of this service. The beneficiaries are local residences and local and regional authorities.

3.4.3. Recreation and Tourism Services

Surface water has the ability to provide cultural services to humans through recreation and tourism. The Zhangxi catchment provides an environment and opportunity for the recreational activity of drifting. The number of visitors who took part in the recreational activity of drifting in Lijiakeng village in the Zhangxi catchment was chosen as a proxy for the service of recreation and tourism services. Data on the scale of visitor numbers was collected from the People’s Government Office, Haishu district, Ningbo, China. The beneficiaries are local residents, local government, and tourists whose livelihoods benefit from visitor numbers. The economic method chosen for converting biophysical values to economic values utilized the market prices. There were approximately 0.1 to 0.15 million tourists visiting Lijiakeng village, and they brought about USD 3.02 million revenue for the local communities in 2018.

3.5. Groundwater Services

3.5.1. Freshwater Storage and Supply

One of the critical functions of groundwater as a provisioning service is the storage and retention of freshwater for domestic (e.g., drinking, cooking, and washing requirements), industrial, and agricultural (e.g., irrigation) uses [39]. Fresh groundwater storage and supply is of interest for many reasons. Groundwater is Earth’s largest accessible store of fresh water (excluding ice sheets and glaciers) and constitutes about 95% of global liquid freshwater [40]. There are two billion people and more than half of the cities with a population over 10 million depending directly upon aquifers for drinking water, and the dependence of groundwater in smaller and rural communities is even more widespread [41]. Groundwater aquifers supply more than half of the irrigation water for agriculture that produces 40% of the world’s food [42]. For the Zhangxi catchment, the volume of precipitation flow that is recharging groundwater was measured as a characteristic percentage of precipitation for the type of hydrology and climate and was assessed as a proxy for the service of freshwater storage and supply. The metric chosen for this service is m3·year−1, that is, the volume of freshwater recharged to the groundwater. The data of percentage of precipitation charging groundwater was collected from the literature where the results show that an average groundwater recharge volume is approximately 20% of the precipitation in the Yangtze Delta Region [43,44]. The perennial mean precipitation in the Zhangxi catchment ranges from 1341 mm to 1961 mm, with an average of 1480 mm. From these statistics, the groundwater service of freshwater storage and supply ranges from 268.2 mm to 392.2 mm, with an average of 296.0 mm. Market price is employed to convert the biophysical value of this service to economic value. The cost of domestic water in Ningbo city is USD 0.07 m−3.

3.5.2. Water Purification and Waste Treatment

Groundwater provides the regulating service of water purification and waste treatment through microbial transformation of nutrients such as nitrate, degradation of organic compounds, and removal of potential human pathogens. For the Zhangxi catchment, nitrate removal measured by the quantity of nitrate purified by groundwater was assessed as a proxy for the service of water purification and waste treatment. The metric chosen for this service is mg NO 3 -N L−1 removed from groundwater recharge; that is, the amount of nitrate purified by groundwater per liter of groundwater. This data was provided by project partners at Nanjing University, who focus on conceptual models of the hydrological cycle in the Zhangxi catchment and conduct borehole investigations of groundwater in the catchment. The estimated nitrate concentration in groundwater at a depth of 18 m, 24 m, 33 m, and 60 m of groundwater were 1.99 mg L−1, 0.84 mg L−1, 2.99 mg L−1, and 0.28 mg L−1, respectively. The percentage of nitrate removed by groundwater processes is in the range of 81.39% to 90.9% [45,46]. Using the median value of 86.15%, we assessed the biophysical value of water purification and waste treatment. The method of economic valuation is the replacement cost method. Based on a number of studies [47,48], the unit cost of nitrate removal by physical-chemical treatment technology ranged from a low of $6 to a high of $29 kg−1 N.

4. Results

We estimate that, at the current margin, Earth’s critical zone at the location of the Zhangxi catchment provides at least USD 116 million worth of services annually. The Gross Domestic Product (GDP) of the Zhangxi catchment was USD 431 million in 2018. Therefore, the current ratio of total economic value of Earth’s critical zone to GDP is 0.27 to 1. Table 3 is a summary of the results of our estimation. It illustrates the average (on a total basis) of the estimated economic value of the 14 critical zone services we have chosen based on data availability, and the total value of critical zone services by component, by service type, and for the entire critical zone system of the Zhangxi catchment.
The majority of the value of critical zone services that we could estimate is currently delivering the service of food production provided by vegetation, with a market value of USD 88.17 million year−1, which accounts for 75.92% of the total economic value of Earth’s critical zone at this location. About 6.65% of the estimated value comes from the soil (USD 7.72 million year−1), mainly from the filtering of nutrients and contaminants (USD 7.3 million year−1). The atmosphere, surface water, and groundwater contribute 4.26%, 4.66%, and 1.63%, respectively, of the total economic value of Earth’s critical zone in the Zhangxi catchment. Furthermore, approximately 81.87% of the estimated value is contributed by the provisioning services of Earth’s critical zone (USD 95.08 million year−1), most of which comes from food production. If we eliminated food production, the total annual economic value of Earth’s critical zone would be around USD 27.96 million, which accounts for 24% of the total economic value of Earth’s critical zone in the Zhangxi catchment. About 15.53% of the estimated value is contributed by the regulating services of Earth’s critical zone (USD 18.03 million year−1), and 2.64% of the estimated value is contributed by the cultural services of Earth’s critical zone (USD 3.02 million year−1).
Figure 2 shows each of the Earth’s critical zone components and the proportion of the total economic value of critical zone services by service type for each component of Earth’s critical zone of the Zhangxi catchment. The atmosphere, vegetation, and groundwater provide the largest provisioning services to human beings, the soil provides the biggest regulating services to humans, and the surface water provides the maximum cultural services value.

5. Discussion

This study is a first attempt to evaluate the economic value of Earth’s critical zone, as the specific physical terrestrial system that acts as human habitat and supplies most life-sustaining resources. The results from this pilot study show that there are important and valuable critical zone services in the Zhangxi catchment that deliver benefits to humans. We estimate that the annual mean value of these critical zone services is USD 116 million. The real value is almost certainly much larger, even at the current margin. USD 116 million is 0.27 times that of the current GDP in the Zhangxi catchment. One interpretation of this comparison is that if the Earth’s critical zone services were lost at the current margin due to the degradation of critical zone functioning, it would be necessary to increase GDP by at least USD 116 million, partly to cover critical zone services that have already been captured in existing GDP (e.g., food production provided by vegetation) and partly to cover critical zone services that are not currently captured in GDP. This hypothetical task, even if actually achievable, would lead to no increase in welfare because residents would only be replacing existing services, and it ignores the fact that many critical zone services are essentially irreplaceable (e.g., air that we breathe, water to drink).
Although Earth’s critical zone provides a plethora of critical zone services to humans, some of the Earth’s critical zone services were not included in this valuation due to the limitations of available data to support relevant proxy values for goods and services and values for the associated unit prices. Additional critical zone services can be included when more and better information becomes available [49,50], especially for atmospheric and groundwater ecosystem services, which have not yet been adequately studied [18]. Furthermore, the critical zone services valuation is based on the utility of Earth’s critical zone to human beings, which ignores the objective value of the Earth’s critical zone itself [51]. The Yangtze Delta is one of Earth’s most rapidly urbanizing regions, and air quality impacts on human health and deposition of pollutants to soil and water should be a focus for valuation and strategies for value capture. Constrained by data availability, we adopted some biophysical data, estimated previously in the literature, which contributes uncertainties to the estimation, particularly as the circumstances of Earth’s critical zone changes with location and over time (e.g., water purification and waste treatment provided by surface water). Many cost and price values were obtained from national databases and other sources due to the unavailability of local economic data, which introduces uncertainties.
There have been very few previous attempts to estimate the economic value of Earth’s critical zone with which to compare these results. We have considered five biophysical components of Earth’s critical zone in order to provide a degree of comparison. Two previous studies attempted to estimate the economic value of the atmosphere [19,20]. They estimated 12 ecosystem services provided by the atmosphere and the results demonstrated that the total economic value of the atmosphere is at least between 100 and 1000 times that of the Gross World Product (GWP) [20]. This estimate is much higher than our current estimate, as we estimated one out of twelve atmospheric services and the result illustrated that the total economic value of the air that we breathe is 1% that of the GDP in the Zhangxi catchment. This gap likely comes from the economic value that we chose to represent the unit value of air that we breathe. If we adopted £2 m−3 as the unit price of air that we breathe, in this case based on the commercial price of compressed clean air, the estimated economic value of Earth’s critical zone in the Zhangxi catchment would be USD 434 million yr−1, which is the same as the GDP produced in the Zhangxi catchment in 2018. Another possible factor is that the study area of the Zhangxi catchment is at local scale, and the area is relatively small with a modest human population of beneficiaries, resulting in a lower economic value of atmospheric services.
In his paper on valuing the world’s ecosystem services, Costanza et al. divided Earth into 16 biomes, which provide 17 ecosystem services to humans [1]. The results estimated the economic value of the world’s ecosystem services to be 1.8 times that of the world Gross National Product (GNP) based on methods derived from partial equilibrium theory, the approach also applied in this study. This estimate is higher than our current estimation. A possible reason is that we did not include the marine ecosystem services into the valuation, which Costanza estimated to be 63% of the total economic value of the world’s ecosystem services [1]. However, our estimation is similar to the estimate of economists, who place environment benefits into the classical economic growth function with the result that the contribution of the environment to economic growth is 0.2 [52], which is similar to our estimation.
Our estimate is based on applying models of partial equilibrium economic theory in the sense that the value of each critical zone service is derived independently and added together. This ignores the complex interdependencies between services and non-linearities or thresholds. The general equilibrium theory models in which the value of all ecosystem services are derived simultaneously with other values, and dynamic models that can incorporate non-linearities and thresholds, may be more representative than a partial equilibrium model; however, these models have rarely been attempted in practice [1,3,4,5]. They represent the next logical step to advance improved methods and better estimates of the value of Earth’s critical zone.
Given that the present study addresses research gaps by synthesizing the current knowledge of ecosystem services derived from the interacting critical zone components of atmosphere, vegetation, soil, surface water, and groundwater, we include a table (Table 4) that shows the size of the various stocks or flows (or proxy indicators) that are bounded by the defined physical system of the Zhangxi catchment and unit price that is multiplied by these to give the total economic value of the specific services that we have already summarized in Table 3.
This table (Table 4) illustrates translation of the biophysical system bounded by Earth’s critical zone into quantitative measures of stocks and flows as the basis for economic valuation methods that can be used for site-specific applications. We propose that the critical zone provides both a more general and also a much less ambiguous and therefore more rigorously defined and measurable extent of the Earth system upon which to base inventories of biophysical stocks and flows that are applied in valuation methods. In the site specific application presented here, the depth to bedrock, stands of vegetation, and the areal extent of the surface water catchment, with geospatial variability notwithstanding, define clearly delineated boundaries of the physical system that serve to identify groups of beneficiaries both within and outside the geographical boundaries of the system.
Our results show that the atmosphere is an overlooked component of Earth’s critical zone that provides many vital ecosystem services (e.g., air that we breathe) for humankind. In spite of these historical gaps and the limitations noted above, the economic valuation of Earth’s critical zone, as presented in this study, helps citizens and decision makers better understand the status and role of the Earth’s critical zone and provides useful information for policy makers working in natural resource allocation and management. Our pilot analysis suggests that, when valuing Earth’s critical zone at the local scale of a catchment, there is inherent danger of focusing solely on the visible, above-ground components that deliver services, while ignoring much of the value of Earth’s atmosphere and failing to consider the below-ground services such as freshwater storage and supply provided by groundwater. These conceptual and data gaps in the valuation methodology could lead to the mismanagement of the Earth’s critical zone resources and, if neglected, to significant economic costs in the long run.

6. Conclusions

This study aimed to estimate the economic value of Earth’s critical zone services using partial equilibrium valuation methods based on data availability from the Zhangxi catchment located in the Yangtze River Delta region of Eastern China. The results demonstrated that the estimated annual economic value of critical zone services provided by Earth’s critical zone in the Zhangxi catchment was at least USD 116 million in 2018. This estimate of Earth’s critical zone value must be considered conservative because of additional services that are not valued here, such as the full cleansing capacity of the atmosphere by pollution dispersal, hence some assumptions on proxy values and unit price need further consideration.
One practical use of the estimates we have developed is to support the view that Earth’s critical zone provides economic value through a range of diverse critical zone services that arise from stocks and flows encompassed within the full depth of the critical zone, from the top of unaltered bedrock to the top of the vegetation canopy and the lower atmospheric boundary layer. This broader inventory of stocks and flows, bounded within the defined physical system of the critical zone, should receive greater consideration as a component of effective environmental management and protection and be included in decision-making analyses to sustain the delivery of critical zone goods and services upon which citizens, businesses, and government actions rely. A second important use of these estimates is to identify data needs that, if met and applied with valuation methods, will assist resource managers in deciding how best to use limited critical zone services and in prioritizing among the range of possible environmental protection projects.
We acknowledge the uncertainties but nonetheless demonstrate an approach to value the critical zone and provide an initial estimate to illustrate the economic value of critical zone services. We argue that our initial estimate based on partial equilibrium methods is a useful starting point. In addition, our primary estimates are for a catchment as a generic localized unit area for pilot study rather than for a site with a focus in public and political discourse exhibiting specific political and economic drivers for valuation. This pilot study demonstrates the value of Earth’s critical zone as a conceptual advance in valuation methods, defines initial data needs and uncertainties, and identifies the focus for additional research and the specific points that are most in need of additional study. It also highlights the relative importance of critical zone services and the potential impact on human welfare if these are not more systematically addressed in natural resources planning and management.

Author Contributions

Conceptualization, W.N. and S.A.B.; methodology, W.N. and S.A.B.; software, W.N.; formal analysis, W.N. and S.A.B.; investigation, W.N., Y.X., and G.L.; data curation, H.G., L.Y., Y.X., G.L., X.R., Y.Z., and L.C.; writing—original draft preparation, W.N.; writing—review and editing, S.A.B.; visualization, W.N.; supervision, S.A.B.; project administration, S.A.B.; funding acquisition, S.A.B. All authors have read and agreed to the published version of the manuscript.

Funding

This research was funded by the China Scholarship Council, grant number 201804920043 and the UK-China Critical Zone Observatory program, funded by the UK Research and Innovation Natural Environment Research Council, grant numbers NE/N007514/1 and NE/N007514/2.

Acknowledgments

The authors would like to thank the editors and anonymous referees for their helpful and constructive comments and suggestions, which have helped to improve this contribution.

Conflicts of Interest

The authors declare no conflict of interest.

References

  1. Costanza, R.; d’Arge, R.; de Groot, R.; Farber, S.; Grasso, M. The value of the world’s ecosystem services and natural capital. Nature 1997, 387, 253–260. [Google Scholar] [CrossRef]
  2. National Research Council. Basic Research Opportunities in the Earth Sciences; National Acadamies Press: Cambridge, MA, USA, 2001. [Google Scholar]
  3. Costanza, R.; de Groot, R.; Braat, R.; Kubiszewski, I.; Fioramonti, L.; Sutton, P.; Farber, S.; Grasso, M. Twenty years of ecosystem services: How far have we come and how far do we still need to go? Ecosyst. Serv. 2017, 28, 1–16. [Google Scholar] [CrossRef]
  4. Brilha, J.; Gray, M.; Pereira, D.I.; Pereira, P. Geodiversity: An integrative review as a contribution to the sustainable management of the whole of nature. Environ. Sci. Policy 2018, 86, 19–28. [Google Scholar] [CrossRef] [Green Version]
  5. De Groot, R.; Brander, L.; Ploeg, S.; Costanza, R.; Bernard, F. Global estimates of the value of ecosystems and their services in monetary units. Ecosyst. Serv. 2010, 1, 50–61. [Google Scholar] [CrossRef]
  6. Bateman, I.J.; Harwood, A.R.; Mace, G.M.; Watson, R.T.; Abson, D.J. Bringing ecosystem services into economic decision-making: Land use in the United Kingdom. Science 2013, 341, 45–50. [Google Scholar] [CrossRef] [PubMed]
  7. Banwart, S.A.; Nikolaidis, N.P.; Zhu, Y.-G.; Peacock, C.; Sparks, D. Soil Functions: Connecting Earth’s critical zone. Annu. Rev. Earth Planet. Sci. 2019, 47, 333–359. [Google Scholar] [CrossRef]
  8. Wong, C.P.; Jiang, B.; Bohn, T.J.; Lee, K.N.; Lettenmaier, D.P. Lake and wetland ecosystem services measuring water storage and local climate regulation. Water Resour. Res. 2017. [Google Scholar] [CrossRef] [Green Version]
  9. Field, J.P.; Breshears, D.D.; Law, D.J.; Villegas, J.C.; López-Hoffman, L. Critical zone Services: Expanding Context, Constraints, and Currency beyond Ecosystem Services. Vadose Zone J. 2015, 14, 1–7. [Google Scholar] [CrossRef] [Green Version]
  10. Richter, D.; Billings, S. One physical system: Tansley’s ecosystem as Earth’s critical zone. New Phytol. 2015, 206, 900–912. [Google Scholar] [CrossRef]
  11. Blanchart, A.; Séré, G.; Johan, C.; Gilles, W.; Stas, M. Towards an operational methodology to optimize ecosystem services provided by urban soils. Landsc. Urban. Plan. 2018, 176, 1–9. [Google Scholar] [CrossRef]
  12. Nita, A. Empowering impact assessments knowledge and international research collaboration-A bibliometric analysis of Environmental Impact Assessment Review journal. Environ. Impact Assess. Rev. 2019, 78, 106283. [Google Scholar] [CrossRef]
  13. Jónsson, J.Ö.G.; Davíðsdóttir, B.; Nikolaidis, N.P. Valuation of soil ecosystem services. Adv. Agron. 2017, 142, 353–384. [Google Scholar] [CrossRef]
  14. Zhu, Y.G.; Reid, B.J.; Meharg, A.W.; Banwart, S.A.; Fu, B.J. Optimizing Peri-Urban Ecosystems (PURE) to re-couple urban-rural symbiosis. Sci. Total Environ. 2017, 585, 1085–1090. [Google Scholar] [CrossRef]
  15. Xie, G.D.; Zhang, Y.L.; Lu, C.X.; Zheng, D.; Cheng, S.K. Study on valuation of rangeland ecosystem services of China. J. Nat. Resour. 2001, 16, 47–53. [Google Scholar]
  16. Reynaud, A.; Lanzanova, D. A Global Meta-Analysis of the Value of Ecosystem Services Provided by Lakes. Ecol. Econ. 2017, 137, 184–194. [Google Scholar] [CrossRef]
  17. Nepal, M.; Rai, R.; Das, S.; Bhatta, L.; Kotru, R. Valuing Cultural Services of the Kailash Sacred Landscape for Sustainable Management. Sustainability 2018, 10, 3638. [Google Scholar] [CrossRef] [Green Version]
  18. Millennium Ecosystem Assessment. Ecosystems and Human Well-being: Synthesis; Island Press: Washington, DC, USA, 2005. [Google Scholar]
  19. Kendall, M.; Kothenca, G.; Stahl-Timmins, W.; Thornes, J. Atmospheric resource impact assessment (ARIA): An inventory for evaluating ecosystem services derived from the atmosphere. Prog. Phys. Geogr. 2014, 38, 414–430. [Google Scholar] [CrossRef]
  20. Thornes, J.; Bloss, W.; Bouzarovski, S.; Cai, X.M.; Chapman, L. Communicating the value of atmospheric services. Meteorol. Appl. 2010, 17, 243–250. [Google Scholar] [CrossRef] [Green Version]
  21. Zhang, Z.Y.; Wang, J.B.; Hart, J.E.; Laden, F.; Zhao, C. National scale spatiotemporal land-use regression model for PM2.5, PM10 and NO2 concentration in China. Atmos. Environ. 2018, 192, 48–54. [Google Scholar] [CrossRef]
  22. Belhaj, M. Estimating the benefits of clean air: Contingent valuation and hedonic price methods. Int. J. Glob. Environ. Issues 2003, 3, 30–46. [Google Scholar] [CrossRef]
  23. Kusiima Jamil, M.; Susan, E.P. Monetary value of the environmental and health externalities associated with production of ethanol from biomass feedstocks. Energy Policy 2010, 38, 2785–2796. [Google Scholar] [CrossRef]
  24. Birch, M.B.; Gramig, B.M.; Moomaw, W.R. Why metrics matter: Evaluation policy choices for reactive nitrogen in the Chesapeake Bay watershed. Enbiron. Sci. Technol. 2011, 45, 168–174. [Google Scholar] [CrossRef]
  25. Xu, X.L.; Liu, W. The global distribution of Earth’s critical zone and its controlling factors. Geophys. Res. Lett. 2017, 44, 3201–3208. [Google Scholar] [CrossRef]
  26. Nie, W.; Yu, F.W.; He, Y.Y. Evaluation of ecological benefit of walnut planting—A case of Dayao county of Yunnan Province. J. Anhui Agric. Sci. 2016, 44, 156–160. [Google Scholar] [CrossRef]
  27. Dominati, E.; Patterson, M.; Mackay, A. A framework for classifying and quantifying the natural capital and ecosystem services of soils. Ecol. Econ. 2010, 69, 1858–1868. [Google Scholar] [CrossRef]
  28. Dominati, E.J. Natural capital and ecosystem services of soils. Ecosyst. Serv. N. Z. Cond. Trends 2013. [Google Scholar] [CrossRef] [Green Version]
  29. Zhang, Z.P. The analysis of green landscape pattern and evaluation of the small town in Yinzhou District based on GIS. Zhejiang Agric. For. Univ. 2012, 12, 39–40. [Google Scholar]
  30. Wang, C.H.; Wen, Y.L.; Li, Q.; Gao, H.B. Research on measurement of ecological benefit in Qinling natural reserve group based on connotation analyses. China Popul. Resour. Environ. 2011, 21, 125–134. [Google Scholar]
  31. Luo, Y. Study on Eco-Environmental Water Demand in Zhangxi River Basin of Ningbo City. Master’s Thesis, Zhejiang University, Hangzhou, China, 2006. [Google Scholar]
  32. Nguyen, M.D.; Ancev, T.R. Forest governance and economic values of forest ecosystem services in Vietnam. Land Use Policy 2018, 3, 1–17. [Google Scholar] [CrossRef]
  33. Bao, D.E.; Mo, J.W.; Hou, B.; Liu, L.C.; Yao, X.Y. Characteristics of land use change in Siming Mountain, Ningbo. J. Zhejiang Agric. Sci. 2017, 58, 1626–1628, 1632. [Google Scholar] [CrossRef]
  34. Intergovernmental Panel on Climate Change (IPCC). Climate Change: The Physical Science Basis, Contribution of Working Group I to the Fourth Assessment Report of the Intergovernmental Panel on Climate Change; Solomon, S., Qin, D., Manning, M., Chen, Z., Marquis, M., Averyt, K.B., Tignor, M., Miller, H.L., Eds.; Cambridge University Press: Cambridge, UK, 2007. [Google Scholar]
  35. Ngwenya, S.J.; Torquebiau Ferguson, J.W.H. Mountains as a critical source of ecosystem services: The case of the Drakensberg, South Africa. Environ. Dev. Sustain. 2018, 1, 1–18. [Google Scholar] [CrossRef]
  36. Liu, S.; Mo, X.; Lin, Z.; Xu, Y.; Ji, J.; Wen, G.; Richey, J. Crop yield responses to climate change in the Huang-Huai-Hai Plain of China. Agric. Water Manag. 2010, 97, 1195–1209. [Google Scholar] [CrossRef]
  37. Hossain, S.; Dearing, J.A.; Rahman, M.M.; Salehin, M. Recent changes in ecosystem services and human well-being in the Bangladesh coastal zone. Reg. Environ. Chang. 2016, 16, 429–443. [Google Scholar] [CrossRef] [Green Version]
  38. Fu, D.F.; Singh, R.P.; Yang, X.D.; Ojha, C.S.P.; Surampalli, R.Y. Sediment in-situ bioremediation by immobilized microbial activated beads: Pilot-scale study. J. Environ. Manag. 2018, 226, 62–69. [Google Scholar] [CrossRef]
  39. Knüppe, K.; Pahl-Wostl, C.; Vinke-de Kruijf, J. Sustainable Groundwater Management: A Comparative Study of Local Policy Changes and Ecosystem Services in South Africa and Germany. Environ. Policy 2016, 26, 59–72. [Google Scholar] [CrossRef]
  40. Griebler, C.; Avramov, M. Groundwater ecosystem services: A review. Freshw. Sci. 2015, 34, 355–367. [Google Scholar] [CrossRef] [Green Version]
  41. Munns, W.R., Jr.; Rea, A.W.; Suter, G.W.; Martin, L.; Blake-Hedges, L.; Crk, T.; Davis, C.; Ferreira, G.; Jordan, S.; Mahoney, M.; et al. Ecosystem services as assessment endpoints for ecological risk assessment. Integr Environ. Assess. Manag. 2016, 12, 523–529. [Google Scholar] [CrossRef]
  42. Bergkamp, G.; Cross, K. Groundwater and ecosystem services: Towards their sustainable use. In Proceedings of the International Symposium on Groundwater Sustainability (ISGWAS), Alicante, Spain, 24–27 June 2006. [Google Scholar]
  43. Kong, Y.L.; Wang, K.; Pu, T. Nonmonsoon precipitation dominates groundwater recharge beneath a monsoon affected glacier in Tibetan Plateay. J. Geopphys. Res. Atmos. 2019, 124, 10913–10930. [Google Scholar] [CrossRef]
  44. Birkinshaw, S.J.; Guerreiro, S.B.; Nicholson, A.; Liang, Q.H.; Quinn, P. Climate change impacts on Yangtze River discharge at the three gorges dam. Hydrol. Earth Syst. Sci. 2017, 21, 1911–1927. [Google Scholar] [CrossRef] [Green Version]
  45. Gao, G.; Wang, J.; Guo, W.; Pei, Y.S. Nitrogen removal from three-stage oxidation-reduction system by simulation of the riparian environment. Procedia Environ. Sci. 2010, 2, 1997–2004. [Google Scholar] [CrossRef] [Green Version]
  46. Huang, L.; Gao, X.; Liu, M.; Du, G.; Guo, J.S. Correlation among soil microorganisms, soil enzyme activities, and removal rates of pollutants in three constructed wetlands purifying micro-polluted river water. Ecol. Eng. 2012, 46, 98–106. [Google Scholar] [CrossRef]
  47. Hopkins, K.G.; Noe, G.B.; Franco, F.; Pindilli, E.J.; Gordon, S. A method to quantify and value floodplain sediment and nutrient retention ecosystem services. J. Environ. Manag. 2018, 220, 65–76. [Google Scholar] [CrossRef] [PubMed]
  48. Lin, Z.S.; Ye, X.Y.; Wei, Q.; Xin, F.; Lu, Z. Ecosystem services value assessment and uneven development of the Qingjiang River Basin in China. Sustainability 2017, 9, 2356. [Google Scholar] [CrossRef] [Green Version]
  49. Sheng, H.-X.; Xu, H.; Zhang, L.; Chen, W. Ecosystem intrinsic value and its application in decision-making for sustainable development. J. Nat. Conserv. 2019, 49, 27–36. [Google Scholar] [CrossRef]
  50. Mikhailenko, A.V.; Ruban, D.A. Geoheritage in Deltaic Environments: Classification Notes, Case Example, and Geopark Implication. Environments 2019, 6, 18. [Google Scholar] [CrossRef] [Green Version]
  51. Xu, H.N.; Sheng, H.X.; Chen, W.Q.; Fang, Q.H. Concept and Evaluation of Ecosystem Intrinsic Value. J. Agric. Sci. Technol. B 2015, 5, 401–409. [Google Scholar]
  52. Romer, D. Advanced Macroeconomics, 3rd ed.; McGraw-Hill Higher Education: New York, NY, USA, 2005. [Google Scholar]
Figure 1. Location of study area and land use map of the Zhangxi catchment, created by the authors from data sources described in Section 2.2 of this publication.
Sustainability 12 01699 g001
Figure 2. Economic value of Earth’s critical zone.
Sustainability 12 01699 g002
Table 1. Economic value of air that humans breathe from various individual sources.
Economic ValueUnit Cost/PriceLocationReference
Market price of compressed air£ 2 m−3Great Britain[20]
Reduce air pollution$0.018 m−3·person−1·day−1Rabat-Salé (Morocco)[22]
Anticipated damages of N2O to climate change$1.24–3.10 kg−1 NAmerica[23]
Human health costs of NOx$23.07 kg−1 NChesapeake Bay (America)[24]
Human health costs of NH3$1.30–8.56 kg−1 NChesapeake Bay (America)[24]
Table 2. Shannon–Wiener index classification value in species conservation.
ClassificationShannon–Wiener IndexPrice per Unit (CNY ha−1·yr−1)
1Index >= 650,000
25 <= Index < 640,000
34 <= Index < 530,000
43 <= Index < 420,000
52 <= Index < 310,000
61 <= Index < 25000
7Index < 13000
Source: China National Forestry Assessment Standards ‘Forest Ecosystem Service Function Assessment Specification’ (LY/T1721-2008).
Table 3. Economic value of Earth’s critical zone (USD).
Earth’s Critical Zone (CZ) ServicesProvisioningRegulatingCulturalTotal CZV 1 (USD·yr−1·106)
CZ ServicesEconomic ValueCZ ServicesEconomic ValueCZ ServicesEconomic Value
AtmosphereAir that humans breathe4.94 4.94
VegetationFood production88.17Climate regulation2.55 96.17
Waste treatment1.84
Water regulation0.27
Erosion control0.15
Biological control3.19
Soil Carbon sequestration0.42 7.72
Filtering of nutrients and contaminants7.30
Surface water Water storage and supply0.11Water purification and waste treatment2.29Recreation and tourism services3.025.42
Groundwater Freshwater storage and supply1.85Water purification and waste treatment0.04 1.89
Total95.0818.033.02116.14
1 CZV has been defined in Section 2.3 for this publication.
Table 4. Stocks and flows of Earth’s critical zone 1.
Earth’s Critical Zone ServicesStocks/FlowsScaleUnit PriceTotal Economic Value
(USD·yr−1·10−6)
Atmosphere
Air that humans breathe5475 m3·person−1·year−147,178 person$0.018 m−3·person−1·day−14.94
Vegetation
Food productionYield (kg·ha−1·year−1)haMarket prices88.17
Climate regulationThe climatic adjustment ecosystem value of forest in terrestrial China 70.51 km2$360.89 ha−1·year−12.55
Waste treatment10,110 kg·ha−1·year−170.51 km2$25.68 t−11.84
Water regulation192.4 mm·year−173.06 km2$0.02 m−30.27
Erosion control1060 t·km−2·year−1170.51 km2$1.96 t−10.15
Biological controlShannon–Wiener index < 170.51 km2$453.17 ha−1·year−13.19
Soil
Carbon sequestration19.1 g·kg−1 (0–10 cm)86.08 km2$50 t−10.42
13.9 g·kg−1 (10–20 cm)
Filtering of nutrients and contaminants0.4−4.5 g·kg−1 (0–10 cm)86.08 km2$302.11 t−17.30
0.1−2.73 g·kg−1 (10–20 cm)
Surface water
Water storage and supply3800 m3·day−1365 day·year−1$0.07 m−30.11
Water purification and waste treatmentCOD: 190.1 t·year−10.73 km−2 $709.59 t−12.29
ammonia nitrogen: 15.24 t·year−1$1880.89 t−1
Recreation and tourism services0.1–0.15 million touristsLijiakeng villageMarket prices3.02
Groundwater
Fresh water storage and supply268.2 mm·year−191.59 km2$0.07 m−31.84
Water purification and waste treatment1.71 mg·L−191.59 km2$6 kg−10.04
1 The values for stocks and flows, or their proxy indicators in column 2, are scaled to the full geographical size of the study area according to the physical extent of the system, noted by the values in the third column titled Scale.

