Impacts of Urban Form on Thermal Environment Near the Surface Region at Pedestrian Height: A Case Study Based on High-Density Built-Up Areas of Nanjing City in China


Abstract
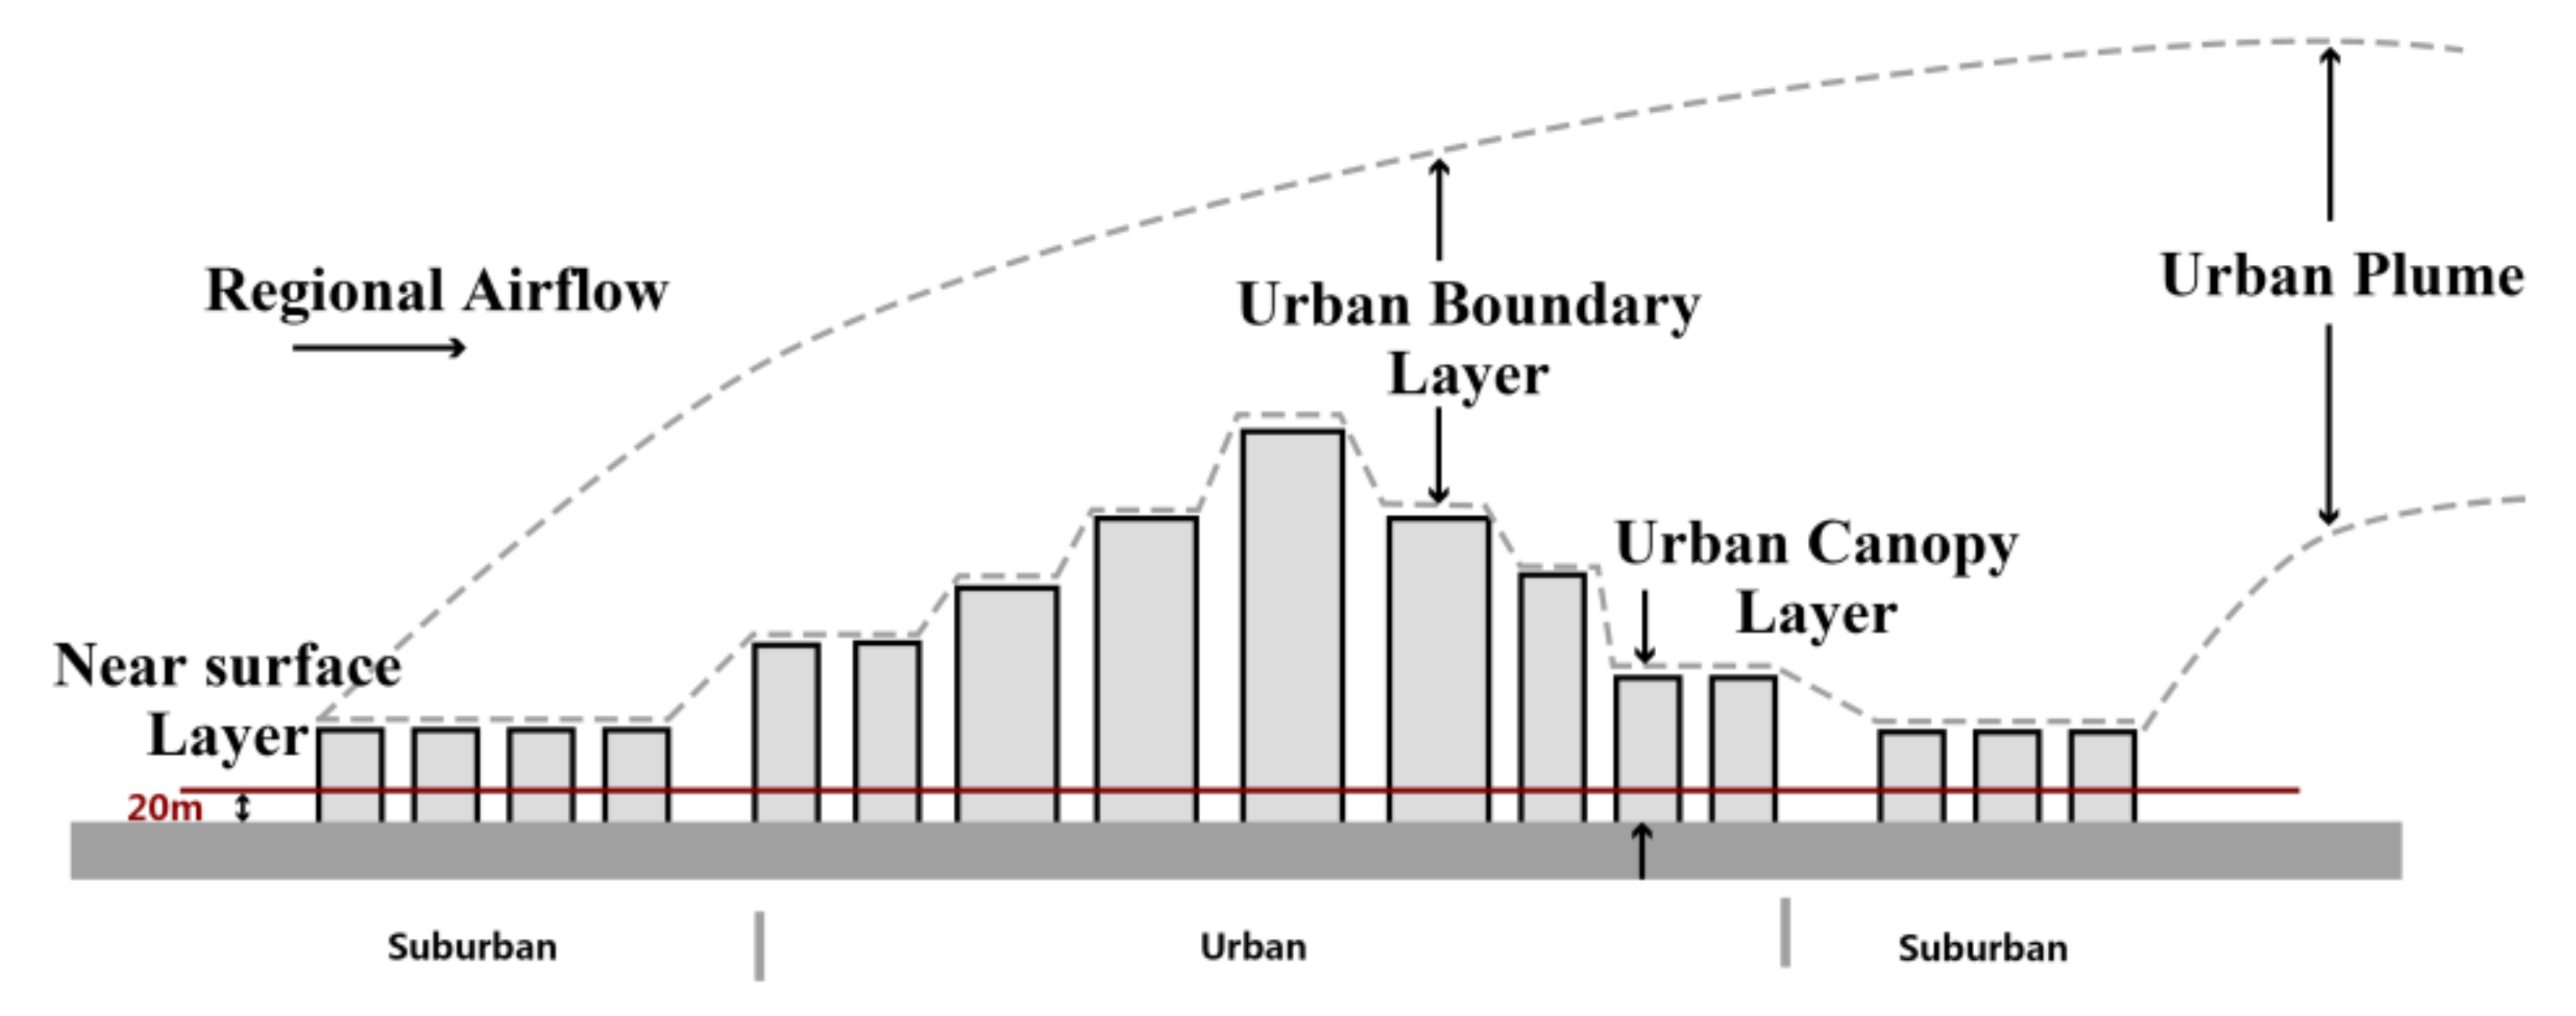
:1. Introduction
2. Measurement and Simulation Methods of Thermal Environments
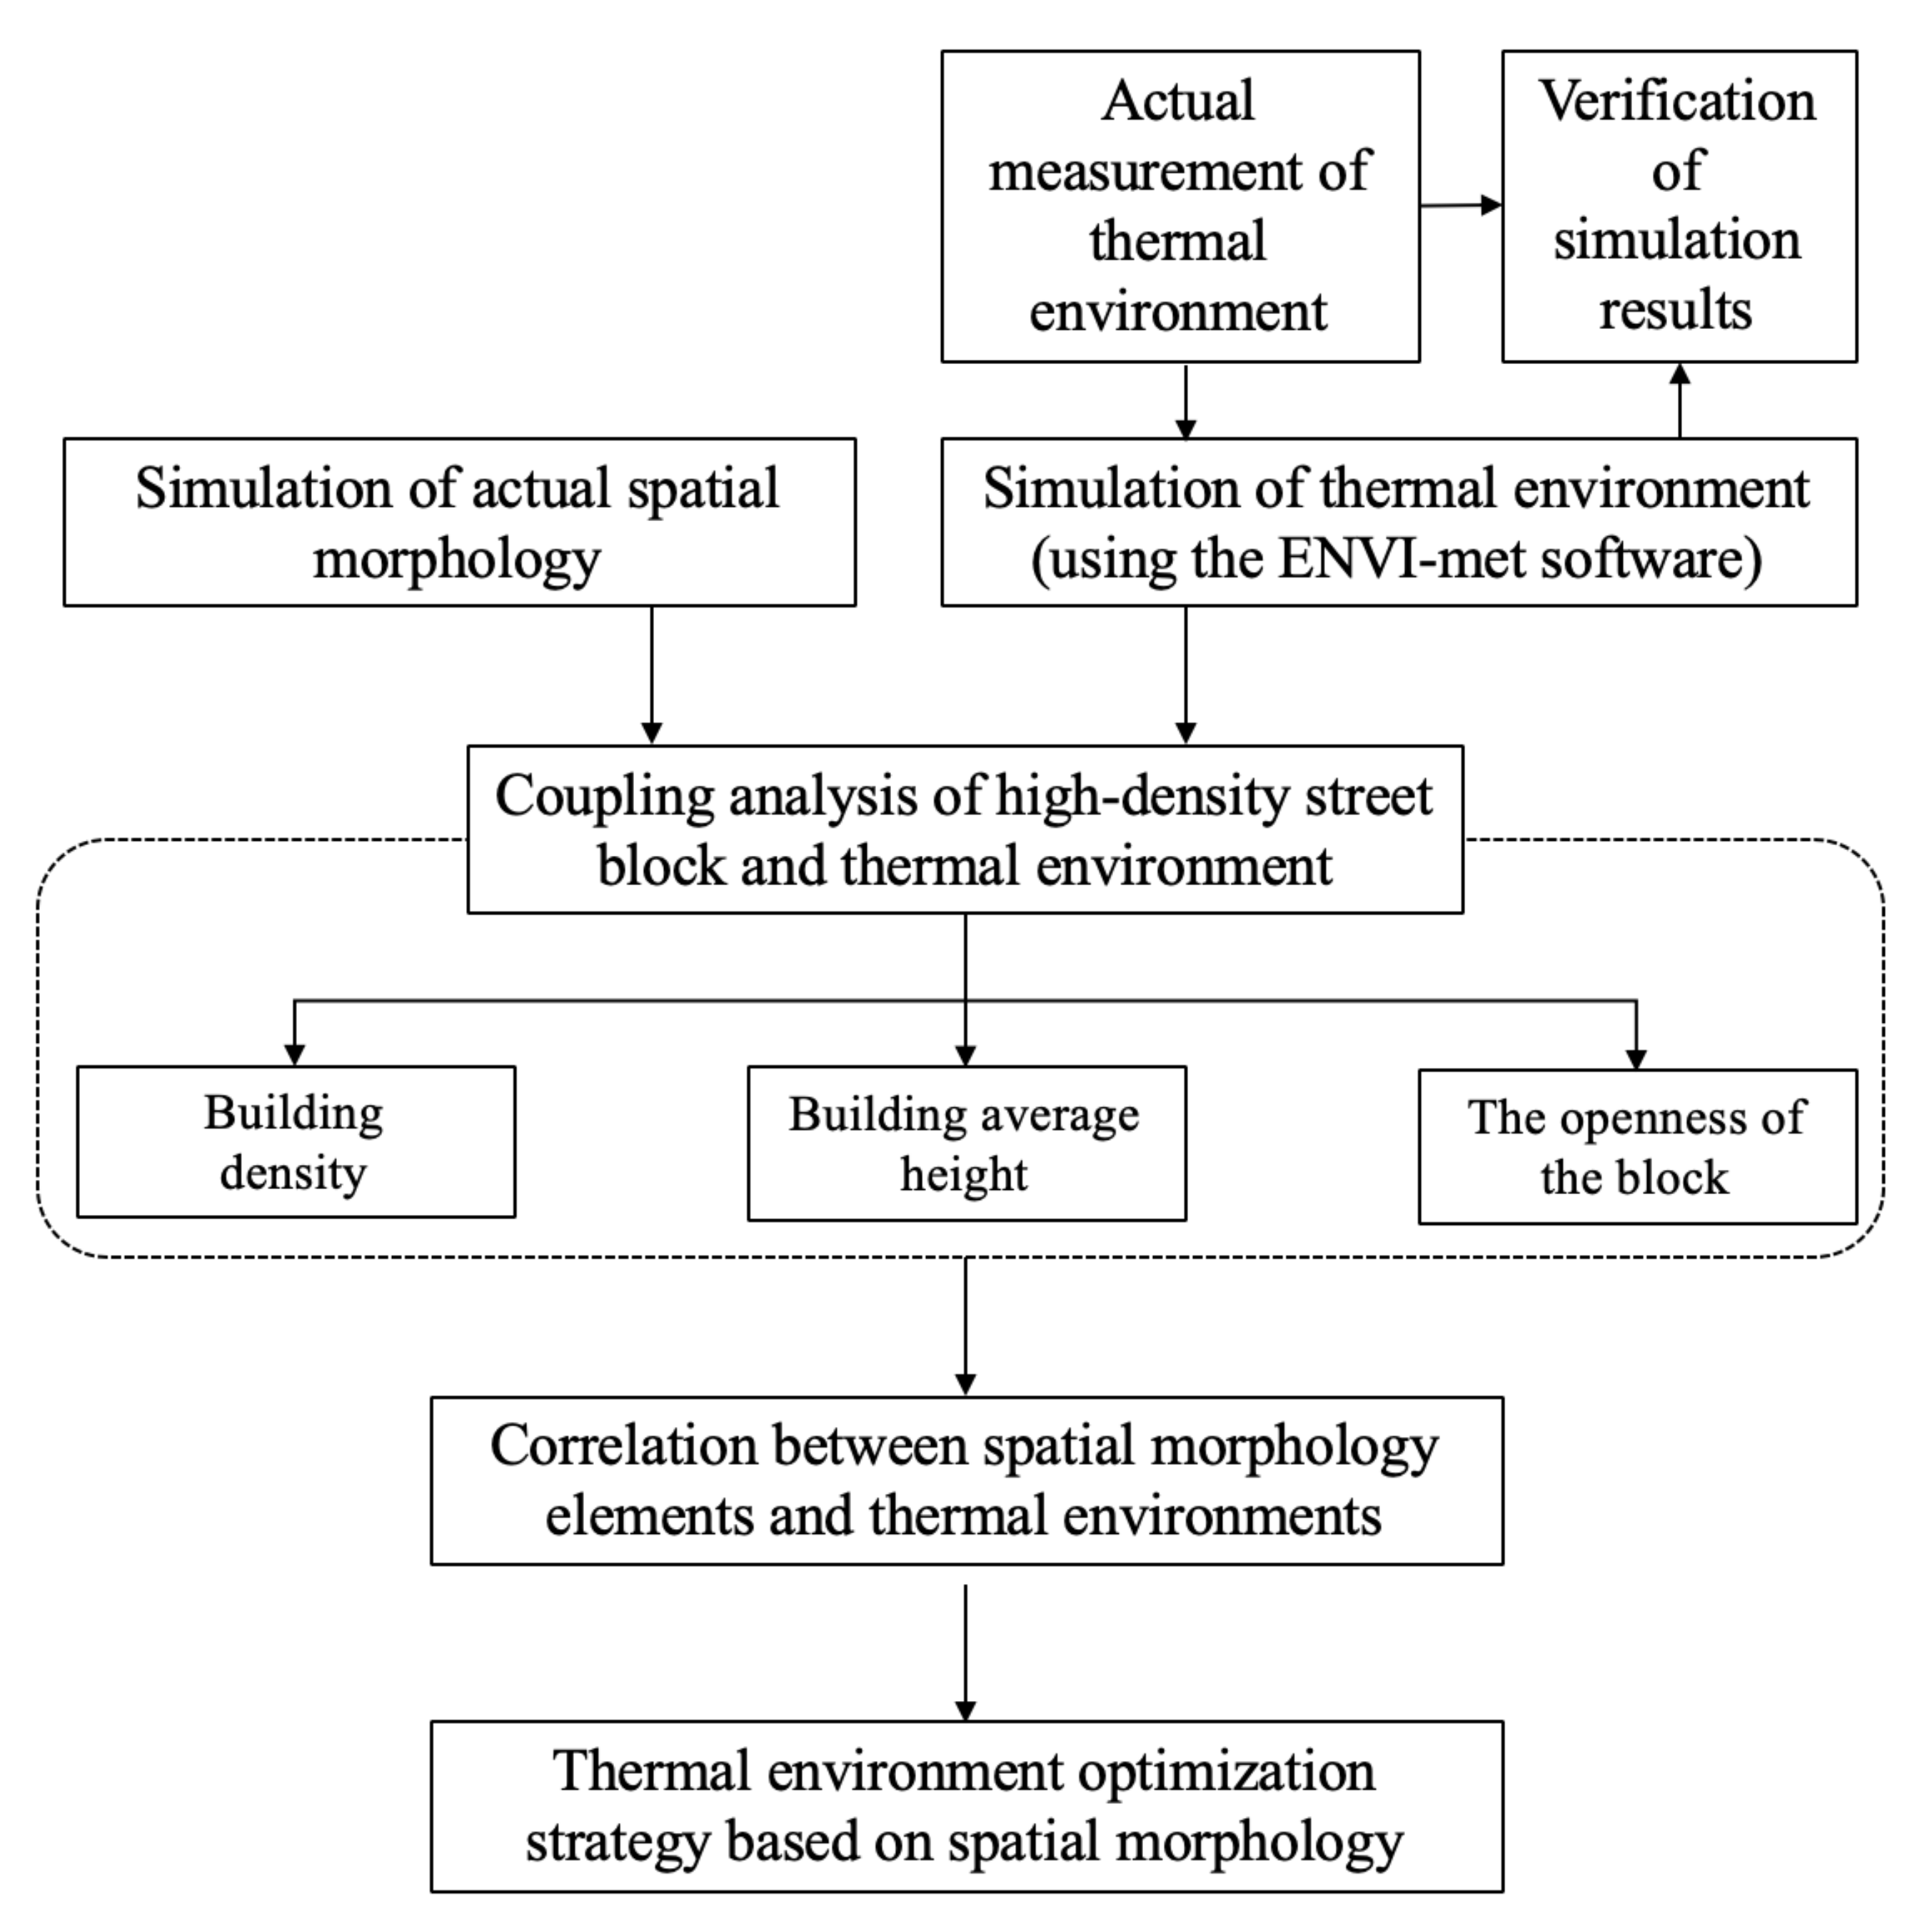
2.1. Study Framework
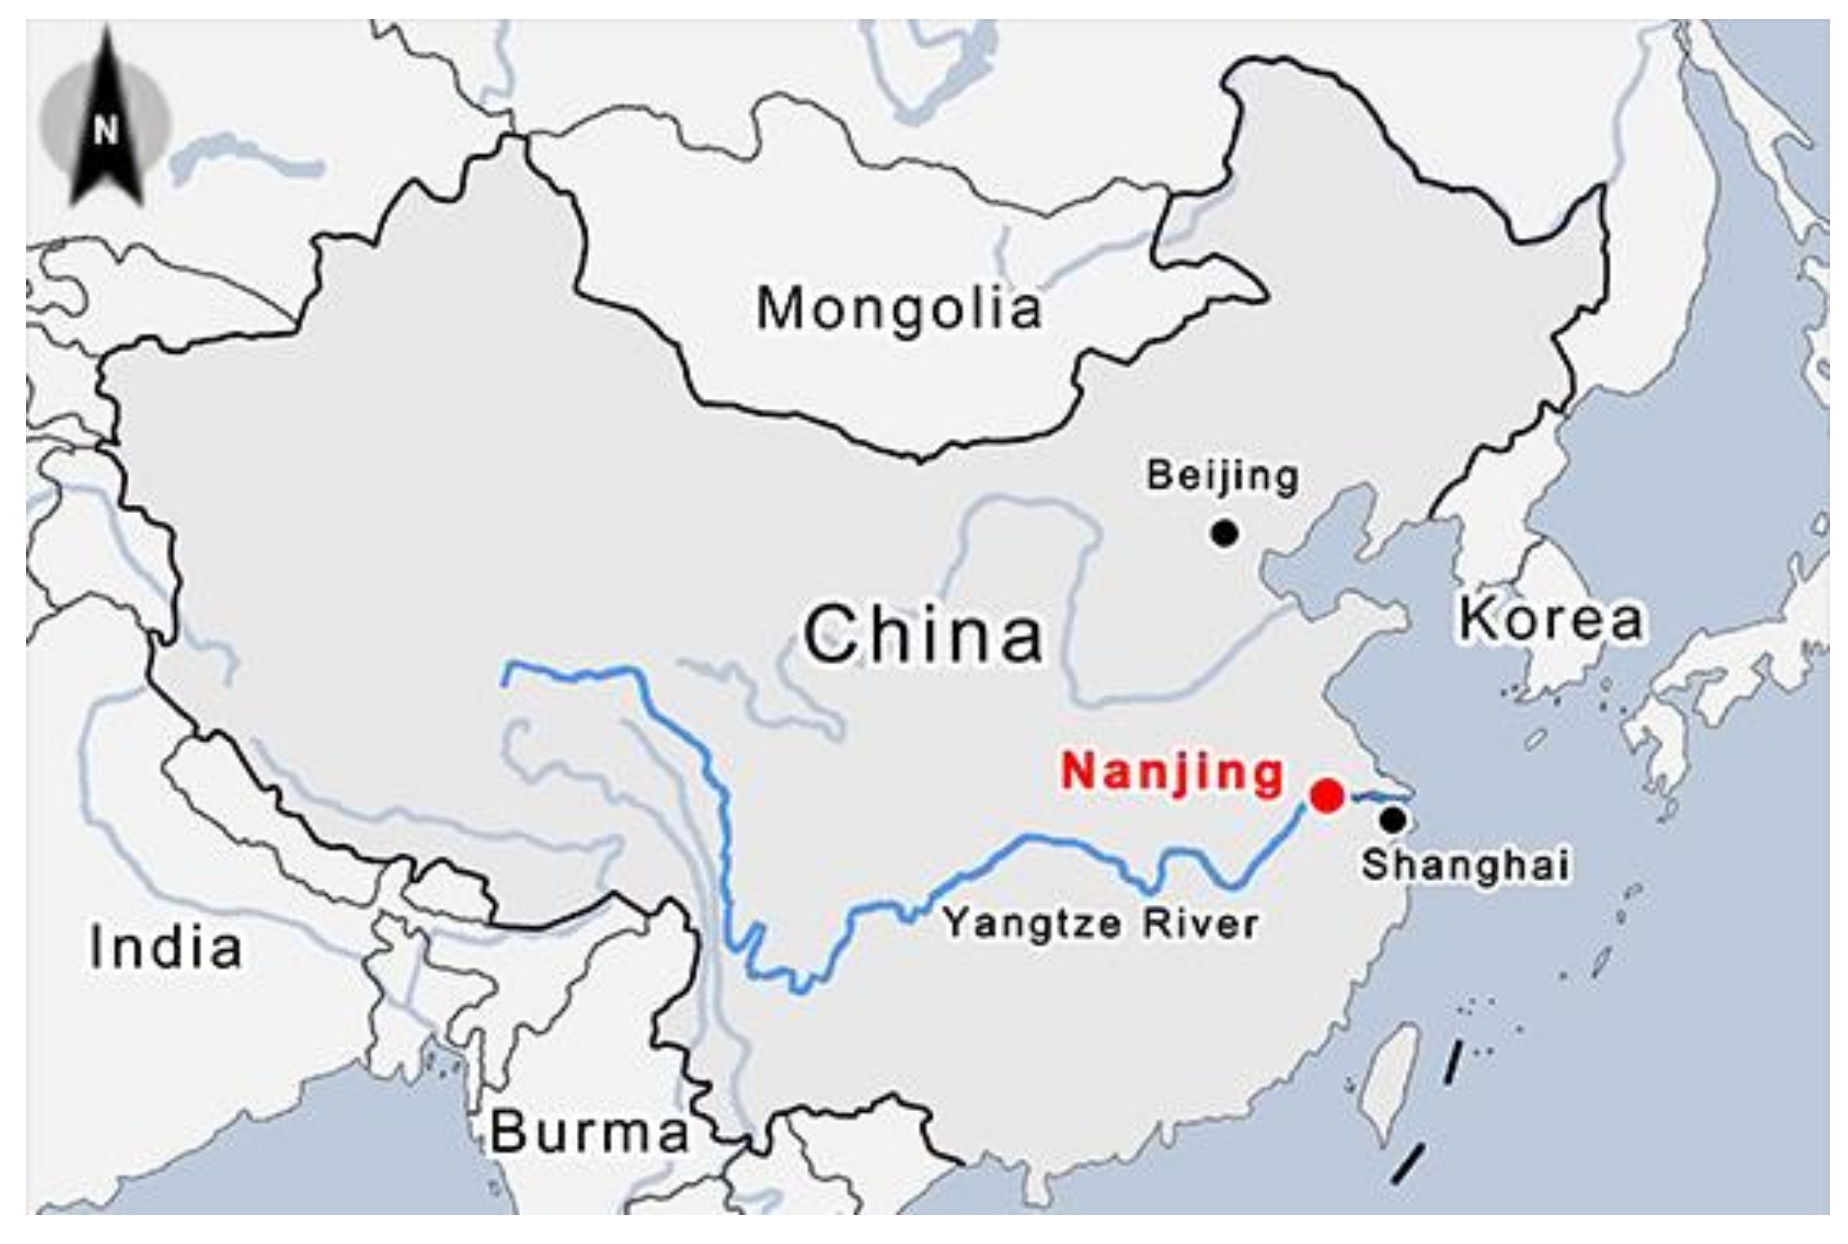
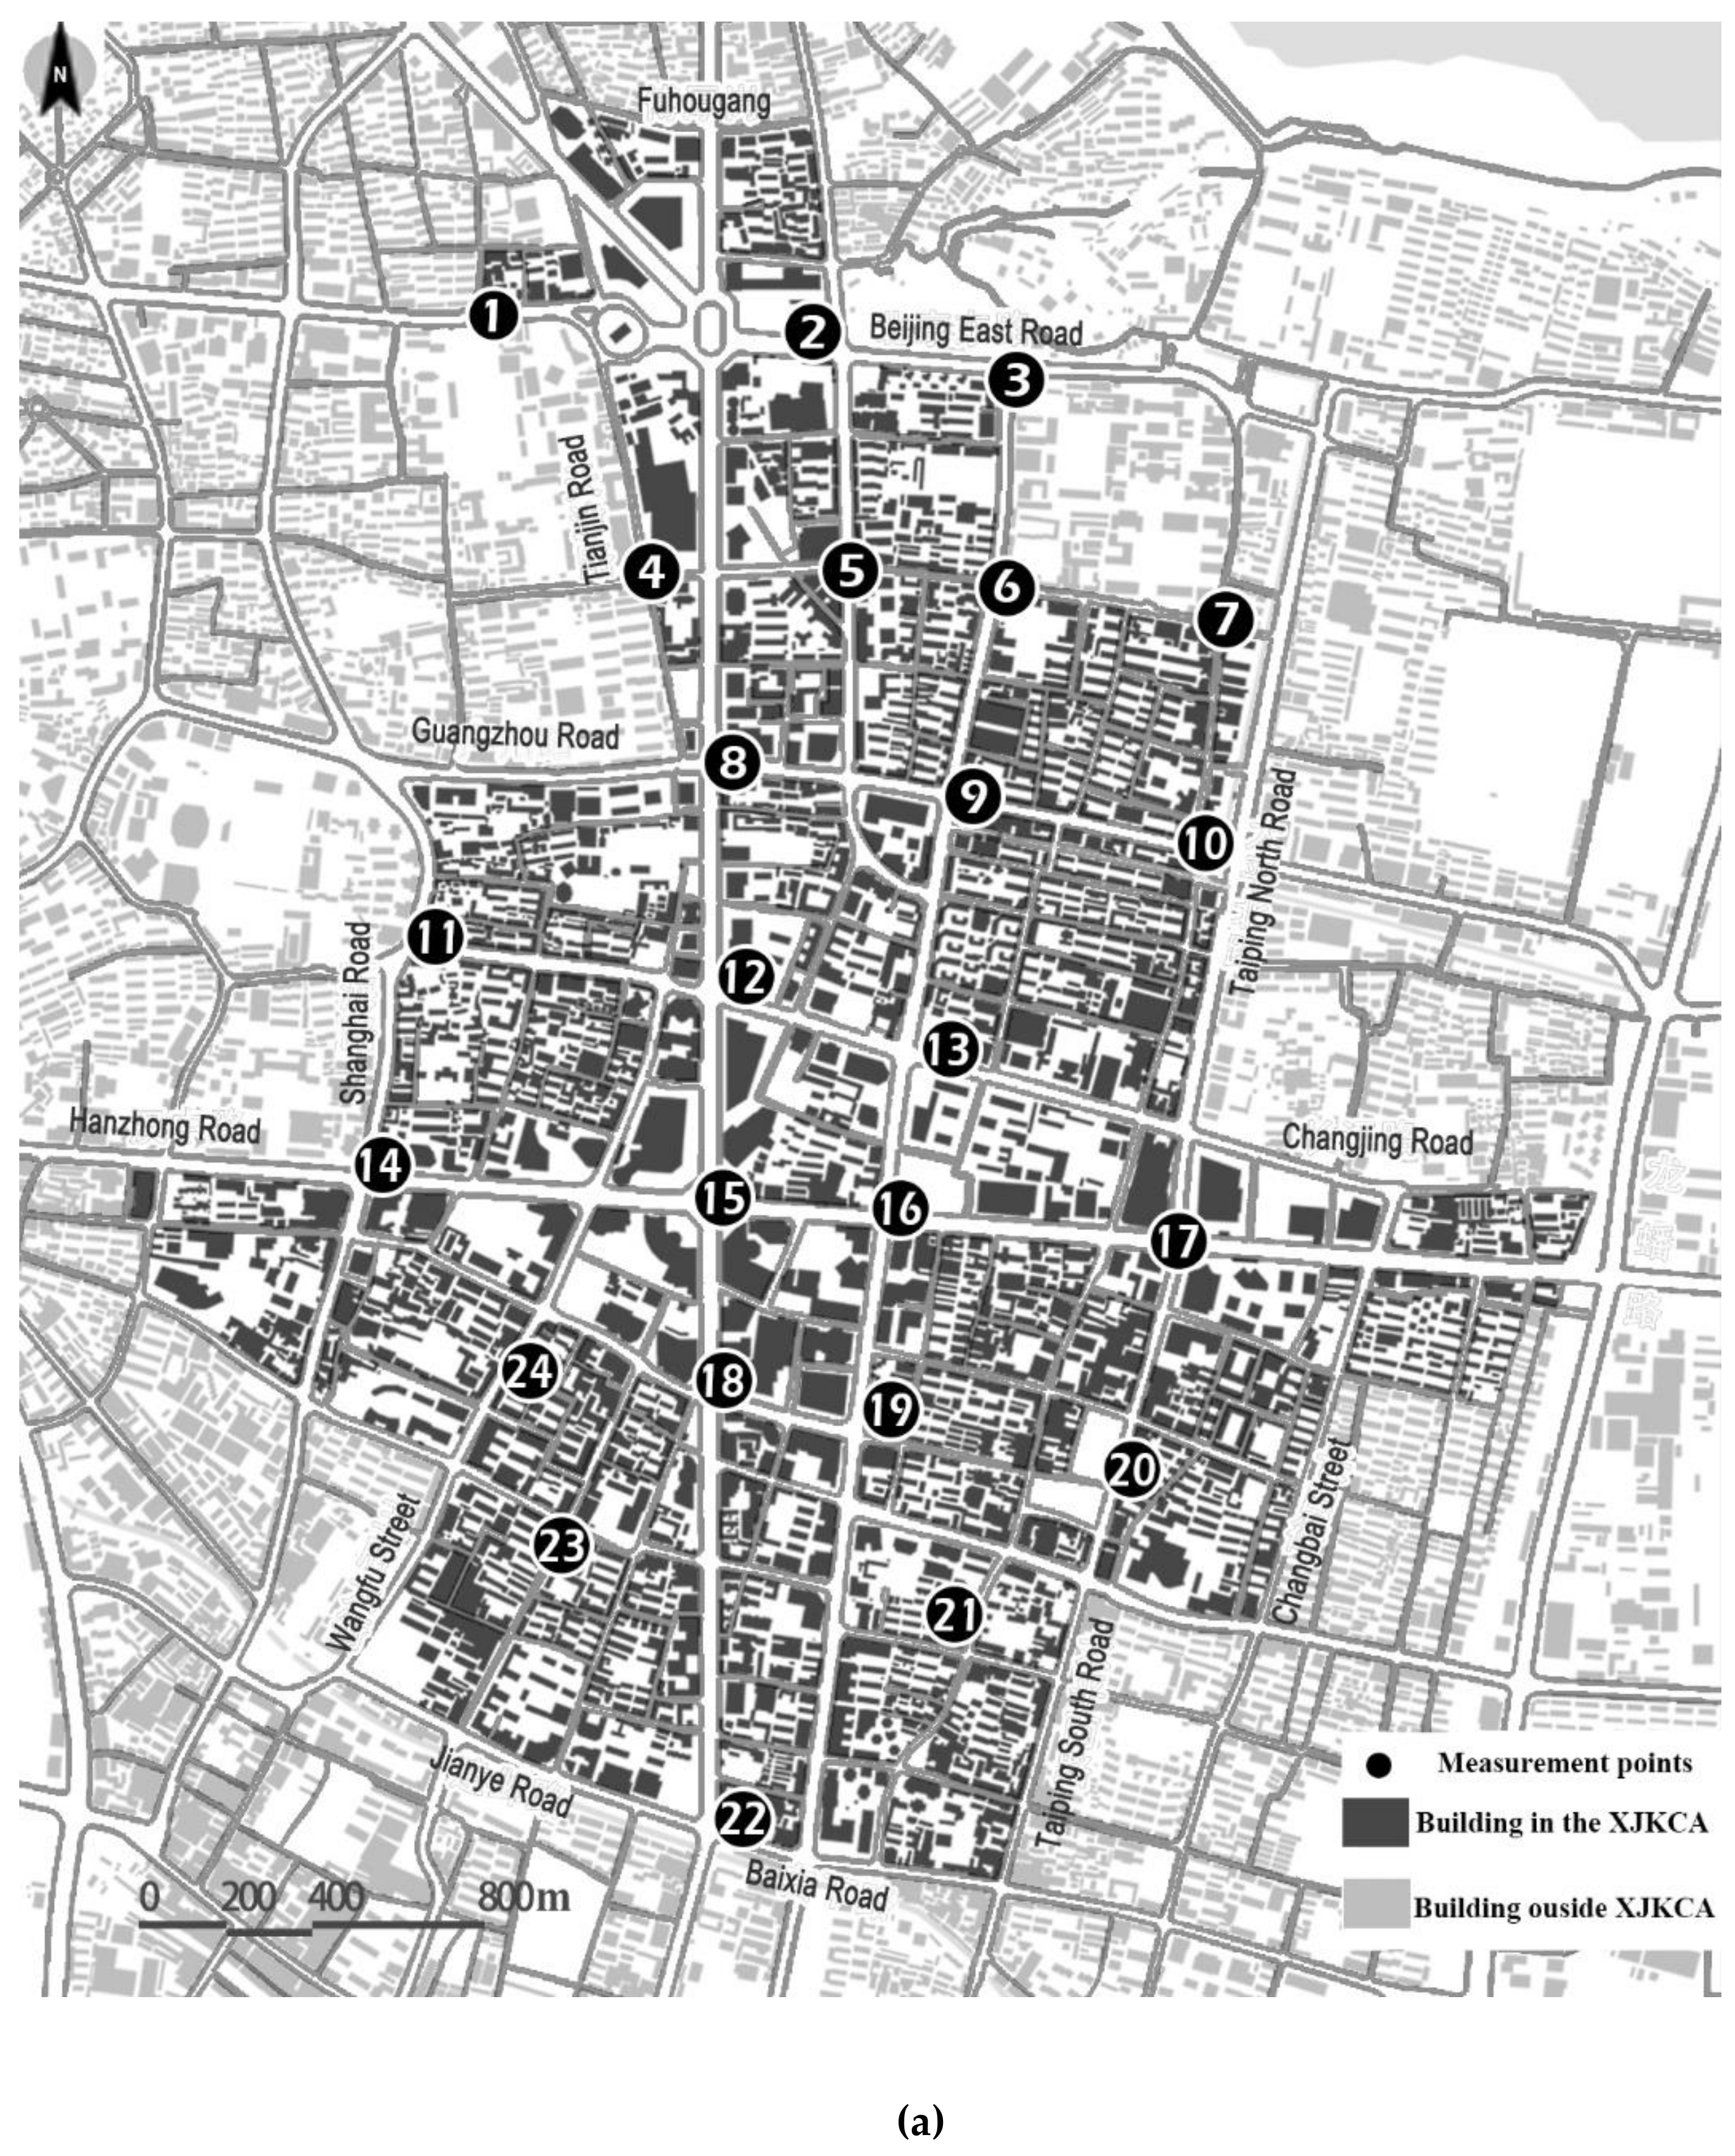
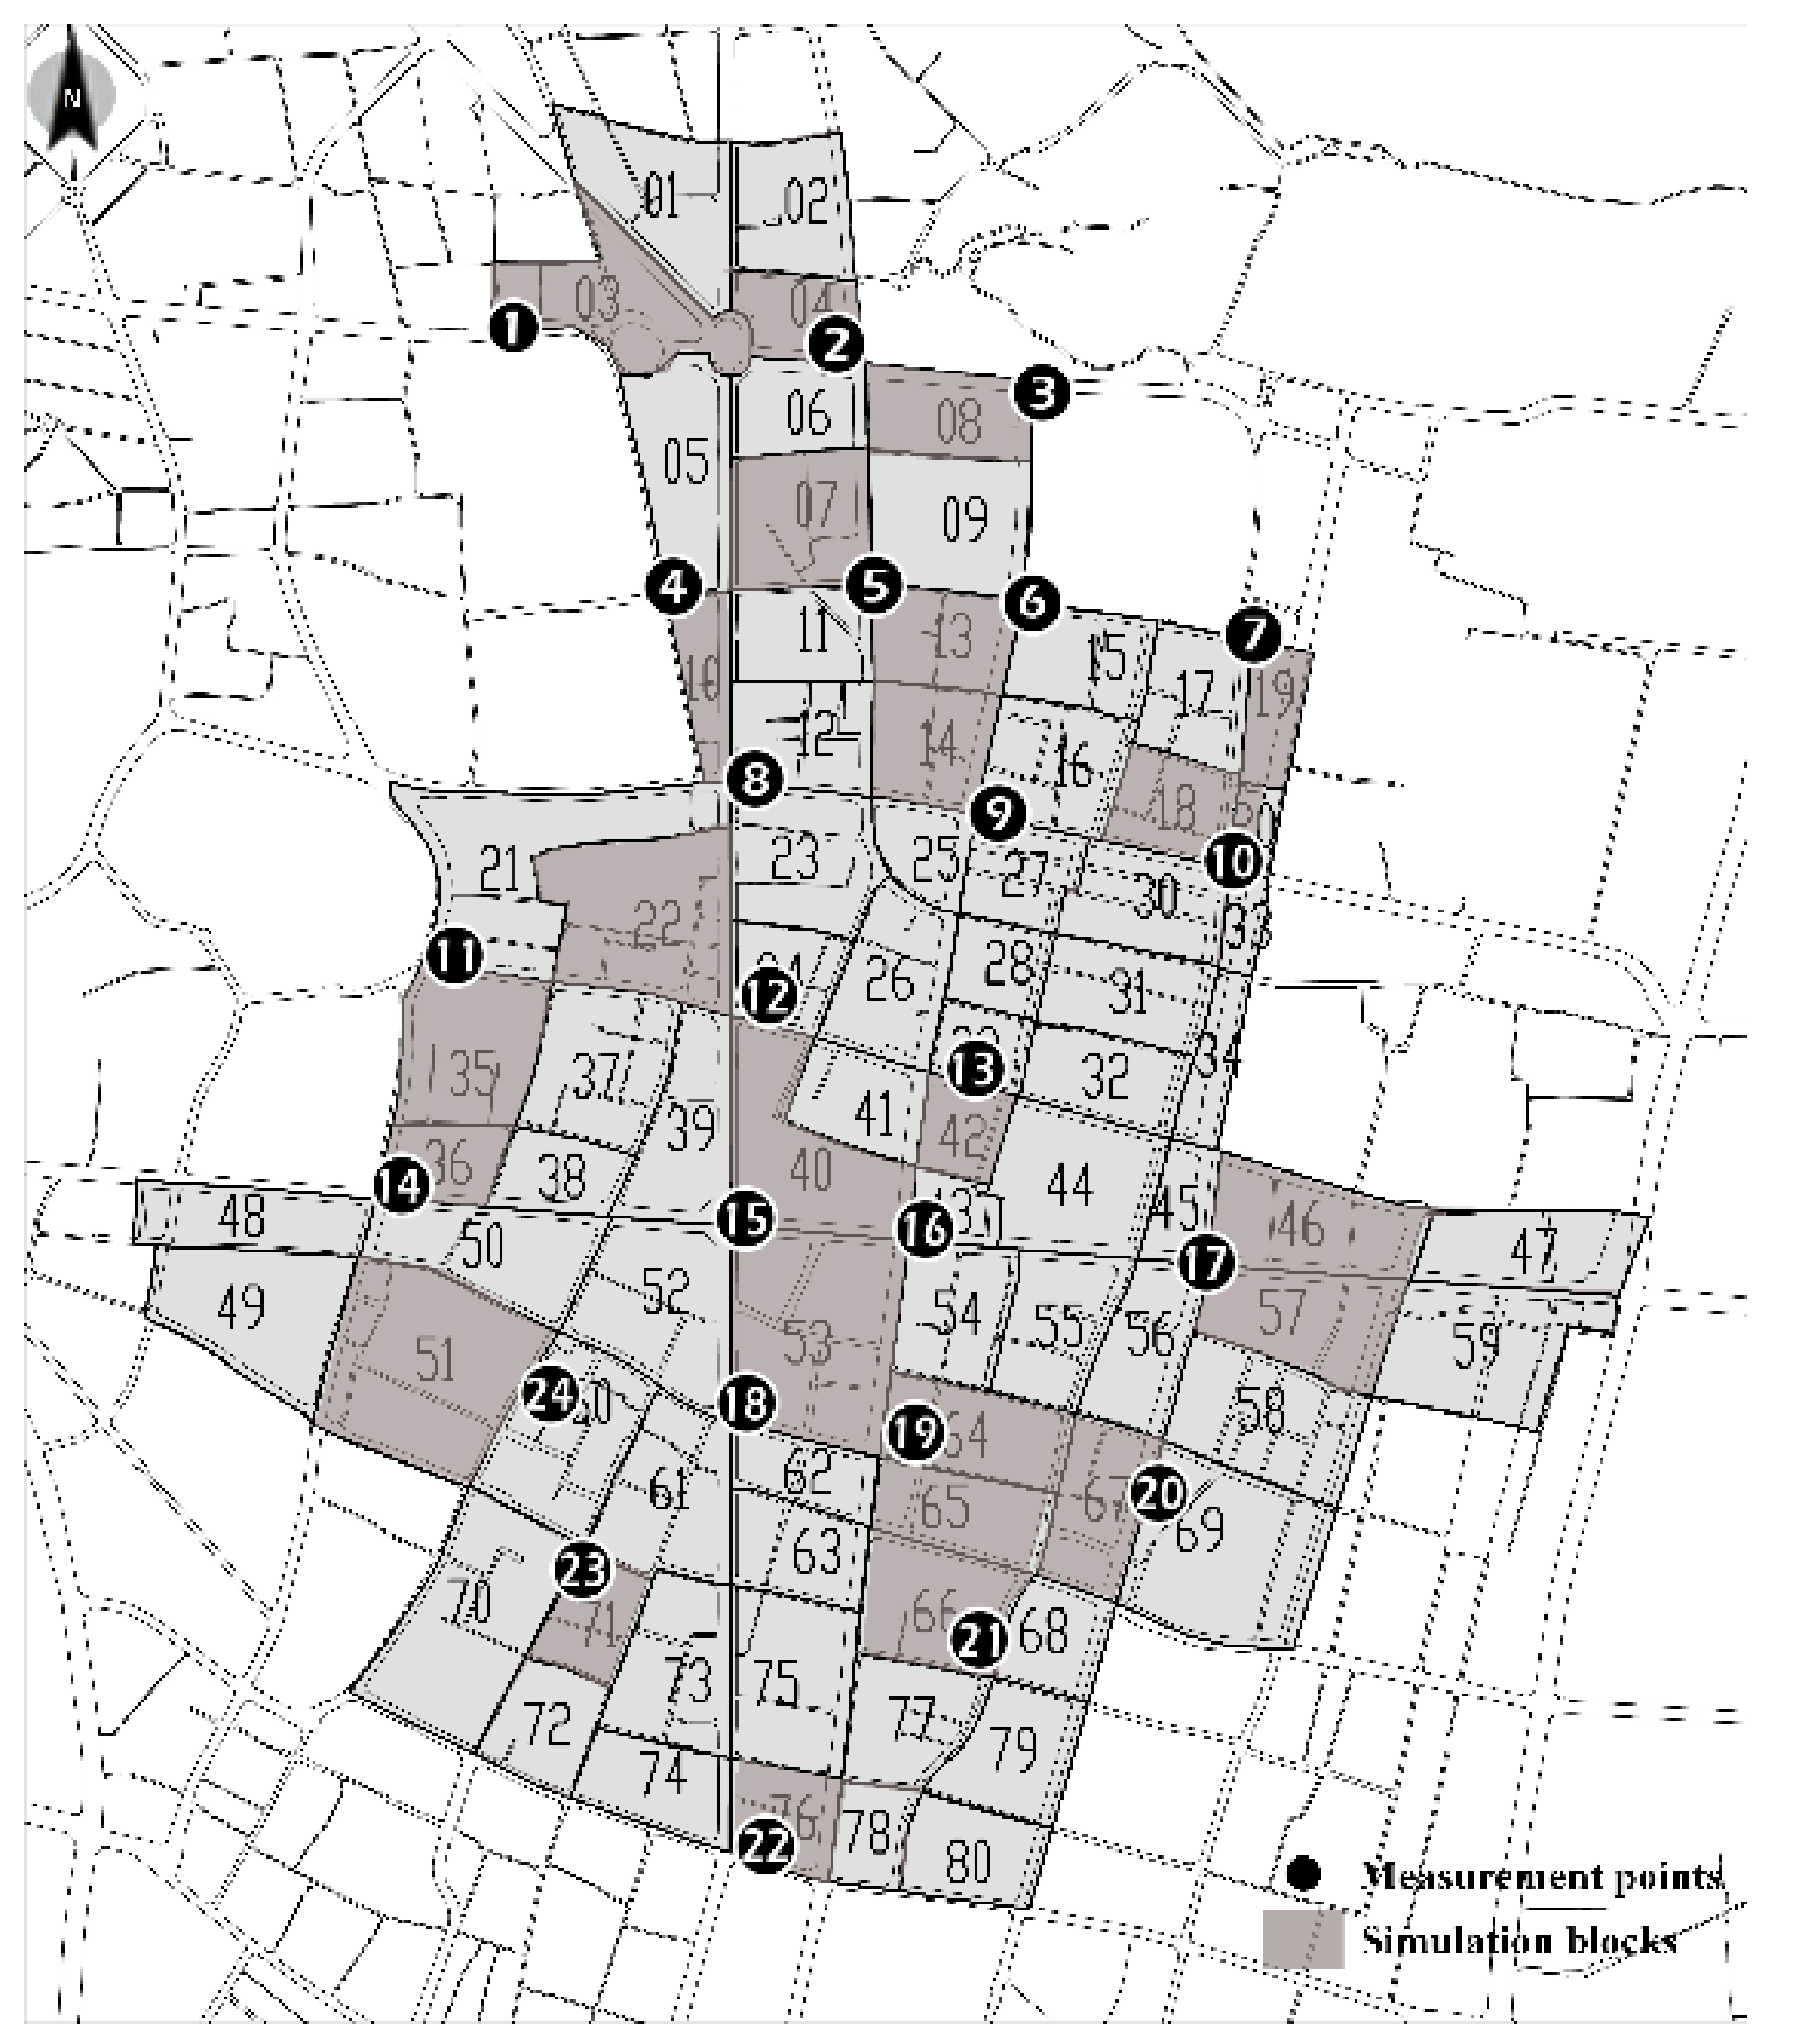
2.2. Study Case
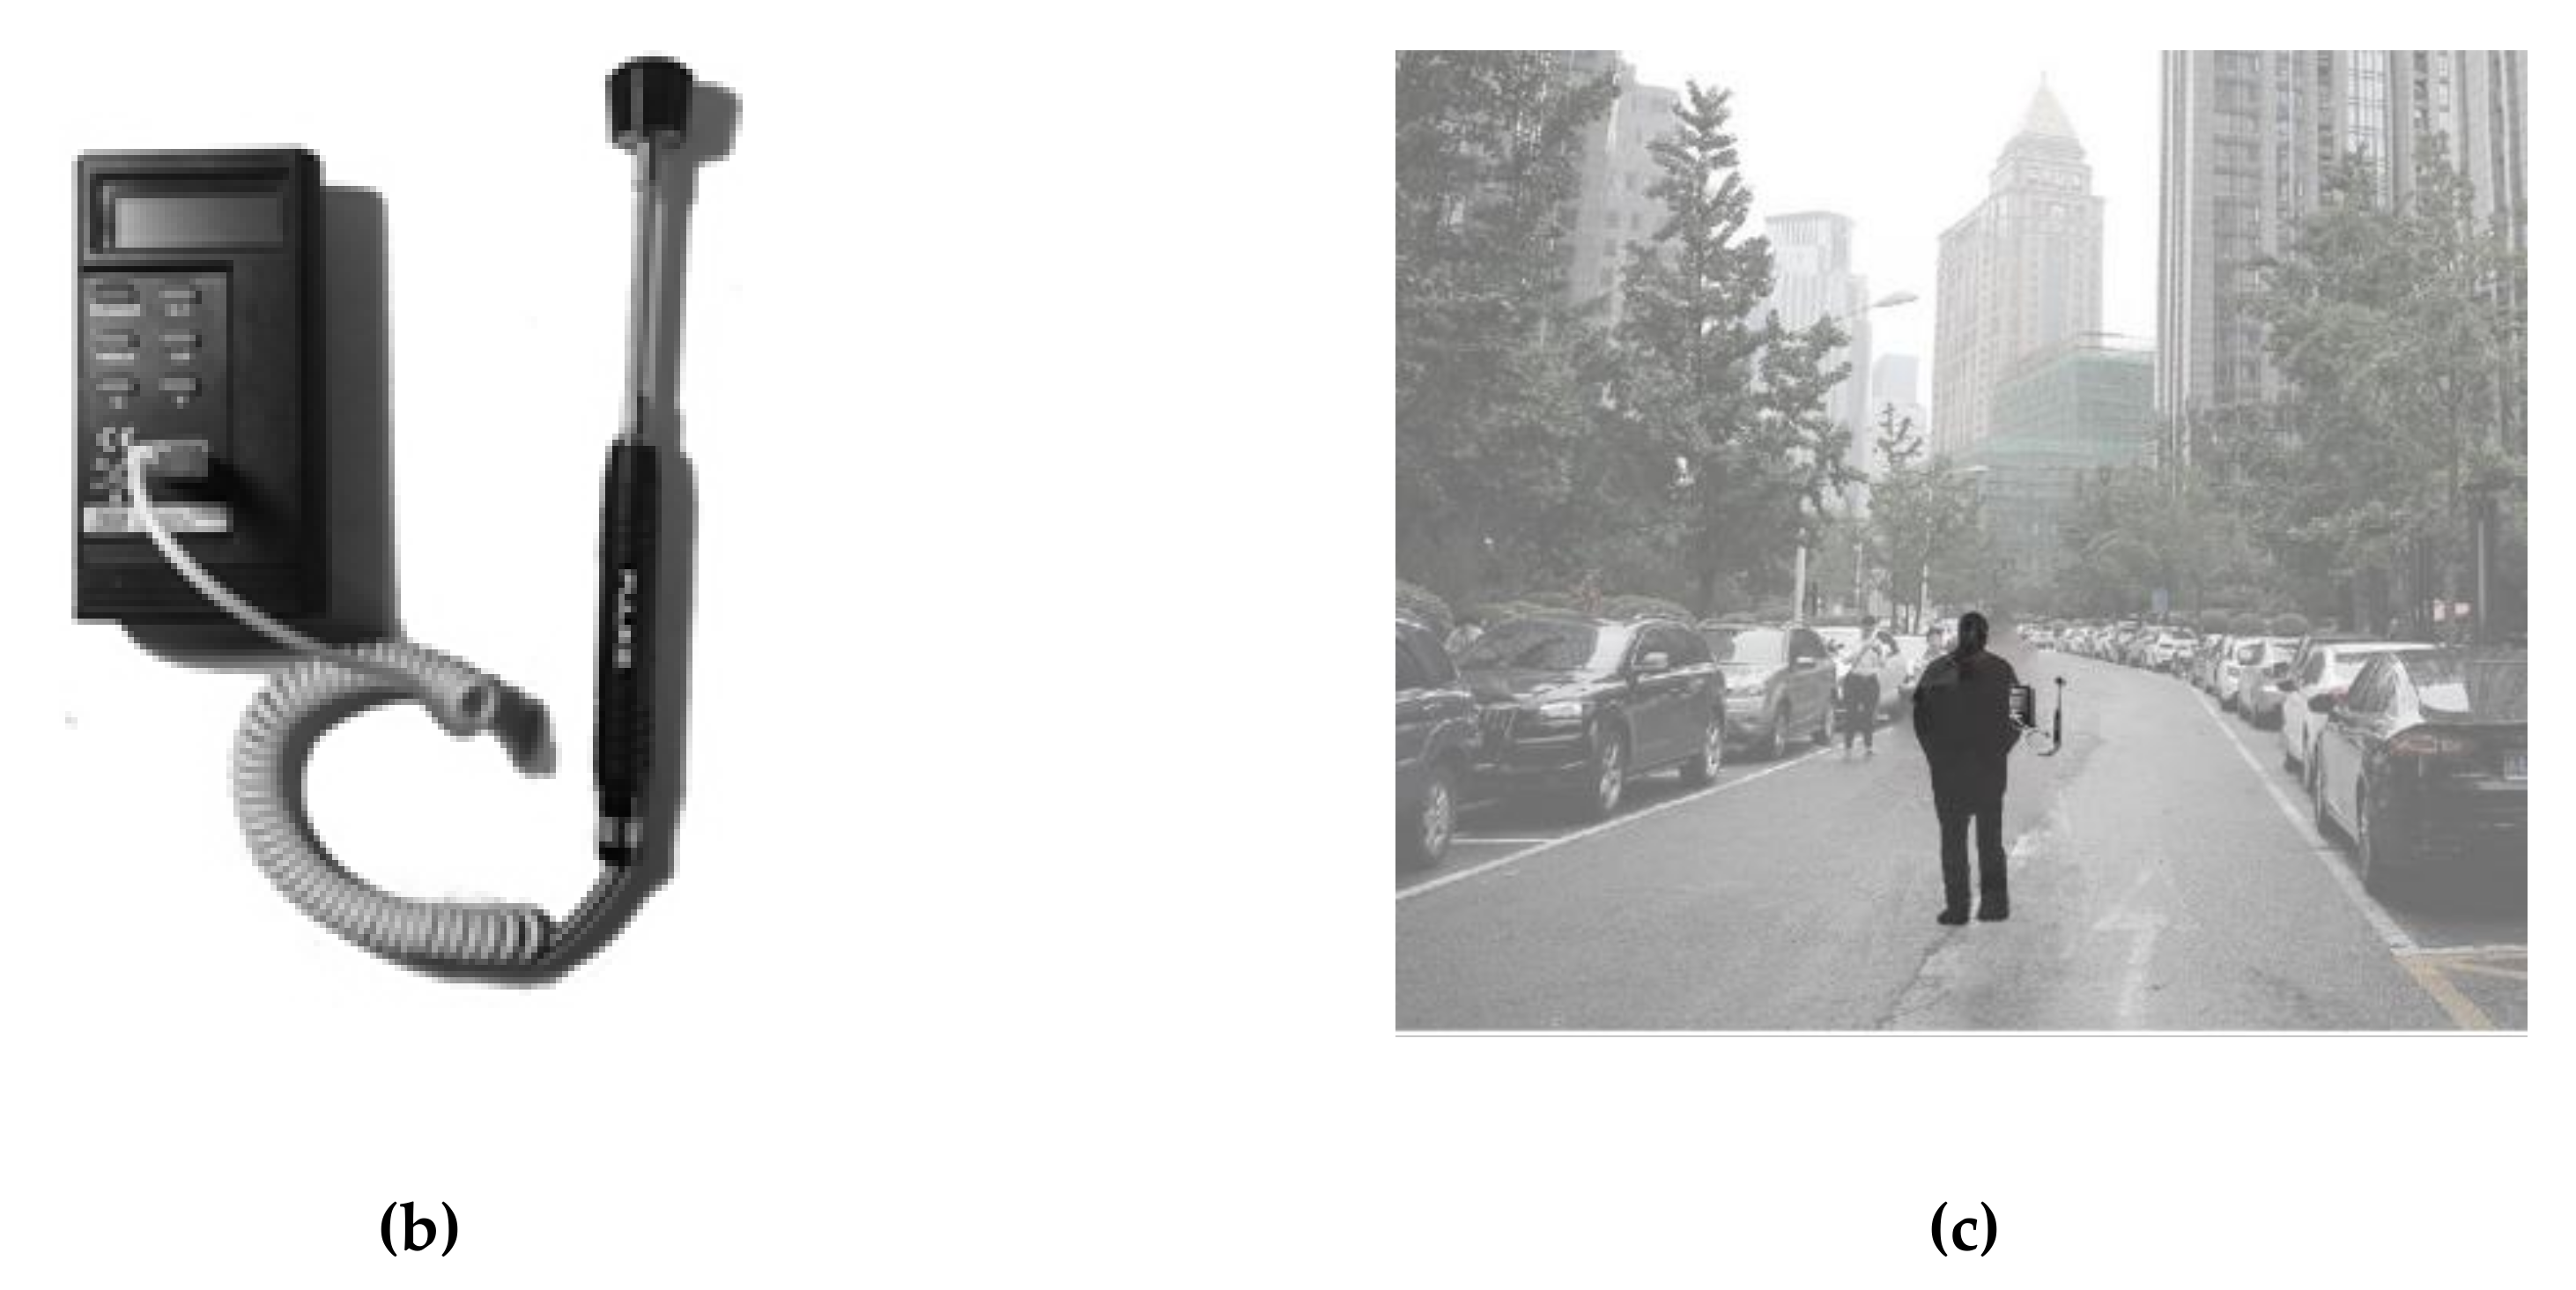
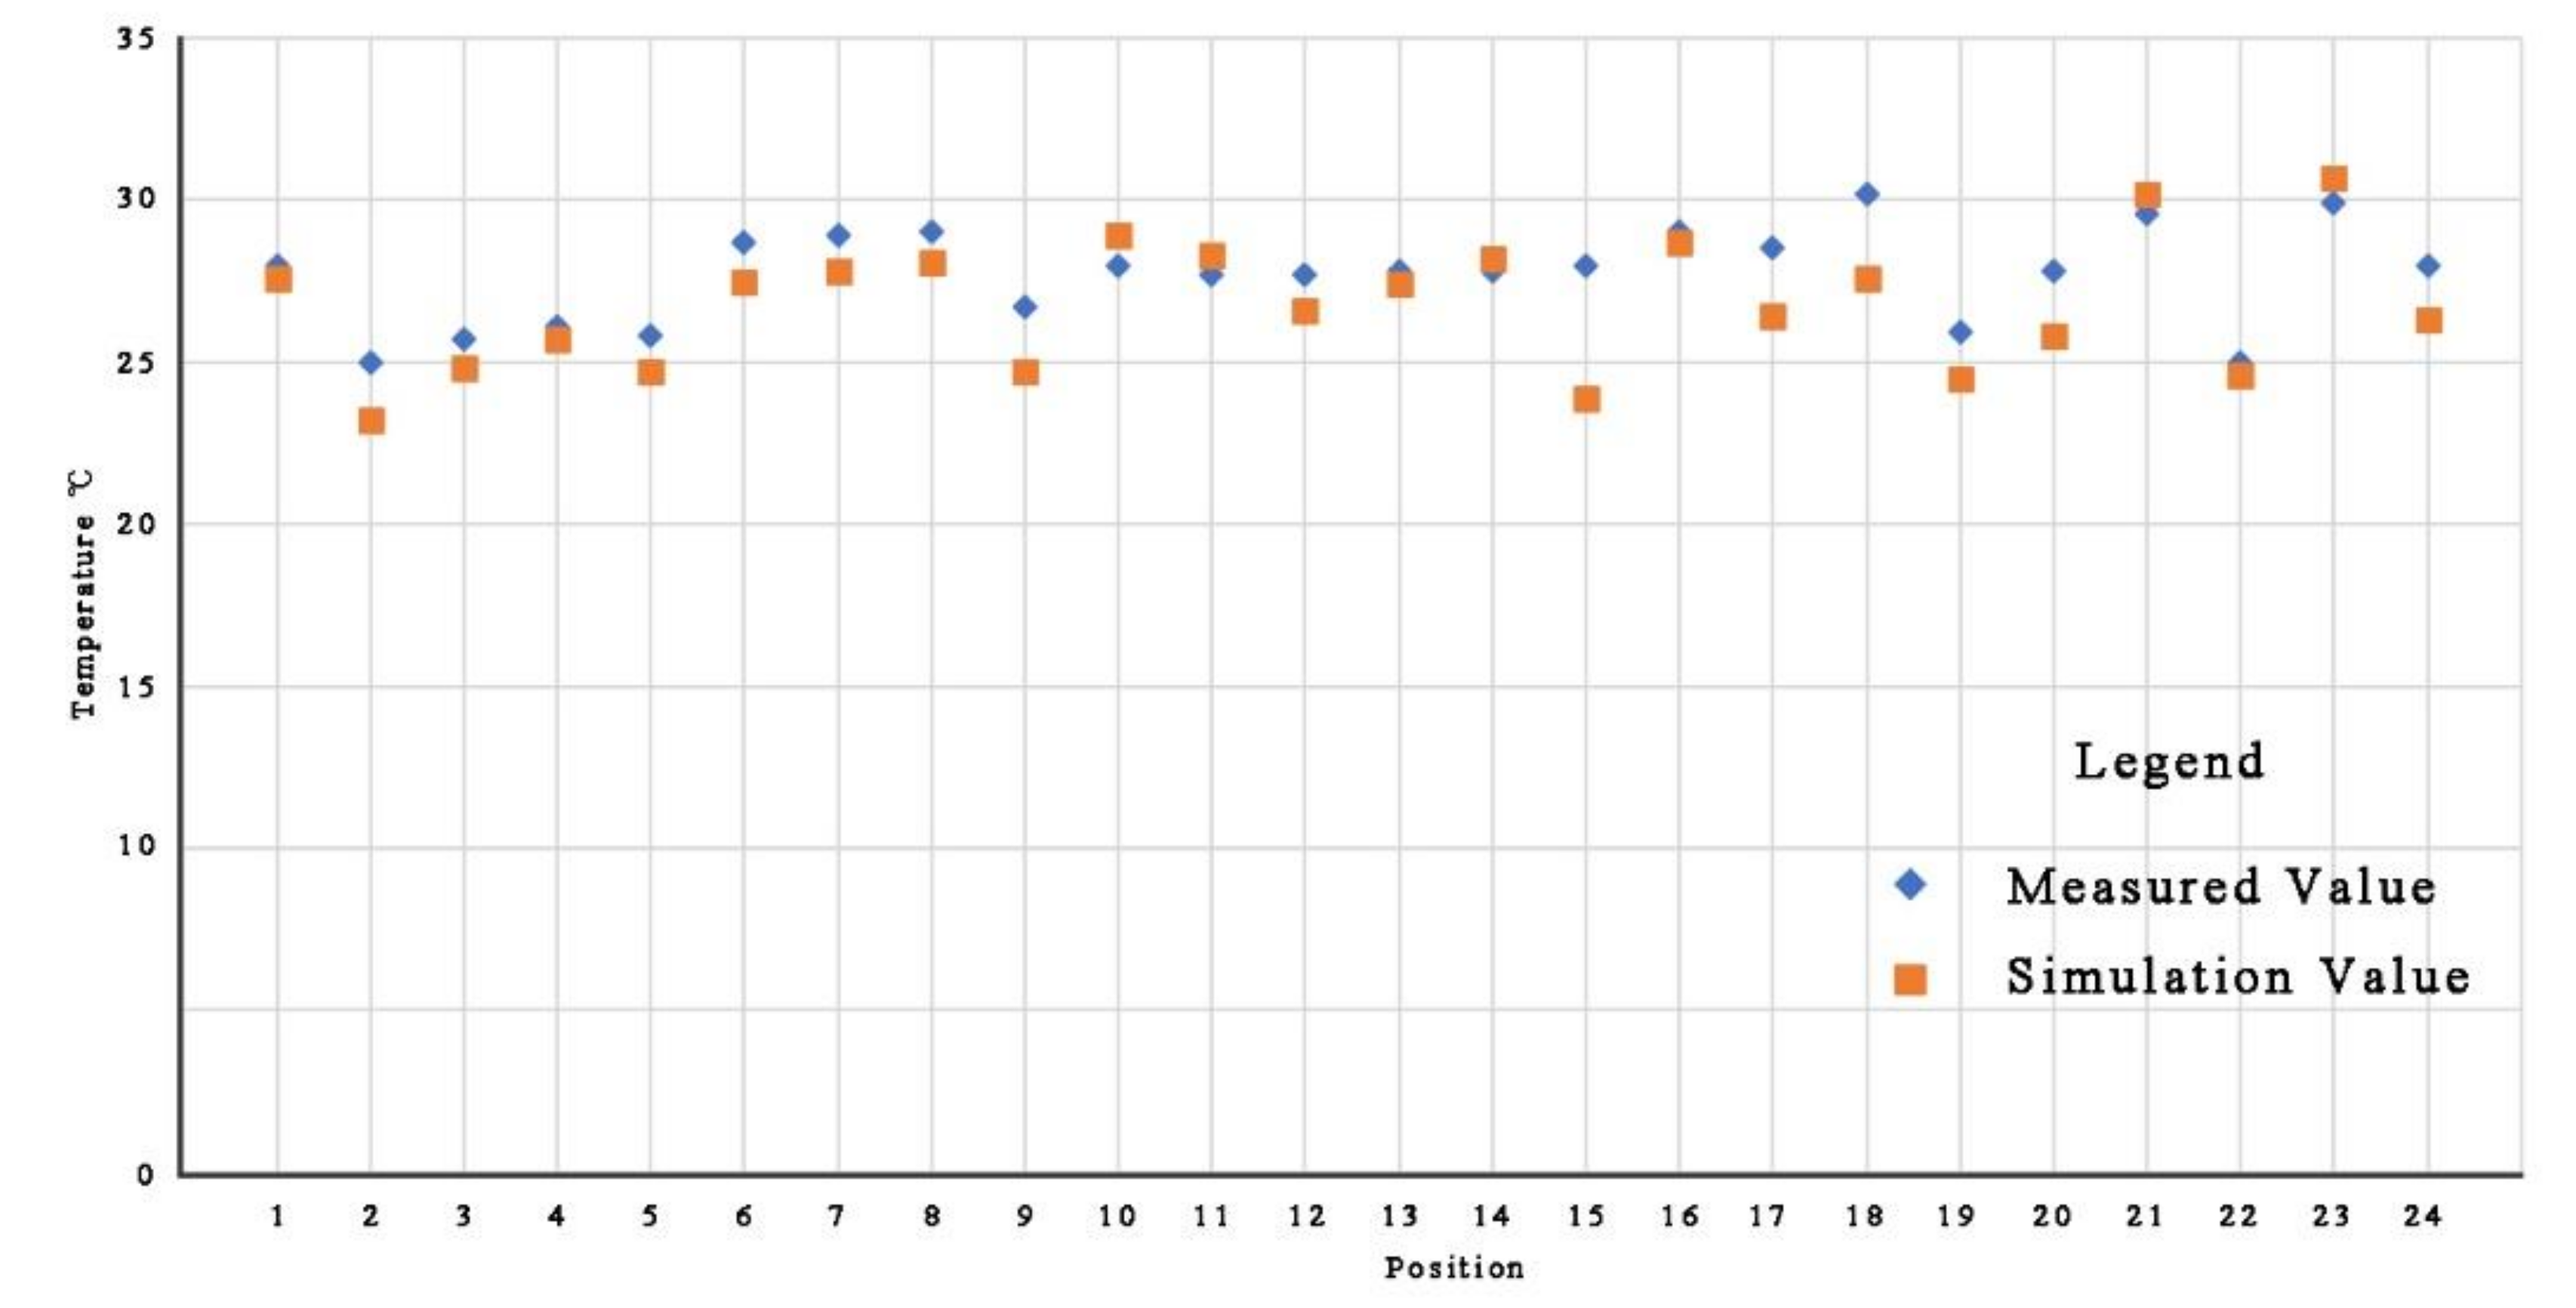
2.3. Measurement, Simulation, and Verification of Near Surface Thermal Environments
3. Simulation of Near Surface Thermal Environments of Typical Street Blocks
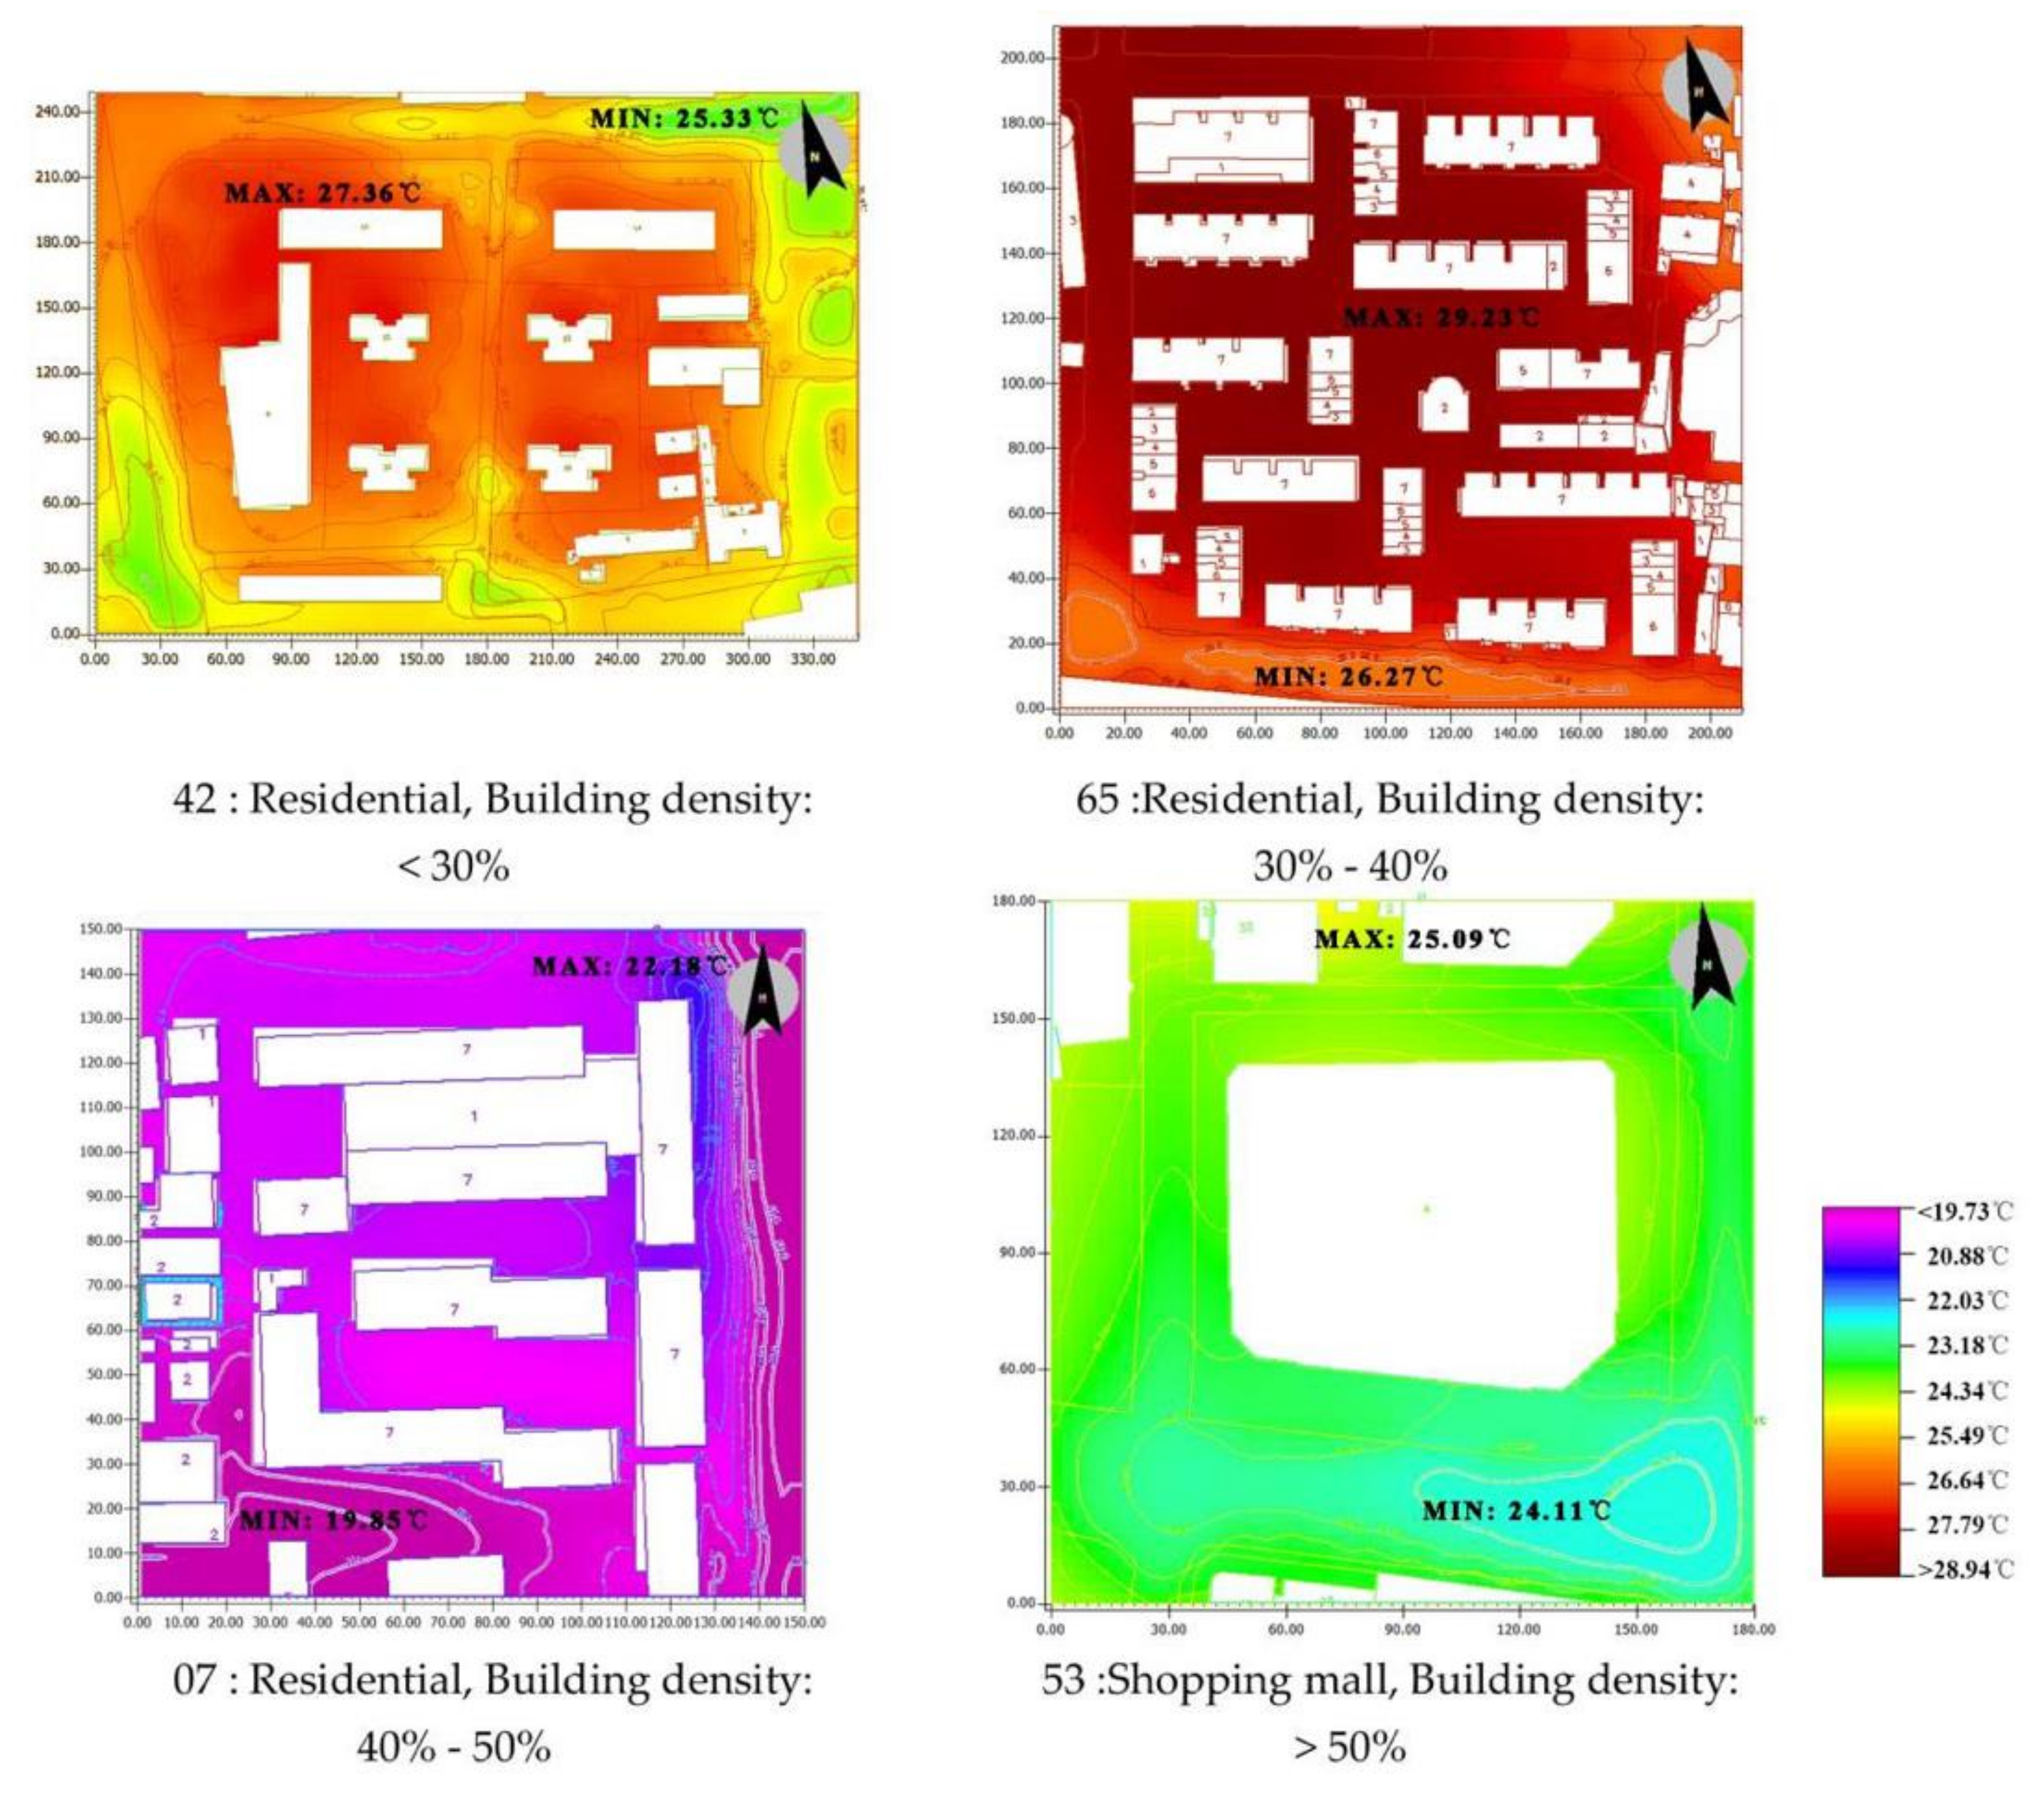
3.1. Building Density Versus Thermal Environment in Near Surface Space of XZC
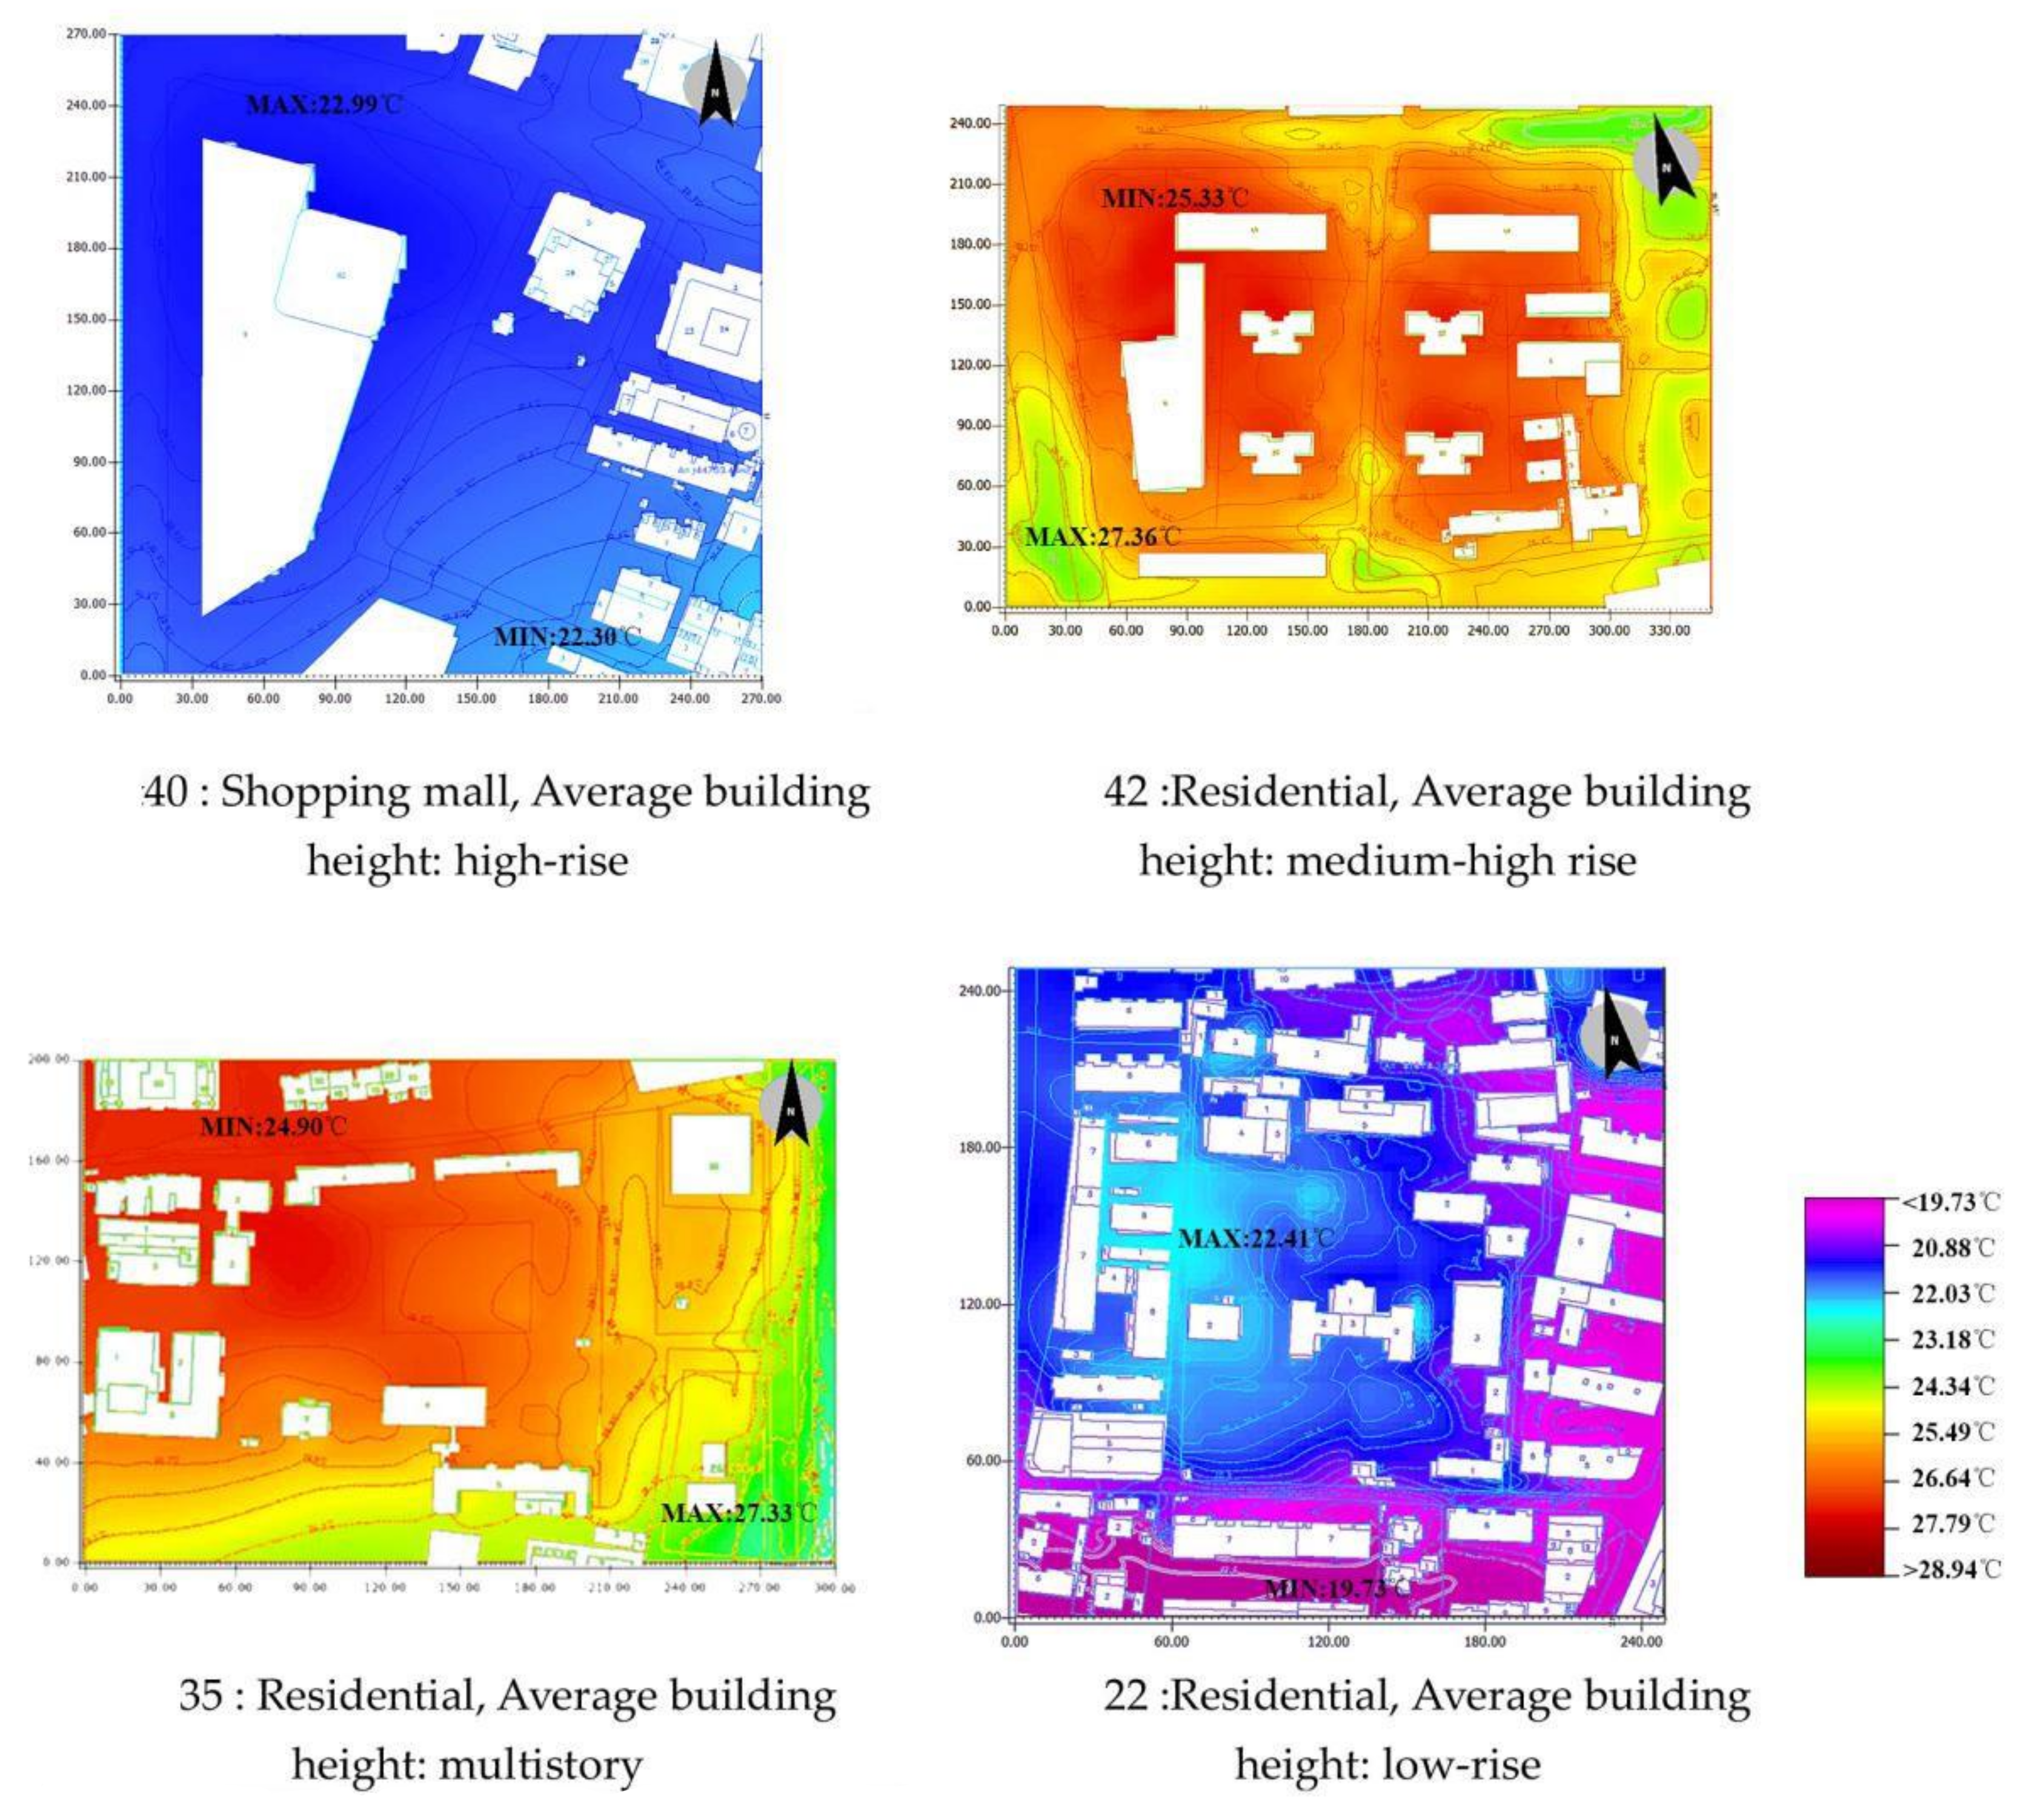
3.2. Average Building Height Versus Thermal Environment in Near Surface Space of XZC
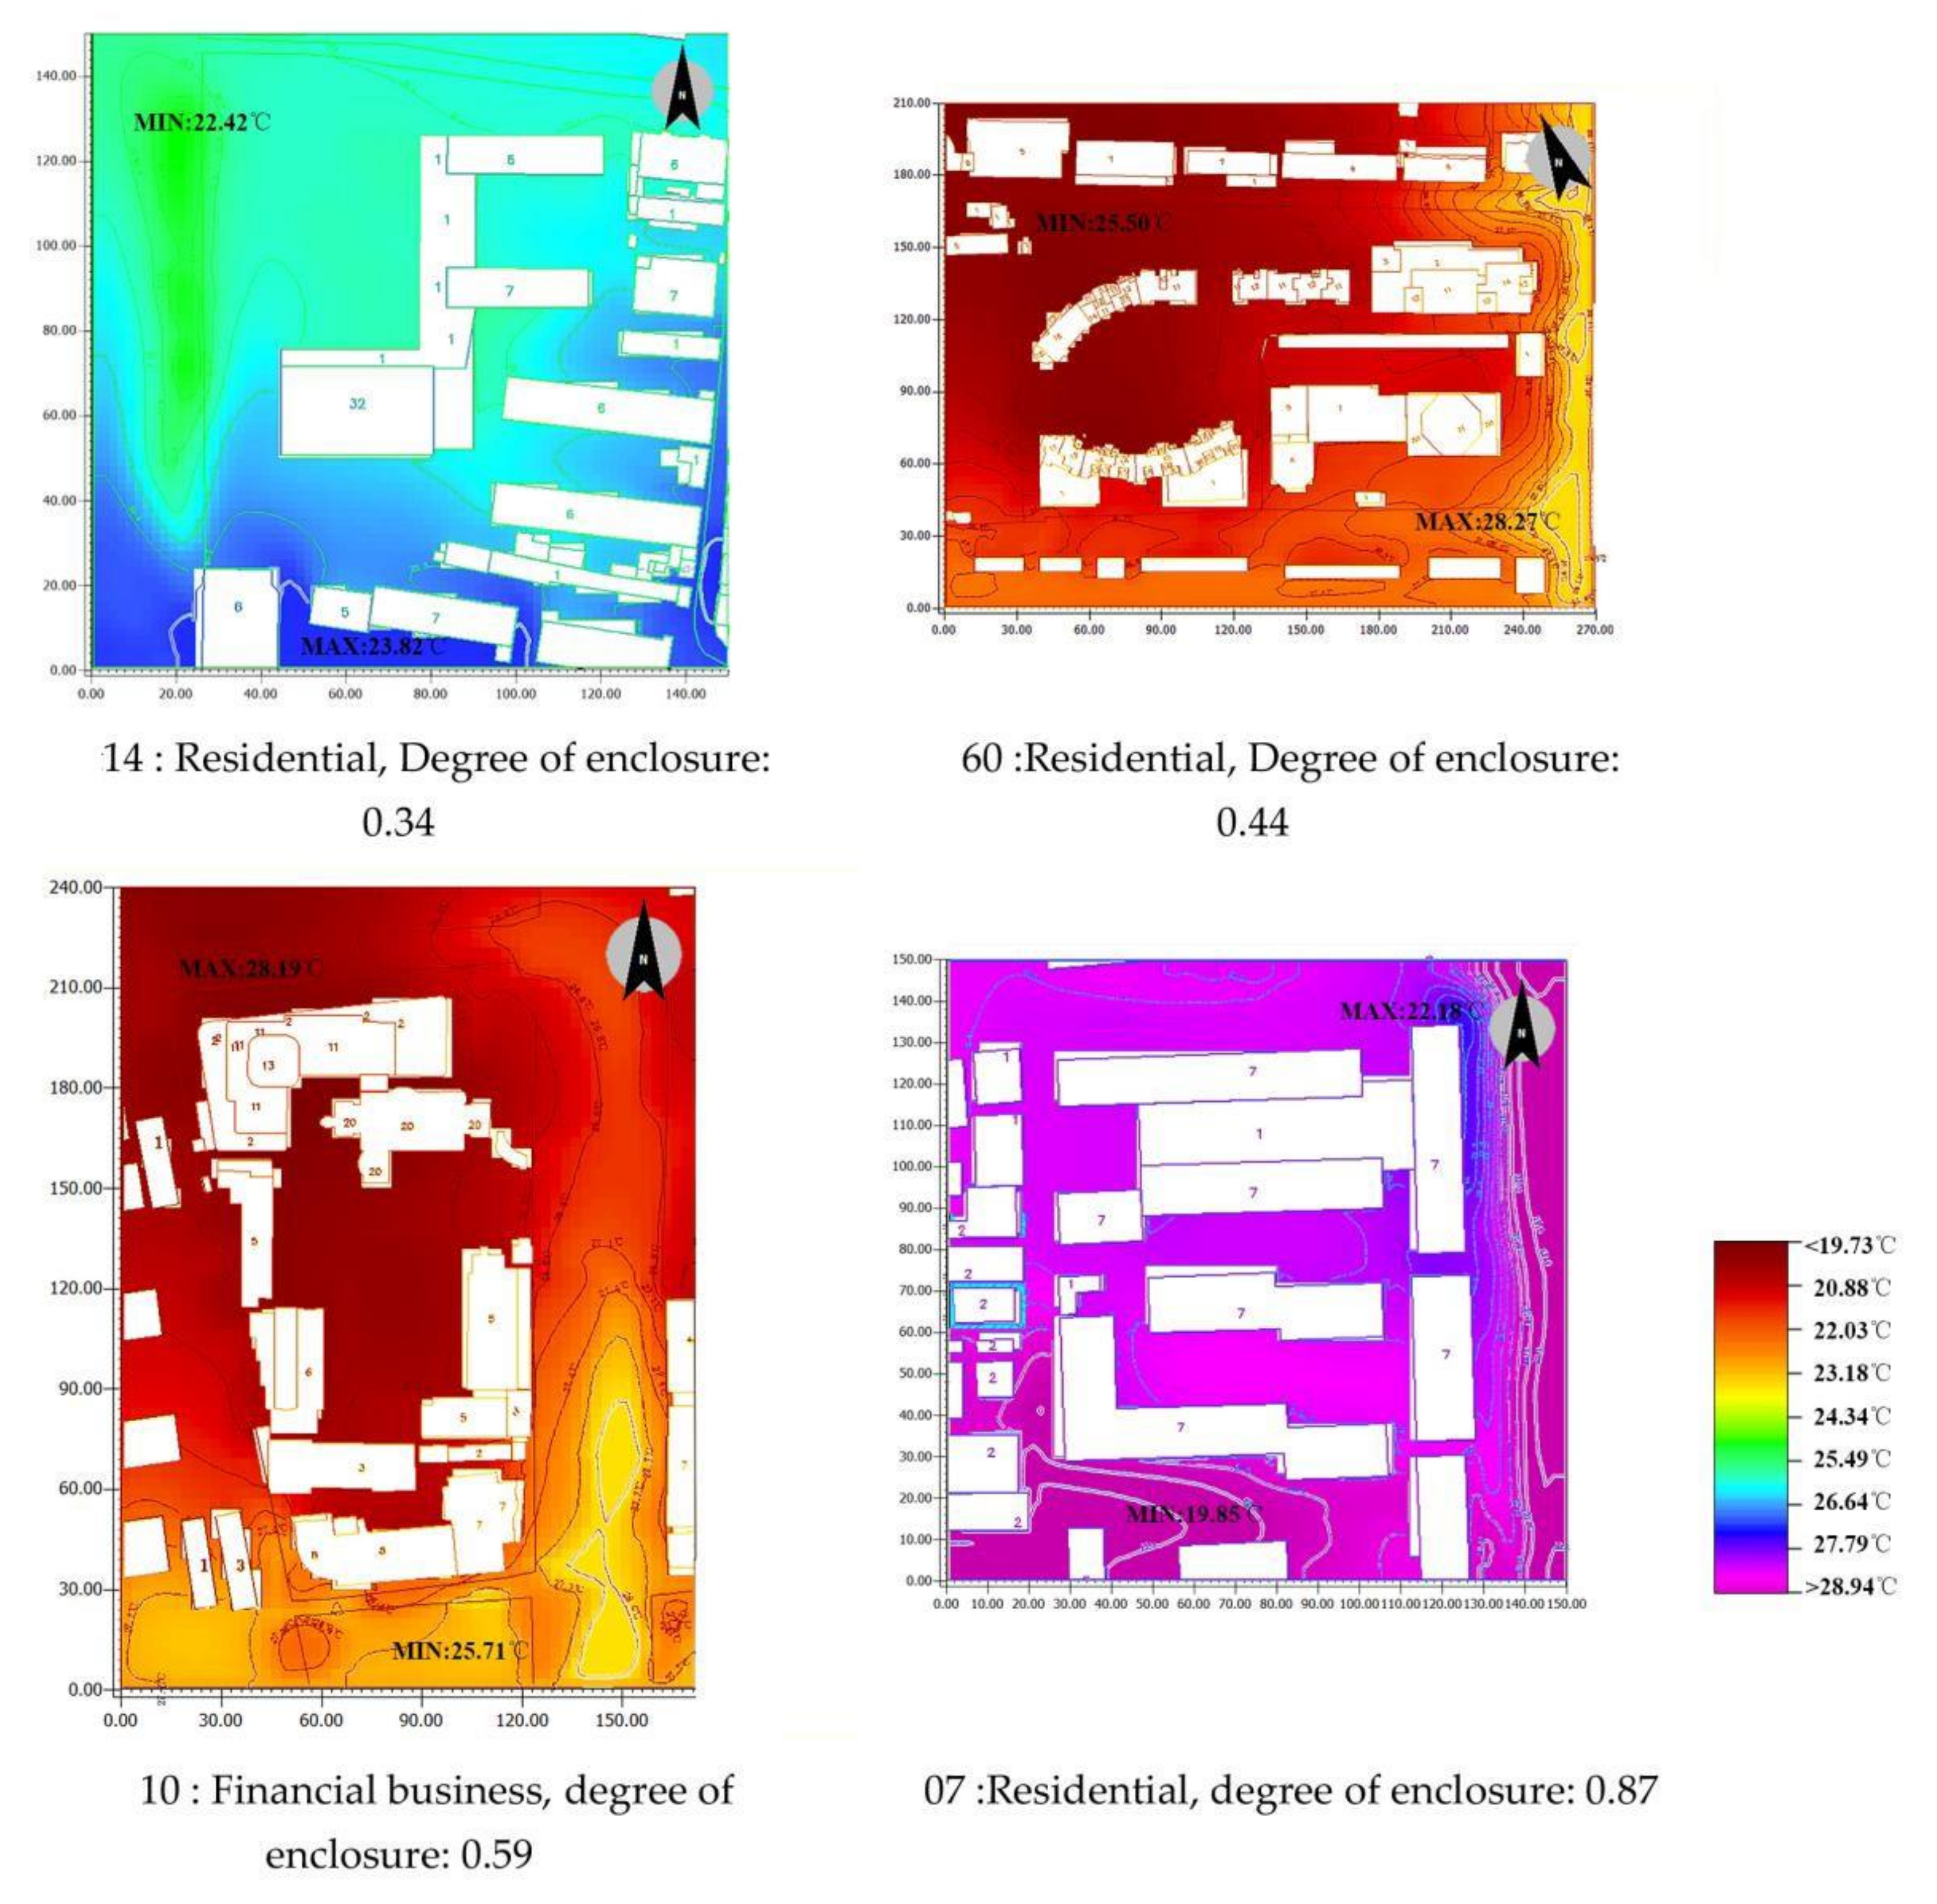
3.3. Degree of Openness Versus Thermal Environment in Near Surface Space of XZC
4. Optimization Strategy for Street Block Morphology and Extended Discussion
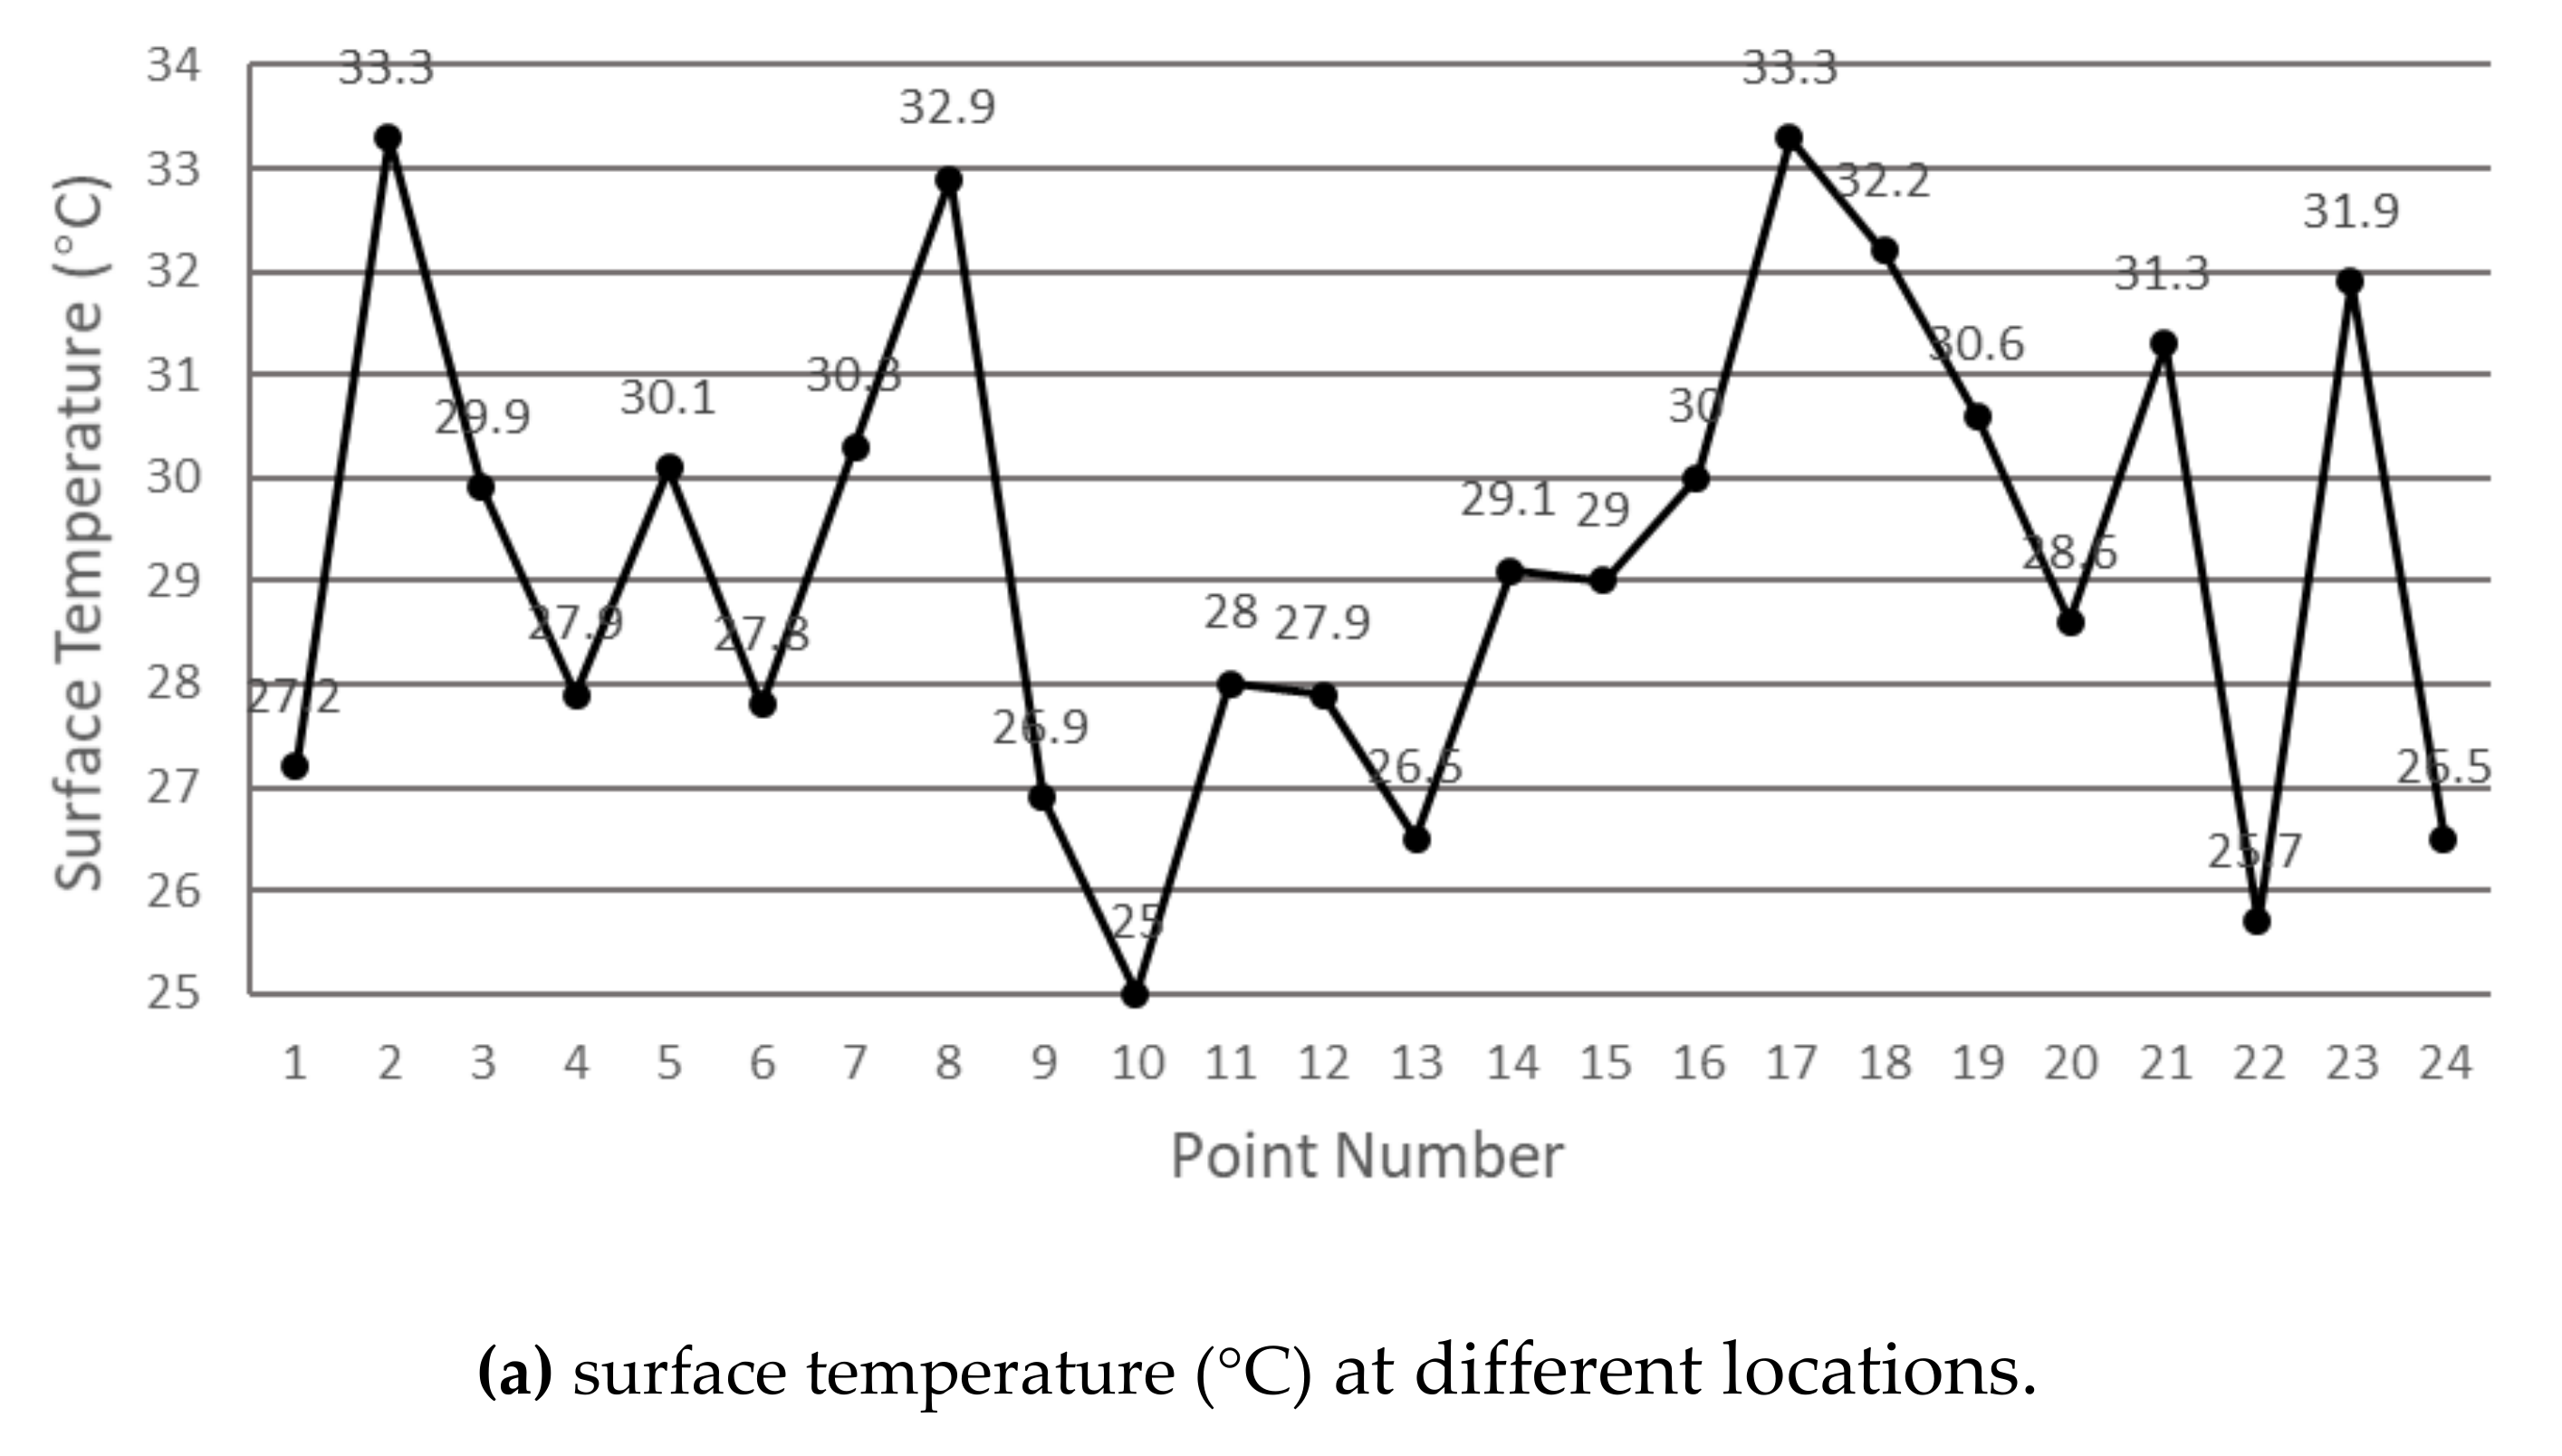
4.1. Measurement of Thermal Environments
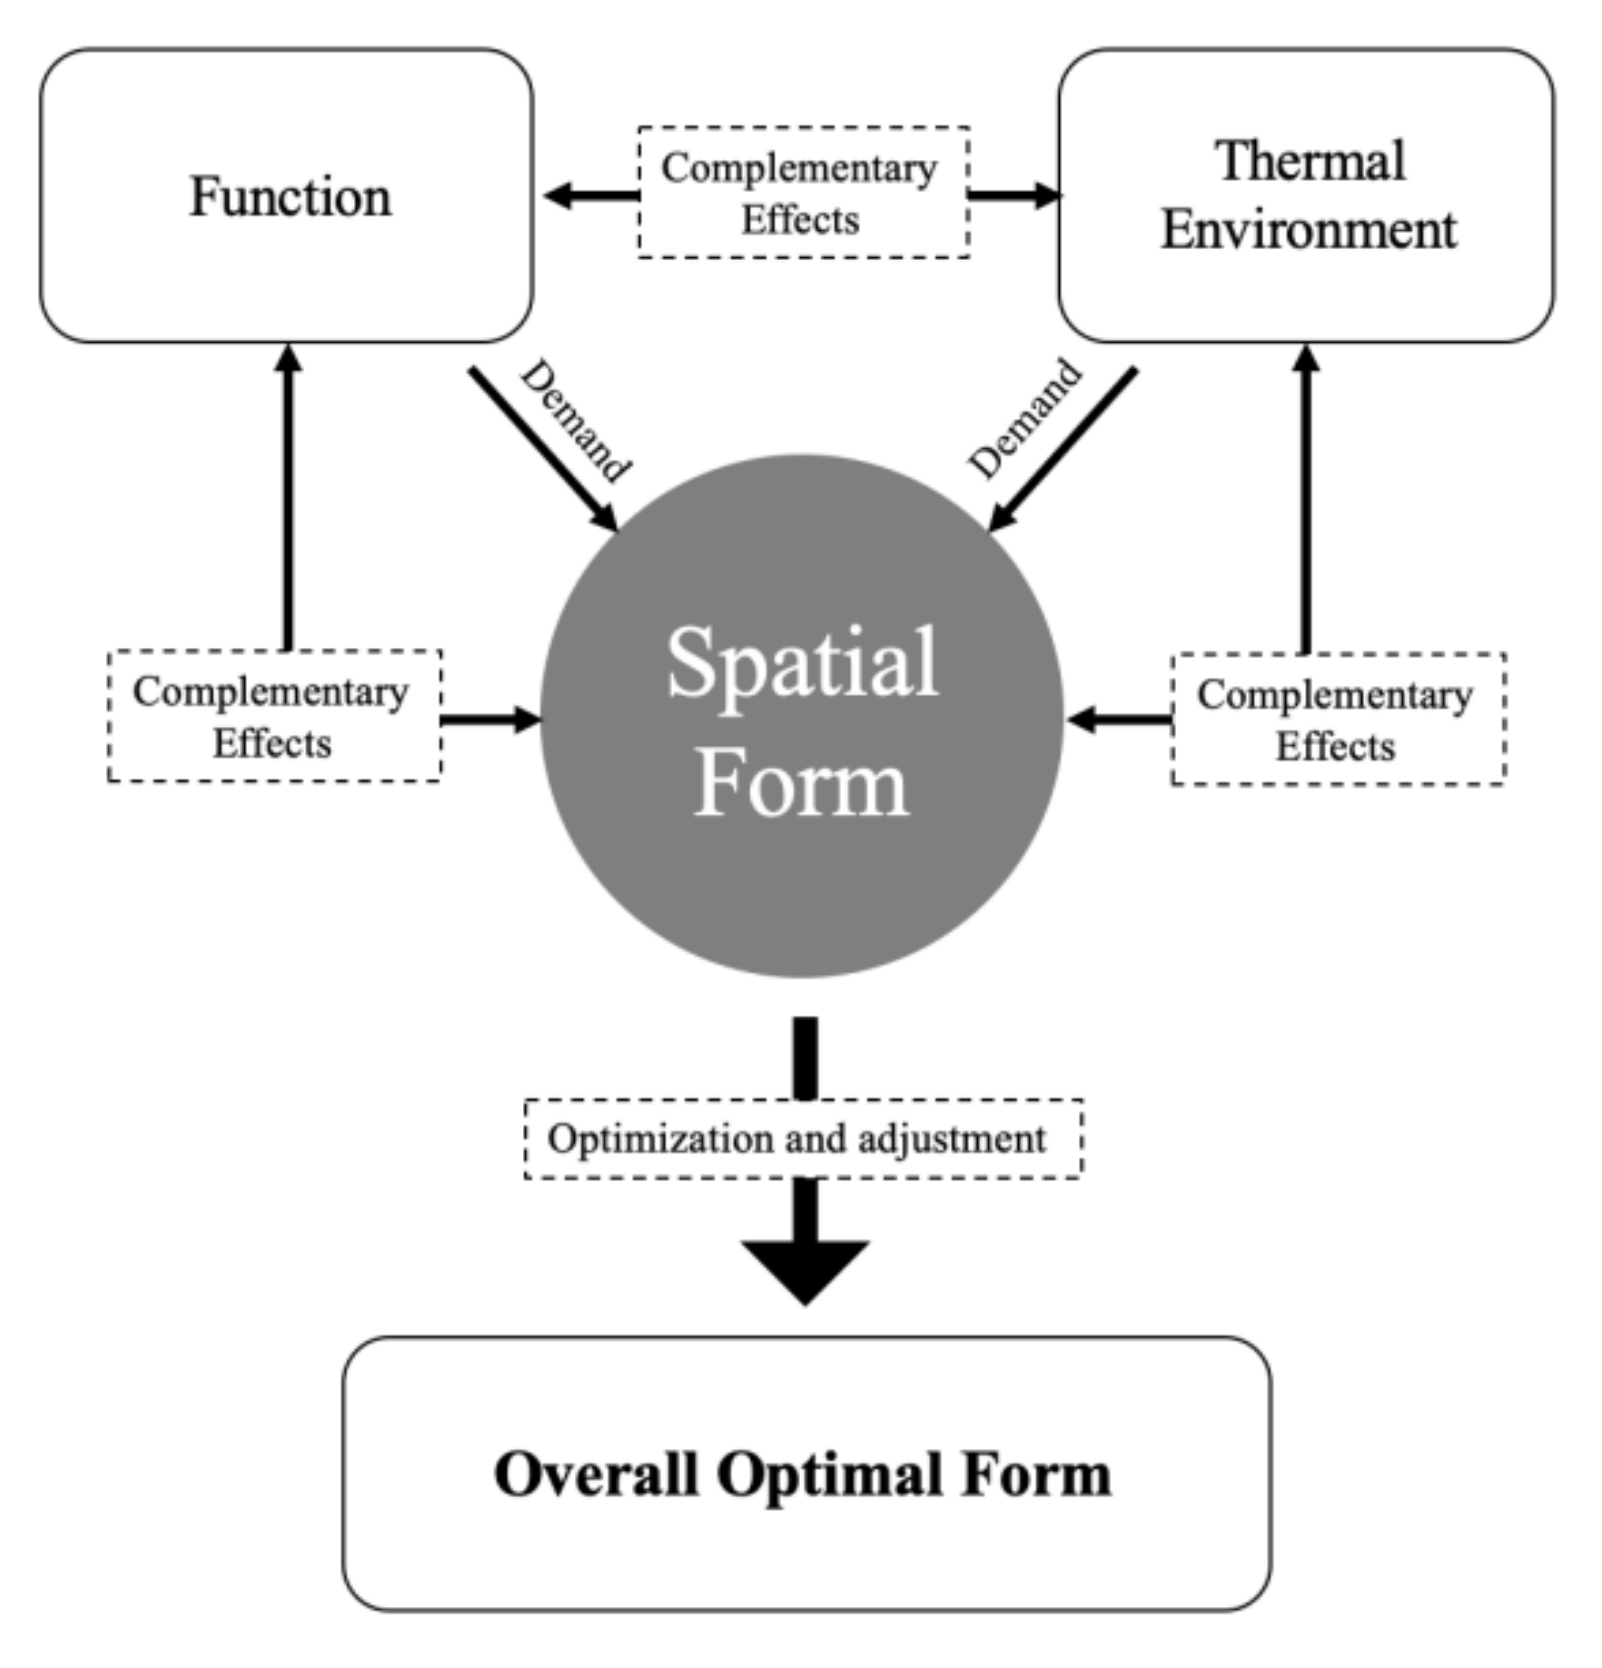
4.2. Balancing Function of Near Surface Urban Form
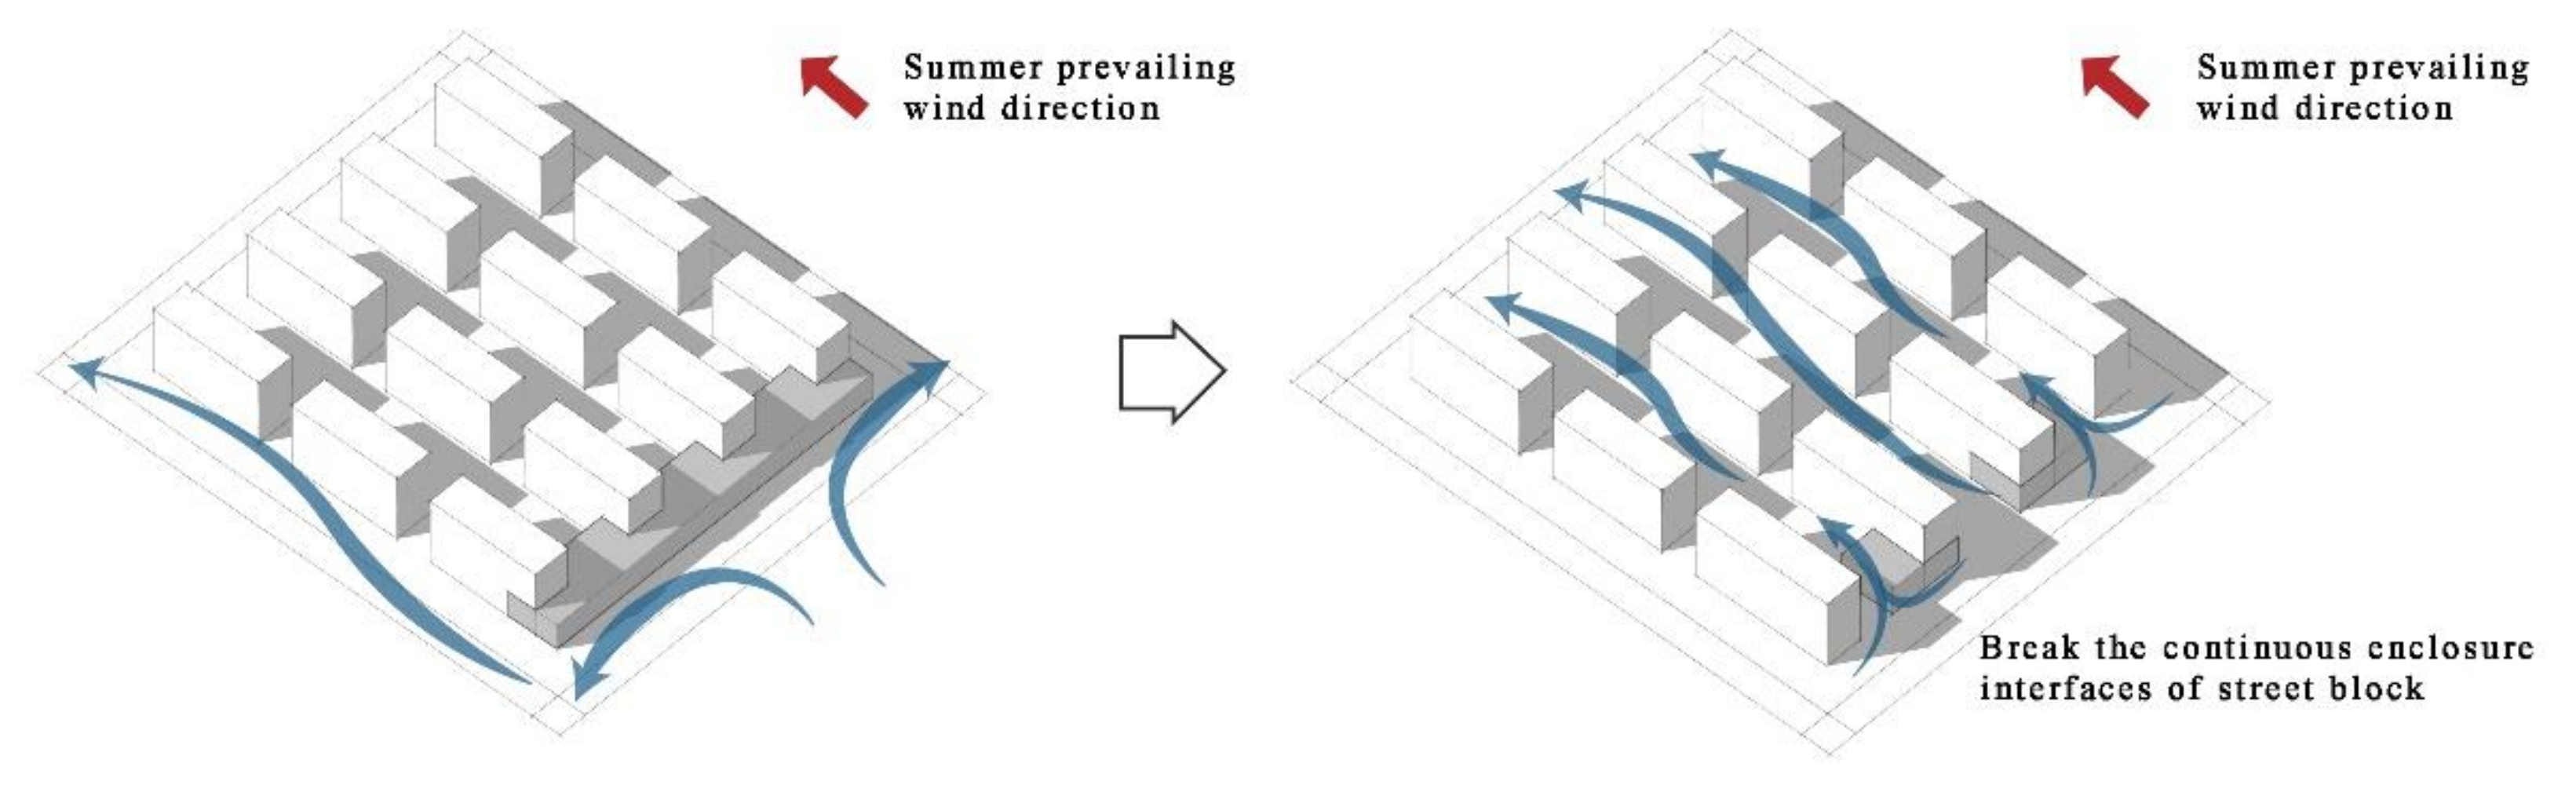
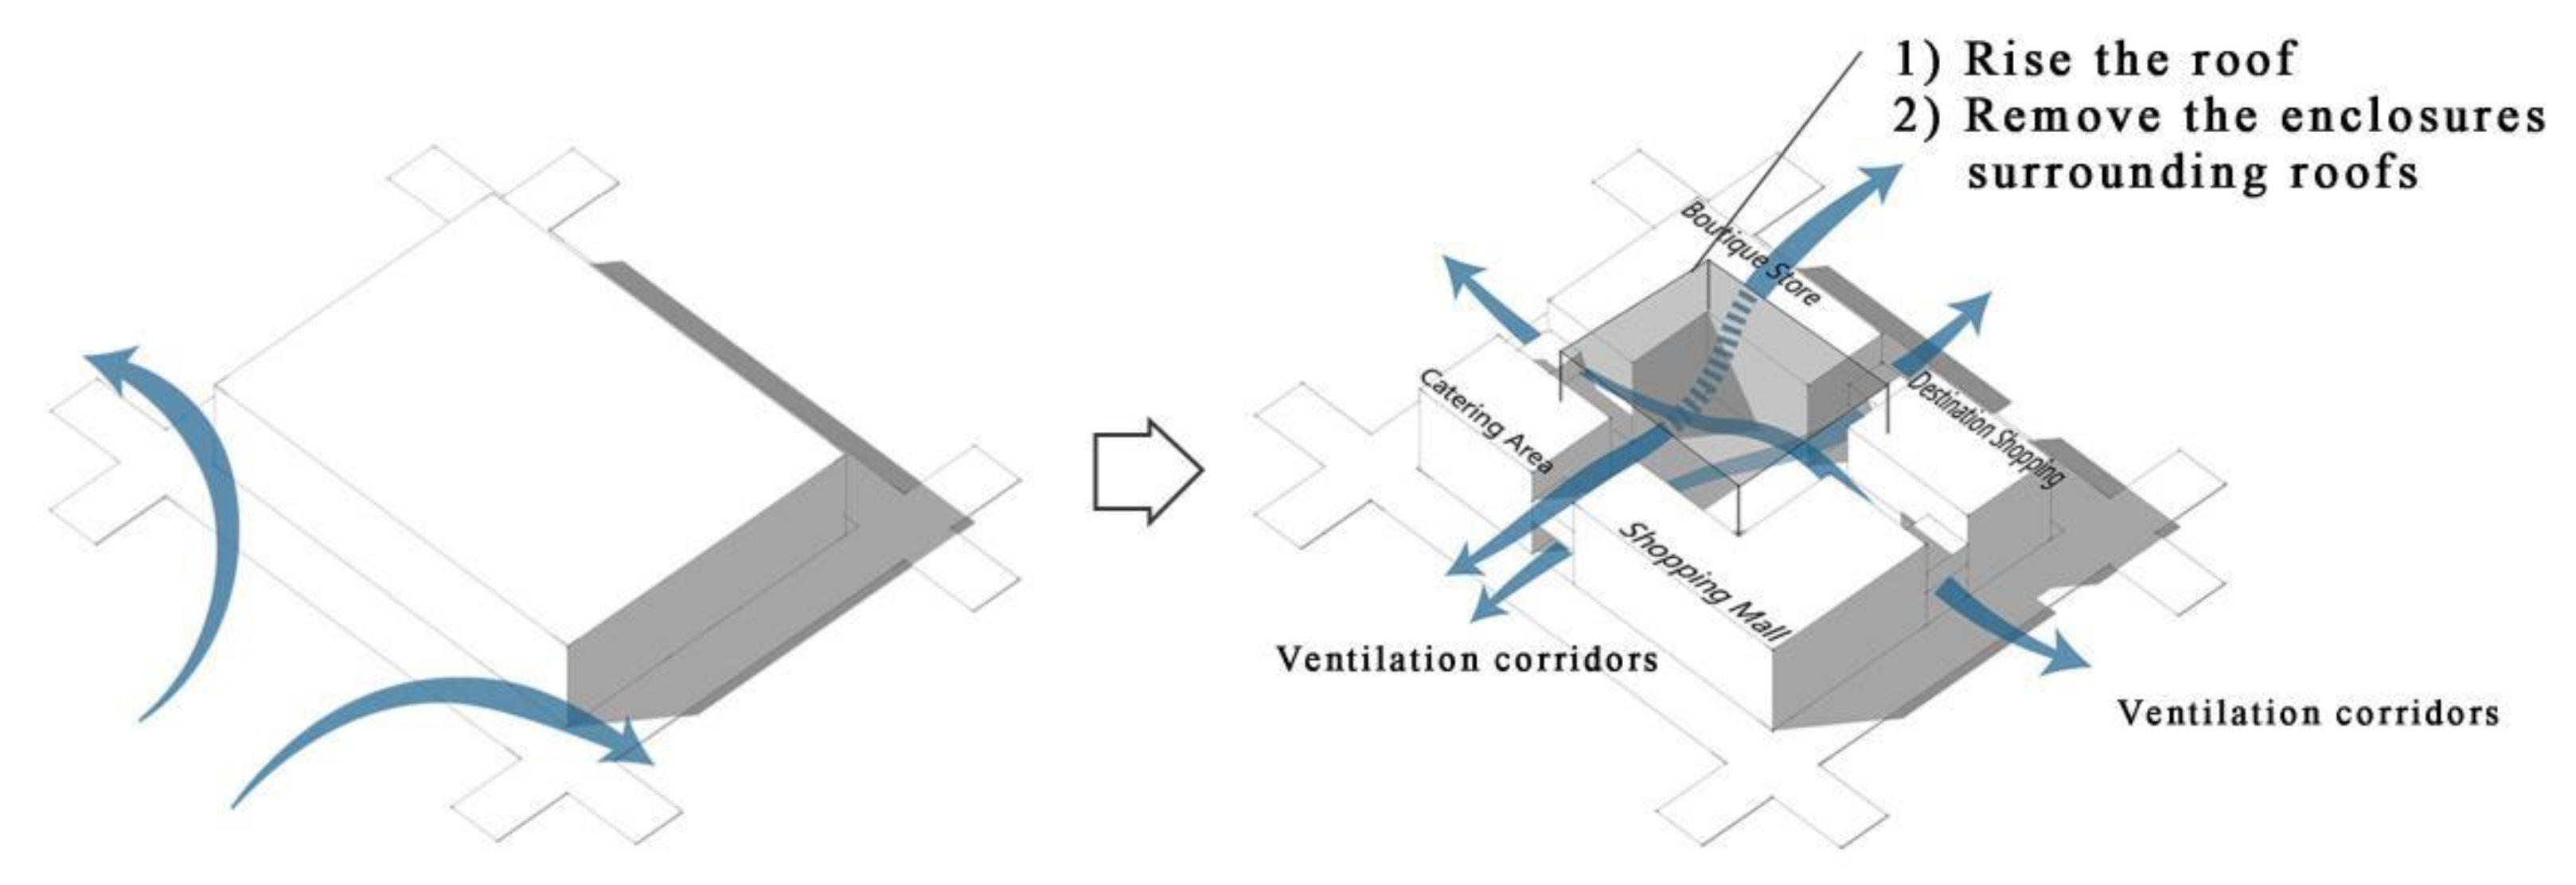
4.3. Urban Form Strategy for Mitigating the Heat Island Effect
5. Conclusions
Author Contributions
Funding
Conflicts of Interest
References
- De Oliveira, J.V.; Cohen, J.C.P.; Pimentel, M.; Tourinho, H.L.Z.; Lôbo, M.A.; Sodré, G.; Abdala, A. Urban climate and environmental perception about climate change in Belém, Pará, Brazil. Urban. Clim. 2020, 31, 100579. [Google Scholar] [CrossRef]
- Maheshwari, B.; Pinto, U.; Akbar, S.; Fahey, P. Is urbanisation also the culprit of climate change?–Evidence from Australian cities. Urban. Clim. 2020, 31, 100581. [Google Scholar] [CrossRef]
- Luo, X.; Yu, C.W.; Zhou, D.; Gu, Z. Challenges and adaptation to urban climate change in China: A viewpoint of urban climate and urban planning. Indoor Built Environ. 2019, 28, 1157–1161. [Google Scholar] [CrossRef]
- Di, X.; Ruishan, C. Comparison of urban heat island and urban reflection in Nanjing City of China. Sustain. Cities Soc. 2017, 31, 26–36. [Google Scholar] [CrossRef]
- Xian, G.; Crane, M. An analysis of urban thermal characteristics andassociated land cover in Tampa Bay and Las Vegas using Landsat satellite data. Remote Sens. Environ. 2006, 104, 147–156. [Google Scholar] [CrossRef]
- Hugo, G. Future demographic change and its interactions with migration and climate change. Glob. Environ. Change 2011, 215, 521–533. [Google Scholar] [CrossRef]
- Salata, F.; Golasi, I.; Proietti, R.; de Lieto Vollaro, A. Implications of climate and outdoor thermal comfort on tourism. The case of Italy. Int. J. Biometeorol. 2017, 61, 2229–2244. [Google Scholar] [CrossRef]
- Rangwala, L.; Pai, M. Planning for heat risk in vulnerable communities in Surat city. In Climate Change Planning, Proceedings of the 54th ISOCARP Congress, Bodo, Norway, 1–5 October 2018; International Society of City and Regional Planners: Hague, The Netherlands; pp. 140–160.
- Bardhan, R.; Kurisu, K.; Hanaki, K. Does compact urban forms relate to good quality of life in high density cities of India? Case of Kolkata. Cities 2015, 48, 55–65. [Google Scholar] [CrossRef]
- Habitzreuter, L.; Smith, S.T.; Keeling, T. Modelling the overheating risk in an uniform high-rise building design with a consideration of urban context and heatwaves. Indoor Built Environ. 2019. [Google Scholar] [CrossRef]
- Chen, X.L.; Zhao, H.M.; Li, P.X.; Yin, Z.Y. Remote sensing image-based analysis of the relationship between urban heat island and land use/cover changes. Remote Sens. Environ. 2006, 104, 133–146. [Google Scholar] [CrossRef]
- Yin, C.; Yuan, M.; Lu, Y.; Huang, Y.; Liu, Y. Effects of urban form on the urban heat island effect based on spatial regression model. Sci. Total Environ. 2018, 634, 696–704. [Google Scholar] [CrossRef] [PubMed]
- Xing, Y.; Jones, P. In-situ monitoring of energetic and hydrological performance of a semi-intensive green roof and a white roof during a heatwave event in the UK. Indoor Built Environ. 2019. [Google Scholar] [CrossRef]
- Xiao, X.D.; Dong, L.; Yan, H.; Yang, N.; Xiong, Y. The influence of the spatial characteristics of urban green space on the urban heat island effect in Suzhou Industrial Park. Sustain. Cities Soc. 2018, 40, 428–439. [Google Scholar] [CrossRef]
- Yang, J.; Shi, Y.; Yu, C.; Cao, S.-J. Challenges of using mobile phone signalling data to estimate urban population density: Towards smart cities and sustainable urban development. Indoor Built Environ. 2019, 147–150. [Google Scholar] [CrossRef] [Green Version]
- Xie, Y.; Liu, J.; Huang, T.; Li, J.; Niu, J.; Mak, C.M.; Lee, T.C. Outdoor thermal sensation and logistic regression analysis of comfort range of meteorological parameters in Hong Kong. Build. Environ. 2019, 155, 175–186. [Google Scholar] [CrossRef]
- He, S.; Zhang, Y.W.; Gu, Z.L.; Su, J. Local climate zone classification with different source data in Xi’an, China. Indoor Built Environ. 2019, 28, 1190–1199. [Google Scholar] [CrossRef]
- Yang, J.; Shi, B.; Shi, Y.; Marvin, S.; Zheng, Y.; Xia, G. Air pollution dispersal in high density urban areas: Research on the triadic relation of wind, air pollution, and urban form. Sustain. Cities Soc. 2020, 54, 101941. [Google Scholar] [CrossRef]
- Chokhachian, A.; Perini, K.; Giulini, S.; Auer, T. Urban performance and density: Generative study on interdependencies of urban form and environmental measures. Sustain. Cities Soc. 2020, 53, 101952. [Google Scholar] [CrossRef]
- Chun, B.; Guldmann, J.M. Impact of greening on the urban heat island: Seasonal variations and mitigation strategies. Comput. Environ. Urban. Syst. 2018, 71, 165–176. [Google Scholar] [CrossRef]
- Chen, Y.C.; Yao, C.K.; Honjo, T.; Lin, T.P. The application of a high-density street-level air temperature observation network (HiSAN): Dynamic variation characteristics of urban heat island in Tainan, Taiwan. Sci. Total Environ. 2018, 626, 555–566. [Google Scholar] [CrossRef]
- Giridharan, R.; Lau, S.S.Y.; Ganesan, S.; Givoni, B. Urban design factors influencing heat island intensity in high-rise high-density environments of Hong Kong. Build. Environ. 2007, 42, 3669–3684. [Google Scholar] [CrossRef]
- Van Hove, L.W.A.; Jacobs, C.M.J.; Heusinkveld, B.G.; Elbers, J.A.; Van Driel, B.L.; Holtslag, A.A.M. Temporal and spatial variability of urban heat island and thermal comfort within the Rotterdam agglomeration. Build. Environ. 2015, 83, 91–103. [Google Scholar] [CrossRef] [Green Version]
- Oliveira, V. Urban Morphology: An Introduction to the Study of the Physical Form of Cities; Springer: Berlin/Heidelberg, Germany, 2016. [Google Scholar]
- Wang, W.; Liang, S.; Meyers, T. Validating MODIS land surface temperature products using long-term nighttime ground measurements. Remote Sens. Environ. 2008, 112, 623–635. [Google Scholar] [CrossRef]
- Yang, J.; Shi, B.; Zheng, Y.; Shi, Y.; Xia, G. Urban Form and Air Pollution Disperse: Key Index and Mitigation Strategies. Sustain. Cities Soc. 2019, 101955. [Google Scholar] [CrossRef]
- Yang, G.; Pu, R.; Zhao, C.; Huang, W.; Wang, J. Estimation of subpixel land surface temperature using an endmember index based technique: A case examination on ASTER and MODIS temperature products over a heterogeneous area. Remote Sens. Environ. 2011, 115, 1202–1219. [Google Scholar] [CrossRef]
- Kong, L.; Lau, K.K.L.; Yuan, C.; Chen, Y.; Xu, Y.; Ren, C.; Ng, E. Regulation of outdoor thermal comfort by trees in Hong Kong. Sustain. Cities Soc. 2017, 31, 12–25. [Google Scholar] [CrossRef]
- He, B.J.; Zhao, Z.Q.; Shen, L.D.; Wang, H.B.; Li, L.G. An approach to examining performances of cool/hot sources in mitigating/enhancing land surface temperature under different temperature backgrounds based on Landsat 8 image. Sustain. Cities Soc. 2019, 44, 416–427. [Google Scholar] [CrossRef]
- Yuan, F.; Bauer, M.E. Comparison of impervious surface area and normalized difference vegetation index as indicators of surface urban heat island effects in Landsat imagery. Remote Sens. Environ. 2007, 106, 375–386. [Google Scholar] [CrossRef]
- Condon, P.M.; Cavens, D.; Miller, N. Urban Planning Tools for Climate Change Mitigation; Lincoln Institute of Land Policy: Cambridge, MA, USA, 2009. [Google Scholar]
- Stone, B.; Hess, J.J.; Frumkin, H. Urban form and extreme heat events: Are sprawling cities more vulnerable to climate change than compact cities? Environ. Health Perspect. 2010, 118, 1425–1428. [Google Scholar] [CrossRef] [Green Version]
- Shi, B.; Yang, J. Scale, distribution, and pattern of mixed land use in central districts: A case study of Nanjing, China. Habitat Int. 2015, 46, 166–177. [Google Scholar] [CrossRef]
- Chen, Y.; Wu, J.; Yu, K.; Wang, D. Evaluating the impact of the building density and height on the block surface temperature. Build. Environ. 2020, 168, 106493. [Google Scholar] [CrossRef]
- Wang, Y.; Zhou, D.; Wang, Y.; Fang, Y.; Yuan, Y.; Lv, L. Comparative study of urban residential design and microclimate characteristics based on ENVI-met simulation. Indoor Built Environ. 2019, 28, 1200–1216. [Google Scholar] [CrossRef]
- Xu, Y.; Ren, C.; Ma, P.; Ho, J.; Wang, W.; Lau, K.L.; Lin, H.; Ng, E. Urban morphology detection and computation for urban climate research. Landsc. Urban Plan. 2017, 167, 212–224. [Google Scholar] [CrossRef]
- Guo, A.; Yang, J.; Xiao, X.; Xia, J.; Jin, C.; Li, X. Influences of urban spatial form on urban heat island effects at the community level in China. Sustain. Cities Soc. 2020, 53, 101972. [Google Scholar] [CrossRef]
- China Institute of Building Standard Design and Research (CIBSDR). Code for Design of Civil Buildings; China Architecture & Building Press: Beijing, China, 2019. [Google Scholar]
- Doherty, M.; Nakanishi, H.; Bai, X.; Meyers, J. Relationships between form, morphology, density and energy in urban environments. GEA Backgr. Pap. 2009, 28, 1–28. [Google Scholar]
- Lai, A.; Maing, M.; Ng, E. Observational studies of mean radiant temperature across different outdoor spaces under shaded conditions in densely built environment. Build. Environ. 2017, 114, 397–409. [Google Scholar] [CrossRef]
- Arnfield, A.J.; Grimmond, C.S.B. An urban canyon energy budget model and its application to urban storage heat flux modeling. Energy Build. 1998, 27, 61–68. [Google Scholar] [CrossRef]
- Vallati, A.; de Lieto Vollaro, A.; Golasi, I.; Barchiesi, E.; Caranese, C. On the impact of urban micro climate on the energy consumption of buildings. Energy Procedia 2015, 82, 506–511. [Google Scholar] [CrossRef] [Green Version]
- Building Department of the Hong Kong Government. Practice Note for Authorized Persons, Registered Structural Engineers and Registered Geotechnical Engineers PNAP APP-152: Sustainable Building Design Guidelines; (Chinese Version); BD: Hong Kong, China, 2011. [Google Scholar]
- Cheng, C.K.; Chan, J.C. Impacts of land use changes and synoptic forcing on the seasonal climate over the Pearl River Delta of China. Atmos. Environ. 2012, 60, 25–36. [Google Scholar] [CrossRef]
- Deng, Y.; Feng, Z.; Fang, J.; Cao, S.J. Impact of ventilation rates on indoor thermal comfort and energy efficiency of ground-source heat pump system. Sustain. Cities Soc. 2018, 37, 154–163. [Google Scholar] [CrossRef]
- Cao, S.J.; Deng, H.Y. Investigation of temperature regulation effects on indoor thermal comfort, air quality, and energy savings toward green residential buildings. Sci. Technol. Built Environ. 2019, 25, 309–321. [Google Scholar] [CrossRef]
- Ren, C.; Cao, S.J. Development and application of linear ventilation and temperature models for indoor environmental prediction and HVAC systems control. Sustain. Cities Soc. 2019, 51, 101673. [Google Scholar] [CrossRef]
- Chen, H.; Feng, Z.; Cao, S.J. Quantitative investigations on setting parameters of air conditioning (air-supply speed and temperature) in ventilated cooling rooms. Indoor Built Environ. 2019. [Google Scholar] [CrossRef]
- Fang, Z.; Feng, X.; Liu, J.; Lin, Z.; Mak, C.M.; Niu, J.; Tse, K.T.; Xu, X. Investigation into the differences among several outdoor thermal comfort indices against field survey in subtropics. Sustain. Cities Soc. 2019, 44, 676–690. [Google Scholar] [CrossRef]


| Simulation Parameters | Input Parameter Value |
|---|---|
| Start simulation at day (DD.MM.YYY) | = 29.06.2018 |
| Start simulation at time (HH:MM:SS) | = 06:00:00 |
| Total simulation time (hours) | = 24 |
| Save model state frequency (min) | = 60 |
| Wind speed in 10 m ab. ground (m/s) | = 2.8 |
| Wind direction (0:N..90:E..180:S..270:W..) | = 145 |
| Roughness length z0 at reference point | = 0.1 |
| Initial temperature atmosphere (K) | = 302 |
| Specific humidity in 2500 m (g water/kg air) | = 8 |
| Relative humidity in 2 m (%) | = 62 |
| Spot Number | Plot Attribution | Spot Number | Plot Attribution |
|---|---|---|---|
| 03 | Financial and business | 36 | Residential |
| 04 | Financial and business | 40 | Commercial |
| 07 | Residential | 42 | Residential |
| 08 | Residential | 46 | Financial and business |
| 10 | Commercial | 51 | Residential |
| 13 | Residential | 53 | Commercial |
| 14 | Residential | 57 | Financial and business |
| 18 | Residential | 65 | Residential |
| 19 | Residential | 66 | Residential |
| 20 | Financial and business | 67 | Financial and business |
| 22 | Residential | 71 | Residential |
| 35 | Residential | 76 | Financial and business |
© 2020 by the authors. Licensee MDPI, Basel, Switzerland. This article is an open access article distributed under the terms and conditions of the Creative Commons Attribution (CC BY) license (http://creativecommons.org/licenses/by/4.0/).
Share and Cite
Yang, J.; Shi, B.; Xia, G.; Xue, Q.; Cao, S.-J. Impacts of Urban Form on Thermal Environment Near the Surface Region at Pedestrian Height: A Case Study Based on High-Density Built-Up Areas of Nanjing City in China. Sustainability 2020, 12, 1737. https://0-doi-org.brum.beds.ac.uk/10.3390/su12051737
Yang J, Shi B, Xia G, Xue Q, Cao S-J. Impacts of Urban Form on Thermal Environment Near the Surface Region at Pedestrian Height: A Case Study Based on High-Density Built-Up Areas of Nanjing City in China. Sustainability. 2020; 12(5):1737. https://0-doi-org.brum.beds.ac.uk/10.3390/su12051737
Chicago/Turabian StyleYang, Junyan, Beixiang Shi, Geyang Xia, Qin Xue, and Shi-Jie Cao. 2020. "Impacts of Urban Form on Thermal Environment Near the Surface Region at Pedestrian Height: A Case Study Based on High-Density Built-Up Areas of Nanjing City in China" Sustainability 12, no. 5: 1737. https://0-doi-org.brum.beds.ac.uk/10.3390/su12051737