Investigation into Creep Characteristics and Model of Recycled Construction and Demolition Waste Used in Embankment Filler

1
Key Laboratory of Special Area Highway Engineering, Ministry of Education, Chang'an University, Xi’an 710064, China
2
Institute of Geotechnical Engineering, Southeast University, Nanjing 2111189, China
*
Author to whom correspondence should be addressed.
Sustainability 2020, 12(5), 1924; https://0-doi-org.brum.beds.ac.uk/10.3390/su12051924
Submission received: 7 February 2020
/
Revised: 24 February 2020
/
Accepted: 27 February 2020
/
Published: 3 March 2020
(This article belongs to the Collection Trends in Municipal Solid Waste Management)
Abstract
:The creep deformation of recycled construction and demolition waste (CDW) filler is an important factor affecting road performance. In this paper, a series of laboratory tests, including a compaction test, sieving test, California bearing ratio (CBR) test, creep test and unloading test are conducted on CDW filler. The engineering properties of different ratios of CDW mixture are systematically analyzed, the CBR value of CDW filler meets the requirements of an embankment. The creep type of CDW filler under a test load is stable creep, the results of the creep characteristics are analyzed from a microscopic point of view. The filler with a 7:2:1 ratio (brick slag: concrete: mortar) has the densest structure, which is dense and less porous, and the deformation is the smallest. Reasonable proportion control is the key to reducing embankment deformation. The improved Burgers model, which can better describe the creep characteristics of CDW filler, and the effects of load and ratio on the creep parameters are analyzed using the equivalent creep compliance. This study is of great significance for the promotion of CDW and meets the requirements of sustainable development.
1. Introduction
With the continuous development of urbanization in China, a large amount of construction and demolition waste (CDW) has been produced during the urbanization process. There were 1.5 billion tons of CDW generated in 2015, and the output of CDW is increasing every year. CDW not only occupies a large amount of land resources, but during the process of stacking and landfilling, leachate is generated due to the erosion of rainwater and the soaking of surface water and groundwater, resulting in the serious pollution of water resources and a reduction in soil quality [1]. At the same time, behind the large-scale construction and improvement of infrastructure, there is an unfavorable situation in which construction materials are in short supply.
Recycled aggregates are obtained by the crushing and screening of CDW, so research into the behavior of these materials is of great significance. Barbudo et al. [2] analyzed the change in gradation in recycled aggregates; the compacted mixture becomes dense due to particle breakage, which leads to an improvement in its resilient modulus and bearing capacity [3,4,5,6]. Generally, recycled aggregates are formed by the crushing of large machinery and, because of the lower density and greater porosity of various recycled aggregates [7,8,9], the maximum dry density and strength of the recycled aggregate is lower than that of the original aggregate [10,11]. At the same time, more and more scholars are conducting research into the sustainability of construction waste. For instance, using recycled aggregate produces high-performance concrete and the combination of fly ash, slag and silica fume can make up for the adverse effects of recycled aggregates [12,13,14]. When recycled aggregate is used to produce recycled asphalt, Subhy et al. [15] and Menegusso et al. [16] have studied the effects of its content and treatment method on fatigue performance. In addition, recycled aggregates are used for roadbed fillers, Javier et al. [17] found that the bearing capacity of the recycled aggregates increased with time in the structural layer, which is inconsistent with the trend of natural aggregates. Vegas et al. [18] and Yin et al. [19] studied the properties of recycled concrete applied to an embankment and introduced its permanent deformation characteristics.
The application of CDW materials to embankments has great economic and environmental benefits, but the composition of recycled CDW material is complex, and its settlement after construction is difficult to predict and control, therefore, a study into its creep characteristics and mechanisms is urgently needed. The CDW mixture belongs to coarse-grained materials and the creep deformation of coarse-grained materials can be divided into stable creep and unstable creep types, according to the magnitude of stress [20,21]. The rheological curve of coarse-grained materials can be divided into three stages: linear, decaying rheology, and stability [22]. With the increase in dam height, the particle breakage of the rockfill in the rock dam increased significantly, and the particle breakage directly changed the rockfill structure [23,24]. From their triaxial creep shear test, Jiang et al. concluded that particle motion, rotation, and damage are the main causes of coarse-grained material deformation [25]. In addition to the time-dependent strain under a constant load, changes in the external environment tend to have a large effect on creep deformation, especially as immersion in water causes the particles to be lubricated and softened. Ciantia et al. and Zhao et al. [26,27] found that the additional strain caused by wetting is mainly due to the decrease in contact friction coefficient, and the decrease in bond strength is only a secondary effect. Deng et al. [28] discovered that, through water–rock interaction, the microstructure of red-layer soft rock changed its state from dense to loose and porous.
Creep constitutive models are usually established to predict the time-dependent strain of coarse-grained materials. Creep constitutive models are mainly divided into empirical models, mechanism-based models and component models. By analyzing the creep test data, the empirical models establish the mathematical relationship between creep deformation and time. For example, Kuwano et al., Pramthawee et al., and Zhou et al. [29,30,31] have all put forward different empirical creep deformation models to study the deformation characteristics of rockfill. As a unique method, the mechanism-based constitutive model can consider the development of cracks and the evolution of damage in rocks [32]. Tang et al. [33] proposed a damage creep model, which can describe the accelerated creep stage by introducing the concept of damage acceleration limit. The component models are based on a combination of standard elements, such as the Hook spring, the Newton dashpot and the Saint-Venant plastic body. Justo and Durand [34] analyzed the creep settlement deformation of earth-rock dams using the Merchant creep model. By combining the Burgers model with plastic components, Li et al. [35] proposed a creep constitutive model to describe the creep properties of layered rocks. The component model can flexibly describe different creep deformations, but the model parameters are usually constant, and the mechanical parameters of the material tend to change with time under different initial conditions. Asadzadeh et al. [36,37] constructed a nonlinear viscoelastic-plastic constitutive model with seven parameters. When analyzing the creep strain of cement-modified expansive soil, Cheng et al. [38] divided the plastic deformation into linear and nonlinear. Component models with such certain parameters often have large errors; in order to overcome the shortcomings of the previous models in modeling creep behavior, it is necessary to construct nonlinear models.
In summary, the research mainly centralizes the compressive strength, shear strength, resilient modulus, bearing capacity and durability of recycled aggregates. However, limited information in the literature was derived from the mechanical and creep properties of CDW filler, and studies on creep deformation were mainly focused on various soils and rocks. Moreover, not many scholars have emphasized the effect of ratio on creep properties, including loading and unloading deformation under changes in brick slag content and concrete slag content. The road performance of CDW fillers with different ratios is different, and the long-term deformation of the road is difficult to control and predict. In order to explore the creep characteristics and internal mechanism of fillers with different ratios, a compaction test, sieving test, California bearing ratio (CBR) test and creep test were performed; the properties of the total strain, void ratio, instantaneous strain, creep strain and unloading strain were analyzed in detail, then the creep model that was consistent with the creep characteristics was proposed, finally, the influencing factors of the creep parameters were discussed. This research can help us to understand the behaviors of CDW fillers with different ratios and provide design references, which is conducive to the recycling of CDW and a reduction in environmental pollution.
2. Materials and Methods
2.1. Test Materials
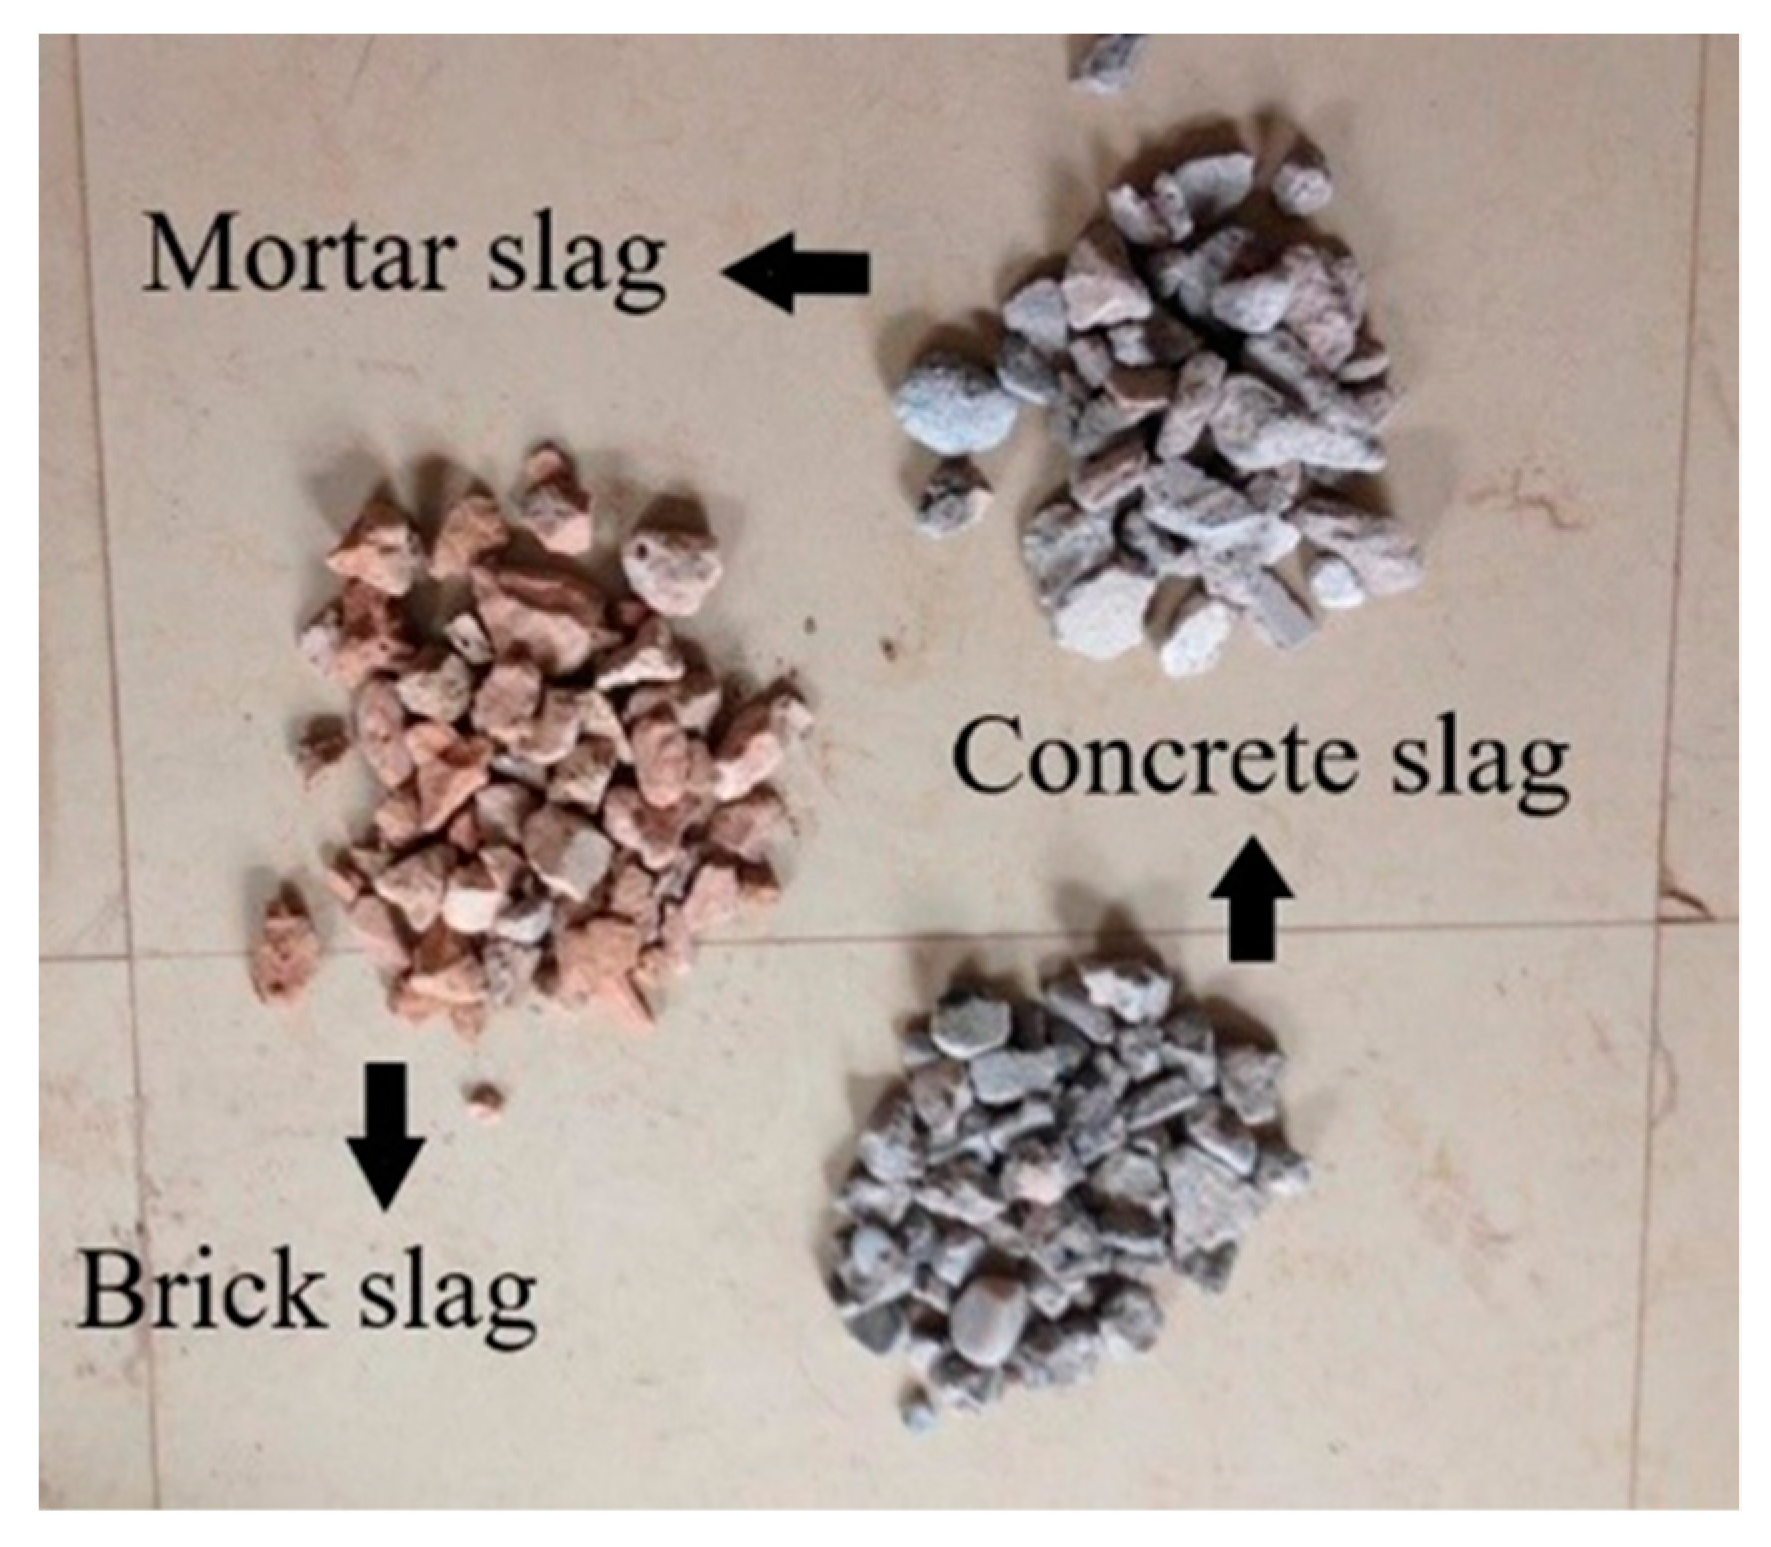
The Xi-Xian North Ring expressway is an important link in the traffic network of Shaanxi Province, with a total length of 122.613 kilometers. Unlike all previous highways in China, its construction used CDW as the embankment filler for the first time. Based on this eco-environmental demonstration project, this research focuses on the differences in the properties of fillers with different proportions through laboratory tests. When the CDW is sorted and the impurities are removed, concrete slag, brick slag, and mortar slag can be obtained, then the CDW is crushed into particles of different sizes (as shown in Figure 1), finally, mixing the three types of recycled aggregates in an appropriate proportion creates the required CDW embankment filler.
The CDW filler is randomly sampled from the material field for composition analysis; Table 1 lists the results of the composition. Brick slag, concrete slag, and mortar slag account for 35%, 40% and 15% of the total mass, respectively, the other components are mainly broken brick and impurities; brick slag, and concrete slag are the main components of recycled CDW filler. Table 2 lists the density and water absorption of the three types of recycled aggregates. The density of concrete slag is the largest, and the water absorption of brick slag is the highest. Considering the low content of mortar slag, this research mainly analyzes the effect of the proportion of concrete slag and brick slag on the performance of the filler. The concrete slag has high strength and acts as the skeleton, brick slag is easily broken and fills in the pores between concrete slag. With changes in brick slag and concrete slag content, the performance of the mixture may show a large difference, and the proportion of brick slag in the CDW is large—the ratios of the samples used in the following test are set as 4:5:1, 5:4:1, 6:3:1, and 7:2:1 (brick slag: concrete slag: mortar slag), and pure brick slag is selected as the comparison.
2.2. Compaction Test
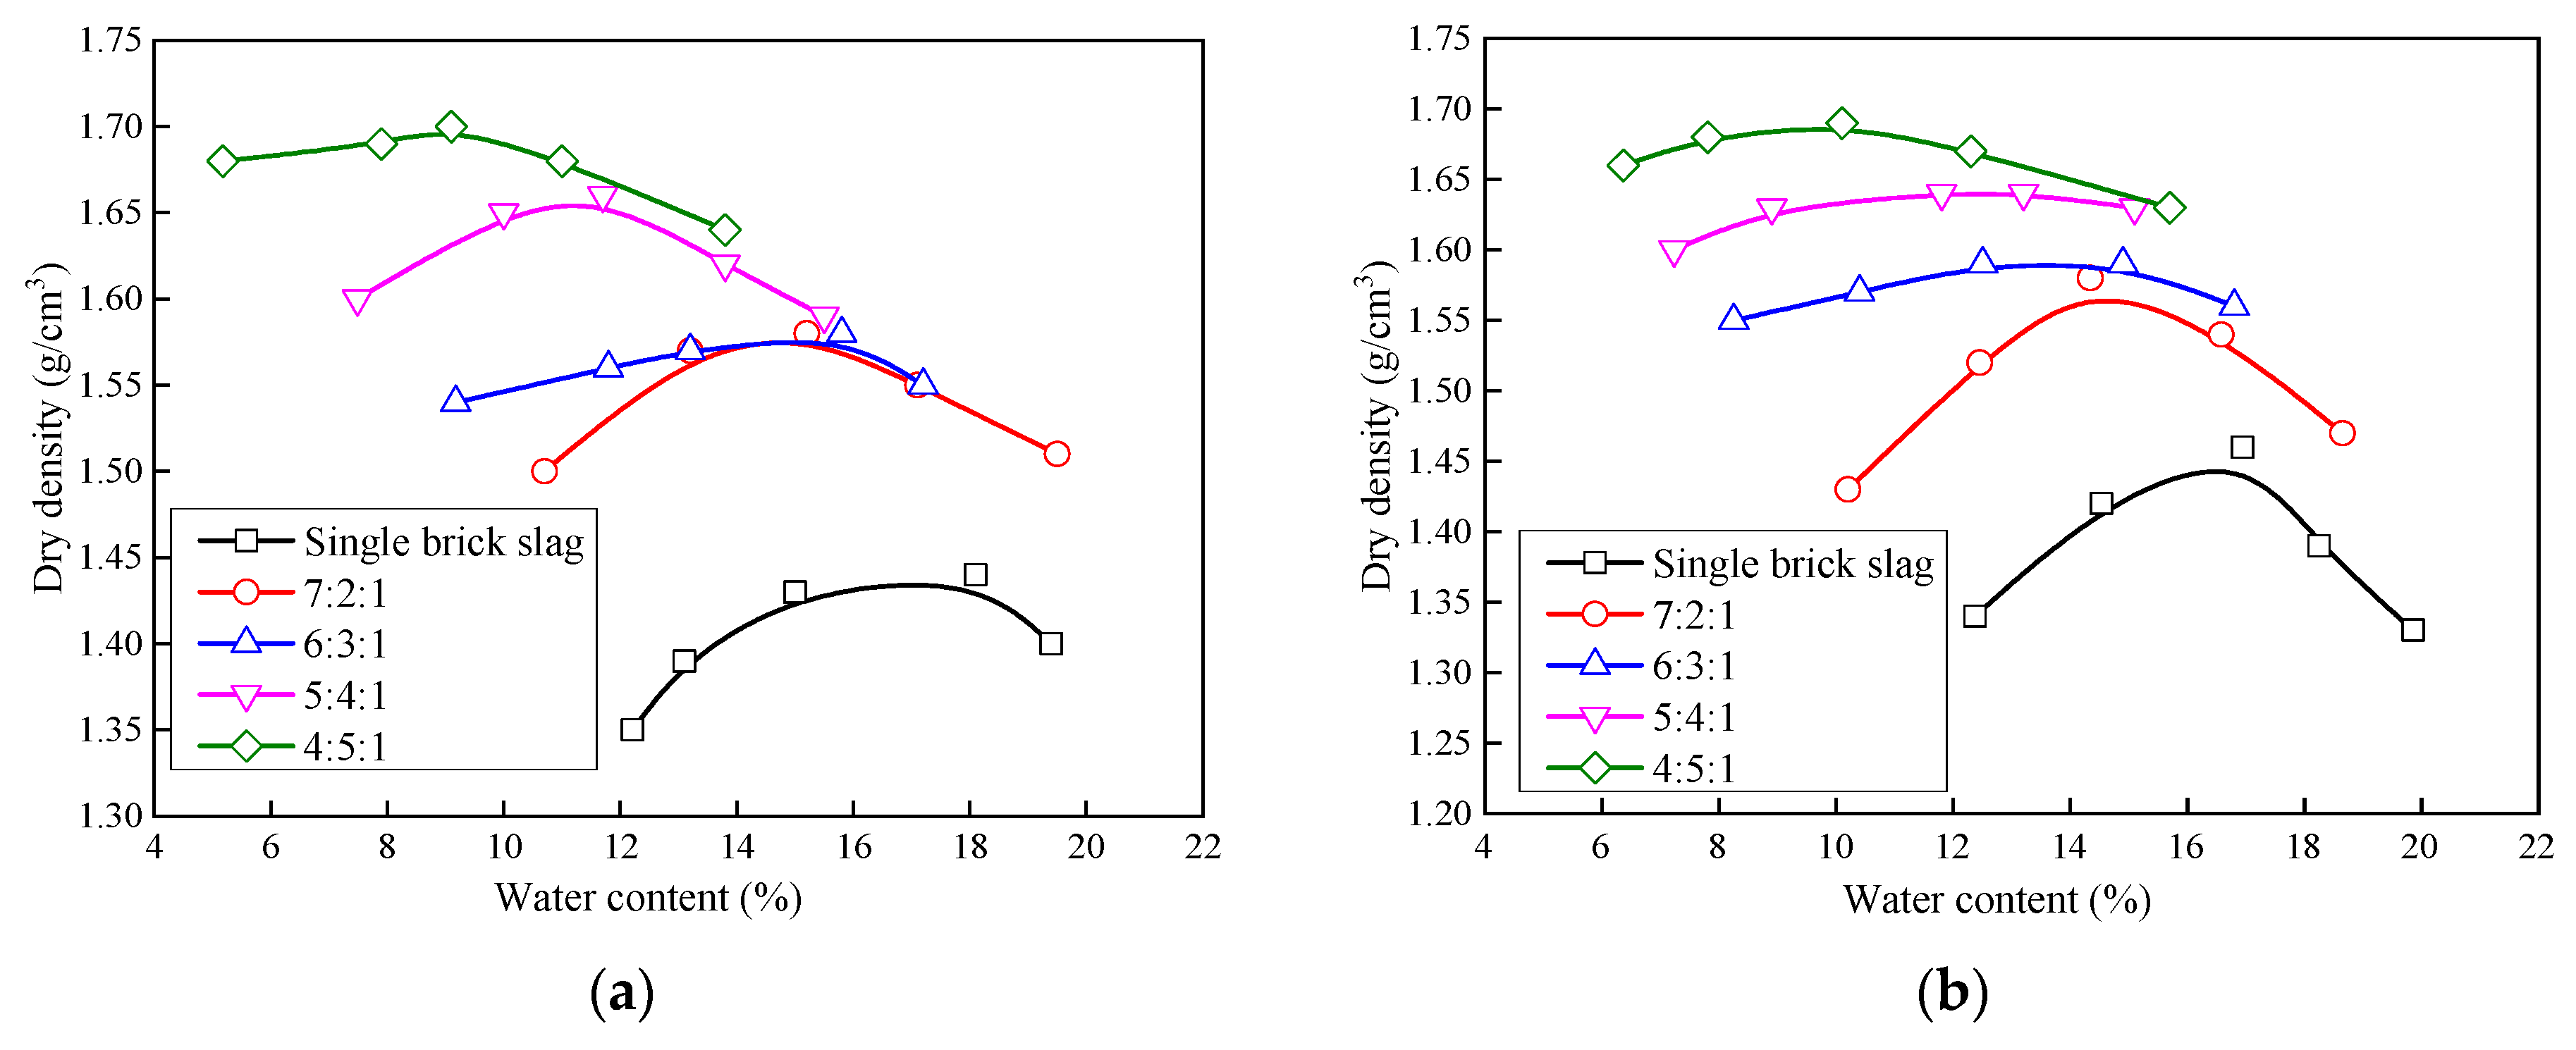
According to the Transportation Industry (JTG) E40–2007 [39], the dense-graded mixture is compacted in three layers. After compaction, the sample has an inner diameter of 15.2 cm, a height of 12 cm, and a volume of 2177 cm3. Figure 2 shows the relationship between water content and dry density; the optimum moisture content and maximum dry density of different ratios can be obtained, as shown in Table 3. Brick slag has low density and a high water absorption—as the content of brick slag increases, the optimum moisture content increases and maximum dry density decreases.
2.3. Sieving Test
The properties of the CDW filler are very dependent on the ratios, mainly due to problems of gradation. In addition to the compaction test and CBR test, we also conducted sieving test before and after compaction. The test results are shown in Table 4. The uniformity coefficient (Cu) reflects the particle size distribution of the material—if the Cu is too large, it means that the soil may be missing the intermediate particle size and the gradation is poor. The curvature coefficient (Cc) is an index of the overall shape of the screening curve, the engineering requirement is that the Cu is greater than five and the Cc is between one and three. From the screening results, the grading of differently proportioned samples basically meets the engineering requirements. The concrete slag content of the sample with a 4:5:1 ratio is high, the concrete slag is not easily broken and acts as a skeleton, so the particle size is relatively large after compaction and the Cu is small. As the concrete content decreases, the Cu first increases and then decreases. The particle size of the single brick slag sample is small after compaction. Note that the Cc of the lower layer is close to three.
2.4. CBR Test
A CBR test is used to assess the carrying capacity of CDW mixture, and the detailed CBR test is carried out based on JTG E40–2007 [39]. The samples with different ratios are compacted in layers, then the samples are immersed in water for 4 days and four nights. After the swelling capacity of the samples is measured, the penetration test is carried out to analyze the CBR value. The control parameters are shown in Equations (1) and (2):
where is the initial record value of the dial indicator before the samples is immersed, mm; is the record value after the samples is soaked in water for 4 days, mm.
where CBR is bearing ratio when the penetration is 2.5 mm, %; is the unit pressure, kPa.
The results of the CBR tests are shown in Table 5. Although the strength of the brick slag is small, the CBR value does not decrease as the brick slag content increases, and the CBR value of the samples with a 5:4:1 ratio is the largest and that of the pure brick slag is the smallest. According to JTG F10-2006 [40], the minimum CBR value of embankment fillers is required (see Table 6). The CBR value of recycled CDW filler is between 40.24% and 98.85%, which fully meets the requirements of embankment, and the amount of water swelling is extremely small.
2.5. Creep Test
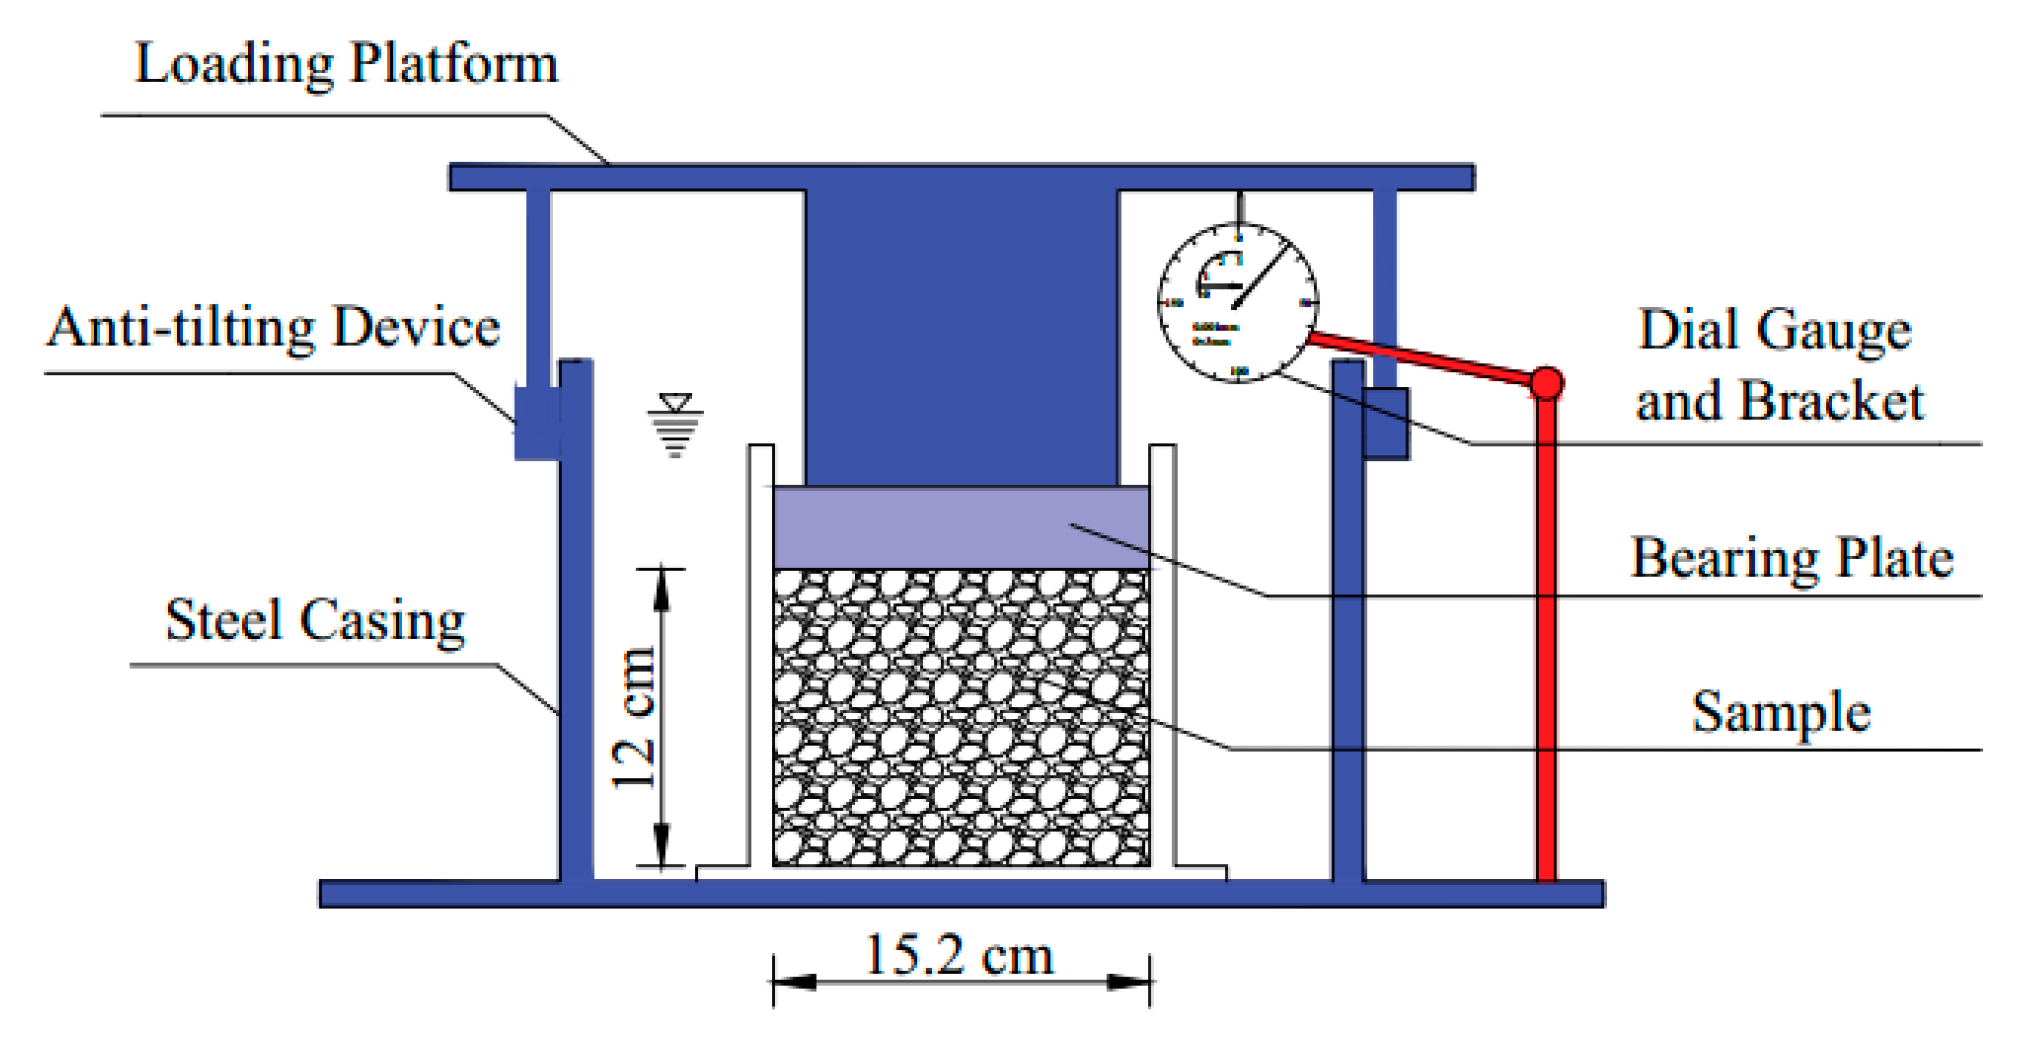
In order to study the long-term deformation characteristics of different proportioning fillers, the creep test is mainly carried out in an unfavorable saturated state, and the compression creep equipment which can allow samples to be under saturated conditions is designed to guarantee the test (see Figure 3). The test instrument consists of a steel sheath, a bearing plate, a loading platform, an anti-inclination device and a dial gauge. The dial gauge can be accurate to 0.001 mm to meet the accuracy of the test. During the test, the required weight is directly applied to the loading platform.
In order to simulate the load at the different embankment depths of the project, the test is loaded in five levels. According to the self-weight of the pavement structure layer, the first level load is calculated to be 38.59 kPa, the CDW embankment depth is 3.54 m, and the loads of other levels are calculated according to the weight of the recycled filler, as shown in Table 7.
The ratios of samples used in the creep test are 5:4:1, 7:2:1, and single brick slag. According to the compaction test and CBR test, the maximum dry density of the recycled CDW samples with a 5:4:1 ratio is similar to the samples with a 4:5:1 ratio, however, the CBR value of samples with a 5:4:1 ratio is larger than that of samples with a 4:5:1 ratio, so samples with a 5:4:1 ratio is firstly selected. The single brick slag has the smallest CBR value and dry density, which is selected as the comparison. Finally, a 7:2:1 ratio with less recycled concrete is selected. Because the unfavorable state can better reflect the creep properties of different proportions, this research mainly centralizes the saturated tests. The saturated tests are carried out under five load levels, and the natural tests under the first and second load levels are selected as the criterion; a total of 21 samples are prepared.
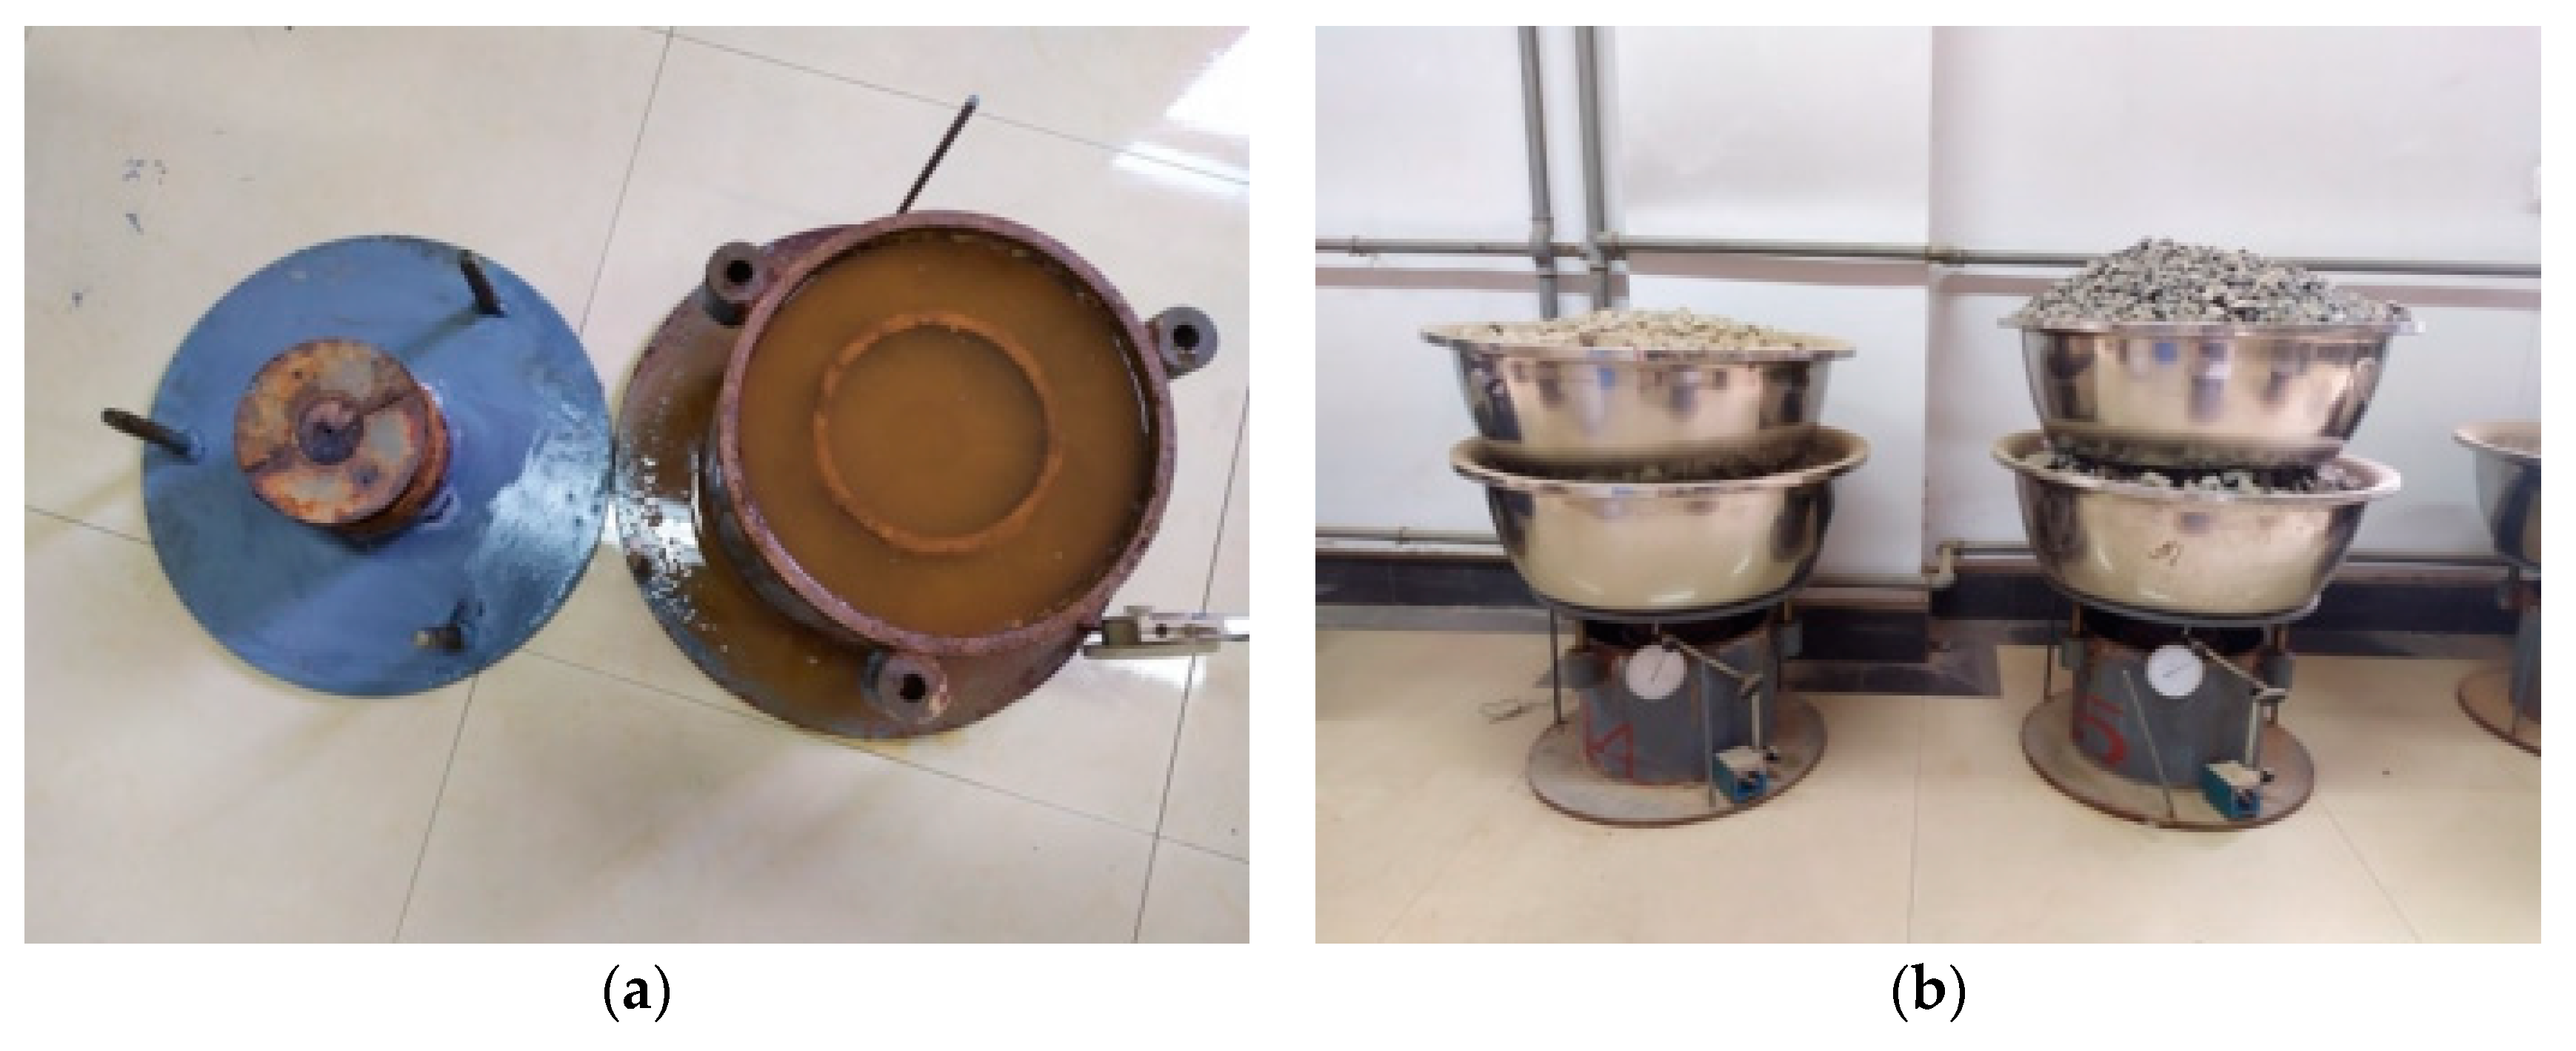
The samples are prepared according to the field compactness, which was 95%. Firstly, the compacted samples are placed in the steel sheath and, if saturated tests are to be performed, water is added to the steel sheath until the sample is immersed. After 96 hours, it is considered that the sample is in a saturated state. Finally, the load is applied and the deformation of the sample is recorded, as shown in Figure 4.
Half an hour after loading, the deformation is recorded as instantaneous deformation, record three times a day within five days after the start of the test, once a day from 5 days to 3 months, once every 3 days from 3 months to 6 months, once a week after 6 months. For samples under saturated condition, water must be added to the steel casing periodically to keep samples saturated.
3. Results
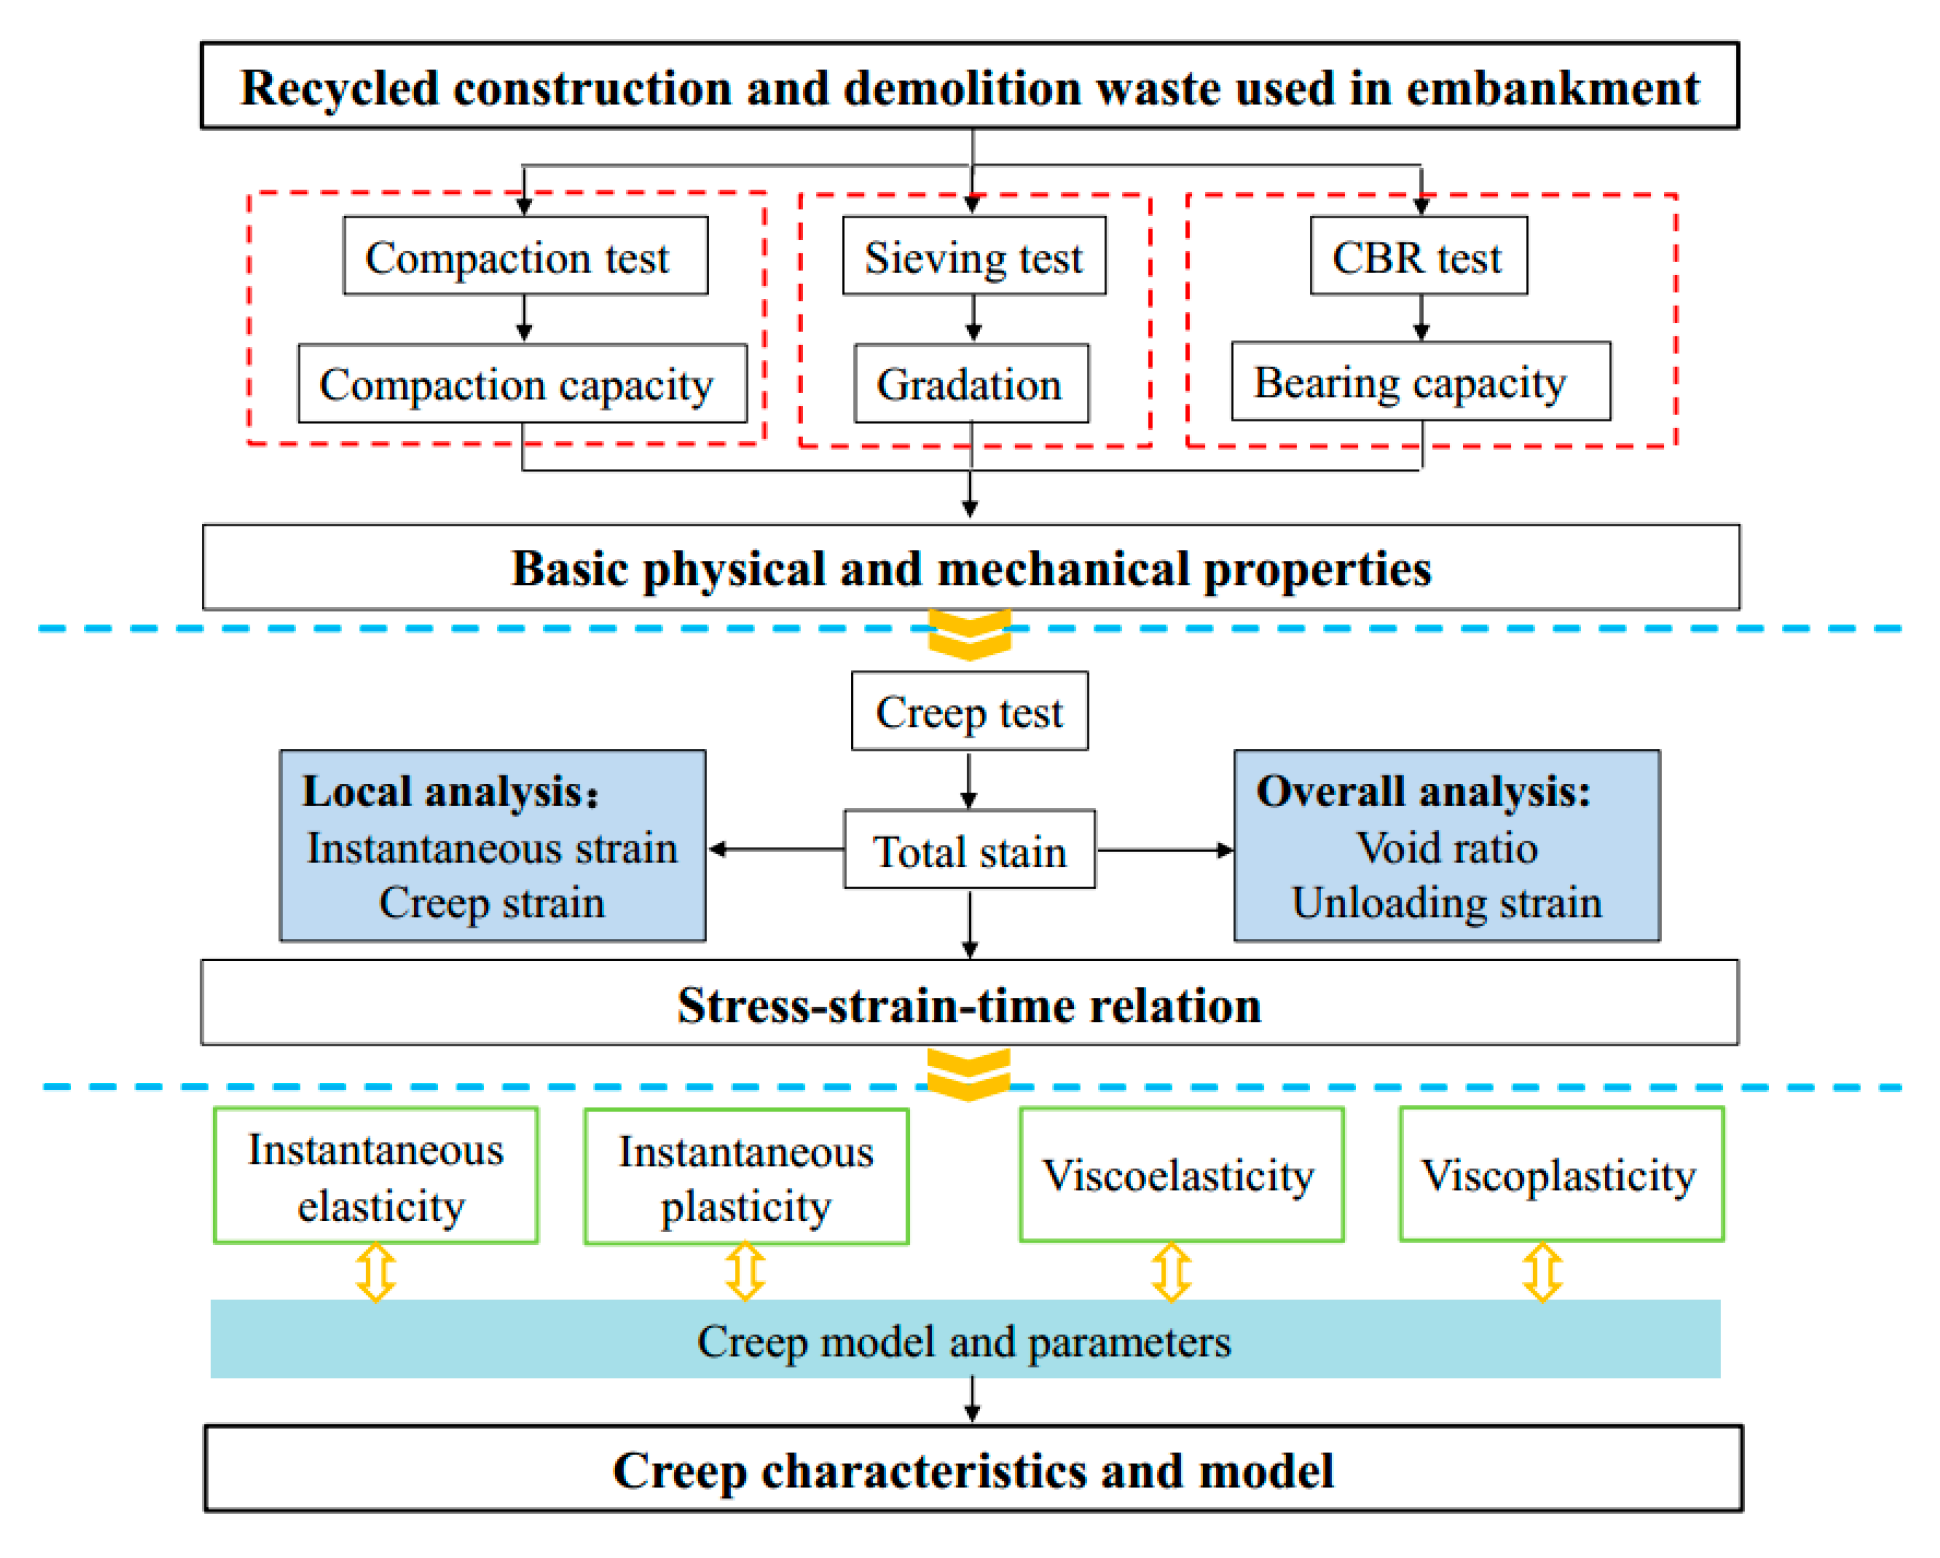
Embankment deformation usually lasts for several years, however, the tests under natural conditions are carried out for about 60 days. Considering that the creep mechanism of the samples’ under saturated conditions is complex and the time to reach stability is long, we conducted continuous observations to further understand the creep characteristics, which lasted for about 700 days; then, the samples were unloaded to analyze the deformation characteristics of the CDW filler. The overall conceptual framework is shown in Figure 5 below.
3.1. Analysis of Total Strain
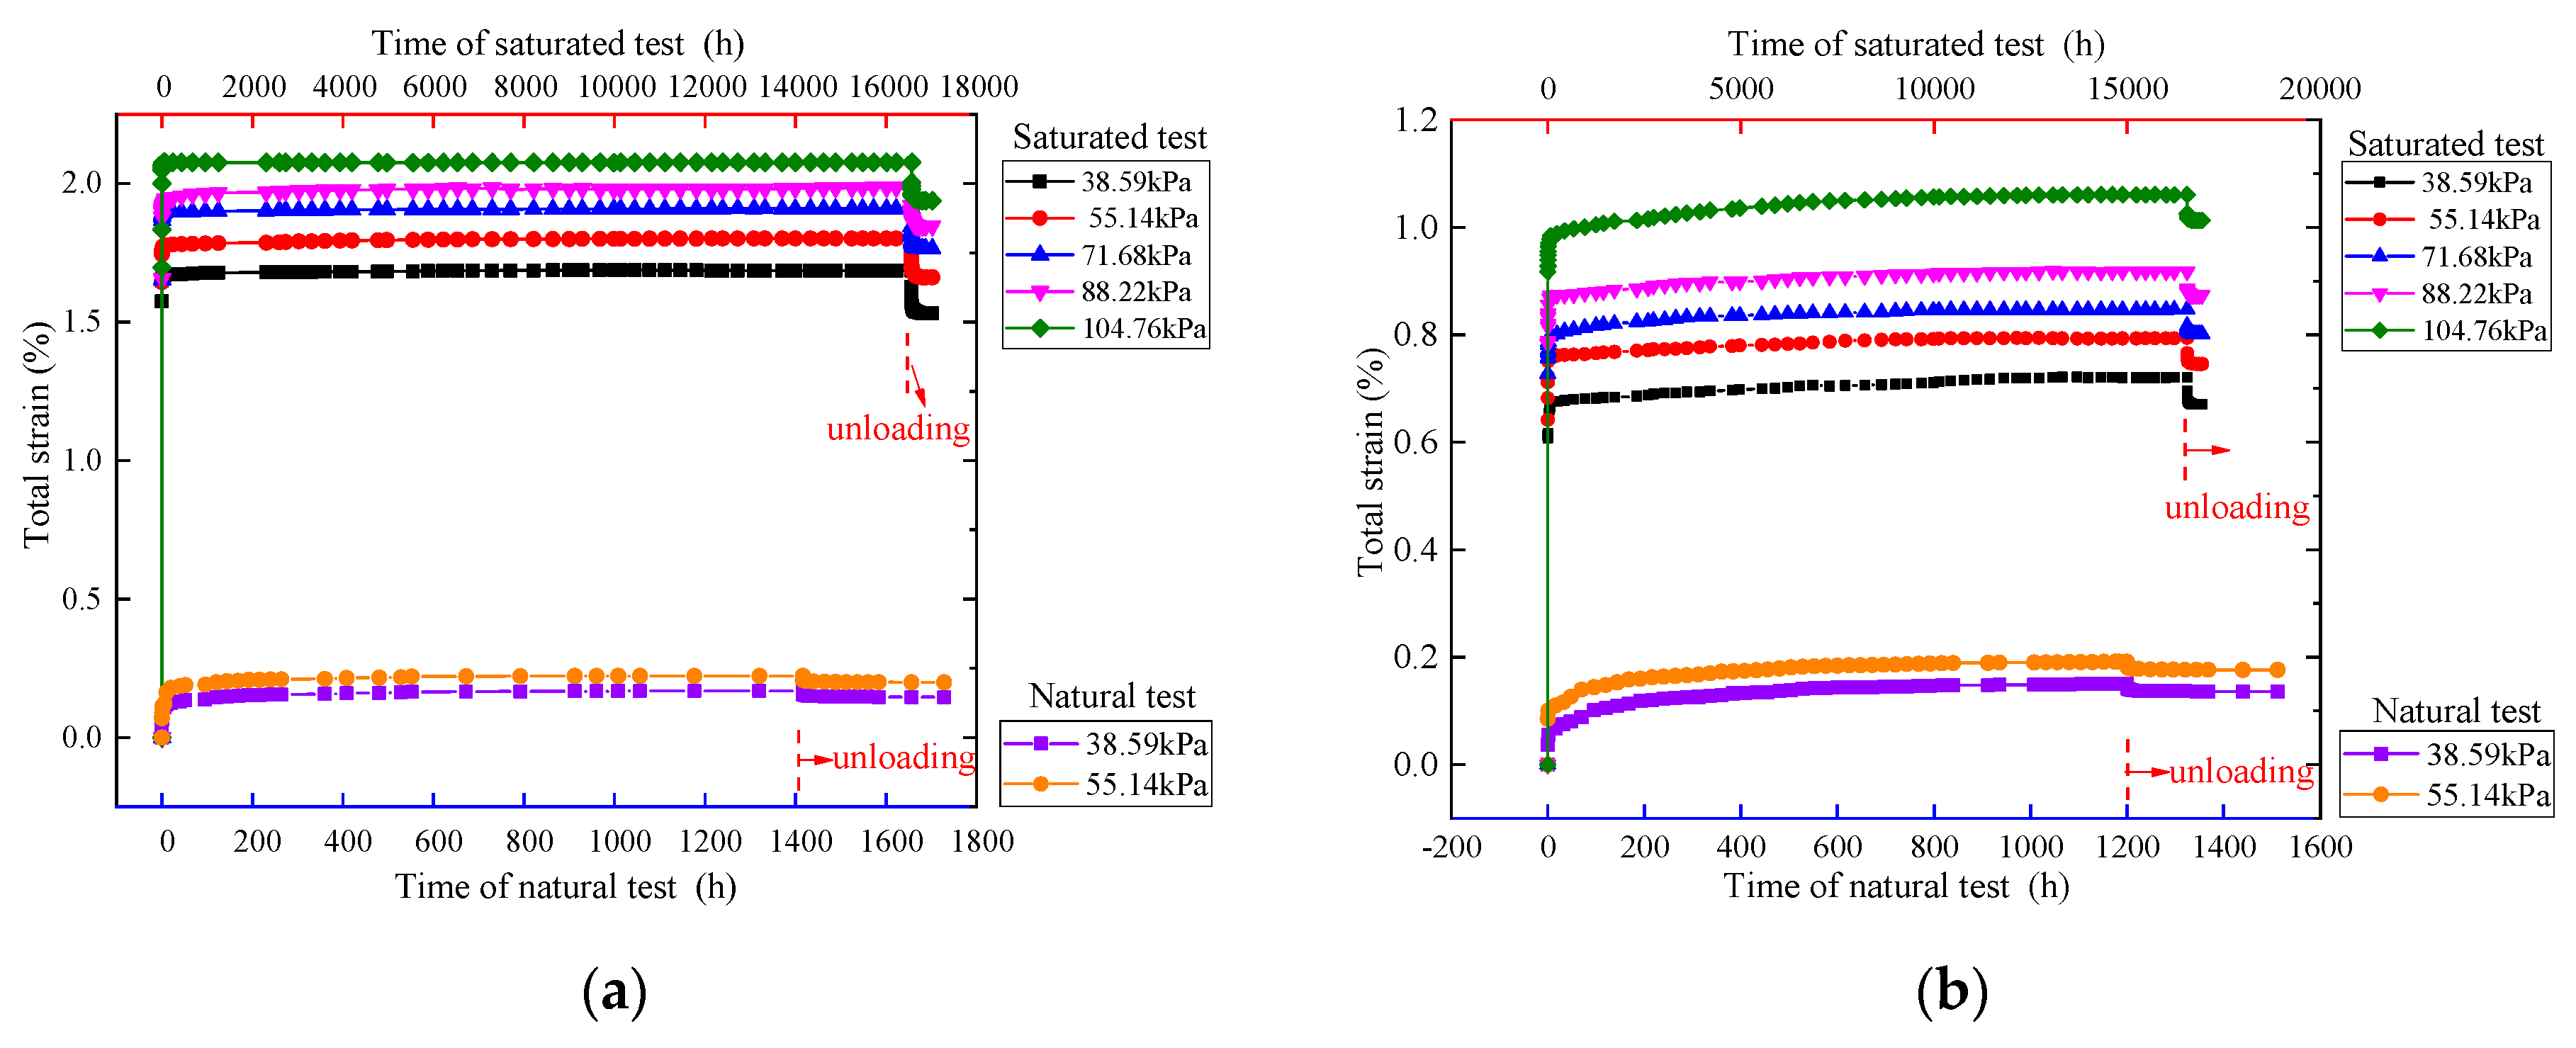
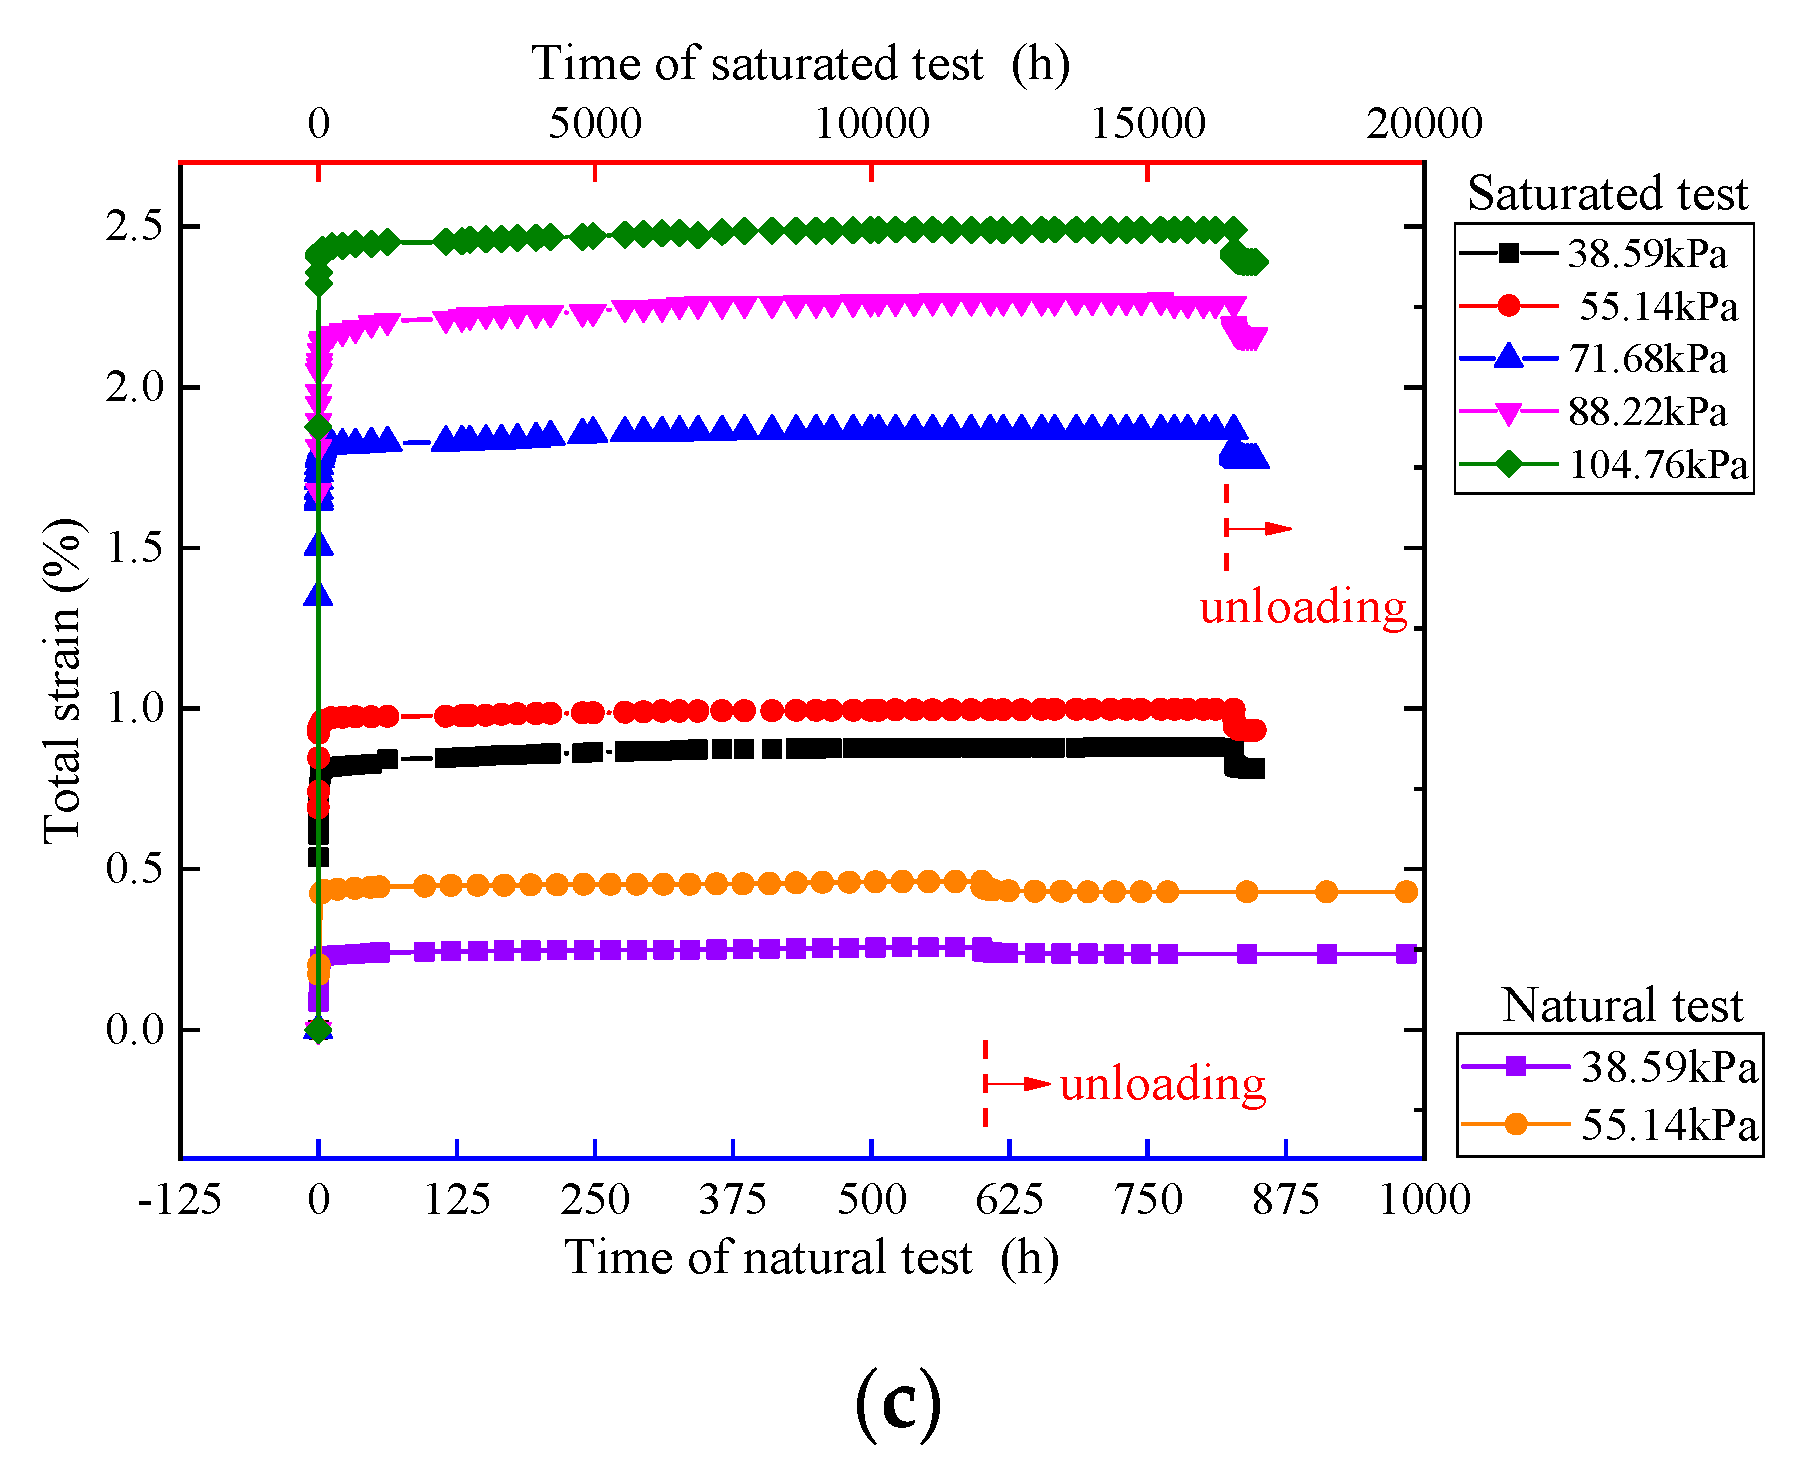
The stress–strain curves and unloading curves of the samples under natural conditions and saturated conditions are plotted on a graph—the top axis represents the test time under saturated conditions, and the bottom axis represents the test under natural conditions, which can better compare the regeneration under different conditions, as shown in Figure 6. It can be seen that the creep strain of the CDW filler under test stress tends to be stable with time, which belongs to stable creep, and total deformation can be divided into instantaneous deformation and creep deformation. It can be seen from Figure 6 that under the first level and the second level load, the creep strain under saturated conditions is much larger than that under natural conditions. Water has a significant impact on the deformation of recycled CDW filler.
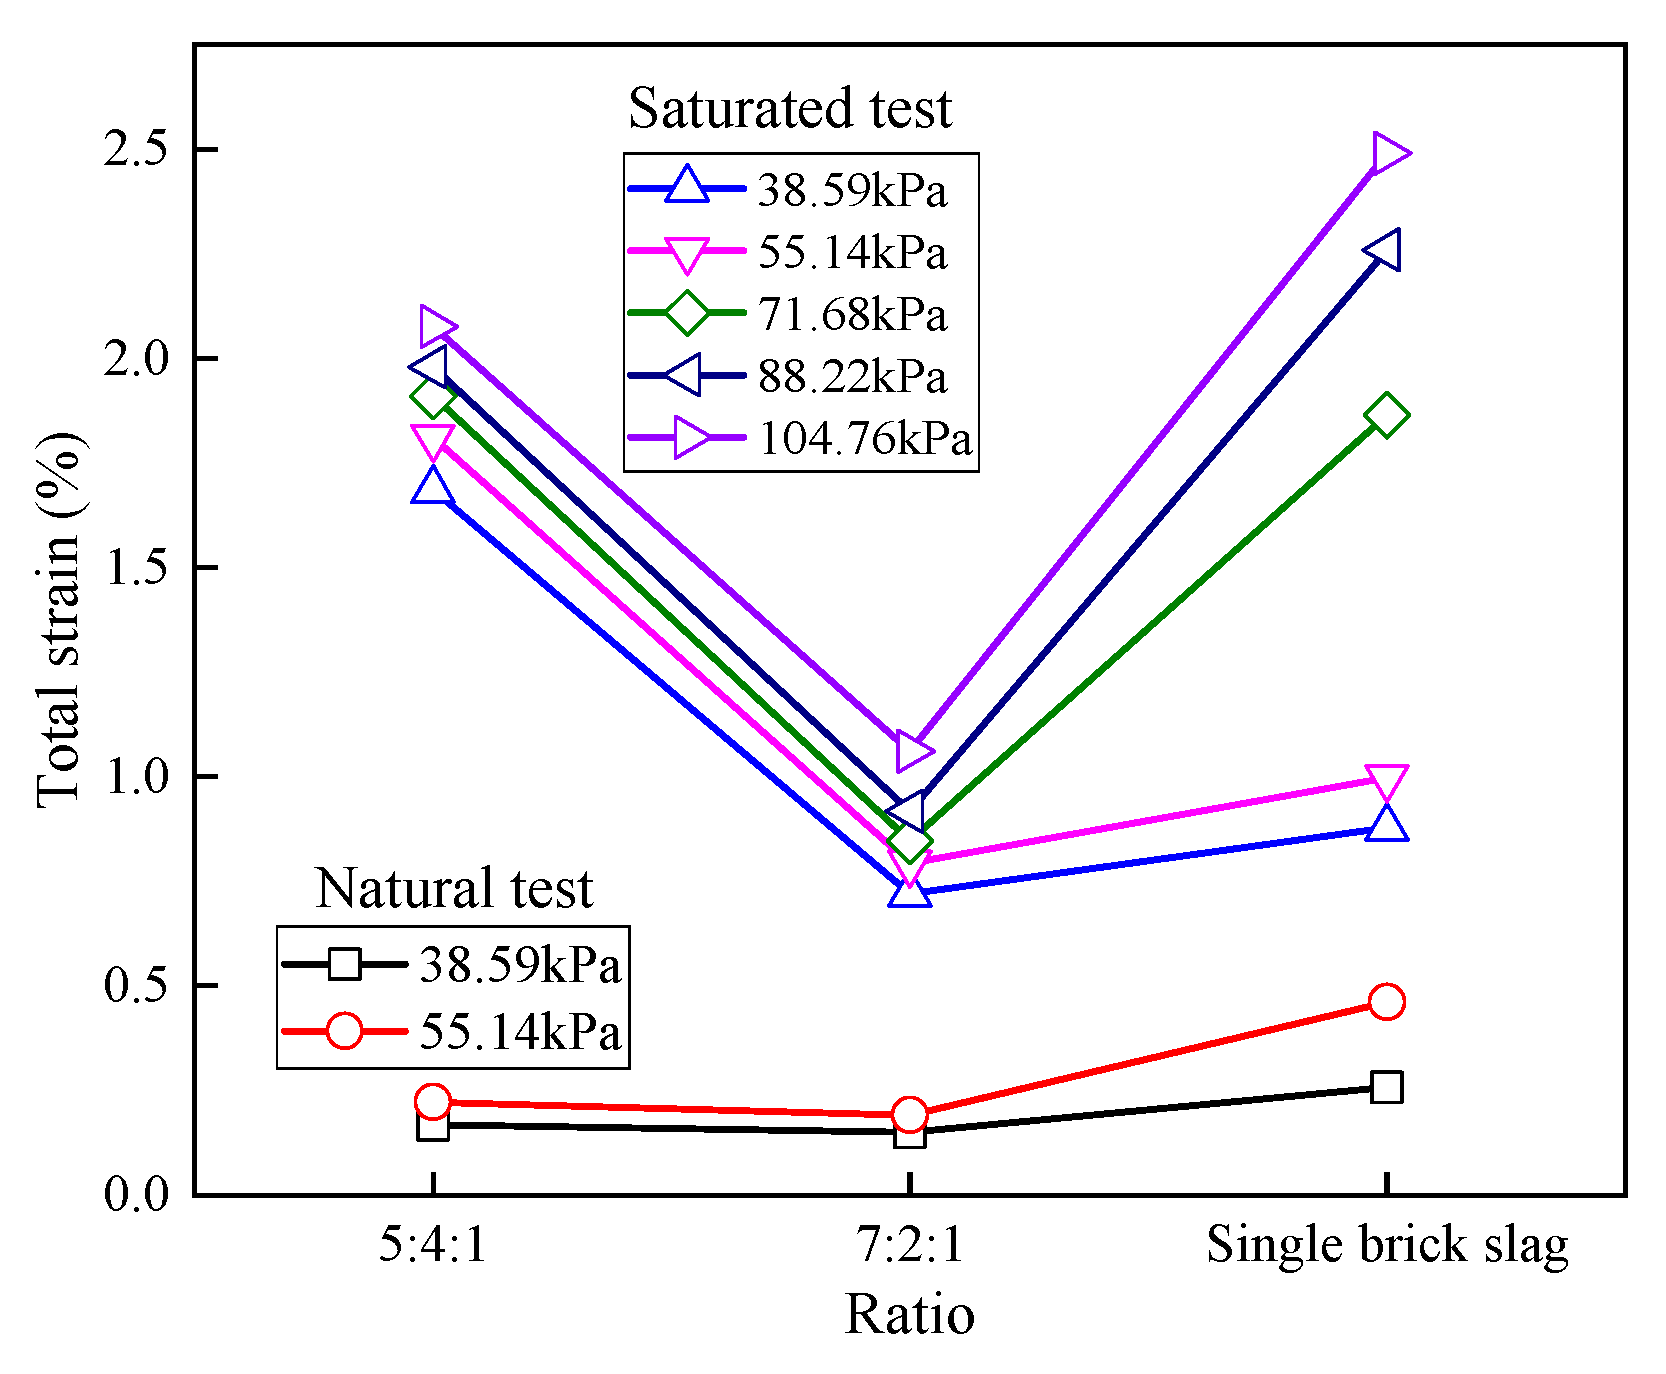
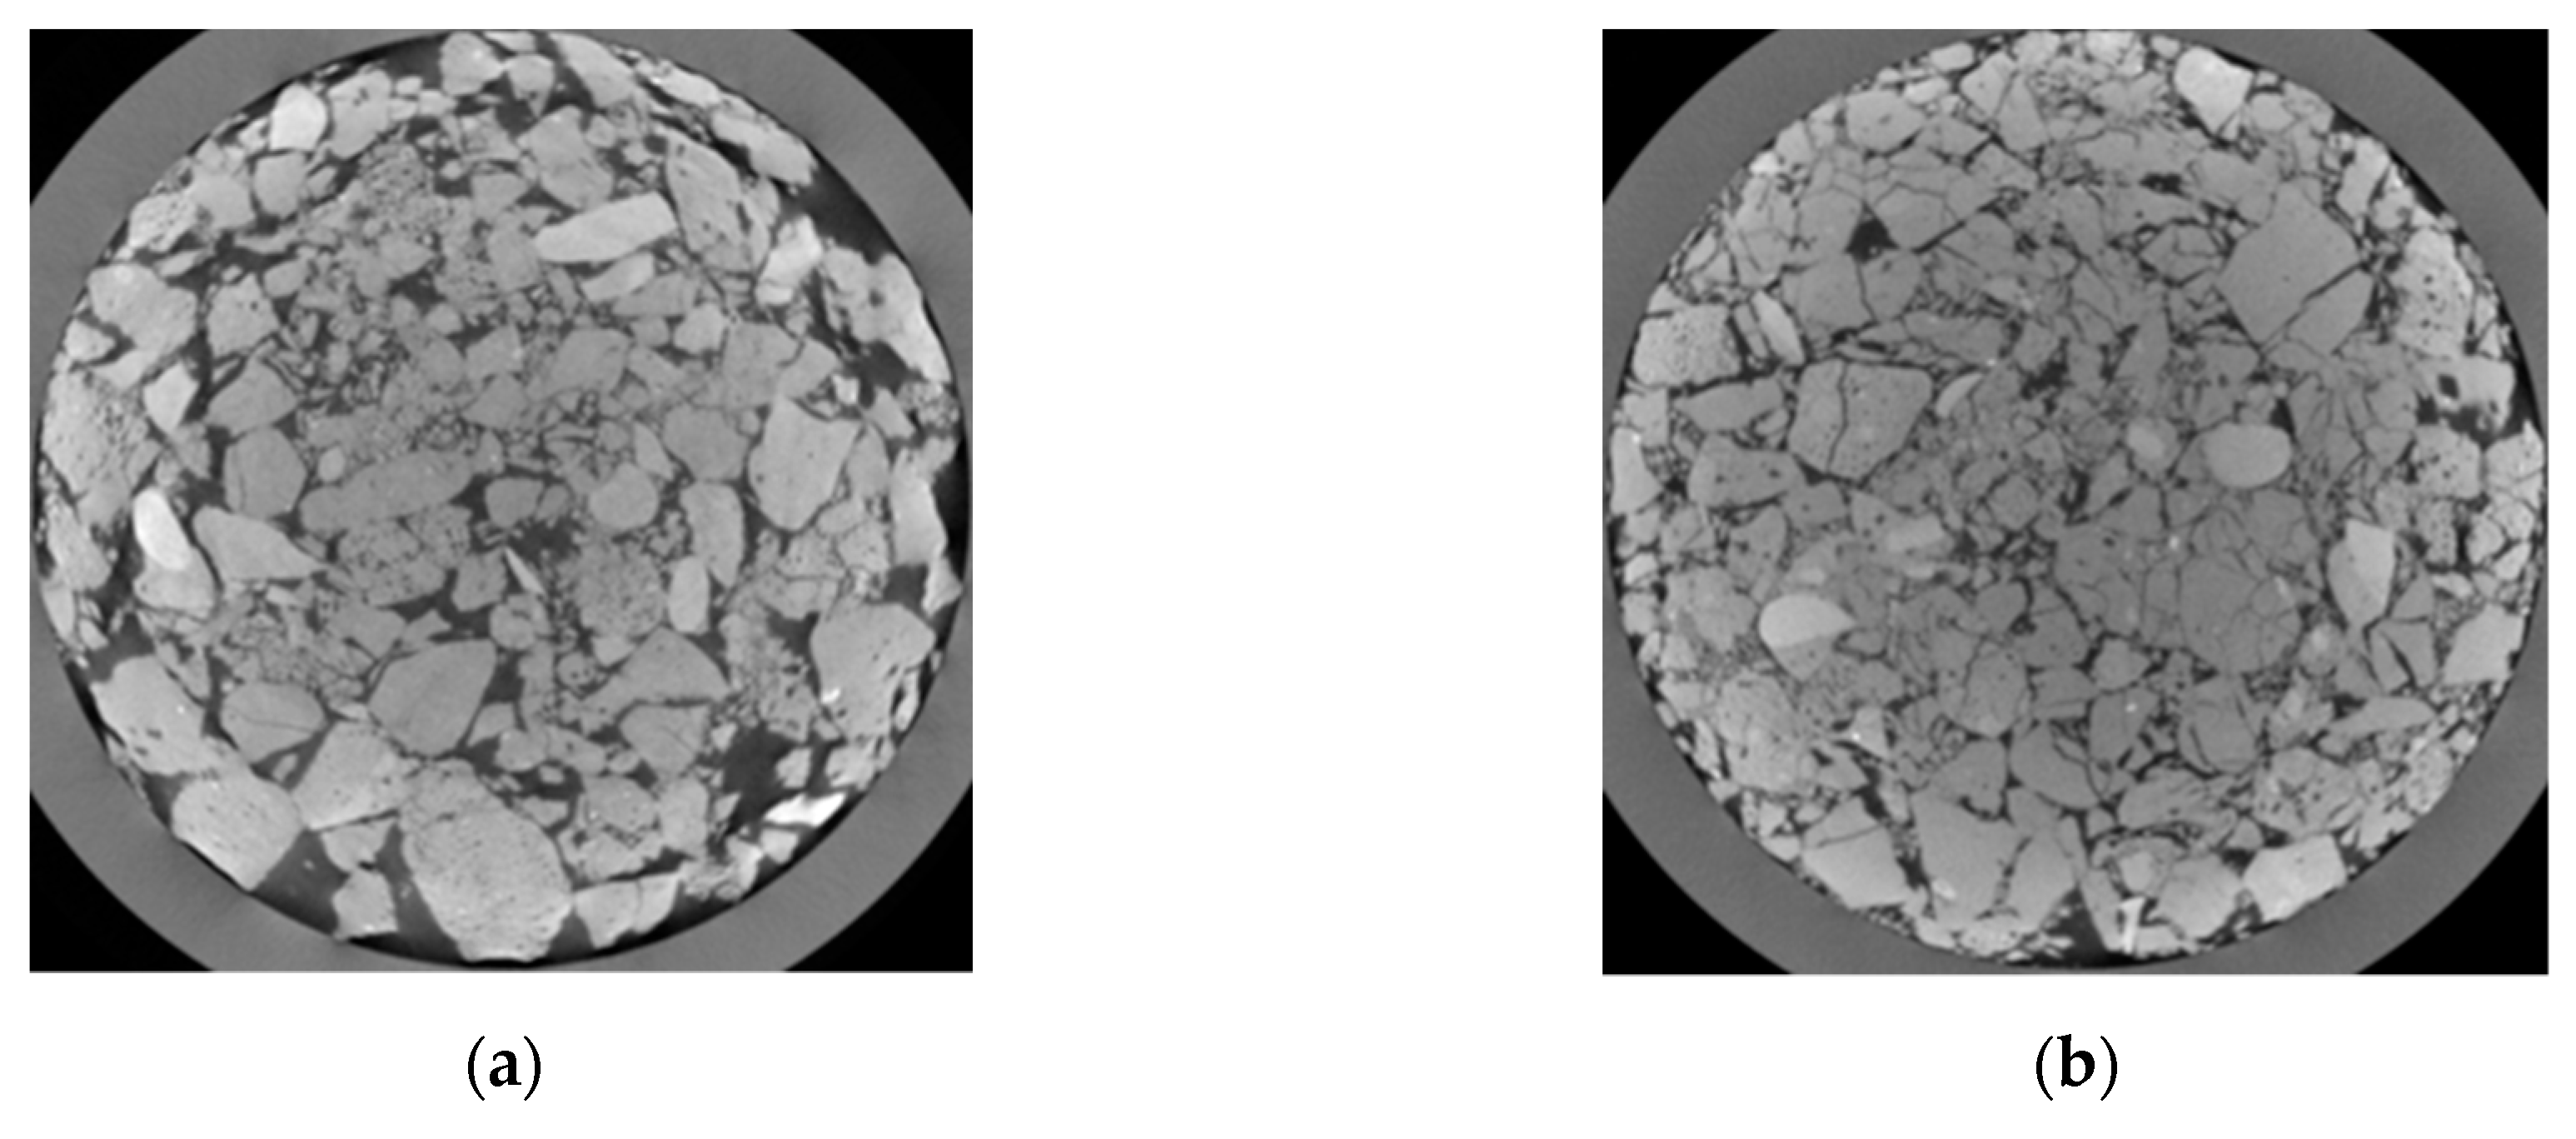
Figure 7 shows the relationship between total strain and ratio. It can be seen that, under the same load, the total strain of the samples with a 7:2:1 ratio is the smallest, the total strain of the single brick slag is the largest, and the strain of the sample with a 5:4:1 ratio is between the two. The strength of the mortar is low, but the proportion of mortar slag is small, so the effect on deformation is small. Therefore, the main consideration is the influence of brick slag and concrete slag; the brick slag has low strength, and the particles will break, compact, rotate, and slide after being loaded. The concrete has high strength and hardly breaks under the same load, the concrete slag acts as the skeleton in the mixture. Furthermore, Li et al. used a CT scan to observe the internal microstructure of the mixture [41,42], the image scanned by CT is a grayscale image, and the black parts indicate the pores of the sample, as shown in Figure 8. For the recycled aggregate used in this paper, the concrete slag has a high strength and acts as a skeleton in the mixture, while the brick slag and the mortar slag are easily broken, and the broken parts fill the gap between the concrete skeletons.
3.2. Analysis of Void Ratio
The analysis of the void ratio of the samples can help us to further understand and verify the deformation mechanism of recycled CDW filler. The void ratio of the samples can be obtained by the following Equations (3)–(5):
where is initial void ratio, is particle density, g/cm3, is initial water content (%), is initial density (g/cm3).
where is time (h), is deformation when time is (mm), is the initial height of the samples (mm).
where is unit deformation, is void ratio when time is i.
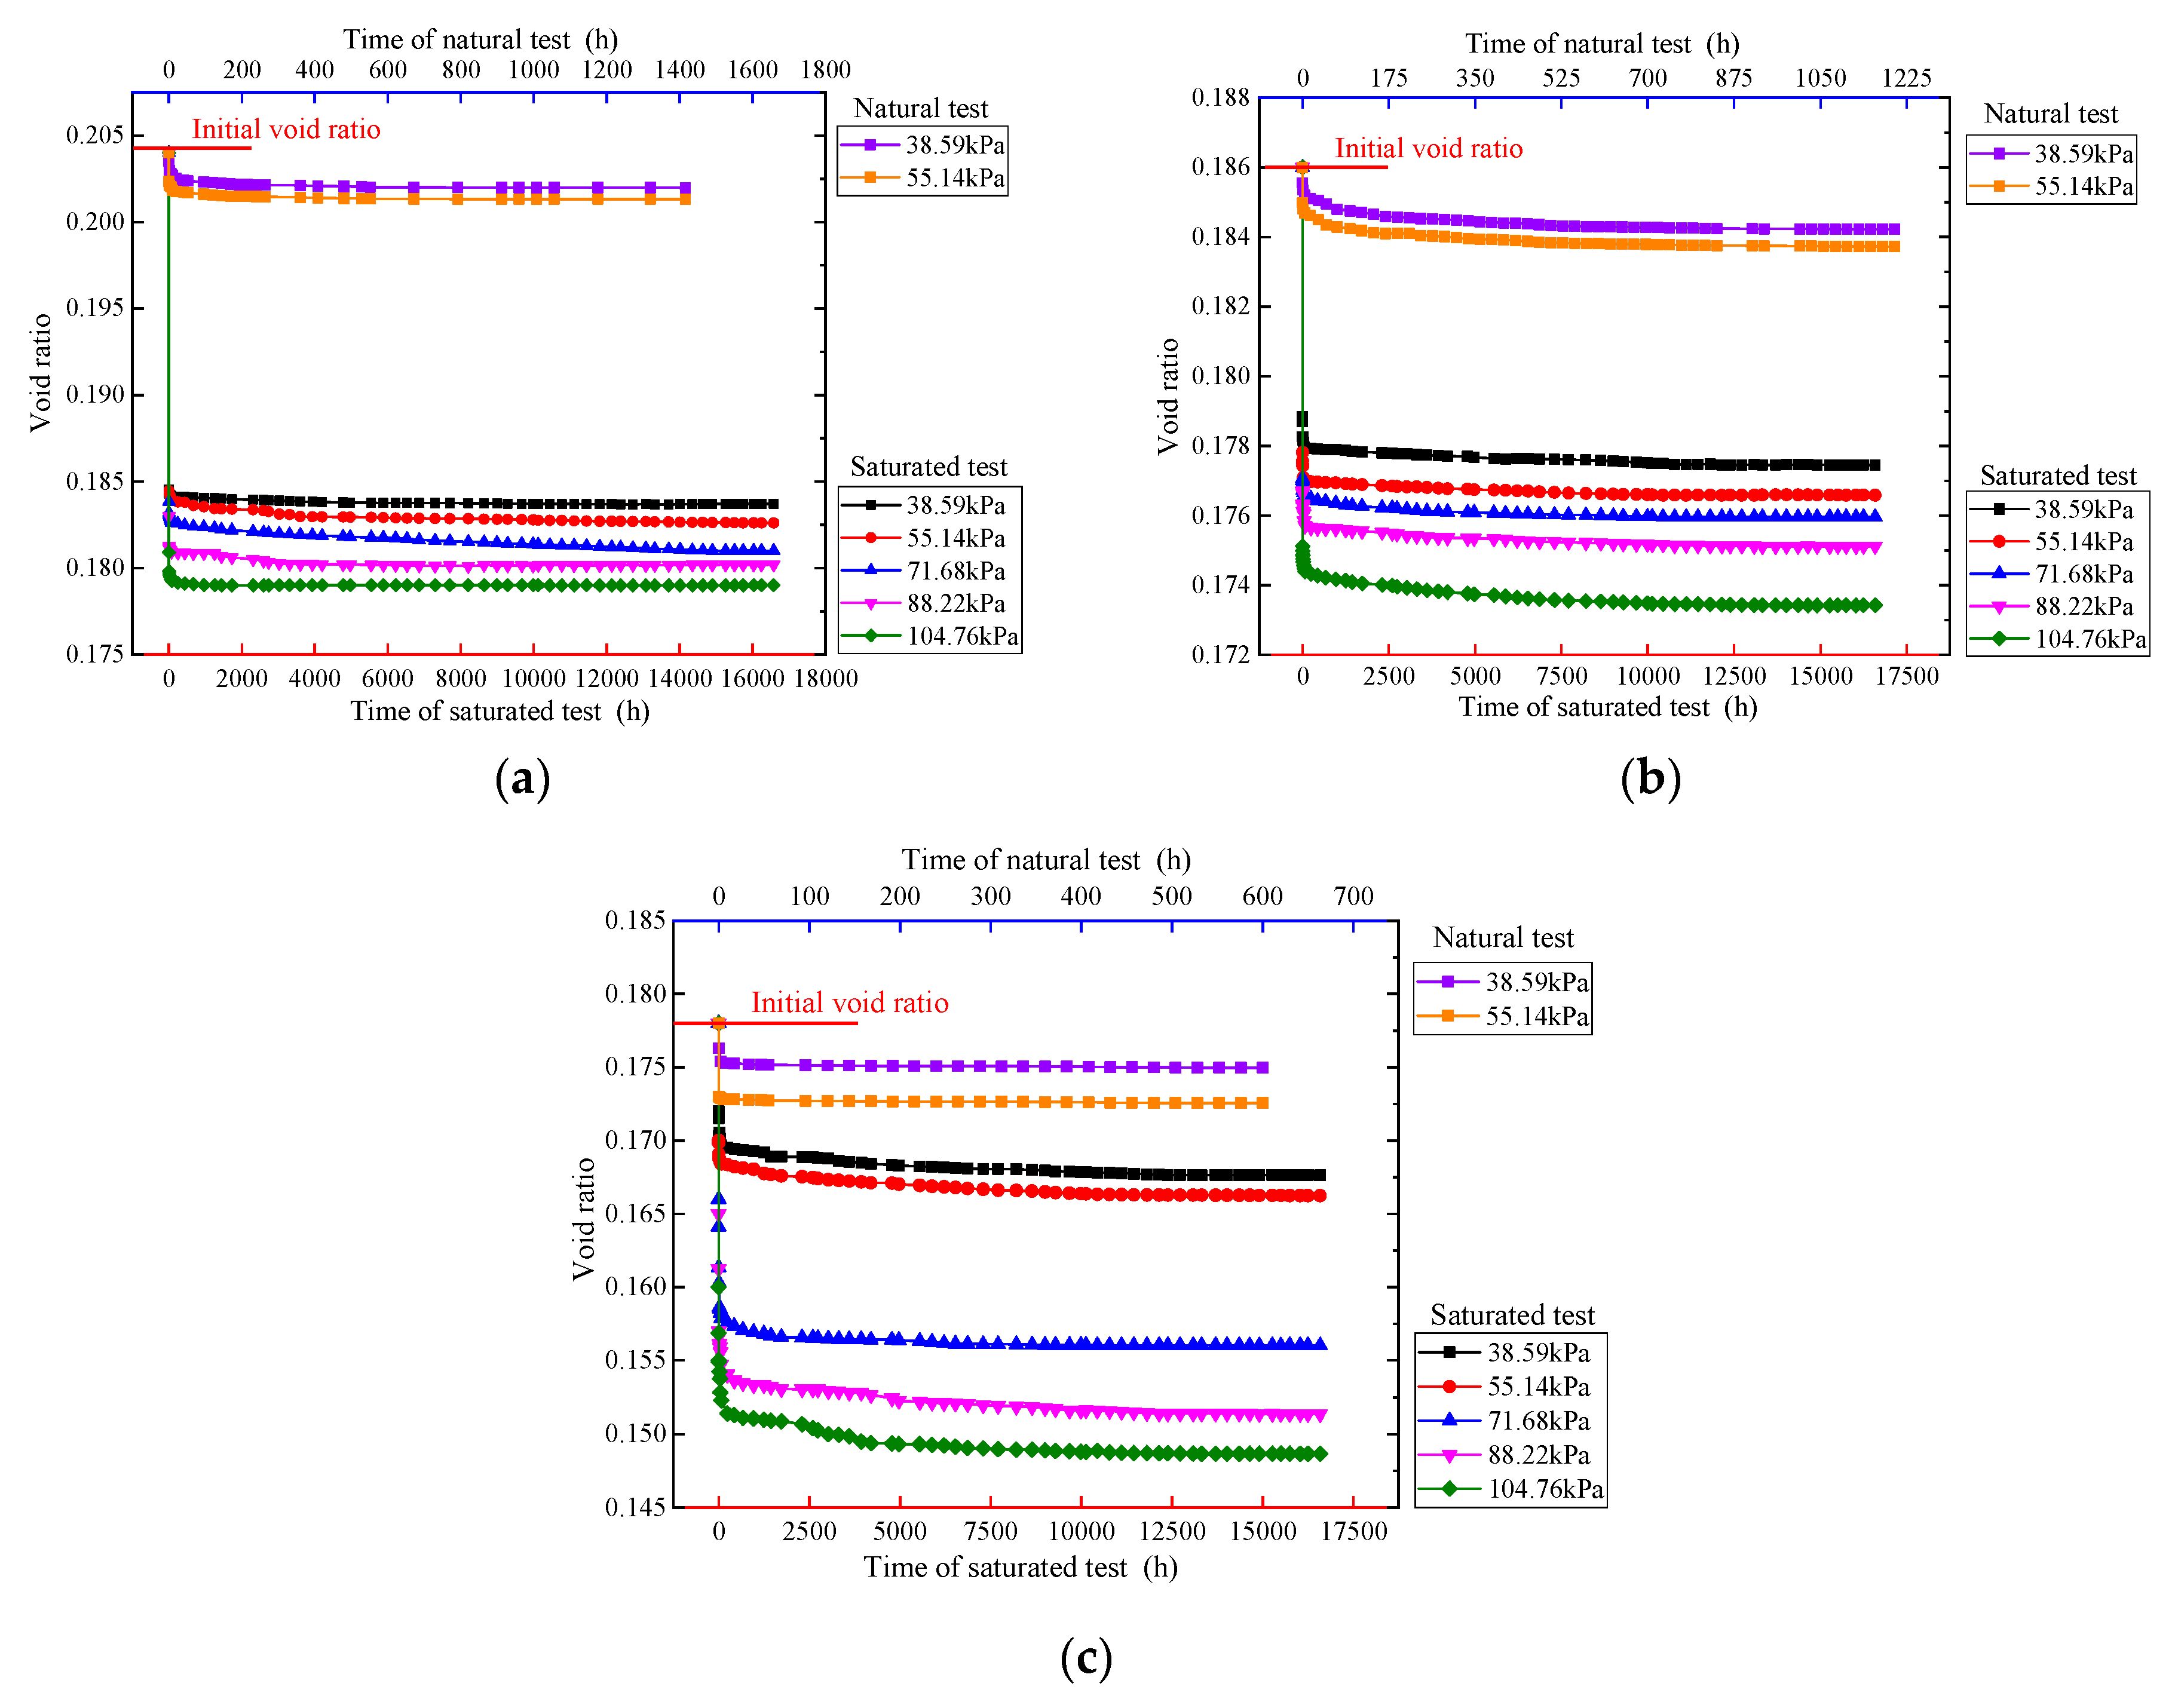
Figure 9 shows the relationship between the time and void ratio of the creep test, the top axis represents the time under a natural test, and the bottom axis represents the time under a saturated test. As time goes on, the void ratio of samples gradually decreases, that is, samples gradually become dense. The void ratio of the saturated samples varies sharply in the earlier period—water not only softens the particles, but also reduces the friction between the particles, ultimately promoting the rearrangement of the particles. In general, as the brick slag content increases, the final void ratio of samples gradually decreases. The brick slag content of samples with a 5:4:1 ratio is small; brick slag cannot fill in the concrete skeleton well, and the void ratio is large, but the concrete strength is high, so skeleton is not easily broken and the void ratio changes are relatively small. Brick slag is sensitive to changes in load, as the load increases, the brick slag breaks and the sample is compacted.
3.3. Analysis of Instantaneous Strain
When the load is applied to the compacted specimen, the equilibrium state between the particles is broken and the instantaneous deformation occurs due to the fragmentation, slippage and rearrangement of the recycled particles. Figure 10 shows the relationship between instantaneous strain and ratio. Under the same load, the instantaneous strain of the samples under natural conditions is much smaller than the samples under saturated conditions, as water greatly accelerates the rate of slippage and the filling of particles, and the instantaneous strains of the two conditions differ greatly. The larger the load, the greater the instantaneous strain of the sample. The instantaneous strain of the different ratios is also quite different; under the same load, the instantaneous strain of the samples with a 7:2:1 ratio is almost the smallest, and the single brick slag differs greatly under different conditions and loads, as brick slag has a low strength and is easily broken, and the deformation is unstable without the support skeleton. Compared with Figure 6, it can be seen that the instantaneous strain accounts for 65%–95% of the total strain. In order to reduce the settlement of the embankment, the compactness during construction should be strictly checked.
3.4. Analysis of Creep Strain
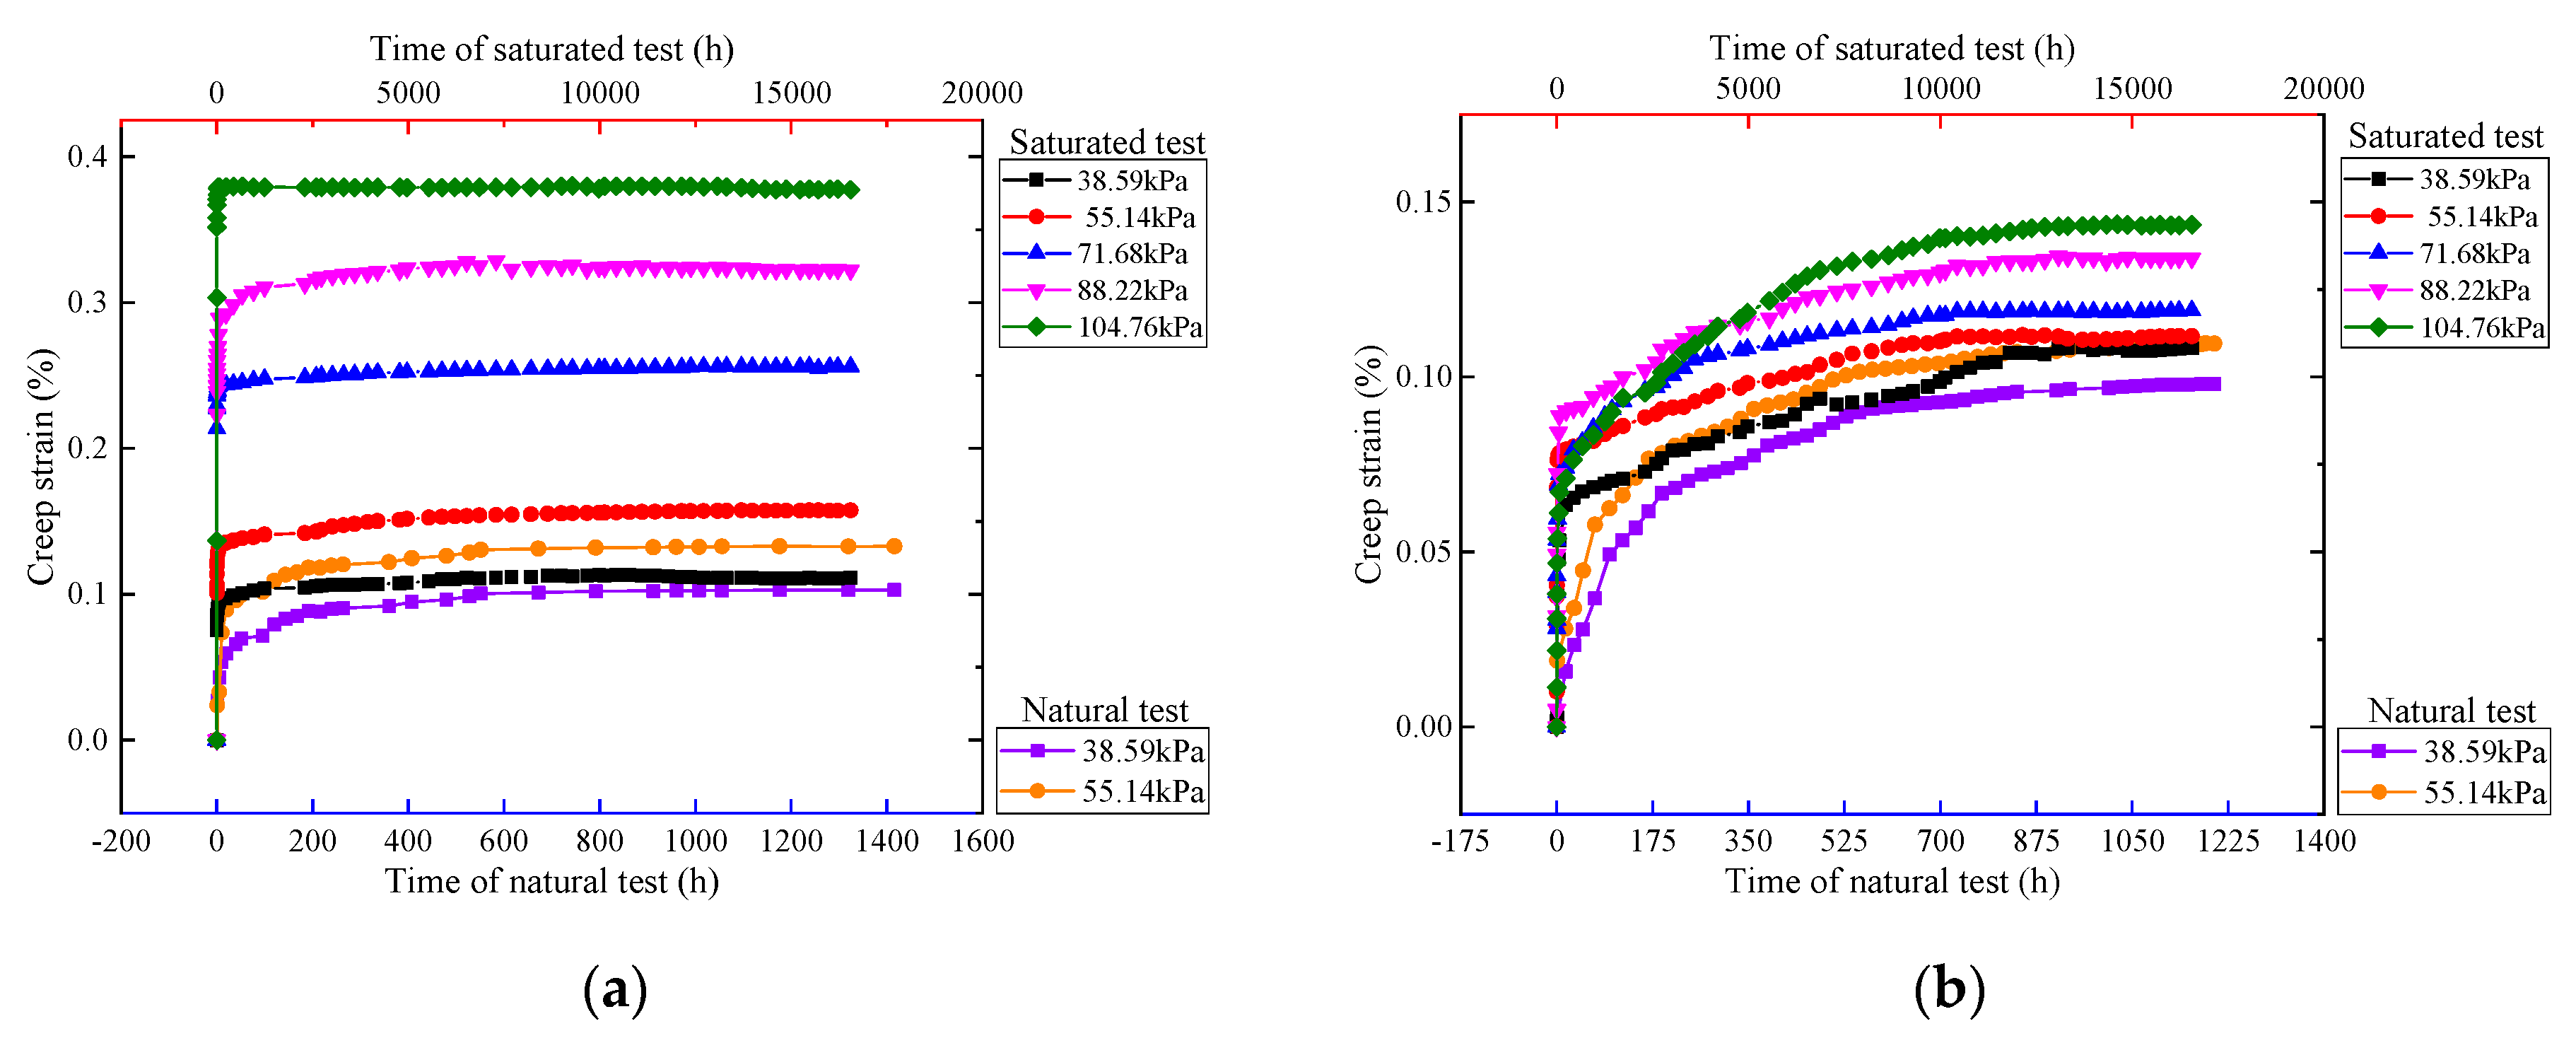
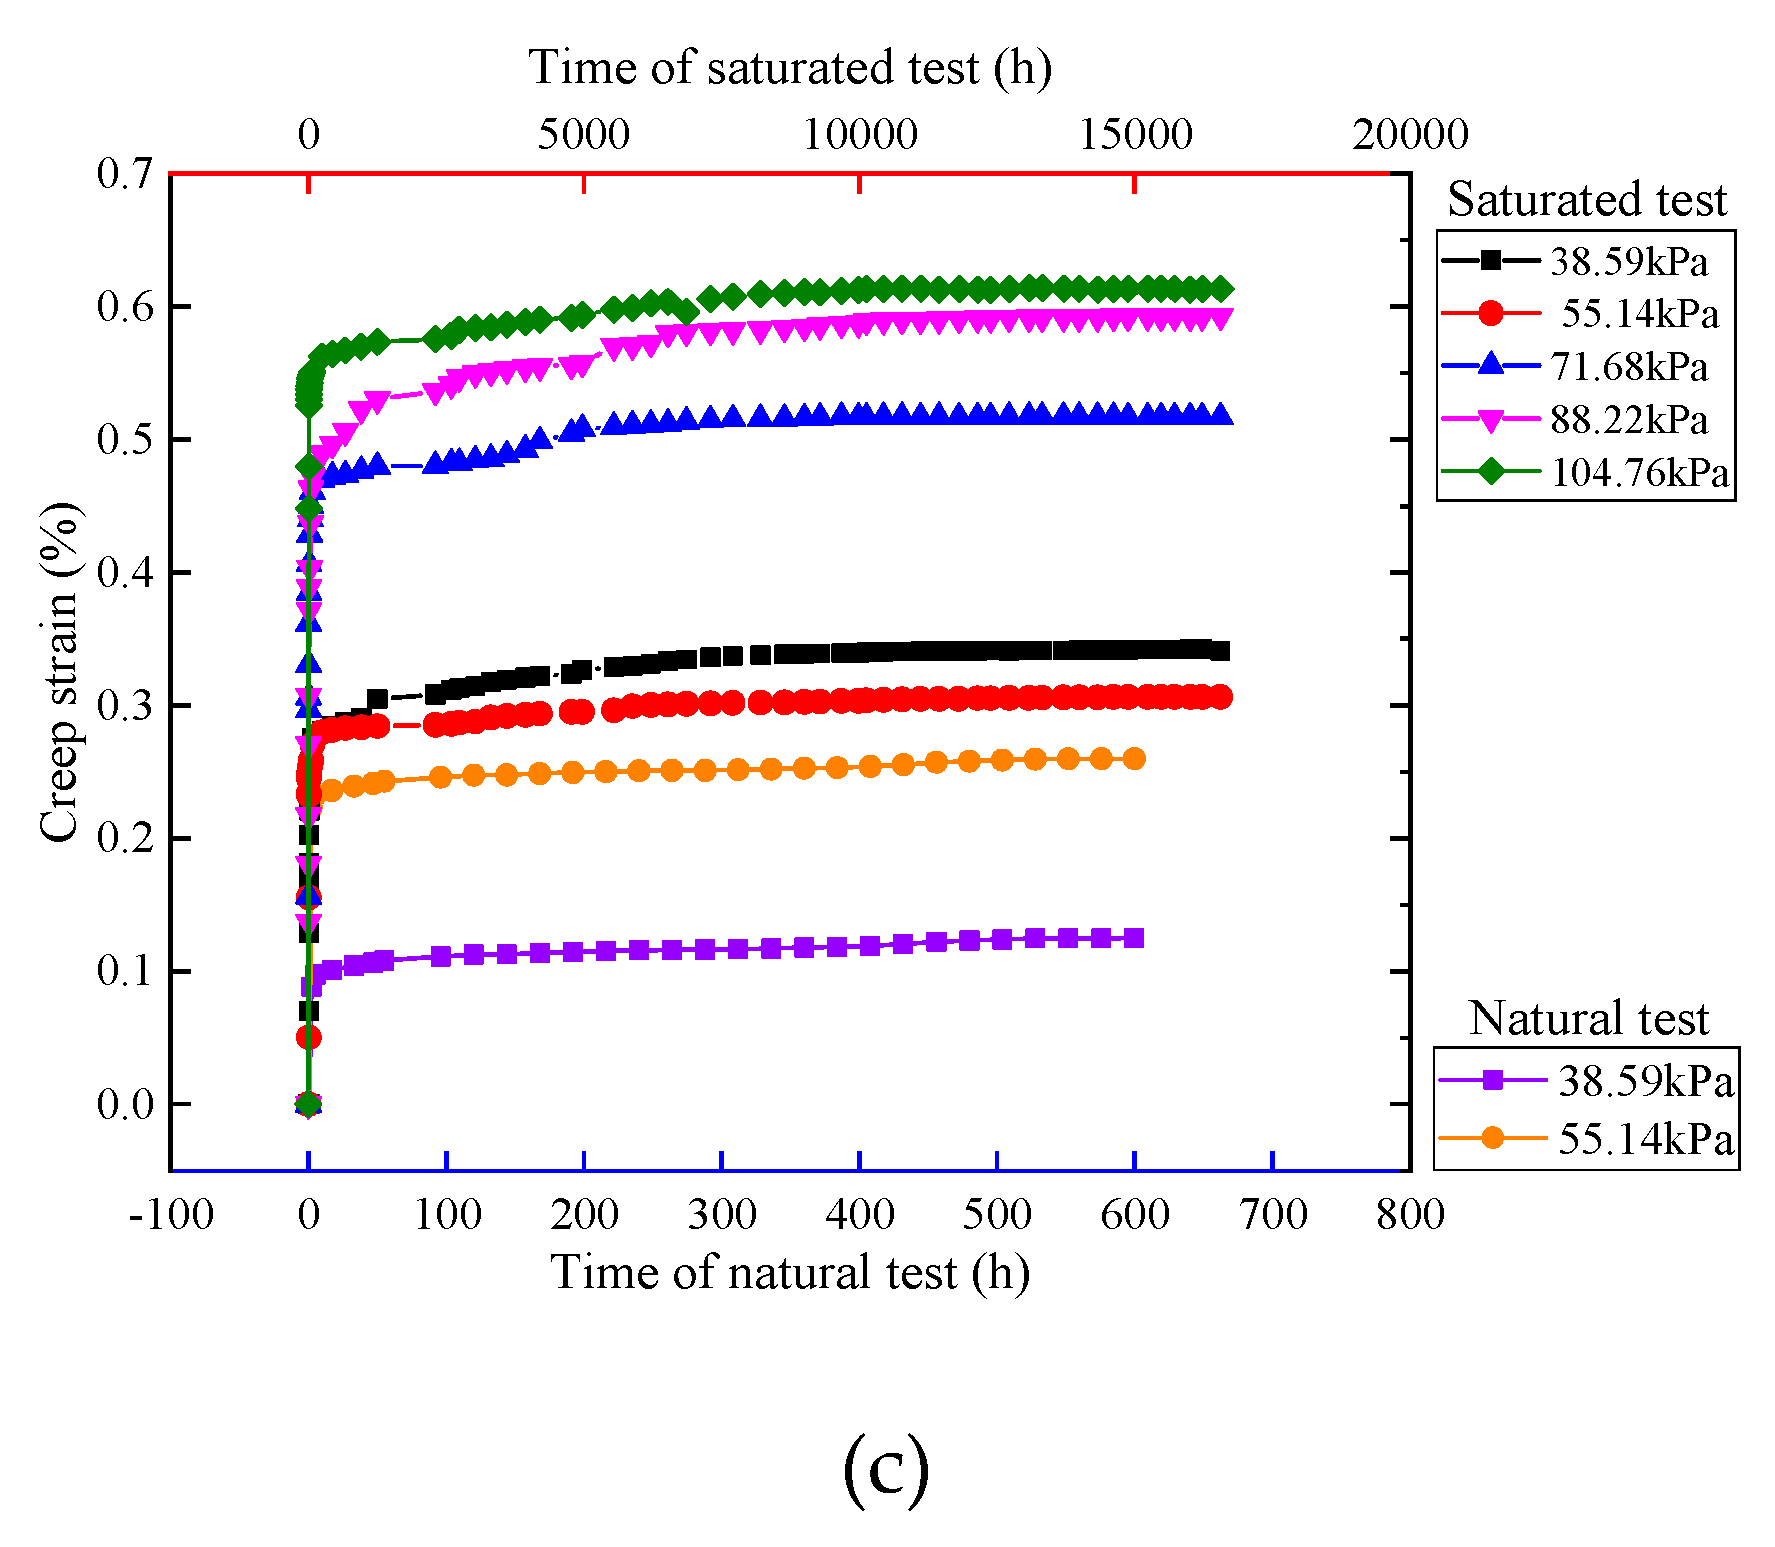
After the instantaneous strain, the sample enters the stage of creep deformation, which takes a long time. Referring to the creep stability criterion of other coarse-grained materials [29,30,31], it is considered that the creep deformation is stable when the axial strain is not more than 5×10⁻⁴ mm for one hour. After the creep deformation of recycled CDW filler reaches the stable standard, continuous observation is carried out, and the observation of saturated samples lasted about 700 days.
Through the processing of the data, the relationship between creep strain and time can be obtained, as shown in Figure 11. It can be seen that the creep strain has a decelerating creep stage and a stable creep stage. At the beginning, creep develops rapidly, controlled by the slippage rate of particles, the filling and rearrangement rate of particles gradually slows down, and the deformation rate also slows down. The creep properties of recycled CDW filler are related to density, material ratio, particle shape, gradation, load and external environment.
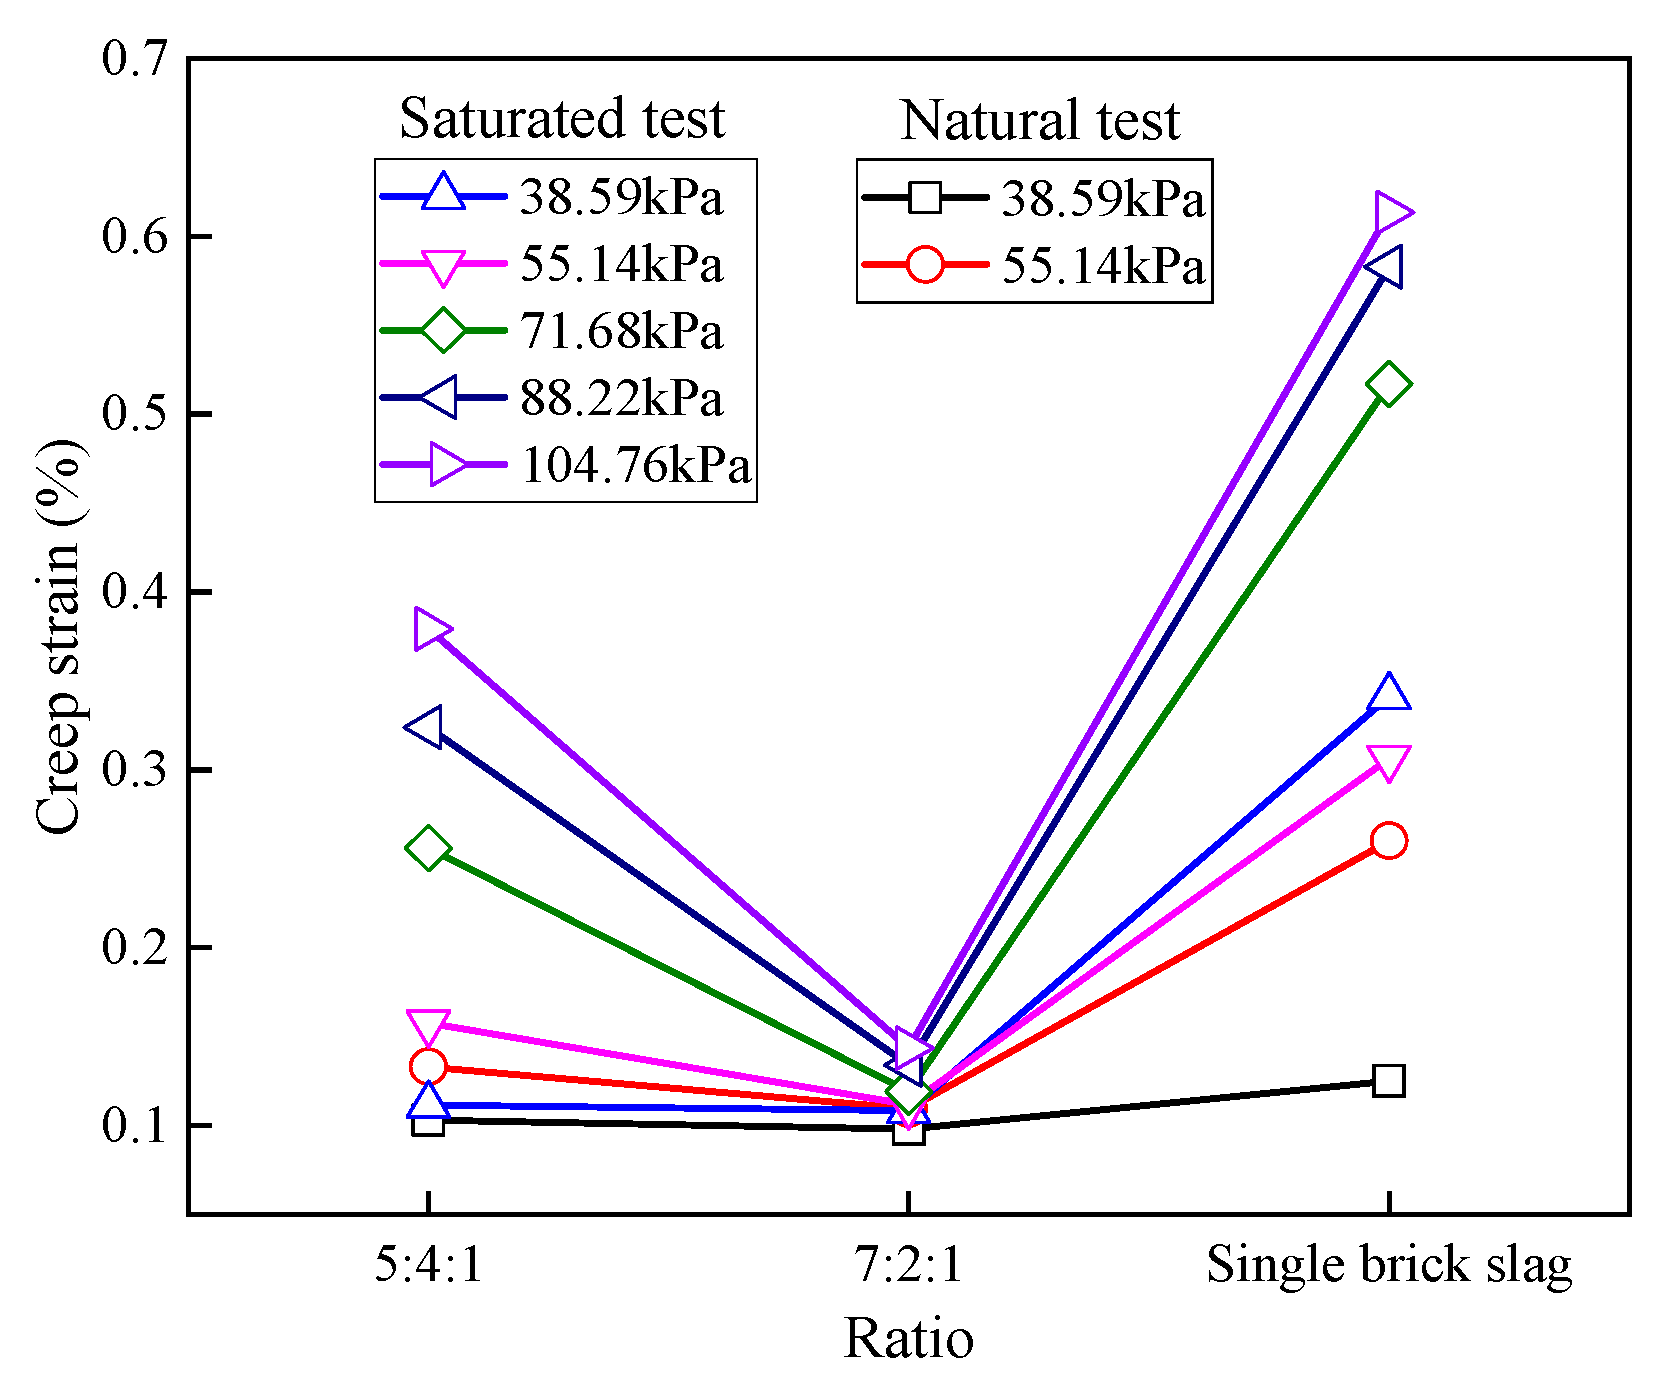
Figure 12 shows the relationship between creep strain and ratio. Under the same load, the creep strain of the samples with a 7:2:1 ratio is the smallest and the single brick slag is the largest. In the instantaneous deformation stage, most of the deformation has occurred, and the samples are in a relatively balanced state; the creep deformation is mainly in the small range of slippage and dislocation of particles. Based on the original balance, the particles are slightly adjusted. The relative position of the particles in the sample with a 7:2:1 ratio is stable, the scope of further adjustment is small, and the creep strain is also the smallest. The strength of brick slag is low, the sample with a 5:4:1 ratio has more pores. Overall, the creep strain of the recycled CDW sample accounts for about 5%–35% of the total strain, which varies according to the ratio, load and water environment. For the embankment filled with recycled CDW filler, the post-construction settlement cannot be ignored.
3.5. Analysis of Unloading Stain
The creep type of CDW filler under atest load belongs to stable creep. The total strain includes instantaneous strain and creep strain, and instantaneous strain includes instantaneous elastic strain and instantaneous plastic strain , creep strain is composed of viscoelastic strain and viscoplastic strain .
Through the unloading test, the instantaneous elastic strain, viscoelastic strain, and plastic strain of the sample can be clearly recorded, and then the instantaneous plastic strain and viscoplastic strain of the sample can be obtained, as shown in Table 8. It can be found that, under saturation and natural tests, the instantaneous elastic strain, the instantaneous plastic strain and viscoplastic strain of the same ratio basically increase with the stress, while viscoelastic strain decreases. Under the load, the fracture and filling of the particles make the filler form an embedded framework; the deformation is mainly plastic (irreversible) deformation.
3.6. Creep Model and Parameters
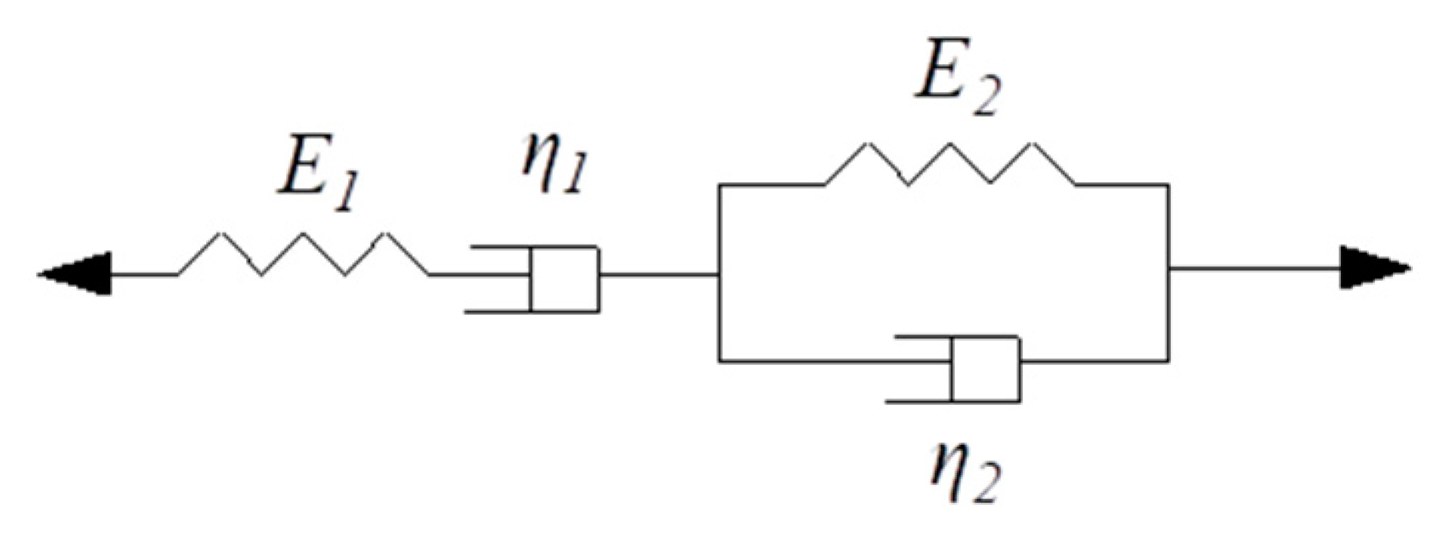
The physical meaning of the component model is relatively clear, the creep type of CDW samples with different ratios is stable creep, and the deformation caused by the fragmentation, slippage or rearrangement of the recycled particles is mainly irreversible. The Burgers model produces instantaneous elastic recovery and viscoelastic recovery after unloading and retains permanent residual strain. According to Sun’s suggestion, the Burgers model is used to calculate the creep deformation of the CDW embankment filler [43].
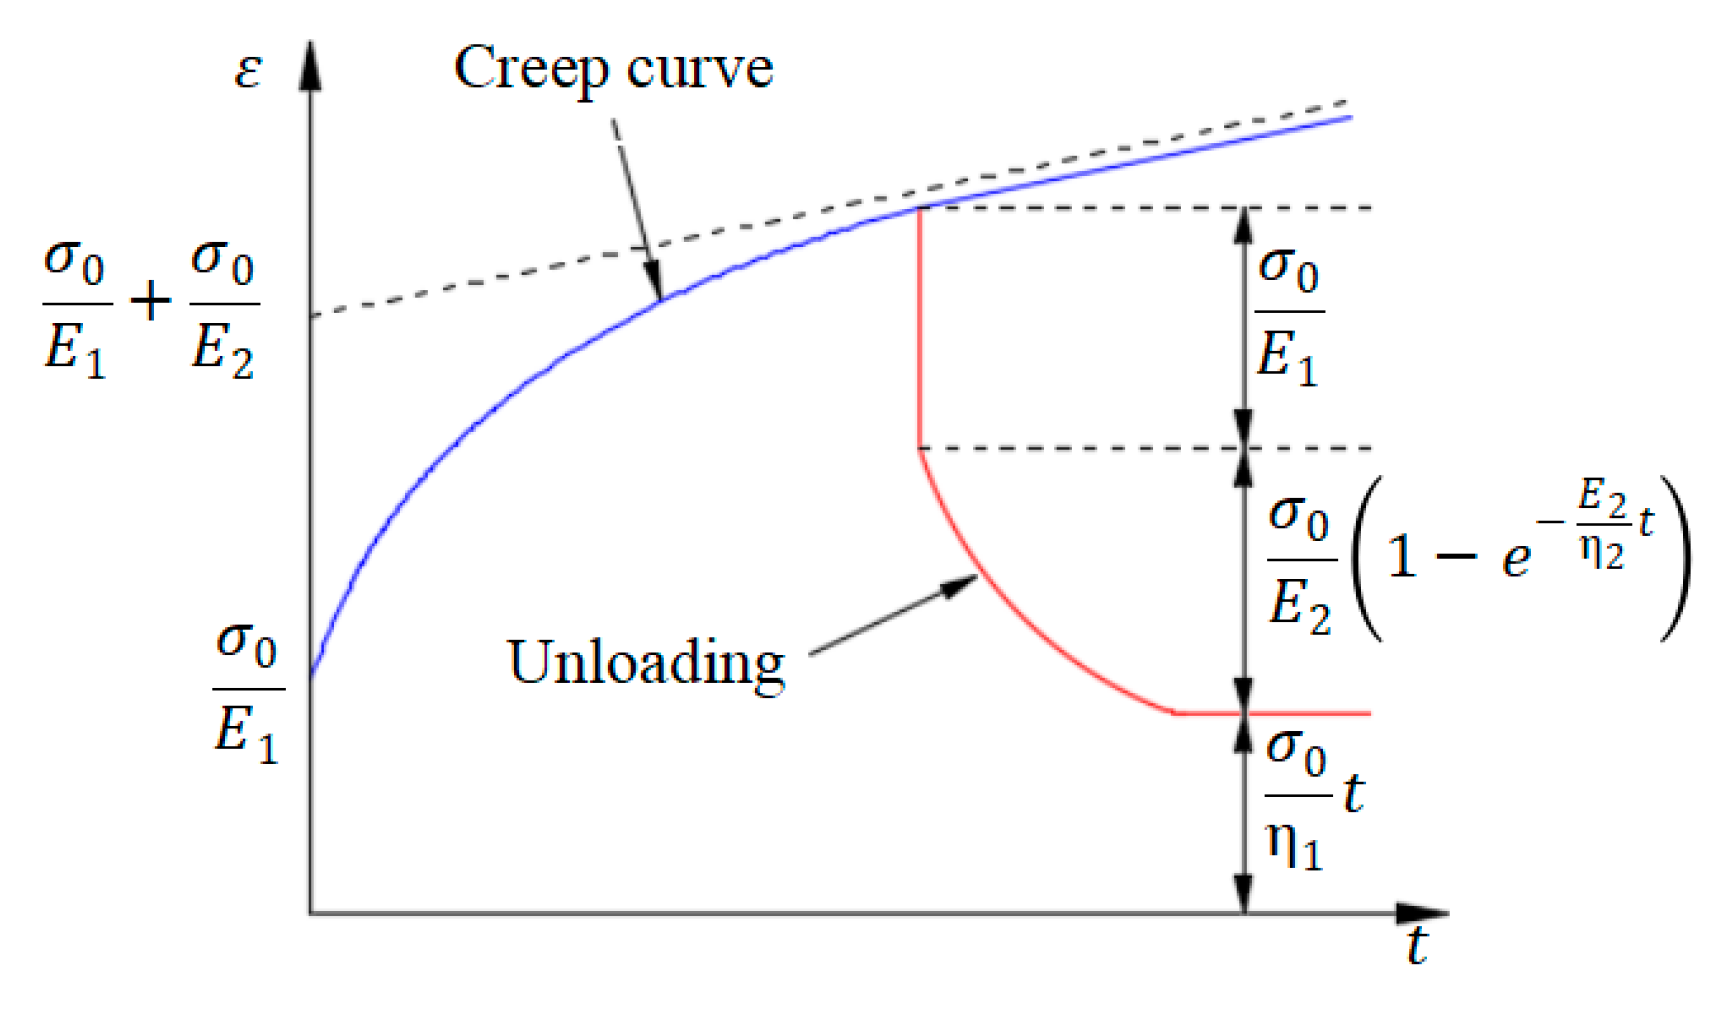
The Burgers model connects Kelvin model and a Maxwell models in a series (i.e., Burgers=(H-N) ||(H||N), where H is the Hook spring and N is the Newton dashpot). Its mechanical model is shown in Figure 13, the creep and unloading curves are shown in Figure 14 and the creep constitutive equation is shown in Equation (7):
where is stress, is strain, is time, , , and are model parameters.
Solve the differential equation, the Equation (8) is obtained at the :
where is a certain stress.
Creep compliance is shown in Equation (9):
The loading deformation of CDW filler includes four parts: instantaneous elasticity, instantaneous plasticity, viscoelasticity, and viscoplasticity. In the Burgers model, represents the instantaneous elastic strain after loading and unloading, which can be used to simulate the instantaneous elastic strain of the filler. The viscoelastic strain can be completely recovered with time, so the viscoelastic strain curve and the unloaded elastic recovery curve take the same path, and the viscoelastic strain can be obtained by sorting the elastic recovery curve during unloading, which can be simulated by the Kelvin body in the Burgers model.
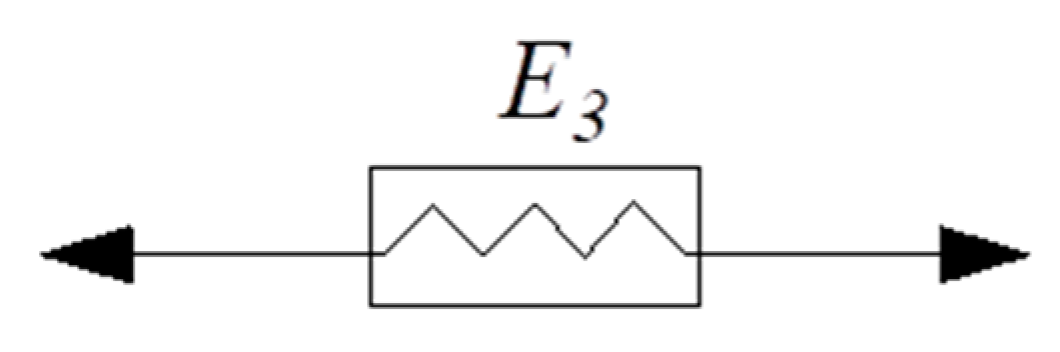
There are a lot of pores in the CDW sample and, at the moment of load application, the sample becomes compacted with the crushing of the aggregates; this phenomenon appears as the instantaneous plastic deformation on a macro scale. The research shows that the instantaneous plastic deformation is a linear function of the stress level, and it can also be found from Table 7 that the instantaneous plastic strain increases with the stress. Therefore, an improved Hook model (see Figure 15) that reflects instantaneous plastic deformation is used, and its creep equation is shown in Equation (10):
For Equation (8), when , Equation (11) can be obtained:
The increases linearly with time, and it represents plastic deformation in the Burgers model, which is caused by the fragmentation, slippage and rearrangement of recycled CDW particles. From the experimental analysis, it can be known that the rate of fragmentation and slippage of CDW particles changes with the load and the deformation gradually stabilizes with time, which is inconsistent with the trend of . In order to characterize the viscoplastic strain , can be considered to be a nonlinear viscous body related to stress and time (see Equation (12)):
where is the initial viscosity coefficient; a and b are indices of stress and time, respectively.
Take Equation (12) into Equations (7) and (8), then add Equation (10) (i.e., ), the creep equation of the improved Burgers model can be obtained, and its model is shown in Equation (13) and Figure 16.
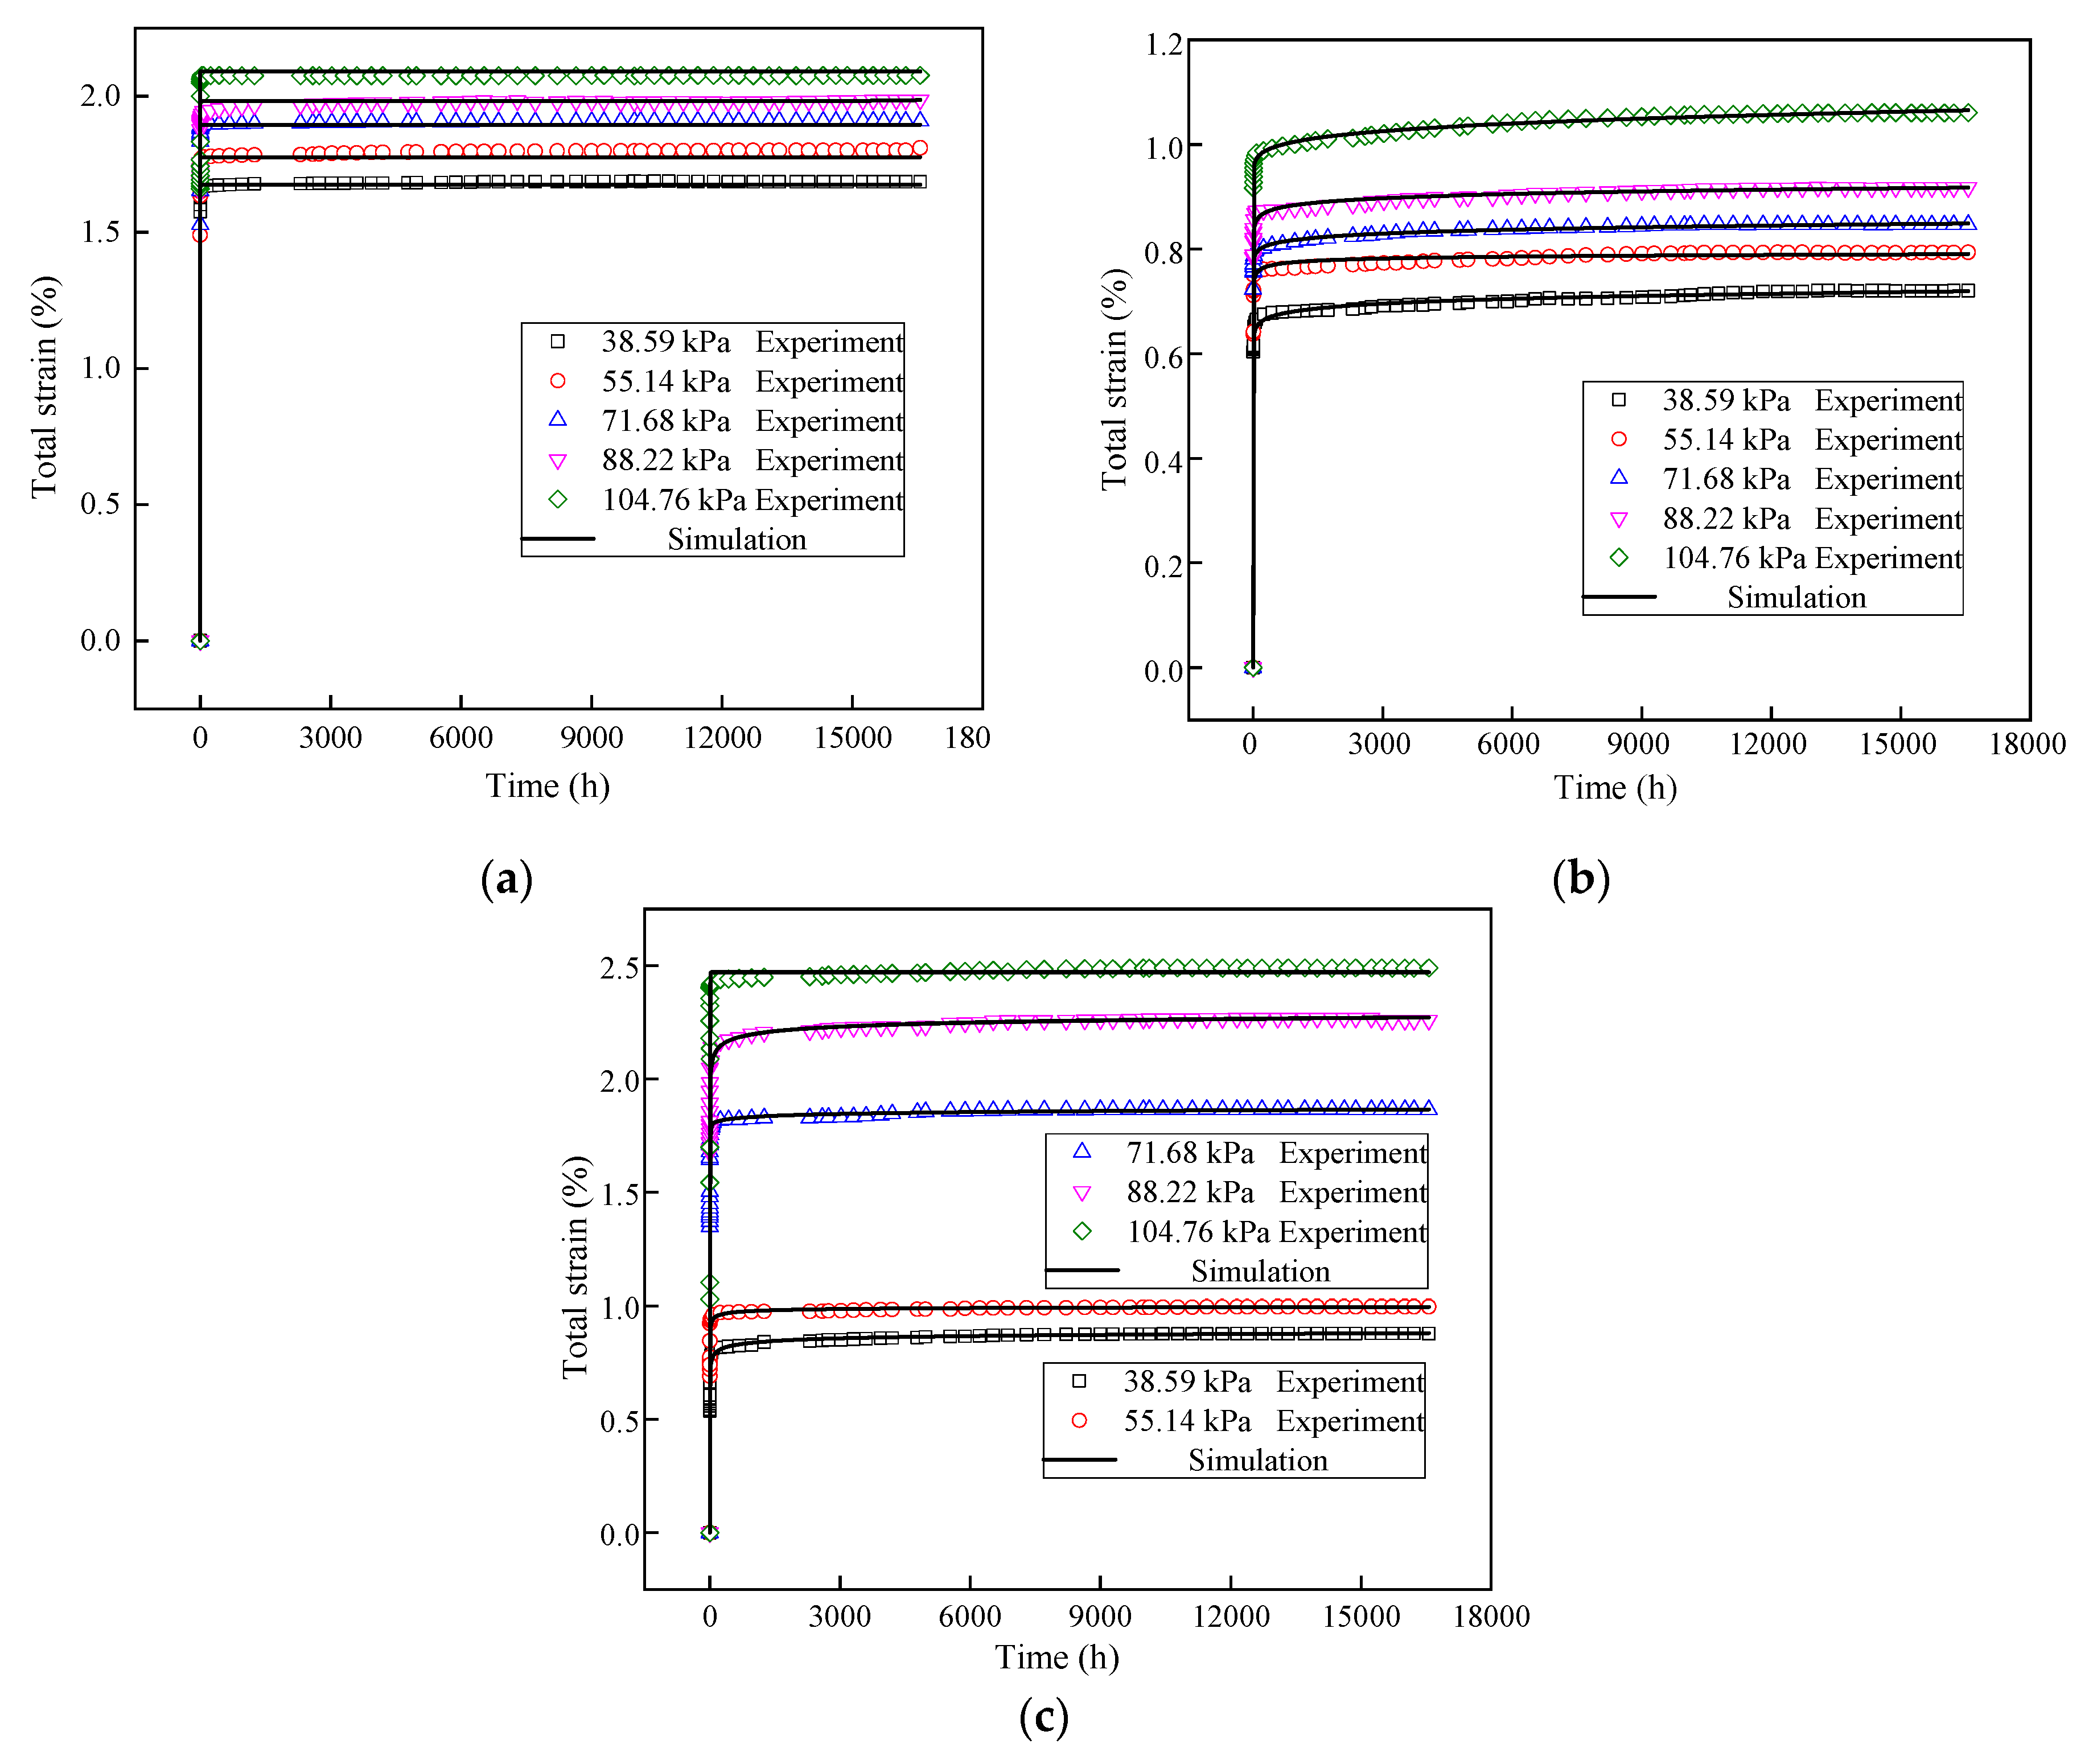
The creep deformation under saturated conditions is fitted, and the Levenberg- Marquardtleast square method is used. The fitting results of the improved Burgers model are shown in Figure 17, the fitting parameters are shown in Table 9. The fitted correlation coefficients (R2) are all greater than 0.9, the fitting curves are closer to the measured curves in shape and quantity than the Burgers model, and the correlation coefficient of the modified Burgers model is obviously improved, which shows that the Burgers model with the non-linear viscous body is most suitable for describing the creep characteristics of the recycled CDW embankment filler.
3.7. Influencing Factors of Creep Parameters
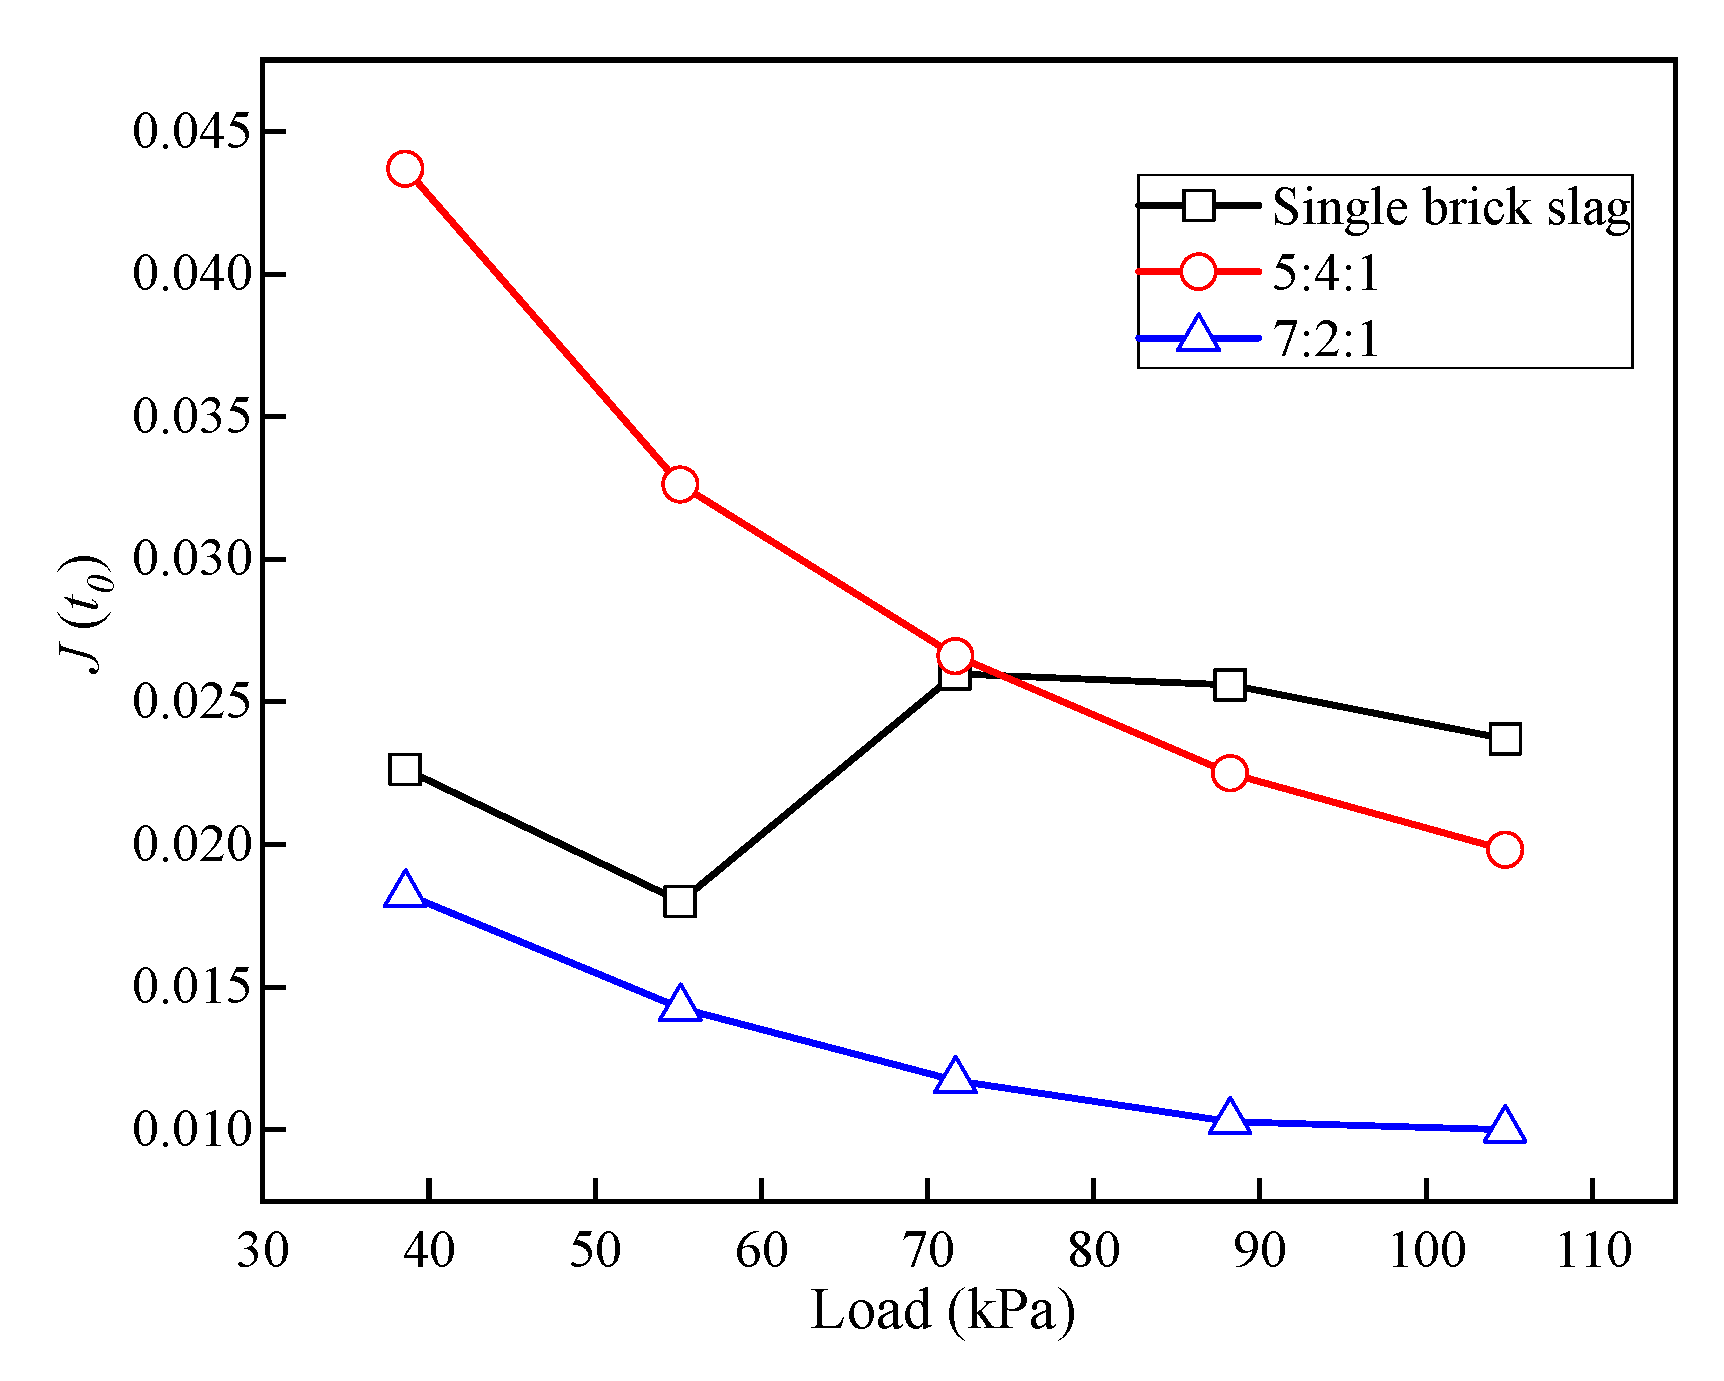
In order to macroscopically analyze the creep characteristics of the recycled CDW embankment filler, the creep compliance of the improved Burgers model is used, as shown in the following Equation (14). The creep deformation of CDW fillers in saturated state has already reached the stable standard at 7200 h, selecting t0 as 7200 h and substituting the fitting creep parameters into Equation (14), the value of equivalent creep compliance is obtained, which is a comprehensive indicator of the creep parameters under different ratios and loads. It can also be known that the larger the , the stronger the creep effects of CDW embankment filler under the initial conditions, and the larger the deformation. The smaller the , the weaker the creep effects, and the smaller the deformation.
The load applied in this paper simulates the axial load at the different depths of the embankment. Figure 18 shows the relationship between the equivalent creep compliance and the load. The of the samples with 5:4:1 and 7:2:1 ratios decreases with the load. When the load is large, the rate of slippage, rotation and fragmentation of the particles increases and the time of the deformation stabilization decreases. As a result, the creep effects weaken as the load increases, that is, the deeper the filler is buried, the weaker the creep effects are. Under the same load increment, the value of the sample with a 5:4:1 ratio decreases at nearly the same rate, while that of the sample with a 7:2:1 ratio changes greatly. The content of brick slag in the 7:2:1 ratio sample is higher, and the brick slag is easily broken when the load is large. Although the deformation of the 7:2:1 ratio sample is small, the creep effect is greatly affected by the load. The value of single brick slag decreases with the load at the first, but a sudden change occurs when the load is 55 kPa. There is no concrete slag acting as skeleton, the structure of single brick slag is gradually destroyed with the increase in load, that is, if the filler is single brick slag, the fillers below the middle of the embankment are destroyed.
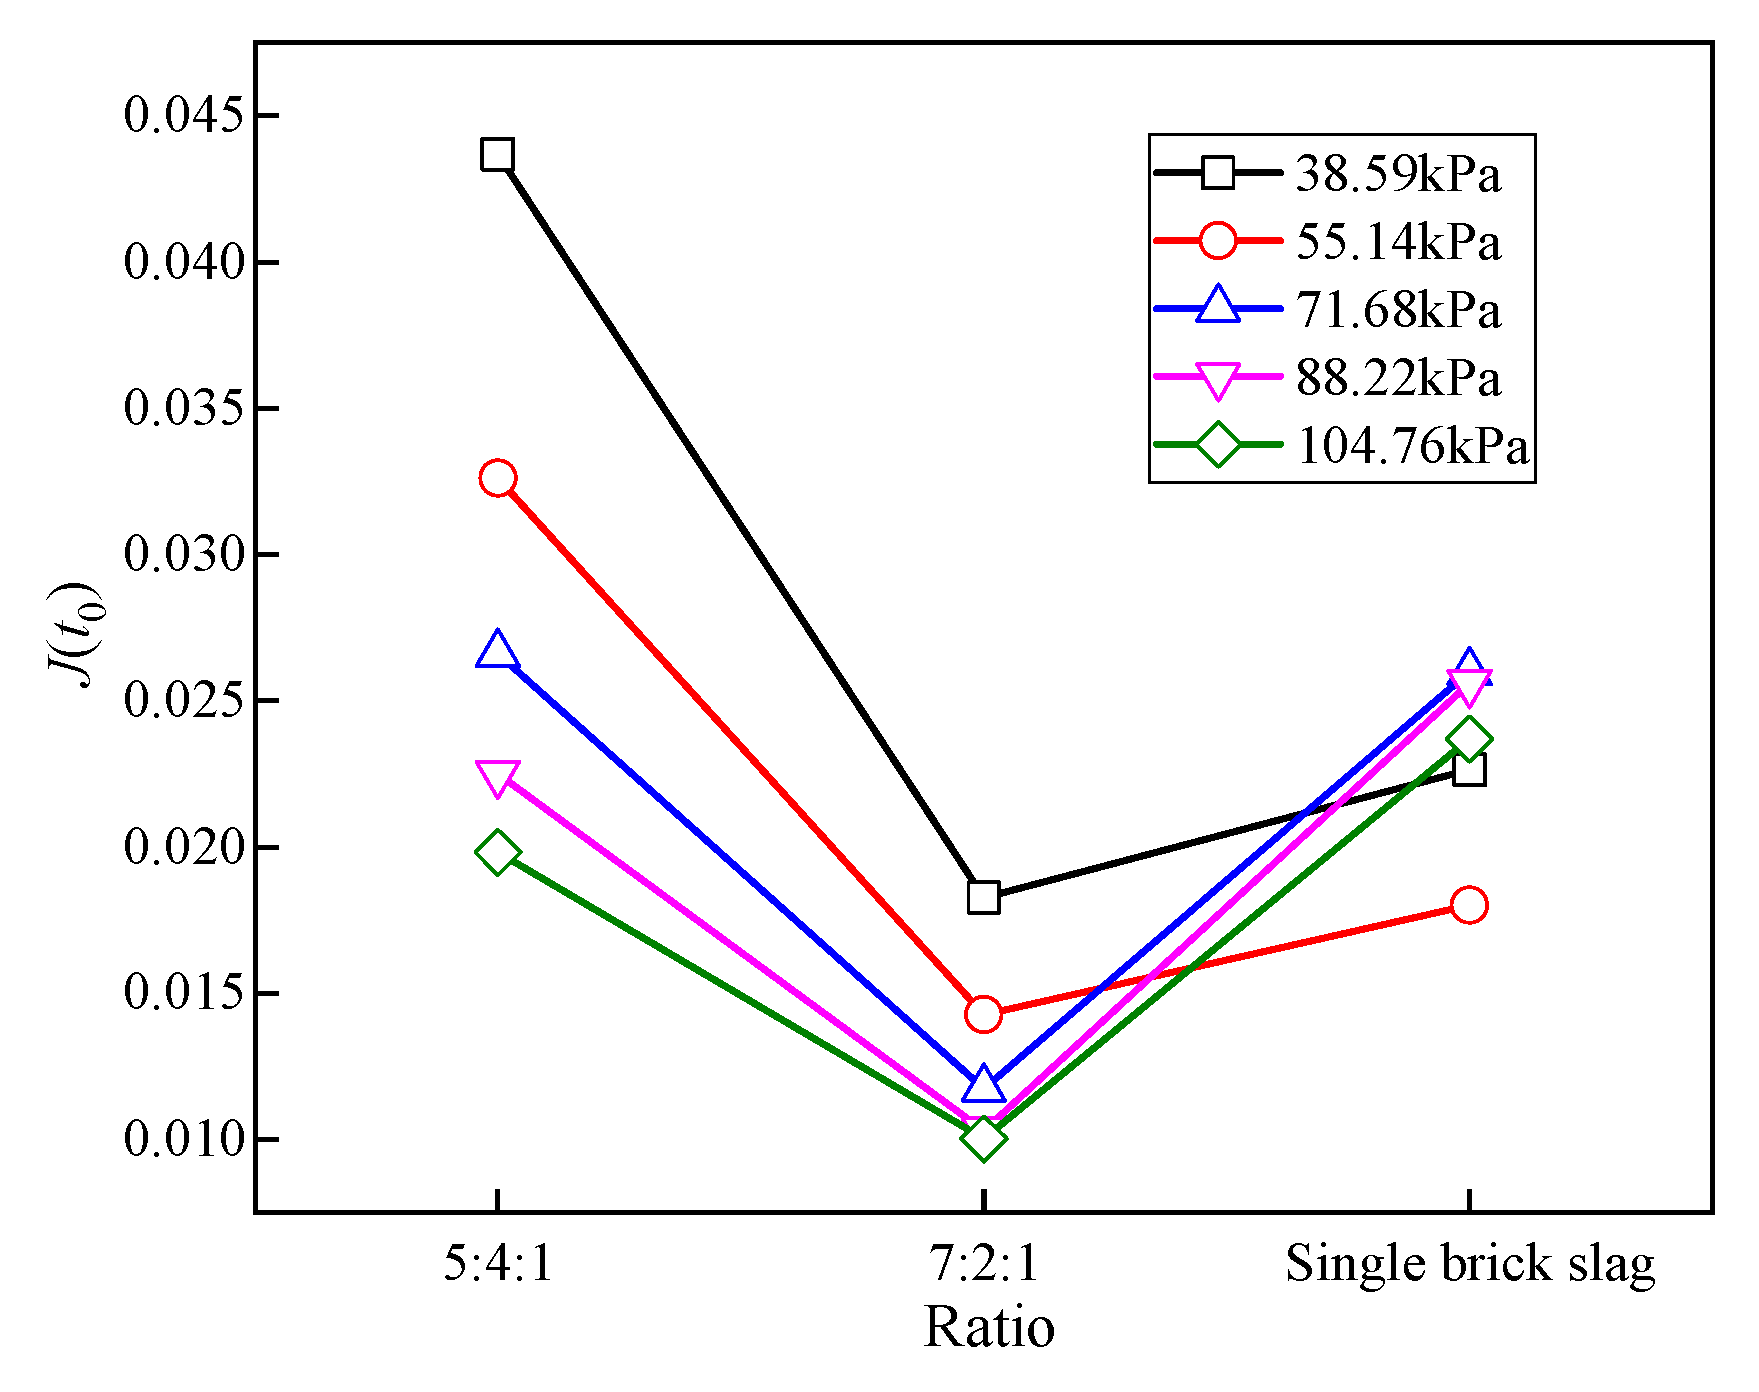
Recycled CDW filler is mainly composed of concrete slag, brick slag and mortar slag, and its ratio is the main factor affecting creep characteristics. It can be seen, from Figure 19, with the increase in brick slag content, the value firstly decreases and then increases. Concrete slag has a high strength and acts as the skeleton, but when broken brick slag is used to fill in the concrete skeleton, a porous structure is formed by the large proportion of concrete slag in the 5:4:1 ratio sample and there are more pores, so the creep effects are strong. As for the 7:2:1 ratio sample, the broken brick slag is better filled in the pores to form a dense structure, which results in relatively weak creep effects. Therefore, a reasonable increase in brick slag content can reduce the creep effects of recycled CDW embankment filler and reduce the post-construction settlement of the embankment.
4. Discussion
In this study, the application of CDW filler in an embankment was systematically tested and analyzed; at present, there is still little research on the relationship between the ratio of brick slag, concrete slag and mortar slag and the engineering performance of the filler, so it is necessary to consider a reasonable sample design and test content to ensure the adequacy of research results. Due to the fact that brick slag accounts for a large proportion of CDW and has the characteristics of low density, low strength and high water absorption, we have set the brick slag content of the test samples to 40%, 50%, 60%, 70% and 100%. Firstly, basic tests for compaction, screening and CBR are carried out. Although the maximum dry density decreases with the brick slag content and the optimum moisture content increases, the gradation performance (based on Cc and Cu) increases first and then decreases with the brick slag content, and the CBR value is similar. Including more concrete slag is not necessarily better; instead, properly increasing the content of brick slag can improve the gradation and strength of the mixture. The experimental results are in line with the results of our research on the microscopic aspect [41,42]. Based on the CT scan, we found that when the content of concrete slag is high, the interior of the filler is porous, and as the content of brick slag increases, the porosity decreases, that is, the mixture changes from a porous structure to a dense structure.
Furthermore, the long-term deformation test was performed for about 700 days to observe the compression deformation, and mainly focused on the most unfavorable state of saturation. The deformation of the recycled CDW filler in the saturated state under a low load is about five to seven times the deformation in the natural state. Vegas et al., Liu et al., and Brantut et al. indicated that the compression deformation is mainly due to the fragmentation, slippage or rearrangement of the recycled particles [23,24,25]. Water has a significant impact on the deformation of recycled CDW filler, especially when the brick slag content is large. On the one hand, the increase in moisture leads to softening and a strength reduction in the recycled particles, and the particles are more easily broken; on the other hand, the friction coefficient between particles decreases, and the particles are more likely to slip and rearrange at the same stress level. Eventually, these factors lead to increased deformation [26,27]. Thus, special attention must be paid to the waterproof and drainage design of the embankment when increasing the brick slag content.
From the perspective of the ratios, the samples with a 7:2:1 ratio had the smallest total strain, followed by the samples with a 5:4:1 ratio. Due to the high proportion of concrete slag in the 5:4:1 samples, broken brick slag cannot fill in the skeleton formed by concrete slag well, as there are many pores, the mixture has a porous structure and, when an upper load is applied, the pores are easily compressed and can cause deformation. In the samples with a 7:2:1 ratio, the broken brick slag slipped and filled in the skeleton formed by the concrete slag, meaning that the material is dense and has a dense structure, and that the strain is the smallest. Therefore, the reasonable control of the ratio is an effective means to reduce the embankment deformation. The total deformation, instantaneous deformation and creep deformation of the 7:2:1 samples are small and stable, and this ratio has good resistance. The void ratio of the 5:4:1 samples is large, and the instantaneous deformation is large after the load is applied, therefore, it accounts for a large proportion of the total deformation. The deformation of the single brick slag is sensitive to the change in the load, and the instantaneous deformation is small under the first two load levels; as the load increases further, the instantaneous deformation increases sharply. Without the support of the concrete skeleton, single brick slag samples are not sufficient to resist high loads.
For CDW filler, deformation due to the breakage and movement of particles is mainly irreversible. Through the unloading test, the instantaneous elastic deformation, instantaneous plastic deformation, viscoelastic deformation, and viscoplastic deformation of the sample can be clearly obtained. To predict the long-term deformation of CDW filler, based on the Burgers model and the unloading test data, the deformation amount is calculated from four aspects. Instantaneous elastic deformation, instantaneous plastic deformation and viscoelastic deformation can be simulated by a Hooke model, a modified Hooke model, and a Kelvin body. As for viscoplastic deformation, we used a viscosity coefficient related to time and stress—this method builds a nonlinear creep model by converting the viscosity coefficient or elastic modulus into a function related to the stress level or time [44,45], and the improved model can greatly describe the long-term deformation of the CDW mixture. Finally, the effects of stress and ratio on creep parameters are analyzed based on creep compliance.
Inevitably, the study has some limitations. For example, brick slag, concrete slag and mortar slag are all obtained from the engineering material field. Secondly, the ratios lead to a sharp increase in the test workload; considering the difference in the properties of brick slag and concrete slag, the ratios of the samples used in the compaction test, sieving test and CBR test were set as 4:5:1, 5:4:1, 6:3:1, 7:2:1 and pure brick slag, and the ratios of the creep test were set as 5:4:1, 7:2:1 and pure brick slag. Moreover, in order to simulate the load at the different embankment depths of the project, the load of the creep test is designed in five levels, according to the self-weight of the pavement structure layer. However, the study shows that properly increasing the content of brick slag can improve the gradation, strength and creep deformation of the mixture, and it can provide design references for recycled CDW filler that can be used in embankments. There are some suggestions proposed to provide a reference for CDW embankments. The strength of concrete is high and the strength of brick slag is low, so, from the point of view of bearing capacity, the sample with a 5:4:1 ratio is the best. The brick slag is easily broken, and broken particles play an important role in filling the pores, so it can be known from the creep test that the deformation of the 7:2:1 ratio is the smallest and that a reasonable increase in brick slag content can reduce the deformation. For heavy traffic embankments, it is recommended to choose the filler with a 5:4:1 ratio, however, the compaction of the embankment should be strictly controlled to reduce post-construction settlements. For embankments with a small traffic volume, the brick slag content can be appropriately increased.
5. Conclusions
The application of CDW is a challenge in construction and understanding the creep behavior of CDW filler is of great importance, as this helps to control and predict the settlement of the CDW embankment. In this paper, a series of laboratory tests and systematic analyses were conducted to study the recycled CDW embankment filler. The main conclusions were as follows:
As the content of brick slag increases, the optimum moisture content of recycled CDW embankment filler increases and the maximum dry density decreases. The CBR value of recycled CDW filler is between 40.24% and 98.85%; among them, the 5:4:1 ratio has the highest CBR value. The creep type of CDW samples under a simulated load is stable creep. The instantaneous deformation accounts for 65%–95% of total deformation and the creep deformation accounts for about 5%–35%, which varies according to the ratio and load.
The deformation of recycled CDW embankment filler is mainly due to the fragmentation, slippage and rearrangement of recycled particles—water greatly accelerates the rate of slippage and the filling of the particles. Concrete slag has a high strength and acts as the skeleton. The sample with a 7:2:1 ratio has the densest structure and the strain is the smallest. The sample with a 5:4:1 ratio has a porous structure, which is easily compressed, and single brick slag has the largest strain. The reasonable control of the filler ratio is an effective means to reduce the deformation of the embankment.
The Burgers model is improved in terms of instantaneous plastic deformation and viscoplastic deformation, which can better describe the creep characteristics of recycled CDW embankment filler. The effects of load and ratio on the creep parameters are analyzed using the equivalent creep compliance . As the load increases, the creep effects gradually decrease; during the process of increasing the brick slag content from 50% to 100%, the creep effects are, at first, weakened and are then enhanced.
Author Contributions
Conceptualization, Z.L., S.Y., L.L. and J.Y.; methodology, Z.L. and S.Y.; validation, Z.L. and L.L.; formal analysis, J.Y.; investigation, J.Y.; resources, Z.L.; data curation, L.L.; writing—original draft preparation, S.Y.; writing—review and editing, J.Y.; visualization, Z.L.; supervision, Z.L.; project administration, Z.L.; funding acquisition, Z.L. All authors have read and agreed to the published version of the manuscript.
Funding
This research was funded by the Project of Construction of Ministry of Transportation (2013318J-16490).
Conflicts of Interest
The authors declare that they have no conflicts of interest.
References
- Huang, B.; Wang, X.; Kua, H.; Geng, Y.; Bleischwitz, R.; Ren, J. Construction and demolition waste management in China through the 3R principle. Resour. Conserv. Recycl. 2018, 129, 36–44. [Google Scholar] [CrossRef]
- Barbudo, A.; Agrela, F.; Ayuso, J.; Jiménez, J.R.; Poon, C.S. Statistical analysis of recycled aggregates derived from different sources for sub-base applications. Constr. Build. Mater. 2012, 28, 129–138. [Google Scholar] [CrossRef]
- Cardoso, R.; Silva, R.V.; de Brito, J.; Dhir, R. Use of recycled aggregates from construction and demolition waste in geotechnical applications: A literature review. Waste Manage. 2016, 49, 131–145. [Google Scholar] [CrossRef] [PubMed]
- da Conceição Leite, F.; dos Santos Motta, R.; Vasconcelos, K.L.; Bernucci, L. Laboratory evaluation of recycled construction and demolition waste for pavements. Constr. Build. Mater. 2011, 25, 2972–2979. [Google Scholar] [CrossRef]
- Liu, L.; Cai, G.; Liu, S. Compression properties and micro-mechanisms of rubber-sand particle mixtures considering grain breakage. Constr. Build. Mater. 2018, 187, 1061–1072. [Google Scholar] [CrossRef]
- Soleimanbeigi, A.; Edil, T.B. Compressibility of recycled materials for use as highway embankment fill. J. Geotech. Geoenviron. Eng. 2015, 141. [Google Scholar] [CrossRef]
- Park, T. Application of construction and building debris as base and subbase materials in rigid pavement. J. Transp. Eng. 2003, 129, 558–563. [Google Scholar] [CrossRef]
- Poon, C.S.; Chan, D. Feasible use of recycled concrete aggregates and crushed clay brick as unbound road sub-base. Constr. Build. Mater. 2006, 20, 578–585. [Google Scholar] [CrossRef]
- Liu, X.; Cai, G.; Liu, L.; Liu, S.; Puppala, A.J. Thermo-hydro-mechanical properties of bentonite-sand-graphite-polypropylene fiber mixtures as buffer materials for a high-level radioactive waste repository. Int. J. Heat Mass Transf. 2019, 141, 981–994. [Google Scholar] [CrossRef]
- Kim, W.; Labuz, J.F.; Dai, S. Resilient modulus of base course containing recycled asphalt pavement. Transp. Res. Record. 2007, 2005, 27–35. [Google Scholar] [CrossRef]
- Melbouci, B. Compaction and shearing behaviour study of recycled aggregates. Constr. Build. Mater. 2009, 23, 2723–2730. [Google Scholar] [CrossRef]
- Poon, C.S.; Qiao, X.C.; Chan, D. The cause and influence of self-cementing properties of fine recycled concrete aggregates on the properties of unbound sub-base. Waste Manage. 2006, 26, 1166–1172. [Google Scholar] [CrossRef]
- Wang, R.; Yu, N.; Li, Y. Methods for improving the microstructure of recycled concrete aggregate: A review. Constr. Build. Mater. 2020, 242, 118164. [Google Scholar] [CrossRef]
- Guo, Z.; Jiang, T.; Zhang, J.; Kong, X.; Chen, C.; Lehman, D.E. Mechanical and durability properties of sustainable self-compacting concrete with recycled concrete aggregate and fly ash, slag and silica fume. Constr. Build. Mater. 2020, 231, 117115. [Google Scholar] [CrossRef]
- Subhy, A.; Pires, G.M.; del Barco Carrión, A.J.; Lo Presti, D.; Airey, G. Binder and mixture fatigue performance of plant-produced road surface course asphalt mixtures with high contents of reclaimed asphalt. Sustainability 2019, 11, 3752. [Google Scholar] [CrossRef] [Green Version]
- Pires, G.M.; Lo Presti, D.; Airey, G.D. A practical approach to estimate the degree of binder activity of reclaimed asphalt materials. Road Mater. Pavement Des. 2019, 1–24. [Google Scholar] [CrossRef]
- Tavira, J.; Jiménez, J.R.; Ledesma, E.F.; López-Uceda, A.; Ayuso, J. Real-scale study of a heavy traffic road built with in situ recycled demolition waste. J. Clean Prod. 2020, 248. [Google Scholar] [CrossRef]
- Vegas, I.; Ibañez, J.A.; Lisbona, A.; de Cortazar, A.S.; Frías, M. Pre-normative research on the use of mixed recycled aggregates in unbound road sections. Constr. Build. Mater. 2011, 25, 2674–2682. [Google Scholar] [CrossRef]
- Yin, J.; Soleimanbeigi, A.; Likos, W.J.; Edil, T.B. Creep response of compacted waste foundry sands for use as roadway embankment fill. J. Geotech. Geoenviron. Eng. 2019, 144, 04017115. [Google Scholar] [CrossRef]
- Brantut, N.; Heap, M.; Meredith, P.; Baud, P. Time-dependent cracking and brittle creep in crustal rocks: A review. J. Struct. Geol. 2013, 52, 17–43. [Google Scholar] [CrossRef]
- Ngwenya, B.T.; Main, I.G.; Elphick, S.C.; Crawford, B.R.; Smart, B.G. A constitutive law for low-temperature creep of water-saturated sandstones. J. Geophys. Res. Solid Earth 2001, 106, 21811–21826. [Google Scholar] [CrossRef]
- Zhang, B.; Chen, T.; Peng, C.; Qian, X.; Jie, Y. Experimental study on loading-creep coupling effect in rockfill material. Int. J. Geomech. 2017, 17. [Google Scholar] [CrossRef]
- Kong, Y.; Xu, M.; Song, E. An elastic-viscoplastic double-yield-surface model for coarse-grained soils considering particle breakage. Comput. Geotech. 2017, 85, 59–70. [Google Scholar] [CrossRef]
- Wu, Y.; Zhang, B.; Yu, Y.; Zhang, Z. Consolidation analysis of nuozhadu high earth-rockfill dam based on the coupling of seepage and stress-deformation physical state. Int. J. Geomech. 2016, 16. [Google Scholar] [CrossRef]
- Jiang, J.S.; Cheng, Z.-L.; Zuo, Y.; Ding, H. CT triaxial rheological test on coarse-grained soils. Rock Soil Mech. 2014, 35, 2507–2514. [Google Scholar]
- Ciantia, M.O.; Castellanza, R.; Di Prisco, C. Experimental study on the water-induced weakening of calcarenites. Rock Mech. Rock Eng. 2015, 48, 441–461. [Google Scholar] [CrossRef]
- Zhao, Z.; Song, E.-X. Particle mechanics modeling of creep behavior of rockfill materials under dry and wet conditions. Comput. Geotech. 2015, 68, 137–146. [Google Scholar] [CrossRef]
- Deng, H.F.; Zhou, M.L.; Li, J.L.; Sun, X.S.; Huang, Y.L. Creep degradation mechanism by water-rock interaction in the red-layer soft rock. Arab. J. Geosci. 2016, 9, 601. [Google Scholar] [CrossRef]
- Kuwano, R.; Jardine, R.J. On measuring creep behaviour in granular materials through triaxial testing. Can. Geotech. J. 2002, 39, 1061–1074. [Google Scholar] [CrossRef]
- Pramthawee, P.; Jongpradist, P.; Sukkarak, R. Integration of creep into a modified hardening soil model for time-dependent analysis of a high rockfill dam. Comput. Geotech. 2017, 91, 104–116. [Google Scholar] [CrossRef]
- Zhou, W.; Chang, X.; Zhou, C.; Liu, X. Creep analysis of high concrete-faced rockfill dam. Int. J. Numer. Meth. Biomed. 2010, 26, 1477–1492. [Google Scholar]
- Wang, G. A new constitutive creep-damage model for rock salt and its characteristics. Int. J. Rock Mech. Min. Sci. 2004, 41, 364. [Google Scholar] [CrossRef]
- Tang, S.; Greene, M.S.; Liu, W.K. Two-scale mechanism-based theory of nonlinear viscoelasticity. J. Mech. Phys. Solids 2012, 60, 199–226. [Google Scholar] [CrossRef]
- Justo, J.; Durand, P. Settlement-time behaviour of granular embankments. Int. J. Numer. Anal. Methods Geomech. 2000, 24, 281–303. [Google Scholar] [CrossRef]
- Li, W.; Li, X.; Han, B.; Shu, Y. Recognition of creep model of layer composite rock mass and its application. J. Cent. South Univ. 2007, 14, 329–331. [Google Scholar] [CrossRef]
- Oyen, M.L.; Cook, R.F. Load–displacement behavior during sharp indentation of viscous–elastic–plastic materials. J. Mater. Res. 2003, 18, 139–150. [Google Scholar] [CrossRef]
- Asadzadeh, M.; Soroush, A. Direct shear testing on a rockfill material. Arab. J. Sci. Eng. 2009, 34, 379. [Google Scholar]
- Cheng, Y.; Chang, P. Study of nonlinear rheology of improved expansive soil based on model theory and genetic creep theory. Rock Soil Mech. 2016, 37, 75–82. [Google Scholar]
- Profession Standard of the People’s Republic of China. Test Methods of Soils for Highway Engineering (JTG E40-2007); Ministry of Communications of the PRC: Beijing, China, 2007. Available online: http://www.gov.cn/fuwu/bmfw/zggjbzhglwyhgjbzxxcx/index.html (accessed on 1 March 2020).
- Profession Standard of the People’s Republic of China. Technical specification for construction of highway subgrades (JTG F10-2006); Ministry of Communications of the PRC: Beijing, China, 2006. Available online: http://www.gov.cn/fuwu/bmfw/zggjbzhglwyhgjbzxxcx/index.html (accessed on 1 March 2020).
- Li, Z.; Liu, L.; Yan, S.; Zhang, M.; Xie, Y. Properties of microscopic particle morphology and particle contact of renewable construction waste mixtures. Constr. Build. Mater. 2019, 207, 190–205. [Google Scholar] [CrossRef]
- Li, Z.; Liu, L.; Yan, S.; Zhang, M.; Xia, J.; Xie, Y. Effect of freeze-thaw cycles on mechanical and porosity properties of recycled construction waste mixtures. Constr. Build. Mater. 2019, 210, 347–363. [Google Scholar] [CrossRef]
- Sun, J. Rock rheological mechanics and its advance in engineering applications. Chin. J. Rock Mech. Eng. 2007, 26, 1081–1106. [Google Scholar]
- Zhao, Y.; Wang, Y.; Wang, W.; Wan, W.; Tang, J. Modeling of non-linear rheological behavior of hard rock using triaxial rheological experiment. Int. J. Rock Mech. Min. Sci. 2017, 93, 66–75. [Google Scholar] [CrossRef]
- Wu, F.; Chen, J.; Zou, Q. A nonlinear creep damage model for salt rock. Int. J. Damage Mech. 2019, 28, 758–771. [Google Scholar] [CrossRef]
Figure 1.
Brick slag, concrete slag, and mortar slag.

Figure 2.
Relationship between water content and dry density: (a) test of first group; (b) test of second group.
Figure 2.
Relationship between water content and dry density: (a) test of first group; (b) test of second group.

Figure 3.
Compression creep equipment.

Figure 4.
Process of test operation: (a) adding water; (b) applying load.

Figure 5.
The overall conceptual framework.

Figure 6.
Relationship of the total strain and time: (a) 5:4:1 ratio; (b) 7:2:1 ratio; (c) single brick slag.
Figure 6.
Relationship of the total strain and time: (a) 5:4:1 ratio; (b) 7:2:1 ratio; (c) single brick slag.


Figure 7.
Relationship of the total strain and ratio.

Figure 8.
Internal structure of CDW scanned by CT: (a) porous structure; (b) dense structure.

Figure 9.
Relationship between time and void ratio: (a) 5:4:1 ratio; (b) 7:2:1 ratio; (c) single brick slag.
Figure 9.
Relationship between time and void ratio: (a) 5:4:1 ratio; (b) 7:2:1 ratio; (c) single brick slag.

Figure 10.
Relationship between the instantaneous strain and ratio.

Figure 11.
Relationship between the creep strain and time: (a) 5:4:1 ratio; (b) 7:2:1 ratio; (c) single brick slag.
Figure 11.
Relationship between the creep strain and time: (a) 5:4:1 ratio; (b) 7:2:1 ratio; (c) single brick slag.


Figure 12.
Relationship between the creep strain and ratio.

Figure 13.
Burgers model.

Figure 14.
Creep and unloading Curves.

Figure 15.
An improved Hook model.

Figure 16.
Improved Burgers model.

Figure 17.
Fitting results of the improved Burgers model: (a) 5:4:1 ratio; (b) 7:2:1 ratio; (c) single brick slag.
Figure 17.
Fitting results of the improved Burgers model: (a) 5:4:1 ratio; (b) 7:2:1 ratio; (c) single brick slag.

Figure 18.
Relationship between the equivalent creep compliance and load.

Figure 19.
Relationship between the equivalent creep compliance and ratio.


Table 1.
Field mass ratio of recycled construction and demolition waste (CDW) filler.
| Sample | Brick Slag (%) | Concrete Slag (%) | Mortar Slag (%) | Others (%) |
|---|---|---|---|---|
| Sample 1 | 33 | 44 | 14 | 9 |
| Sample 2 | 35 | 45 | 13 | 7 |
| Sample 3 | 34 | 35 | 20 | 11 |
| Sample 4 | 36 | 34 | 20 | 10 |
Table 2.
Density and water absorption of the recycled aggregates.
| Recycled Aggregates | Concrete Slag | Mortar Slag | Brick Slag |
|---|---|---|---|
| Density (g/cm3) | 2.57 | 2.01 | 1.61 |
| Water absorption (%) | 2.4 | 11.1 | 21.5 |
Table 3.
Optimum moisture content and maximum dry density.
| Ratio | Optimum Moisture Content (%) | Maximum Dry Density (g/cm3) | ||||
|---|---|---|---|---|---|---|
| First Group | Second Group | Average | First Group | Second Group | Average | |
| 4:5:1 | 8.7 | 9.3 | 9.0 | 1.69 | 1.69 | 1.69 |
| 5:4:1 | 10.8 | 11.4 | 11.1 | 1.66 | 1.64 | 1.65 |
| 6:3:1 | 14.6 | 14.2 | 14.4 | 1.58 | 1.59 | 1.59 |
| 7:2:1 | 14.8 | 15.6 | 15.2 | 1.57 | 1.57 | 1.57 |
| Brick slag | 16.6 | 16.2 | 16.4 | 1.45 | 1.44 | 1.45 |
3 The ratio refers to brick slag: concrete slag: mortar slag.
Table 4.
Screening test results of different proportions after compaction.
| Ratio | Layer | d60 | d30 | d10 | Cu | Cc |
|---|---|---|---|---|---|---|
| 4:5:1 | Upper layer | 25.6 | 11.2 | 4.0 | 6.4 | 1.2 |
| Middle layer | 24.6 | 11.4 | 2.8 | 8.8 | 1.9 | |
| Lower layer | 23.8 | 12.3 | 4.9 | 4.8 | 1.3 | |
| 5:4:1 | Upper layer | 25.6 | 10.4 | 2.1 | 12.2 | 2.0 |
| Middle layer | 23.0 | 10.1 | 2.1 | 11.0 | 2.1 | |
| Lower layer | 23.0 | 10.9 | 2.3 | 10.0 | 2.2 | |
| 6:3:1 | Upper layer | 25.6 | 10.4 | 2.1 | 12.2 | 2.0 |
| Middle layer | 23.0 | 10.1 | 2.1 | 11.0 | 2.1 | |
| Lower layer | 23.0 | 10.9 | 2.3 | 10.0 | 2.2 | |
| 7:2:1 | Upper layer | 20.6 | 10.2 | 2.1 | 9.8 | 2.4 |
| Middle layer | 18.1 | 8.8 | 2.2 | 7.8 | 1.9 | |
| Lower layer | 19.8 | 10.2 | 2.2 | 8.2 | 2.2 | |
| Brick slag | Upper layer | 19.6 | 10.4 | 2.2 | 8.9 | 2.5 |
| Middle layer | 17.2 | 9.0 | 2.1 | 8.2 | 2.2 | |
| Lower layer | 18.8 | 10.4 | 2.0 | 9.4 | 2.9 |
4 The ratio refers to brick slag: concrete slag: mortar slag.
Table 5.
Results of the California bearing ratio (CBR) tests.
| Ratio | Compaction Work (kJ/m3) | Sample | Swelling Capacity (%) | Average (%) | CBR (%) | Average (%) |
|---|---|---|---|---|---|---|
| 4:5:1 | 2677.2 | 1 | 0.0046 | 0.0049 | 77.27 | 79.97 |
| 2 | 0.0034 | 84.15 | ||||
| 3 | 0.0067 | 78.48 | ||||
| 5:4:1 | 1 | 0.0109 | 0.0097 | 96.32 | 97.61 | |
| 2 | 0.0166 | 97.71 | ||||
| 3 | 0.0017 | 98.82 | ||||
| 6:3:1 | 1 | 0.0083 | 0.0084 | 86.48 | 89.72 | |
| 2 | 0.0085 | 87.84 | ||||
| 3 | 0.0083 | 94.83 | ||||
| 7:2:1 | 1 | 0.0025 | 0.0022 | 82.23 | 80.62 | |
| 2 | 0.0017 | 80.16 | ||||
| 3 | 0.0025 | 79.48 | ||||
| Brick slag | 1 | 0.0028 | 0.0026 | 40.24 | 42.63 | |
| 2 | 0.0030 | 42.03 | ||||
| 3 | 0.0021 | 45.62 |
5 The ratio refers to brick slag: concrete slag: mortar slag.
Table 6.
Requirements of minimum CBR and maximum particle size for embankment fillers.
| Position of Filler Application (Below the Top of Roadbed)(m) | Minimum CBR (%) | Maximum Particle (mm) | |||
|---|---|---|---|---|---|
| Expressway and First Class Highway | Second Class Highway | Third and Fourth Class Highway | |||
| Fill embankment | Upper roadbed (0-0.30) | 8 | 6 | 5 | 100 |
| Lower roadbed (0.30-0.80) | 5 | 4 | 3 | 100 | |
| Upper embankment (0.80-1.50) | 4 | 3 | 3 | 150 | |
| Lower embankment (>1.50) | 3 | 2 | 2 | 150 | |
| Cut embankment | 0-0.30 | 8 | 6 | 5 | 100 |
| 0.30-0.80 | 5 | 4 | 3 | 100 | |
Table 7.
Applied load.
| Loading Level | Load (kPa) | Simulated Embankment Depth (m) |
|---|---|---|
| 1 | 38.59 | 0.000 |
| 2 | 55.14 | 0.885 |
| 3 | 71.68 | 1.770 |
| 4 | 88.22 | 2.655 |
| 5 | 104.76 | 3.540 |
Table 8.
Different types of strain.
| Ratio | Condition | (kPa) | (%) | (%) | (%) | (%) | (%) | (%) | (%) |
|---|---|---|---|---|---|---|---|---|---|
| 5:4:1 | Saturated test | 38.59 | 1.686 | 1.574 | 0.111 | 0.060 | 1.514 | 0.095 | 0.016 |
| 55.14 | 1.811 | 1.644 | 0.167 | 0.061 | 1.583 | 0.088 | 0.078 | ||
| 71.68 | 1.909 | 1.653 | 0.256 | 0.065 | 1.588 | 0.079 | 0.177 | ||
| 88.22 | 1.979 | 1.656 | 0.324 | 0.067 | 1.589 | 0.073 | 0.251 | ||
| 104.76 | 2.076 | 1.697 | 0.379 | 0.072 | 1.624 | 0.066 | 0.313 | ||
| Natural test | 38.59 | 0.168 | 0.065 | 0.103 | 0.012 | 0.053 | 0.009 | 0.094 | |
| 55.14 | 0.223 | 0.090 | 0.133 | 0.015 | 0.075 | 0.008 | 0.125 | ||
| 7:2:1 | Saturated test | 38.59 | 0.721 | 0.613 | 0.108 | 0.025 | 0.587 | 0.025 | 0.083 |
| 55.14 | 0.794 | 0.682 | 0.112 | 0.028 | 0.654 | 0.020 | 0.091 | ||
| 71.68 | 0.847 | 0.728 | 0.119 | 0.030 | 0.698 | 0.015 | 0.104 | ||
| 88.22 | 0.918 | 0.784 | 0.134 | 0.032 | 0.752 | 0.012 | 0.121 | ||
| 104.76 | 1.061 | 0.917 | 0.144 | 0.035 | 0.882 | 0.013 | 0.131 | ||
| Natural test | 38.59 | 0.150 | 0.052 | 0.098 | 0.008 | 0.044 | 0.006 | 0.092 | |
| 55.14 | 0.192 | 0.082 | 0.110 | 0.008 | 0.074 | 0.007 | 0.102 | ||
| Brick slag | Saturated test | 38.59 | 0.878 | 0.537 | 0.341 | 0.027 | 0.510 | 0.038 | 0.304 |
| 55.14 | 0.998 | 0.691 | 0.306 | 0.030 | 0.661 | 0.035 | 0.271 | ||
| 71.68 | 1.865 | 1.348 | 0.517 | 0.057 | 1.291 | 0.034 | 0.483 | ||
| 88.22 | 2.259 | 1.676 | 0.583 | 0.066 | 1.611 | 0.033 | 0.550 | ||
| 104.76 | 2.490 | 1.876 | 0.614 | 0.072 | 1.804 | 0.028 | 0.586 | ||
| Natural test | 38.59 | 0.257 | 0.132 | 0.125 | 0.011 | 0.121 | 0.010 | 0.115 | |
| 55.14 | 0.461 | 0.201 | 0.260 | 0.016 | 0.185 | 0.016 | 0.243 |
8 The ratio refers to brick slag: concrete slag: mortar slag.
Table 9.
Fit parameters of the improved Burgers model.
| Ratio | (kPa) | (kPa) | (kPa) | (kPa·h) | (kPa) | (kPa·h) | a | b | R2 |
|---|---|---|---|---|---|---|---|---|---|
| 5:4:1 | 38.59 | 6.42e2 | 4.35e2 | 2.10e3 | 25.48 | 1.17 | 2.84 | 0.72 | 0.9974 |
| 55.14 | 9.01e2 | 6.73e2 | 3.64e3 | 34.83 | 1.02 | 1.93 | 0.89 | 0.9780 | |
| 71.68 | 1.10e3 | 9.60e2 | 4.61e3 | 45.14 | 1.00 | 1.45 | 0.98 | 0.9741 | |
| 88.22 | 1.33e3 | 1.27e3 | 7.24e3 | 55.52 | 1.00 | 1.37 | 0.97 | 0.9622 | |
| 104.76 | 1.45e3 | 1.68e3 | 8.28e3 | 64.49 | 1.00 | 1.25 | 1.00 | 0.9264 | |
| 7:2:1 | 38.59 | 1.52e3 | 4.35e2 | 2.10e3 | 65.71 | 1.03 | 2.35 | 0.75 | 0.9967 |
| 55.14 | 1.98e3 | 6.73e2 | 3.64e3 | 84.27 | 1.02 | 1.93 | 0.86 | 0.9916 | |
| 71.68 | 2.39e3 | 9.60e2 | 4.61e3 | 102.72 | 1.01 | 1.83 | 0.86 | 0.9994 | |
| 88.22 | 2.78e3 | 1.27e3 | 7.24e3 | 117.33 | 1.01 | 1.77 | 0.86 | 0.9971 | |
| 104.76 | 2.99e3 | 1.68e3 | 8.72e3 | 118.77 | 1.02 | 1.88 | 0.78 | 0.9988 | |
| Brick slag | 38.59 | 1.41e3 | 1.10e3 | 6.25e3 | 75.71 | 1.00 | 1.48 | 0.94 | 0.9499 |
| 55.14 | 1.85e3 | 1.69e3 | 1.03e4 | 83.36 | 1.00 | 1.40 | 0.97 | 0.9379 | |
| 71.68 | 1.25e3 | 2.23e3 | 2.46e4 | 55.54 | 1.01 | 1.24 | 0.97 | 0.9514 | |
| 88.22 | 1.34e3 | 2.80e3 | 4.95e4 | 54.78 | 1.01 | 1.24 | 0.95 | 0.9739 | |
| 104.76 | 1.46e3 | 4.00e3 | 6.53e4 | 58.06 | 1.00 | 1.17 | 0.97 | 0.7743 |
9 The ratio refers to brick slag: concrete slag: mortar slag.
© 2020 by the authors. Licensee MDPI, Basel, Switzerland. This article is an open access article distributed under the terms and conditions of the Creative Commons Attribution (CC BY) license (http://creativecommons.org/licenses/by/4.0/).
Share and Cite
MDPI and ACS Style
Li, Z.; Yan, S.; Liu, L.; Yang, J. Investigation into Creep Characteristics and Model of Recycled Construction and Demolition Waste Used in Embankment Filler. Sustainability 2020, 12, 1924. https://0-doi-org.brum.beds.ac.uk/10.3390/su12051924
AMA Style
Li Z, Yan S, Liu L, Yang J. Investigation into Creep Characteristics and Model of Recycled Construction and Demolition Waste Used in Embankment Filler. Sustainability. 2020; 12(5):1924. https://0-doi-org.brum.beds.ac.uk/10.3390/su12051924
Chicago/Turabian StyleLi, Zhe, Shihao Yan, Lulu Liu, and Jia Yang. 2020. "Investigation into Creep Characteristics and Model of Recycled Construction and Demolition Waste Used in Embankment Filler" Sustainability 12, no. 5: 1924. https://0-doi-org.brum.beds.ac.uk/10.3390/su12051924
Note that from the first issue of 2016, this journal uses article numbers instead of page numbers. See further details here.