Social Sustainability: Satisfying Owners and Communities by Multilevel Strategies of Contractors


Department of Civil Engineering, Faculty of Engineering, King Mongkut’s Institute of Technology Ladkrabang, Bangkok 10520, Thailand
*
Author to whom correspondence should be addressed.
Sustainability 2020, 12(5), 2131; https://0-doi-org.brum.beds.ac.uk/10.3390/su12052131
Submission received: 5 February 2020
/
Revised: 2 March 2020
/
Accepted: 3 March 2020
/
Published: 10 March 2020
(This article belongs to the Section Sustainable Engineering and Science)
Abstract
:In sustainable construction/production, the social dimension regarding owner and community satisfaction has received the least focus. To promote social sustainability, the multilevel strategies of contractors should be developed for owner and community satisfaction. However, a literature review shows that there are few studies on how multilevel strategies influence such satisfaction. Hence, this study aimed to analyze such influences. A survey was conducted to gather data from the Thai construction industry, and these data were then analyzed by a structural equation model (SEM). The results, for the first time, highlight that corporate strategy influences business strategy (direct influence = 0.98), which in turn influences functional strategy (direct influence = 0.93). Additionally, only functional strategy influences owner (direct influence = 0.84) and community satisfaction (direct influence = 0.66). Furthermore, parenting, cooperation, and equipment/machinery substrategies obtain the highest weights within the management levels of corporation, business, and function (regression weights = 0.49, 0.48, and 0.55), respectively. The work productivity and site organization indicators have the largest weights for owner and community satisfaction (regression weights = 0.47 and 0.57), respectively. The findings provide a guideline that helps contractors allocate their available resources to substrategies according to their regression weights, enhancing owner and community satisfaction.
1. Introduction
Sustainability initiatives such as the concepts of green building construction and sustainable infrastructure will likely lead to changes in the construction industry. These changes for sustainable production or construction processes should appropriately weigh economic, environmental, and social dimensions. However, owners and the community, which make up a social dimension, still suffer from the undesirable impacts of products or construction facilities, especially during the construction period. To reduce this suffering, contractors should improve their construction processes to move in the direction of social sustainability by considering the benefits to owners and the community [1]. Key participants in the improvement process are top-level management, middle-level management, and bottom-level management [2], according to the multilevel arrangement that is consistent throughout most contractor organizations. During the improvement process, each management level needs to develop its own sustainable strategies for spending resources to boost both owner and community satisfaction. To develop strategies for each management level (i.e., multilevel strategies), the corporate strategies determined by top-level management concentrate on the investment direction of the contractor company. By determining and communicating the corporate direction to promote individual cooperation within the contractor organization, this approach assists the contractor company in sustainably achieving its corporate vision. To support corporate strategies, middle-level management business/project strategies aim to help contractor organizations sustainably survive in the market by building strengths or reducing weaknesses in the organization or operation of projects. One goal is to increase the organization’s capability to satisfy owner and community requirements, such as through cost leadership or differentiation, resulting in a competitive advantage over rivals. At the functional level (bottom management), most contractor resources are distributed to different functional divisions, after which construction processes and activities are implemented. Therefore, planning functional strategies results in the sustainable spending of resources on the construction processes and activities that assist in achieving strategic success at the top and middle management levels.
In the construction industry, a well-managed stakeholder engagement process achieved through multilevel strategies helps the project stakeholders work together to increase the comfort and quality of life while decreasing negative environmental impacts and increasing the sustainability of the project [3]. Thus, the contractors should satisfy the owners in order to obtain continuous work through formulating their strategic decisions. Then, these strategic decisions can result in owner satisfaction [4]. On the other hand, owners can consume sustainable products or construction facilities by selecting contractors who include sustainable construction processes in their bids. Additionally, Valdes-Vasquez and Klotz [5] studied social sustainability during the planning and design phase to develop an empirical framework for social sustainability processes in construction projects. In their study, project design strategies such as integrative design (e.g., design–construct), adequate selection of material/equipment and construction techniques, and special environmental treatment helps achieve sustainable, socially responsible results, which likely lead to community satisfaction. This process implies a possible relationship between contractor strategies and either owner or community satisfaction. Accordingly, various owner satisfaction indicators have been suggested, such as the project’s productivity, flexibility, owner participation, members, and goals [6]. Community satisfaction indicators have also included accessibility, site organization, health and safety, environment, community property, communication channels, and design [1,7,8]. Sustainable construction, here, refers to constructions that include economic, environmental, and social aspects into the construction activities on processes via multilevel strategies. However, the study focuses only on a social aspect through owner and community satisfaction.
Therefore, the above overview shows that there is a wealth of research on contractor management strategies and owner and community satisfaction indicators. However, very few studies have discussed the question of how a multilevel-structured management strategy of contractors influences owner and community satisfaction, showing a knowledge gap. To fill this knowledge gap, this research aimed to analyze the influence of corporate (top), business/project (middle), and functional (bottom) level management strategies on owner and community satisfaction via a structural equation model (SEM). The significant knowledge of the newfound influence (1) renders more insight into the relationship between multilevel strategies and owner/community satisfaction and (2) guides contractors to efficiently allocate their limited resources to substrategies within each management level for sustainable construction, thus leading to owner and community satisfaction.
2. Literature Review
Although strategy formulation markedly affects the success of changes in contractor organizations in reaching the desired future positions, and fulfills owner and community satisfaction via sustainable production processes, the definitions of strategy vary. As an early leader in the discussion, Porter [9] described the competitive strategy as the selection of actions leading to firm competitiveness in an industry or market. Salimian et al. [10] defined strategies as decisions on the future positions of organizations and the ways by which to arrive at these positions. Ho [11] saw strategy as incorporating all of an organization’s actions from various functional units. Based on a resource-based approach, Johnson and Scholes [12] explained strategy as an organization’s selection for performing activities that correspond with its environment and available resources. Salimian et al. [10] also indicated that strategy was defined at the corporate (top), business (middle), and functional (bottom) levels, with the success of the organization depending on not only formulating strategies at these levels but also aligning the strategies. To integrate the various definitions presented by previous researchers, strategy here means decision making about focusing or spending resources on selected activities, after analyzing the internal and external environment, to achieve the organization’s objectives and desired future position. How an organization spends its resources can be reflected by multilevel strategies at the corporate, business, and functional levels. As such, the following will review corporate, business, and functional strategies recommended by previous studies. Then, either owner and community satisfaction indicators, or the relationship between the contractor strategies and owner/community satisfaction, will be reviewed to establish research hypotheses.
2.1. Corporate Strategy (CS)
Corporate strategy is a decision from top-level management concerning increasing, stabilizing, or decreasing investment through contractor corporate positioning as to whether to have a single business to gain the advantage from economics of scale or to have multiple businesses for the sake of economics of scope. The decision on corporate positioning aims at the distribution of limited resources to support existing businesses or invest in new businesses, which makes these businesses assist one another to gain the highest benefit for whole contractor organizations. This decision then leads to continuous growth with sustainable production/construction and contractor competitiveness through satisfying the owners and community. Three corporate strategies were suggested: direction, portfolio, and parenting [2]. With respect to directional strategy, contractor corporations have several strategic options such as growth, stability, and retrenchment in terms of size and number of businesses. The selection of any strategic options to pursue should be performed after the corporations’ internal and external circumstances have been analyzed. Portfolio strategy is concerned with decisions on how many resources should be distributed to each business to obtain the highest return on investment for contractor corporations as a whole. Regarding the parenting strategy, contractor corporations, as parent organizations, decide to spend substantial resources on any selected business units, as subsidiaries, that are properly supported by the parent corporation strength, leading to owner and community satisfaction and thus to a higher competitive advantage over rivals.
2.2. Business Strategy (BS)
Business strategy is usually determined by middle-level management—each business unit within the contractor corporation. The strategy focuses mainly on the value-added creation of construction or services for clients/owners and the community, and on creating long-term competitive advantages for each business unit, leading to strong and sustainable business positions. Before determining a business strategy, each business unit should analyze and evaluate the external environment (such as economics, the environment, society, politics, technology, and law), internal environment (such as resources and capacities within corporations), industry and competitive situation (such as the industry structure, the life cycle of the industry, trends of changes, and the competitive intensity), and its current competitive position. Three generic strategies were suggested by Porter [9]: cost leadership, differentiation, and market focus. For contractors, cost leadership means offering lower bid prices than other competitors. Differentiation means that contractors’ construction or services are perceived as superior by the clients/owners. Contractors can provide differentiation in various ways such as through construction using high-end technology and environmentally friendly methods, or by employing a local workforce. Both the cost leadership and differentiation mentioned previously can be employed industry wide. In some circumstances, contractors have to limit their industry market area. For example, contractors can select clients/owners from within a specific group or area, or they can bid on construction projects of a specific type or in a specific geographical area. This limitation is the subject of market focus, which is frequently applied in terms of cost focus or differentiation focus. In addition to the three generic strategies, McGee et al. [13] confirmed that a firm can create a competitive advantage through cooperation with other firms to meet owner and community requirements to build a stronger and more sustainable business position within its industry.
2.3. Functional Strategy (FS)
Functional strategy should be formulated after corporate and business strategies have been determined. The formulation of functional or operational strategy is mostly performed by bottom-level management, which is concerned with (1) allocation of resources to various functional units within the organization and construction projects and (2) deployment of resources within any functional units to make corporate and business strategies succeed. Before formulating functional strategy, the resources and capacities of contractor corporations in terms of strengths and weaknesses should be analyzed and evaluated to ensure that the selected functional strategy is possible and realistic. Ghodrati et al. [14] also found that the implementation of strategic management in construction projects improved labor productivity. Based on the management of construction projects, Shadan [15] introduced eight functional divisions: design, estimating, contract, finance, procurement, equipment/machinery, construction, and public relations. In addition, many researchers have suggested functional strategies that perhaps contribute to owner and community satisfaction for various functional units:
- Design strategy: optimizing the designs of floor layouts of buildings as a strategy by which to reduce construction material waste and social and environmental impacts [1]. Contractors can adopt green infrastructure designs such as a green roof, green walls, and rain gardens for sustainable urban development [16].
- Construction strategy: construction techniques using prefabrication elements or parts of structures as strategies by which to increase the construction efficiency, including tracking processes and accelerating project delivery [7]. Lightweight concrete can be strategically selected for sustainable construction to reduce carbon emissions, reserve energy, and increase cost effectiveness [17].
- Contract strategy: contractors may consider the type of contract as their strategy to render incentives and allocate risk among parties, which affect the time, cost, and quality of projects. Various contract types are suggested, such as fixed price and cost plus [18].
- Procurement strategy: contractors may use different procurement strategies to attract highly skilled subcontractors and suppliers to deliver construction projects to clients/owners, including networks, partnering, and alliancing, which help reduce the delivery times and costs of projects [19]. Within these strategies, a certain discount among parties or a longer credit period for parties may be applied.
- Estimating strategy: top-down estimation (predicting a total project estimate and then dividing the total project estimate into individual work activity estimates) or bottom-up estimation (predicting individual work activity estimates and then aggregating the individual work activity estimates into a total project estimate) [20] help improve the accuracy of estimation.
- Equipment/machinery strategy: as a strategic decision for substantial investment, some contractors may procure equipment/machinery to increase the operational effectiveness and efficiency of construction projects [21], while other contractors perhaps lease or rent high-technology equipment/machinery [22].
- Financial strategy: financial ratio control can be used as a strategy to avoid construction project failure [23].
- Public relations strategy: when the number of winning contracts decreases and the business environment changes, contractors can use various public relations strategies to reposition their corporate image [24].
2.4. Owner Satisfaction (OwS)
In construction businesses, owners always engage contractors to complete construction projects. Thus, the contractors are possibly subjected to the owners’ control. Many contractors attempt to satisfy the owners in order to have more opportunities to gain continuous work. Accordingly, different researchers have suggested different owner satisfaction indicators. Raadt et al. [25] suggested that information systems help merge the individual goals of stakeholders into shared goals of projects, resulting in better stakeholder satisfaction. Kärnä et al. [6] classified construction projects into six clusters based on customer satisfaction. Examples of the classification indicators are contractual work productivity, flexibility, and work supervision skills as project members.
2.5. Community Satisfaction (CS)
The building/construction industry is one of the largest users of energy, material resources, and water, and it is a formidable polluter [26], which has a considerable impact on local communities. Thus, the relationships between the contractors and communities are often strained, which may lead to unsuccessful construction projects. To improve these relationships, researchers have recommended various community satisfaction indicators, namely: the level of accessibility of the project to stakeholders; the site organization around the construction project, providing safe open places; environmental impact reduction; the production of fewer pollution and waste products to promote community health and safety; a communication channel for sharing information with the neighborhood community; and designs aimed at improving the local infrastructure and developing existing community properties [1,5,7,8,27,28]. Additionally, community needs should be incorporated into the development of public projects to avoid project failure [29]. Wang et al. [30] also investigated a Chinese road construction project and determined that inefficient communication with the public produces the most critical risk of community dissatisfaction.
2.6. Hypotheses
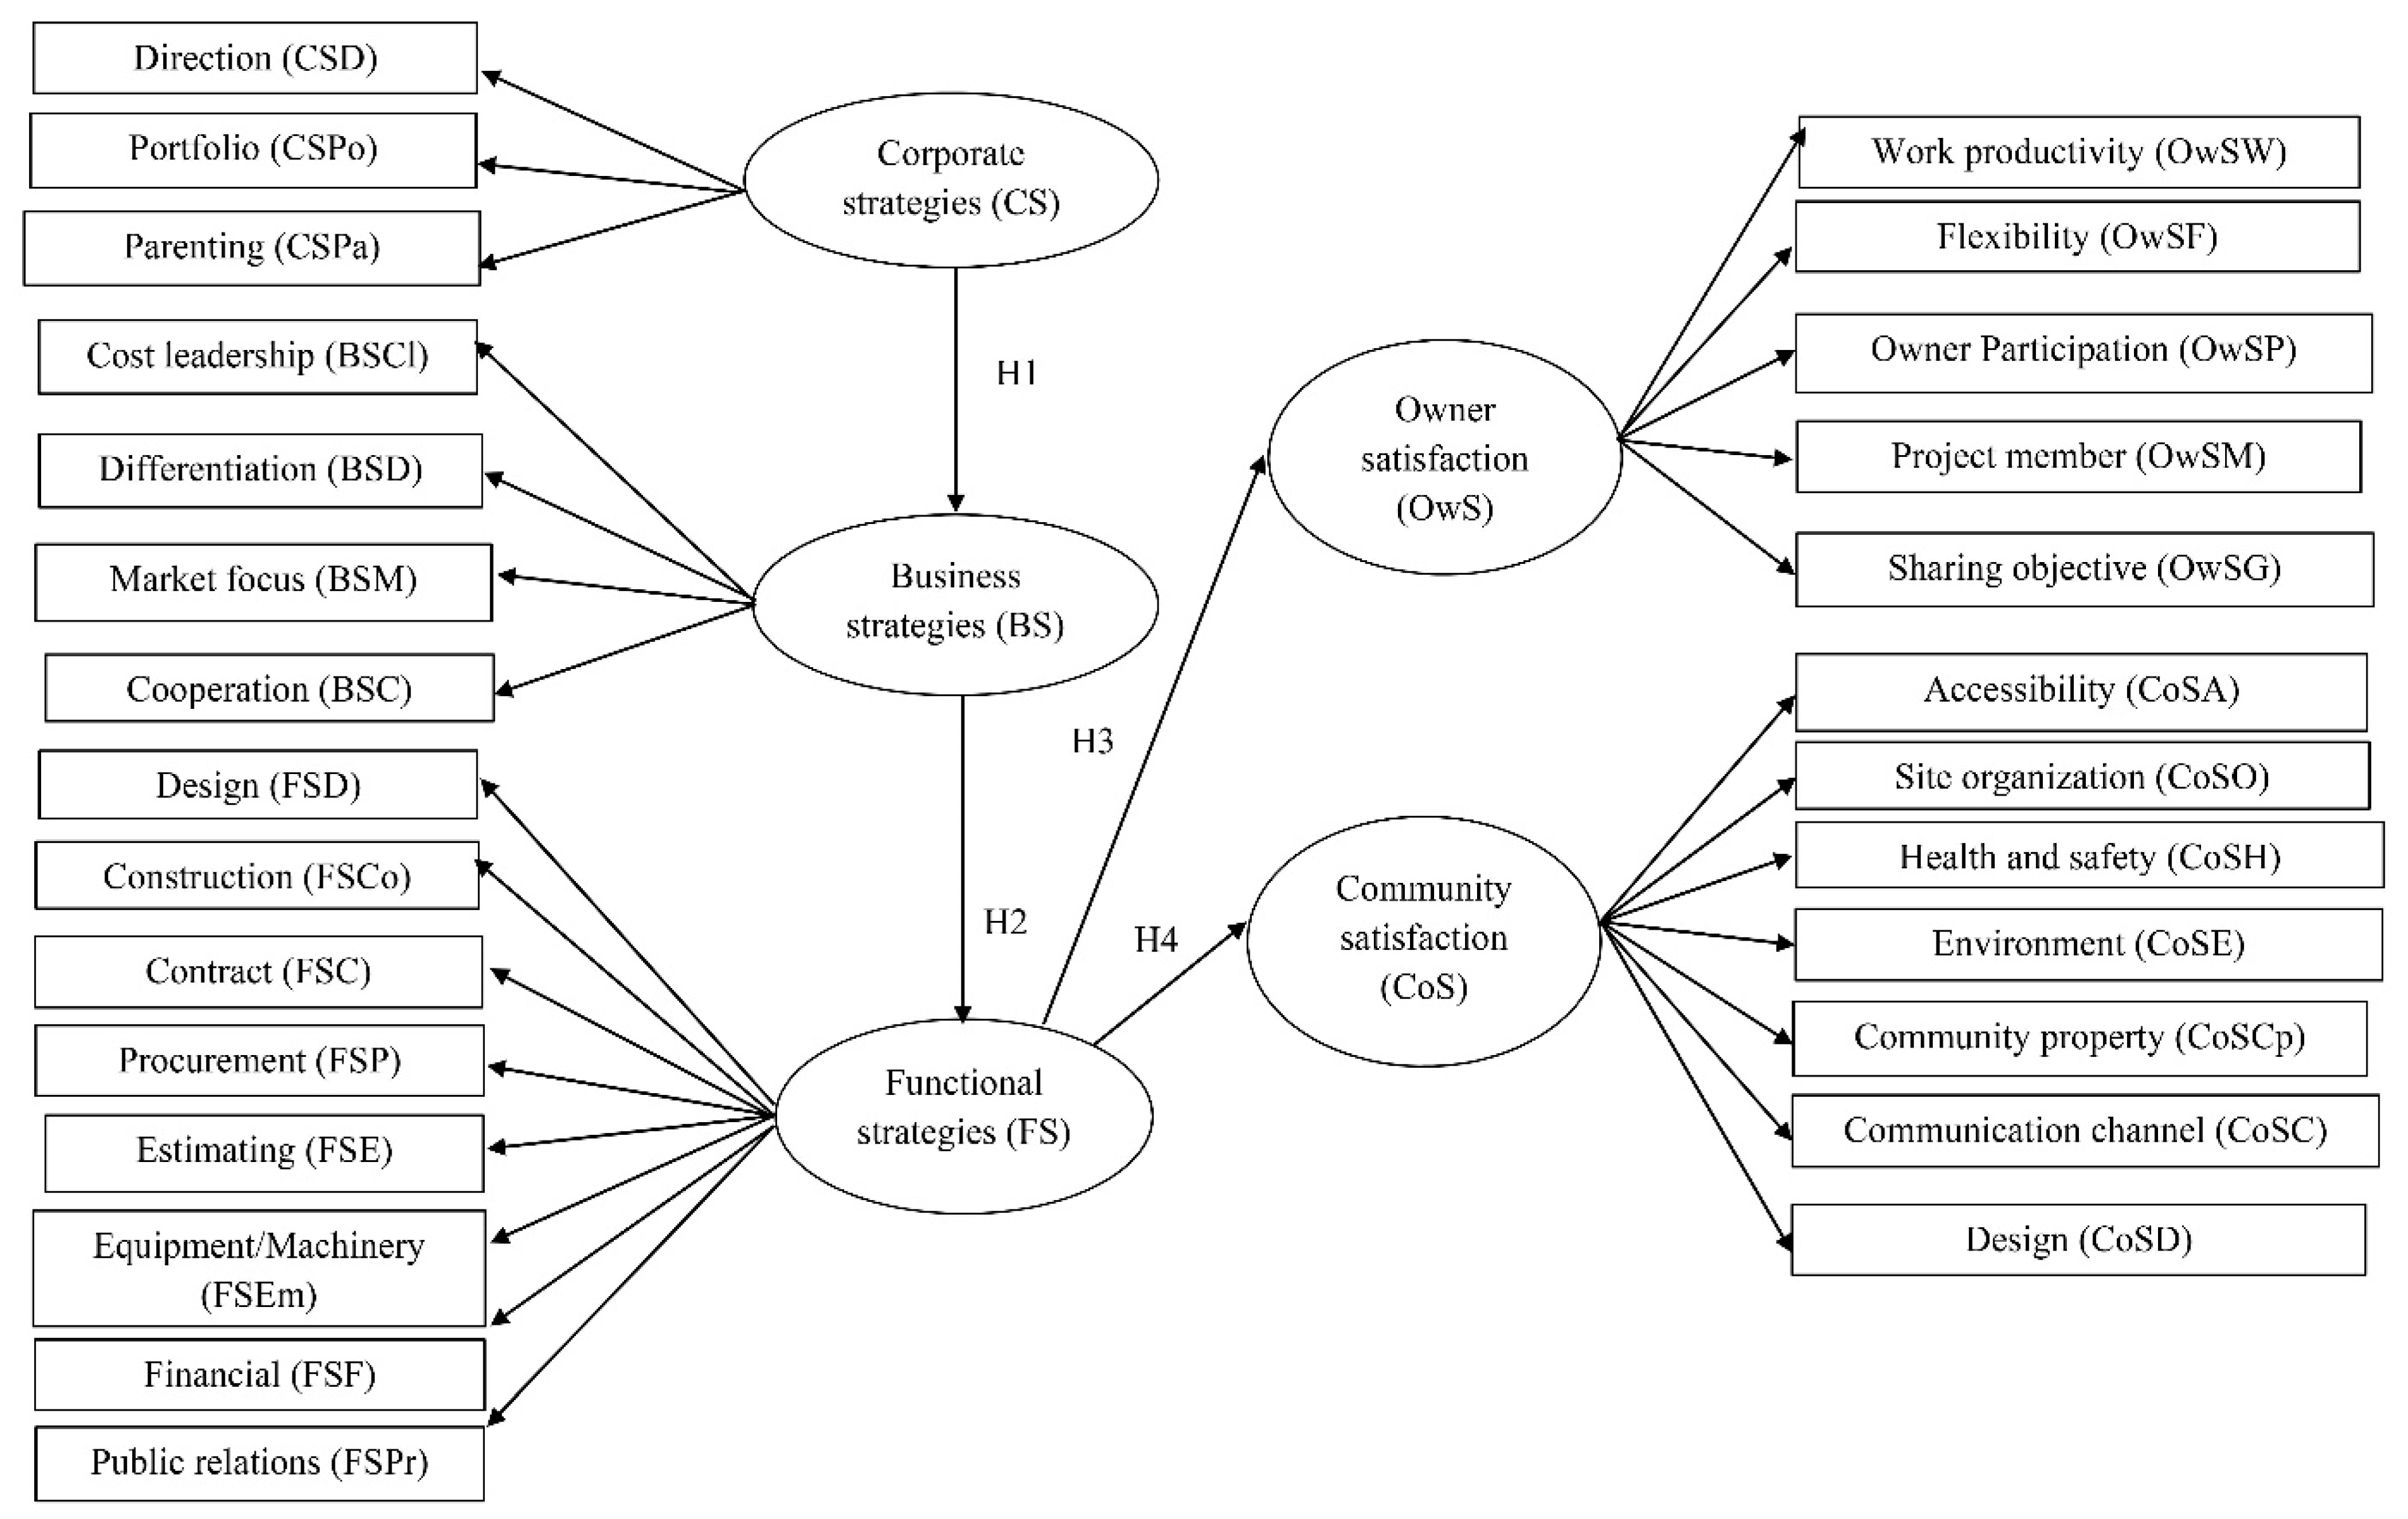
In the previous sections, many studies showed that contractor management strategies are arranged in a three-level structure corresponding to top–middle–bottom management levels in contractor organizations. The higher (e.g., top) level has broad responsibilities of first instructing the lower (e.g., middle) levels and influencing them to change their actions if needed, while the functional (i.e., bottom or lowest) level mostly directly interacts with the external environment [31], which includes owners and communities. To reinforce this multilevel influence, Wooldridge et al. [32] noted that middle-level management serves as a mediator between the top and bottom management levels in strategy determination. This finding implies that the top-level strategy influences the middle-level strategy; then, the middle-level strategy influences the bottom-level strategy. In addition, strategic decisions have effects on the project owner’s satisfaction [4]. To ensure sustainable viability, contractors should consider the surrounding communities when formulating their strategies, as contractor activities likely affect the well-being of the communities. With good responses from surrounding communities, contractors can avoid social problems resulting from conflicting groups of people, which increases the chance of project success [30]. Additionally, Valdes-Vasquez and Klotz [5] found that the design strategy of construction projects contributed to community satisfaction. From the analysis of the literature review, the proposed conceptual framework for the study is illustrated in Figure 1 and stated as follows:
Hypothesis 1 (H1).
In the construction sector, corporate strategies of contractors have a positive and direct influence on the business strategies of contractors.
Hypothesis 2 (H2).
In the construction sector, business strategies of contractors have a positive and direct influence on the functional strategies of contractors.
Hypothesis 3 (H3).
In the construction sector, functional strategies of contractors have a positive and direct influence on owner satisfaction, which is an indicator of social sustainability.
Hypothesis 4 (H4).
In the construction sector, functional strategies of contractors have a positive and direct influence on community satisfaction, which is another indicator of social sustainability.
3. Research Methods
To investigate the influence of the three strategy levels of contractors, a structural framework was developed to investigate how corporate (top), business (middle), and functional (bottom) strategies affect owners and their project’s community satisfaction described in the previous section. This investigation used survey research via a questionnaire, and the data were analyzed by an SEM.
3.1. Sample
The survey was conducted in Thailand. Only large and well-known contractors were targeted because these contractors always develop three (corporate, business, and functional) strategy levels, which correspond to the conceptual framework. Small and medium contractors may combine corporate strategies with business strategies into a single strategic level due to their not-large business size, which does not agree with the conceptual framework. Thus, they were not targeted. Then, all contractors who register as public companies with registered capital over 50 million USD and are frequently found in public media were drawn from the ASEAN Construction Federation’s Thailand Construction Handbook [33]. This handbook contains Thai construction contractors involved in both public and private construction projects in Thailand. As a result, eight large and well-known contractors were drawn as short-listed contractors (i.e., the total number of large and well-known contractors). After that, seven contractors were randomly selected from this short list (the number of selected contractors were based on Yamane’s formula). The human resource departments of the selected contractors were connected to estimate the number of staff who have experience in construction, project management, or strategy formulation (not all employees). These staff are expected to be a plausible representation of large and well-known contractors. Approximately 300 staff were found, and this number of staff was considered as the total population for the study. Based on Yamane’s formula, the sample size was 224 with a 95% confidence level, an error of 0.05, and a confidence interval of 3.3, which is acceptable. Therefore, the sample can be considered as a reasonable representation of the total population. Then, questionnaires were mailed and emailed to the selected individuals from the study’s sample. After two weeks of questionnaire distribution, the individuals who did not respond to the questionnaire were pleasantly reminded by telephone. Of the 300 questionnaires sent through mail and email, 225 questionnaires were returned (a response rate of 75%). This response rate is considered excellent [34], which is sufficient for SEM analysis. Experts’ and respondents’ profiles are shown in Table 1.
3.2. Questionnaire Development
The questionnaire was designed in two parts. Part 1 consisted of the respondents’ personal and firm information, including information such as their position, experience, work characteristics, range of average project value per year, project characteristics, and number of employees. Part 2 contained items related to each management level’s strategy and indicators of owner and community satisfaction. Each item was assessed using a five-level, Likert-type agreement scale ranging from 1 (less important) to 5 (very important). The content of the questionnaire was developed through the following processes:
- The definition of strategies for each level, and owner and community satisfaction indicators, were drafted from an analysis of the literature and theory to ensure validation of the meaning and scope. Then, a questionnaire was preliminarily developed.
- In-depth interviews with six experts (detailed in Table 1) were also used to test the content validity of the questionnaire and other possible strategies, and owner and community satisfaction indicators. Four individuals were senior construction managers, and two were vice presidents. All six individuals each had more than 20 years of experience in construction projects and strategic planning. The interview results were compared with the literature review and adjusted to improve the clarity and conciseness of the questionnaire.
- The questionnaire reliability was tested by use of Cronbach’s alpha (α), which aims to understand each observed variable representing correspondents with latent variables. This test for the questionnaire’s reliability returned results with an average value of 0.833 for the three levels of management strategies and owner and community satisfaction items. A Cronbach’s alpha value of 0.7 is considered acceptable [35].
- Construct validity is undertaken to indicate whether the hypothesized structure of latent variables constructed in this study can measure multilevel management strategies and owner and community satisfaction. Due to the difficulty in evaluating construct validity, Dunn et al. [36] suggested that convergent and discriminant validities are most frequently employed to establish construct validity. Convergent validity aims to test the accordance between the observed variables and their corresponding latent variables. In this study, confirmatory factor analysis (CFA) was used to test the construct validity, which was determined by the overall fit index of each measurement model of CS, BS, FS, OwS, and CoS, as shown in Table 2. In the table, the values of overall goodness-of-fit indices satisfy all recommended criteria values; therefore, convergent validity exists.
Discriminant validity is the measure of the independence of the observed variables within their corresponding latent variable from the other latent variables. In this study, the Fornell–Larcker criterion [40] was used to assess the discriminant validity. The indicator for the assessment is the square root of the average variance extracted (AVE) of each of the latent variables/constructs, which should be higher than the highest correlation with any other latent variable. Table 3 summarizes the correlation coefficient between latent variables and AVE, showing that the values of the square root of AVE satisfy the Fornell–Larcker criterion. Thus, discriminant validity was confirmed.
3.3. Structural Equation Model (SEM)
An SEM is a multivariate analysis technique that tests the congruence of the conceptual framework and observed data. In SEM analysis, this congruence can be tested through confirmatory factor analysis (CFA) and path analysis. Typically, the SEM consists of two main components: measurement and structural models, which are mainly described by observed and latent variables. The observed variables are directly measured by use of, for example, a five-point Likert scale. The latent variables are indirectly measured and determined by researchers, which influences the hypothesized observed variables. There are two types of latent variables. One is exogenous variables that influence other latent variables. The other is endogenous variables that are influenced by other latent variables (either other endogenous variables or exogenous variables). During SEM analysis, CFA is applied to find the relationships (regression weights) between the observed and latent variables for the measurement models. Meanwhile, the structural model is examined by path analysis to discover the relationships among the latent variables, i.e., the influences of multilevel strategies on owner and community satisfaction.
The measurement models explaining the exogenous and endogenous latent variables and the structural model describing the relationships among the latent variables can be expressed by Equations (1) and (2), respectively [39].
where ξ is the vector of the exogenous latent variables; λx is the coefficient matrix that links the observed variables and latent variables; x is the vector of the observed variables; δ is the vector of the measurement errors in the exogenous latent variables; y is the vector of the observed variables for the endogenous variables; λy is a coefficient matrix that links the observed variables and latent endogenous variables; η is the vector of the endogenous latent variables; and ε is the vector of the measurement errors in the endogenous variables.
where B is an influence coefficient matrix that links the η variable and other η variables; τ is an influence coefficient matrix that links the endogenous latent variables (η) and exogenous latent variables (ξ); and ζ is the vector of the errors in the equation.
In this study, the conceptual model was finally determined to consist of five latent variables and 27 observed variables (Table 4). The latent variables investigated included corporate strategies (CS), business strategies (BS), functional strategies (FS), owner satisfaction (OwS), and community satisfaction (CoS). The structural model was constructed as a conceptual model and was used to find the relationship between the three levels of strategies and owner and community satisfaction, as shown in Figure 1. In this figure, the latent variables are shown in ellipses, and the observed variables are shown in rectangles.
4. Results
4.1. Respondent Characteristics
In the survey results of Part 1, 44% of the respondents identified themselves as project managers, and 2.22% identified themselves as construction senior managers. This result is in agreement with the 80.44% that indicated they had 10 or more years of experience, and the 81.78% who reported that they participated in the construction project management field. Additionally, it was noted that a large majority of the individuals were associated with large firms of over 1000 employees (87.11%). In terms of average projects per year, 9.78%, 20.89%, and 69.33% of the individuals work at firms with project value ranges of 0.3–3, 3–30, and over 30 million dollars, respectively.
4.2. Interrelationships
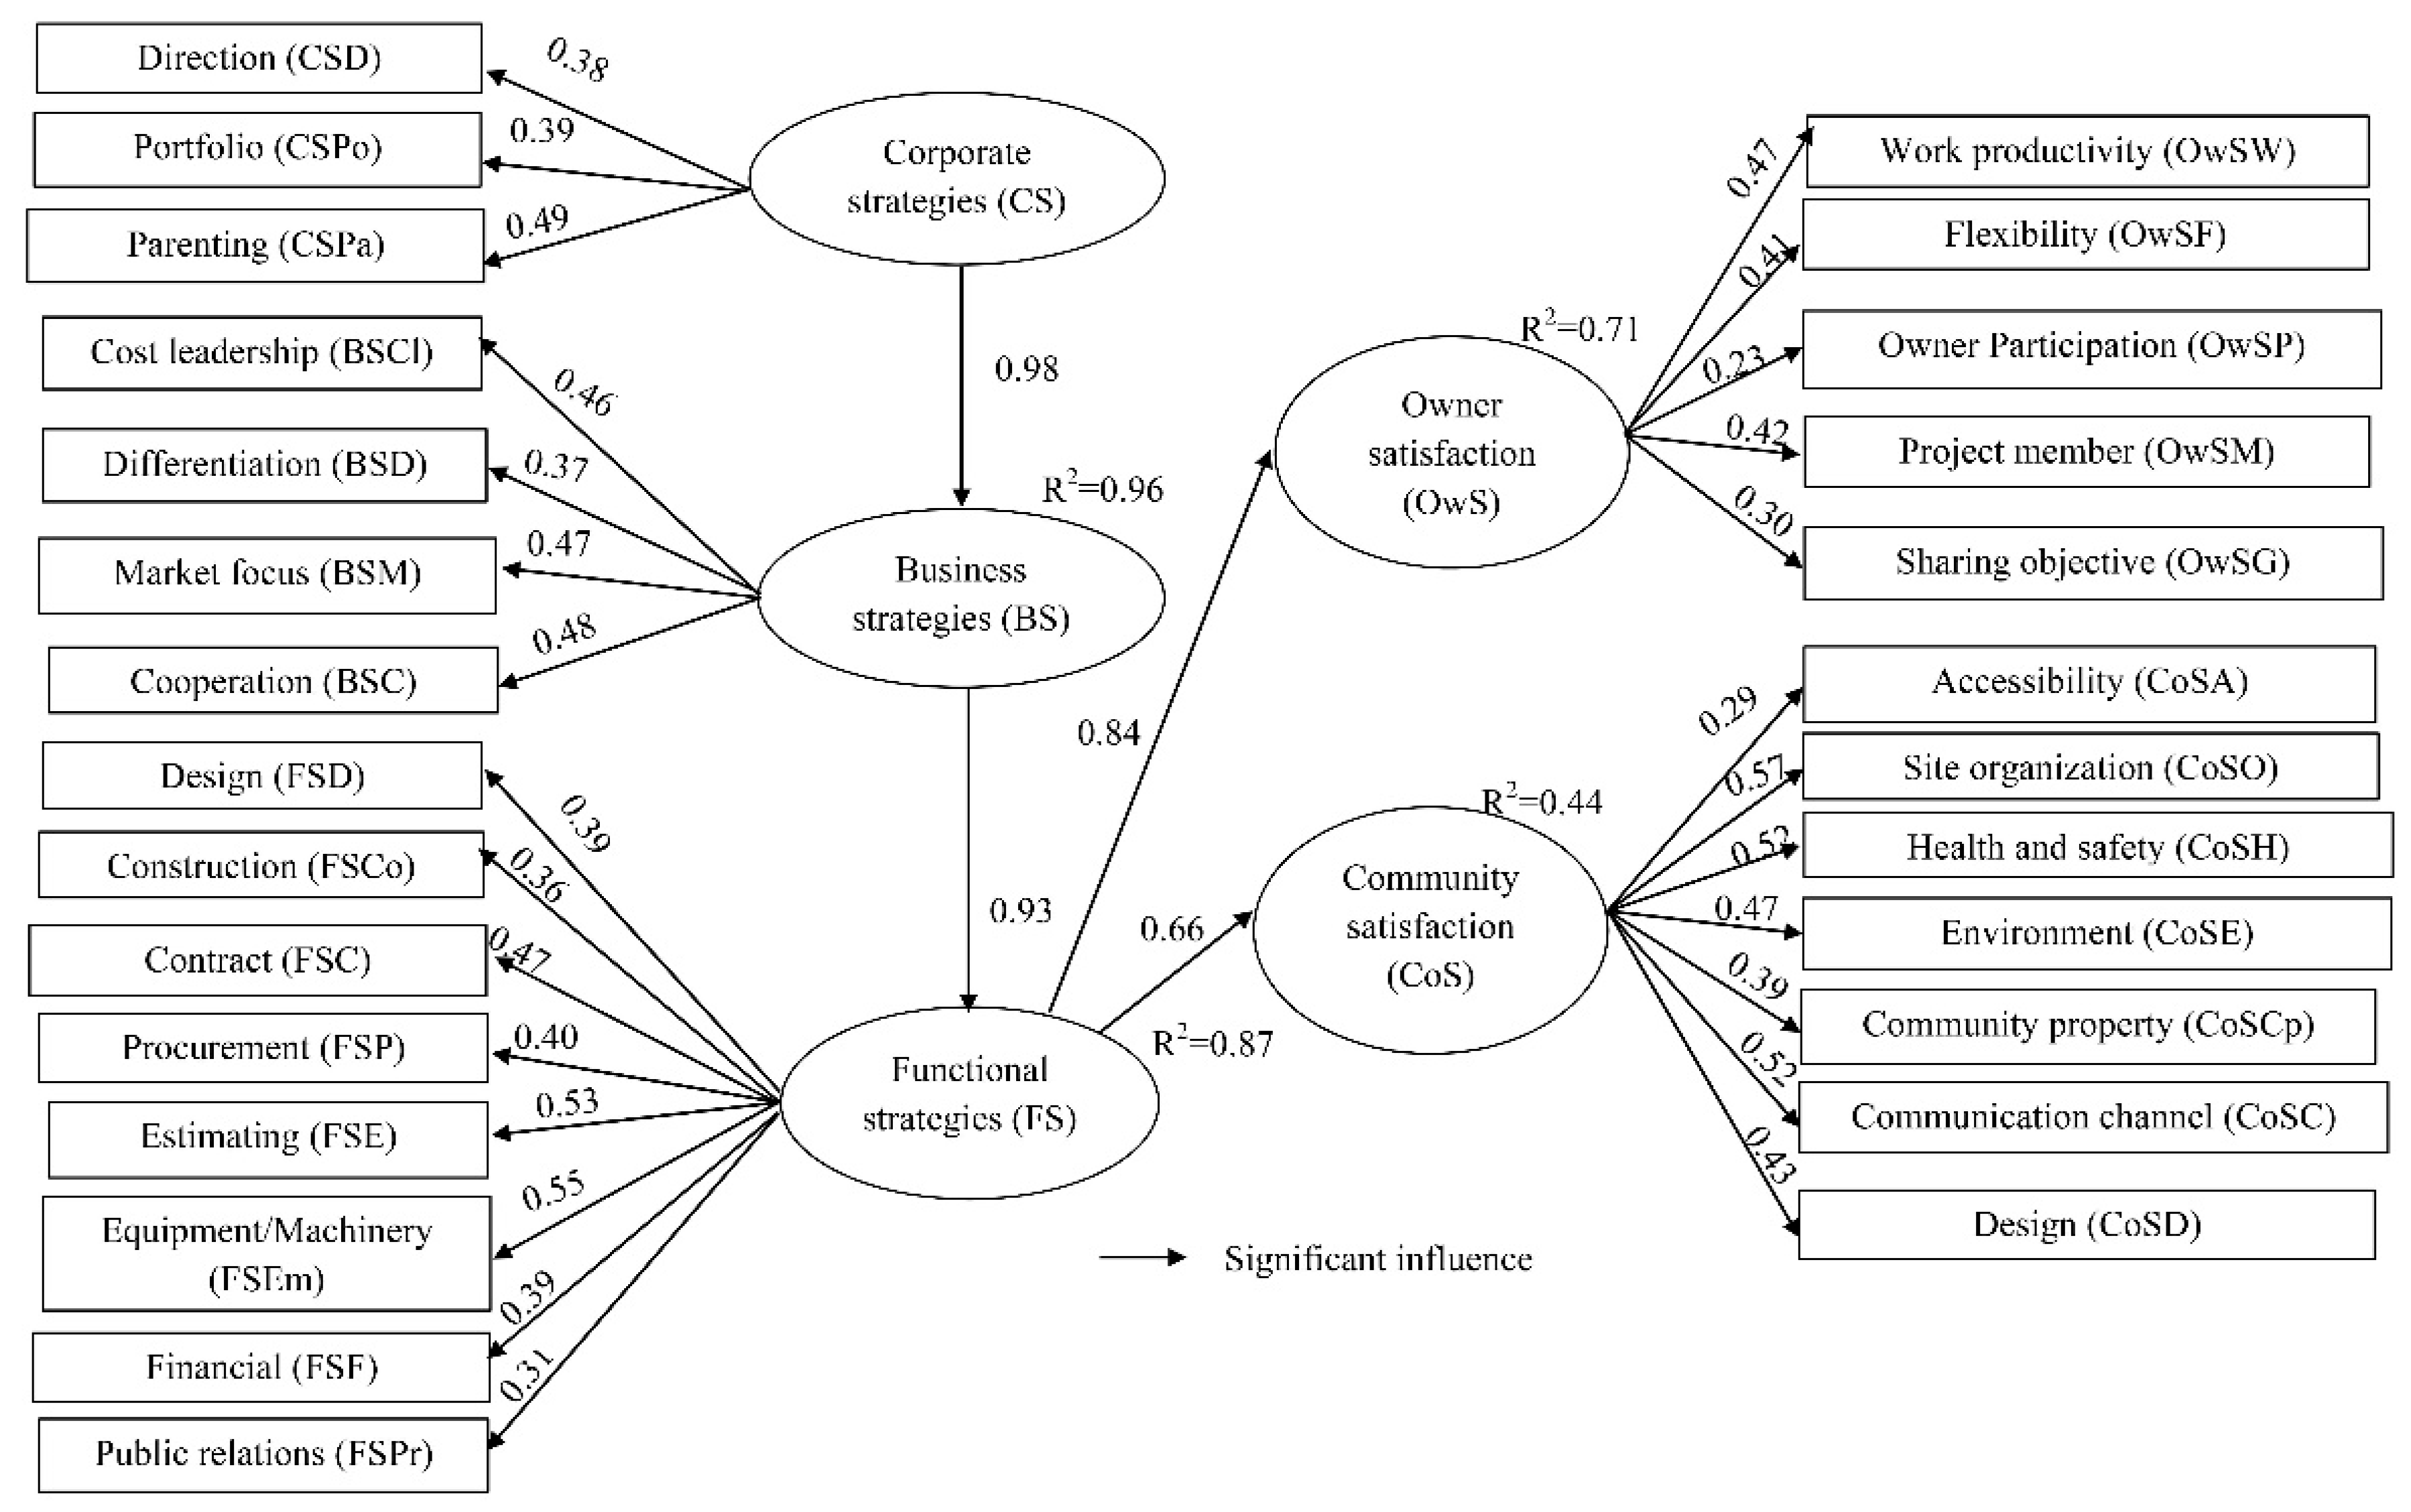
The survey results of Part 2 were used to test the interrelationships of both the latent and observed variables and the respective hypotheses via SPSS Amos version 20 software (IBM, Armonk, New York, USA). Within the test, the statistically insignificant variables were eliminated. The conceptual model was adjusted many times, and the adjustment stopped when the model’s goodness-of-fit (GoF) values met the recommended criteria values, as shown in Table 5. In the table, all the values of the GoF indices comply with all recommended criteria values, so the SEM is considered valid and fits the collected data well. Figure 2 presents the results of the final SEM. The figures on the arrows represent the regression weights or influences between pairs of variables.
In hypothesis testing, the SEM analysis gives the p-values of hypotheses H1–H4 as less than 0.01, indicating statistical significance, so H1-H4 were accepted. Table 6 additionally shows the relationships among the latent variables and their direct influence (DI), indirect influence (II), and total influence (TI) on each construct, with the sum of DI and II referred to as TI. Table 6 also shows that CS had an indirect influence on OwS (II = 0.76) and CoS (II = 0.60). BS was also shown to have an indirect influence on OwS (II = 0.78) and CoS (II = 0.61). CS directly influenced BS (DI = 0.98), with BS directly affecting FS (DI = 0.93).
The relationship between multilevel strategies and satisfaction (Figure 2) is consistent with Haverila and Fehr [41], who defined satisfaction as a perception of qualities matching preconceived expectations, whereas bottom-level management mainly develops functional strategies to improve construction quality. Therefore, only the functional level of strategies directly influences both CoS (DI = 0.66) and OwS (DI = 0.84). Additionally, the squared multiple correlations (R2) of OwS and CoS were 0.71 and 0.44, indicating that the functional levels of strategies influence 71% and 44% of the variances in the owner and community satisfaction, respectively, which provides evidence to support the results to a certain level.
5. Discussion and Implications
In this study, an SEM was first created based on a literature review to analyze the influences of contractors’ multilevel strategies on owner and community satisfaction. The SEM results confirmed these influences. Additionally, Figure 2 and Table 6 show that OwS is indirectly influenced by CS (II = 0.76) and BS (II = 0.78) through the path of CS to BS (DI = 0.98) to FS (DI = 0.93) to OwS (DI = 0.84). Similarly, the path of CS to BS (DI = 0.98) to FS (DI = 0.93) to CoS (DI = 0.66) indicates the indirect influence between CoS and CS (II = 0.60). These two paths indicate that only functional strategies have a direct influence on both owner and community satisfaction. The findings are consistent with the literature mentioned in Section 2.6.
The top management level is responsible for determining the corporate strategy for major investments. This strategy affects how the contractor does business—by a single business, or through multiple businesses. Within the corporate strategy, the parenting substrategy receives the greatest weight (regression weight = 0.49). A contractor employing the parenting substrategy absolutely operates multiple businesses through vertical/horizontal expansion or diversification. For instance, the contractor may expand vertically to operate green construction material suppliers or specific subcontractors with low negative social impacts, or it may expand horizontally by bidding for different types of construction projects that promote social sustainability. Regardless of the form of expansion, parenting should add value to the contractor’s target businesses. The value-added role of parenting can be achieved when the contractor, as a parent, understands the critical success factors and specific needs of the businesses [42] and has or can develop the competencies, skills, and resources necessary for this role. The contractor then allocates more resources to the businesses so that their values can be vastly increased by the parenting role. In addition, the parenting contractor may provide suggestions to these businesses, such as by sharing knowledge and experience regarding strategic management processes of sustainable business and efficient methods of sustainable operations.
Next, the contractors should focus on portfolio substrategy (regression weight = 0.39). Similar to the parenting substrategy, the contractor here has multiple businesses. The aim of portfolio determination is to gain significant benefit from synergy among multiple businesses. That is, all businesses support one another, usually in terms of technology exchange, shared resources, information and skills, trading opportunities, and marketing and advertising collaboration. This synergy can add much more value to the contractor company compared with allowing the independent operations of each business as a stand-alone body. Finally, directional substrategy (regression weight = 0.38) allows all members to understand the current and future status of the contractor organization, which likely leads to the active collaboration of all members in business activities. Within the directional substrategy, the contractor may choose to grow, stabilize, or retrench their businesses. For example, if the contractor chooses to expand in size, they may bid for construction projects in foreign markets or different geographical business areas to benefit from economy of scope, or they may bid for similar but larger construction projects so that the contractors can benefit from economy of scale.
At the middle management level, the determination of the business strategy is concerned with the development of a competitive position of the contractor businesses corresponding to owner and community requirements. The SEM analysis yields that the cooperation substrategy receives the largest weight, with a regression weight of 0.48. Various forms of cooperation exist, such as networks with other construction parties [43]; strategic alliances with owners, government agencies, labor unions [44] and designers [45]; construction joint ventures [46]; and partnerships with suppliers who acknowledge and support green construction [47]. All the cooperation forms are devised to extend the competency of individual engaging parties in business operations, leading to a higher competitive advantage over competitors. However, the contractor may cooperate with different parties via different incentives. For example, cooperation between the contractor and subcontractors/suppliers is intended to share risks, exchange sustainable technology, or solve ecological problems. The contractor may cooperate with other contractors because of international market entry, resource and information sharing, or technology transfer for sustainable development. Developing long-term cooperation with owners and communities helps the contractor differentiate the construction process and then add more value to construction projects and facilities. This cooperation can enhance owner and community satisfaction, cultivate loyalty, and build barriers for newly entering contractors.
Market focus substrategy is the second-most important (regression weight = 0.47). By considering the limitations of resources, experience, and firm location, contractors focus on specific segments of the construction market. Within the market focus substrategy, contractors can focus on specific geographical areas, specific types of construction projects/owners, or the scope of construction/services [43]. Differentiation comes third. This finding may stem from the fact that most communities currently require specific construction to serve their various needs, which allows the contractor to submit higher bid prices and earn higher profits. Differentiation also builds barriers against new contractors who want to enter the market. Ling et al. [43] find that contractors’ competitiveness is affected by various differentiation options, namely, superior design/construction techniques or management of product/service delivery, high quality inputs, innovative products/services, and extensive services to communities. Other strategic options can be selected for differentiation, such as special offers for owners and environmentally friendly construction for the communities.
To support the success of corporate and business strategies, the functional strategy is defined at the bottom management level. Based on the results of SEM, the equipment/machinery substrategy has the highest weight, with a regression weight value of 0.55. In large construction projects, many types of equipment and machinery items are always employed to perform tasks more effectively and efficiently. Different contractors may use different methods and equipment/machinery to perform the same task, which certainly yield different performances. The different performances incur different costs to contractors and affect the levels of owner and community satisfaction differently. As such, when formulating an equipment/machinery substrategy, contractors should focus on the development of a standard equipment/machinery procedure concerning, for example, selection, operations, maintenance and repair, data records, retirement and replacement [22], and the application of computer-integrated manufacturing to construction, such as through building information modelling (BIM) [48]. This standard procedure and BIM application help reduce, for instance, the cost of operations, accident occurrences, pollutant emissions, traffic problems, and water and energy consumption, raising owner and community satisfaction.
Interestingly, under economic fluctuations, businesses usually fail because of monetary problems. Hence, decisions on financial substrategy, such as investment, financing, and dividends, are important to avoid such failure. Additionally, if the financial substrategy is adjusted appropriately to rapid changes in the business environment, this adjustment can help to increase the financial wealth of the contractor. On the other hand, contractors can use the public relations substrategy to improve and communicate their reputations and images to the public, which increases the engagement of the contractors and promotes community acceptance. This substrategy can be implemented by, for example, presenting a strong, prominent corporate image that the communities will remember, using social/online media communication to support offline public relations, and demonstrating corporate social responsibility to maintain a positive image and elicit support from the surrounding society and community.
Another interest is construction substrategy. Construction here refers to a construction method of transforming designs/plans and specifications into a completed facility, for which the contractor is responsible. Due to the uniqueness of each construction project, the construction method varies from project to project without standard framework. This means that the contractor uses different construction methods to complete different projects. Additionally, depending on their experience and limitations, different contractors usually employ different methods to complete the same project. Undoubtedly, contractors incur different costs from different construction methods. Thus, when spending resources on construction substrategy, contractors should focus on, for example, developing a standard management process, introducing modern construction techniques such as modular construction [49], and applying computer-integrated manufacturing to construction, such as building information modelling (BIM) [48].
In Figure 2, owner satisfaction is described by five indicators ranked by their regression weights (in parentheses) in descending order, as follows: work productivity (0.47), project members (0.42), flexibility (0.41), sharing objectives (0.30), and owner participation (0.23). Obviously, the largest weight is placed on work productivity, which usually relates to the project objectives in terms of cost, time, and the quality of products/facilities. This is perhaps because a lower cost of construction projects increases the benefit to owners, securing their financial viability. A shortened construction time also offers opportunities for owners to receive early benefits from completed products/facilities. In addition, high productivity in terms of quality possibly reduces accidents and work amendments, accelerating the project progress and saving costs to owners. Kärnä et al. [6] suggests that work productivity such as that measured by the quality of work and production processes can establish good customer relationships. Thus, contractors should, for example, acquire advanced-technology equipment/machinery to improve the efficiency of construction operations (i.e., the relationships among an array of equipment/machinery) or develop an optimum design of construction operations to increase the work productivity. Owners, in turn, can boost sustainable consumption by engaging only contractors who implement sustainable construction. The project members indicator has the second largest weight. A possible reason is that during the construction processes, the construction team should have a range of abilities and knowledge to solve problems involving, e.g., green resource allocation, or conflict with stakeholders, and to communicate conflict resolution and problem-solving procedures with owners. Their knowledge and abilities help ensure the success of construction projects. Regarding the flexibility indicator, most construction projects operate under ambiguous and changing circumstances. A contractor has to be flexible to handle ambiguity and change in terms of changing orders from owners during the construction processes, such as changes in building layout, functions, or materials. If a contractor does not provide flexibility in responding to changes that owners request, the contractor may have less chance of obtaining future projects.
The indicators reflecting community satisfaction, which are shown with their regression weights in parentheses, are site organization (0.57), health and safety (0.52), communication channels (0.52), environment (0.47), design (0.43), community property (0.39), and accessibility (0.29), as shown in Figure 2. It can be seen in the figure that site organization has the highest weight, which, here, refers to the project-site layout and design of construction operations related to the equipment/machinery employed. The proper layout and design lead to the ease of internal logistics within the project site (as required by, for example, the providers of materials, supplies, utilities, and the work force) and of safety arrangements for a fleet of equipment/machinery. Then, well-planned logistics and rational safety arrangements help reduce traffic problems, accidents, energy consumption, noise, vibration, dust, and pollutant emissions into the surrounding communities. Atanda [1] also mentions that project-site protection is necessary to decrease pollution. Of interest is the health and safety indicator because it affects the well-being of the communities. In addition, two major costs involve this indicator: (1) economic costs such as compensation and accident cost and (2) social costs such as emotional injury and long-term emotional impact. Different contractors may have different methods for dealing with health and safety issues due to the unique nature of a construction project and their policies. However, the issues that should be considered are, for example, (1) hygiene at the workforce camp and construction site because the hygiene activities help prevent air pollution and disease spread, and (2) construction safety plans and controls for reducing accident impacts on the community. Another interest is communication channels. The more types of communication channel provided by contractors, the more opportunity there is for other stakeholders to communicate with them. This helps the contractors recognize various problems stemming from the construction projects. The contractors can early prevent or reduce the problems, therefore increasing good community relationships.
As in other countries, in the Thai construction industry, contractors earn their profits by performing construction projects under binding contracts with owners. The contractors have to bid for the contracts of construction projects in a competitive bidding situation. This bidding is vital for contractors because the bid itself largely determines the profit (or loss) from the construction projects. Accordingly, the contractors can increase their competitive advantage by, for example, satisfying owners and communities using multilevel strategies in order to enhance the probability of winning contracts. Thus, the results of this study can be possibly applied to contractors in similar competitive bidding situations in other countries.
6. Conclusions
Among the three bottom lines of sustainable development (economic, environmental, and social), the least attention has been paid to the social dimension, due to the difficulty of measuring social sustainability. Each region, industry, and society measures social sustainability differently. This study adopts owner and community satisfaction as a social sustainability dimension for sustainable construction. In the construction industry, multilevel strategies of contractors play a key role in satisfying owners and communities through delivering sustainable products/facilities. However, the influences of multilevel strategies on owner and community satisfaction have not been analyzed, presenting a knowledge gap. To address this gap, the objective of this study was to analyze such influences via validation of an SEM. The results show that owner satisfaction is indirectly influenced by corporate and business strategies. Similarly, corporate and business strategies indirectly influence community satisfaction. Only the functional strategy has a direct influence on both owner and community satisfaction. As the measurement models of multilevel strategies, parenting, cooperation, and equipment/machinery substrategies obtain the highest weights within the management levels of corporation, business, and function, respectively. Regarding the indicators of owner and community satisfaction, work productivity and site organization have the highest weights, respectively.
The findings of this study significantly contribute to exploring the influences among corporate, business, and functional strategies on owner and community satisfaction, providing more insight for contractors to use in investing in each strategic level. The resulting weights of the substrategies within each multilevel strategy render a guideline for contractors to prioritize their available resource distributed among these substrategies to properly increase owner and community satisfaction by adjusting their construction processes towards social sustainability. In addition, there is variation of the owner and community satisfaction during construction processes. The weights of the owner and community satisfaction indicators help contractors to focus on the heaviest-weighed indicators to perform sustainable construction activities to promote owner and community satisfaction.
Although the influences between multilevel strategies and owner/community satisfaction are initially analyzed in this study, several limitations should be recognized. First, the SEM was established to determine these influences using the data gathered from the Thai construction industry. Data from different geographical business areas in other countries or regions may yield different results. As such, further studies need to be conducted to render a better understanding of the influences derived from different geographical data sources. Second, due to the small number of large and well-known contractors from the ASEAN Construction Federation’s Thailand Construction Handbook in this study, other sources of contractor lists may be added to expand the short-listed contractors, and thus increasing the population number. This leads to wider investigation into the Thai construction industry, which could be another direction for further research.
Author Contributions
Conceptualization, K.K. and J.P.; Data curation, K.K. and J.P.; Formal analysis, K.K. and J.P.; Investigation, K.K. and J.P.; Methodology, K.K. and J.P.; Writing—original draft, K.K. and J.P.; Writing—review & editing, K.K. and J.P. All authors have read and agreed to the published version of the manuscript.
Funding
The publication cost was supported by Faculty of Engineering, King Mongkut’s Institute of Technology Ladkrabang.
Conflicts of Interest
The authors declare no conflict of interest.
References
- Atanda, J.O. Developing a social sustainability assessment framework. Sustain. Cities Soc. 2019, 44, 237–252. [Google Scholar] [CrossRef]
- Wheelen, L.T.; Hunger, J.D.; Hoffman, A.N.; Bamford, C.E. Concepts in Strategic Management and Business Policy; Pearson Education limited: London, UK, 2015. [Google Scholar]
- Bal, M.; Bryde, D.; Fearon, D.; Ochieng, E. Stakeholder engagement: Achieving sustainability in the construction sector. Sustainability 2013, 6, 695–710. [Google Scholar] [CrossRef] [Green Version]
- Cheng, J.; Proverbs, D.G. The impact of strategic decisions on construction client satisfaction. In Proceedings of the 20th Annual ARCOM Conference, Edinburgh, UK, 1–3 September 2004; Volume 2, pp. 931–938. [Google Scholar]
- Valdes-Vasquez, R.; Klotz, L.E. Sustainability considerations during planning and design: Framework of processes for construction projects. J. Constr. Eng. Manag. 2013, 139, 80–89. [Google Scholar] [CrossRef]
- Kärnä, S.; Junnonen, J.-M.; Sorvala, V.-M. Modelling structure of customer satisfaction with construction. J. Facil. Manag. 2009, 7, 111–127. [Google Scholar] [CrossRef]
- Karji, A.; Woldesenbet, A.; Khanzadi, M.; Tafazzoli, M. Assessment of social sustainability indicators in mass housing construction: A case study of Mehr housing project. Sustain. Cities Soc. 2019, 50, 101697. [Google Scholar] [CrossRef]
- Mahmoudi, R.; Shetab-Boushehri, S.; Hejazi, S.R.; Emrouznejad, A. Determining the relative importance of sustainability evaluation criteria of urban transportation network. Sustain. Cities Soc. 2019, 47, 101493. [Google Scholar] [CrossRef] [Green Version]
- Porter, M.E. Competitive Strategy: Techniques for Analyzing Industries and Firms; Free Press: New York, NY, USA, 1980. [Google Scholar]
- Salimian, H.; Khalili, S.; Nazemi, J.; Alborzi, M. Alignment in the organization’s strategy window (concentration on business strategy and operations strategy). Afr. J. Bus. Manag. 2012, 6, 12016–12022. [Google Scholar] [CrossRef] [Green Version]
- Ho, P.H.K. Analysis of competitive environments, business strategies, and performance in Hong Kong’s construction industry. J. Manag. Eng. 2016, 32, 04015044. [Google Scholar] [CrossRef]
- Johnson, G.; Scholes, K. Exploring Corporate Strategy: Text and Cases; Prentice Hall: Hertfordshire, UK, 1989. [Google Scholar]
- McGEE, J.E.; Dowling, M.J.; Megginson, W.L. Cooperative strategy and new venture performance: The role of business strategy and management experience. J. Strateg. Manag. 1995, 16, 565–580. [Google Scholar] [CrossRef]
- Ghodrati, N.; Yiu, T.W.; Wilkinson, S.; Shahbazpour, M. Role of management strategies in improving labor productivity in general construction projects in New Zealand: Managerial perspective. J. Manag. Eng. 2018, 34, 04018035. [Google Scholar] [CrossRef]
- Shadan, K. Construction Project Management Handbook; Federal Transit Administration: Washington, DC, USA, 2012. [Google Scholar]
- Radhakrishnan, M.; Kenzhegulova, I.; Eloffy, M.G.; Ibrahim, W.A. Development of context specific sustainability criteria for selection of plant species for green urban infrastructure: The case of Singapore. Sustain. Prod. Consum. 2019, 20, 316–325. [Google Scholar] [CrossRef]
- Mousa, A.; Mahgoub, M.; Hussein, M. Light weight concrete in America: Presence and challenges. Sustain. Prod. Consum. 2018, 15, 131–144. [Google Scholar] [CrossRef]
- Benton, W.C.; McHenry, L.F. Construction Purchasing & Supply Chain Management; McGraw-Hill: New York, NY, USA, 2010. [Google Scholar]
- Walker, D.; Hampson, K. Enterprise networks, partnering and alliancing. In Procurement Strategies: A Relationship-Based Approach; Walker, D., Hampson, K., Eds.; Blackwell Science: Oxford, UK, 2003; pp. 30–70. [Google Scholar]
- Trendowicz, A.; Jeffery, R. Software Project Effort Estimation: Basic Estimation Strategies; Springer: Cham, Switzerland, 2014. [Google Scholar]
- Tatari, O.; Skibniewski, M. Integrated agent-based construction equipment management: Conceptual design. J. Civil Eng. Manag. 2006, 12, 231–236. [Google Scholar] [CrossRef]
- Samee, K.; Pongpeng, J. Structural equation model for construction equipment management affecting project and corporate performance. KSCE J. Civil Eng. 2016, 20, 1642–1656. [Google Scholar] [CrossRef]
- Ibn-Homaid, N.T.; Tijani, I.A. Financial analysis of a construction company in Saudi Arabia. Int. J. Constr. Eng. Manag. 2015, 4, 80–86. [Google Scholar] [CrossRef]
- Eckles, R.W. Business Marketing Management: Marketing of Business Products and Service; Prentice-Hall: New Jersey, NJ, USA, 1990. [Google Scholar]
- Raadt, B.V.D.; Bonnet, M.; Schouten, S.; Vliet, H.V. The relation between EA effectiveness and stakeholder satisfaction. J. Syst. Softw. 2010, 83, 1954–1969. [Google Scholar] [CrossRef]
- Akadiri, P.O.; Chinyio, E.A.; Olomolaiye, P.O. Design of a sustainable building: A conceptual framework for implementing sustainability in the building sector. Building 2012, 2, 126–152. [Google Scholar] [CrossRef] [Green Version]
- Ahmad, T.; Thaheem, M.J. Developing a residential building-related social sustainability assessment framework and its implications for BIM. Sustain. Cities Soc. 2017, 28, 1–15. [Google Scholar] [CrossRef]
- Nikolaou, L.E.; Tsalis, T.A.; Evangelinos, K.I. A frame work to measure corporate sustainability performance: A strong sustainability-based view of firm. Sustain. Prod. Consum. 2019, 18, 1–18. [Google Scholar] [CrossRef]
- El-Diraby, T.; Shalaby, A.; Hosseini, M. Linking social, sematic and sentiment analyses to support modeling transit customers’ satisfaction: Towards formal study of opinion dynamics. Sustain. Cities Soc. 2019, 49, 101578. [Google Scholar] [CrossRef]
- Wang, Y.; Han, Q.; de Vries, B.; Zuo, J. How the public reacts to social impacts in construction projects? A structural equation modeling study. Int. J. Proj. Manag. 2016, 34, 1433–1448. [Google Scholar] [CrossRef]
- Mesarović, M.D.; Macko, D.; Takahara, Y. Theory of Hierarchical, Multilevel, Systems; Academic Press: New York, NY, USA, 1970. [Google Scholar]
- Wooldridge, B.; Schmid, T.; Floyd, S. The middle management perspective on strategy process. J. Manag. 2016, 34, 1190–1221. [Google Scholar] [CrossRef]
- Thai Contractors Association under H.M. the King’s Patronage. Thailand Construction Handbook; ASEAN Construction Federation: Bangkok, Thailand, 2015. [Google Scholar]
- Babbie, E. The Practice of Social Research; Wadsworth Publishing: Belmont, CA, USA, 1989. [Google Scholar]
- Tavakol, M.; Dennick, R. Making sense of Cronbach’s alpha. Int. J. Med. Educ. 2011, 2, 53–55. [Google Scholar] [CrossRef] [PubMed]
- Dunn, S.C.; Seaker, R.F.; Waller, M.A. Latent variables in business logistics research: Scale development and validation. J. Bus. Logist. 1994, 15, 145–172. [Google Scholar]
- Hair, J.F., Jr.; Black, W.C.; Babin, B.J.; Anderson, R.E. Multivariate Data Analysis, 7th ed.; Person Prentice Hall: Harlow, UK, 2010. [Google Scholar]
- Kline, R.B. Principles and Practice of Structural Equation Modeling; Guilford Press: New York, NY, USA, 2011. [Google Scholar]
- Bollen, K.A. Total, direct, and indirect effects in structural equation model. Sociol. Methodol. 1987, 17, 37–69. [Google Scholar] [CrossRef] [Green Version]
- Fornell, C.; Larcker, D.F. Evaluating Structural Equation Models with Unobservable Variables and Measurement Error. J. Mark. Res. 1981, 18, 39–50. [Google Scholar] [CrossRef]
- Haverila, M.J.; Fehr, K. The impact of product superiority on customer satisfaction in project management. Int. J. Proj. Manag. 2016, 34, 570–583. [Google Scholar] [CrossRef]
- Kruehler, M.; Pidun, U.; Rubner, H. How to assess the corporate parenting strategy? A conceptual answer. J. Bus. Strategy 2012, 33, 4–17. [Google Scholar] [CrossRef] [Green Version]
- Ling, F.Y.Y.; Li, S.; Low, S.P.; Ofori, G. Mathematical models for predicting Chinese A/E/C firms’ competitiveness. Autom. Constr. 2012, 24, 40–51. [Google Scholar] [CrossRef]
- Isik, Z.; Arditi, D.; Dilmen, I.; Birgonul, M.T. The role of exogenous factors in the strategic performance of construction companies. Eng. Constr. Archit. Manag. 2010, 17, 119–134. [Google Scholar] [CrossRef]
- Zhang, Q.; Tang, W.; Lui, J.; Duffirl, C.F.; Hui, F.K.P.; Zhang, L.; Zhang, X. Improvement design performance by alliance between contractor and designers in international hydropower EPC project from the perspective of Chinese construction companies. Sustainability 2018, 10, 1171. [Google Scholar] [CrossRef] [Green Version]
- Ho, S.P.; Lin, Y.H.; Chu, W.; Wu, H.L. Model for organizational governance structure choices in construction joint ventures. J. Constr. Eng. Manag. 2009, 135, 518–530. [Google Scholar] [CrossRef]
- Mokhlesian, S. How do contractor select suppliers for greener construction project? The case of three Swedish companies. Sustainability 2014, 6, 4133–4151. [Google Scholar] [CrossRef] [Green Version]
- Gong, P.; Zeng, N.; Ye, K.; König, M. An empirical study on the acceptance of 4D BIM in EPC project in Chaina. Sustainability 2019, 11, 1316. [Google Scholar] [CrossRef] [Green Version]
- Kyjaková, L.; Mandičák, T.; Mesároš, P. Modern methods of constructions and their components. J. Eng. Archit. 2014, 2, 27–35. [Google Scholar]
Figure 1.
Conceptual framework of the study.

Figure 2.
Results of the SEM analysis showing the influences of the multilevel strategies on owner and community satisfaction.
Figure 2.
Results of the SEM analysis showing the influences of the multilevel strategies on owner and community satisfaction.


Table 1.
Experts’ and respondents’ profiles.
| Expert Profile | Frequency | % |
|---|---|---|
| Construction senior manager with more than 20 years of experience in construction projects and strategic planning | 6 | - |
| Respondent profile | Frequency | % |
| Position | ||
| Construction senior manager | 14 | 6.22 |
| Construction project manager | 91 | 40.44 |
| Civil engineer | 120 | 53.34 |
| Experience | ||
| Less than 5 years | 15 | 6.67 |
| 5–10 years | 28 | 12.44 |
| 10–20 years | 100 | 44.44 |
| Over 20 years | 82 | 36.45 |
| Work characteristics | ||
| Strategic management | 21 | 9.34 |
| Construction project management | 175 | 77.78 |
| Construction control | 29 | 12.88 |
| Range of average project value per year | ||
| 0.3–3 million USD | 22 | 9.78 |
| 3–30 million USD | 50 | 22.22 |
| Over 30 million USD | 153 | 68.00 |
| Project characteristics | ||
| Infrastructure | 135 | 60.00 |
| Low-rise building (< than 8 stories) | 9 | 4.00 |
| High-rise building (> than 8 stories) | 81 | 36.00 |
| Total employees | ||
| 500–1000 employees | 33 | 14.67 |
| Over 1000 employees | 192 | 85.33 |
Table 2.
Criteria and theory of the values of goodness-of-fit (GoF) appraisal for measurement models.
Table 2.
Criteria and theory of the values of goodness-of-fit (GoF) appraisal for measurement models.
| Criteria Index | Recommended Criteria Values | Supporting Theory/Comments | GoF Values of Measurement Models | ||||
|---|---|---|---|---|---|---|---|
| Corporate Strategies (CS) | Business Strategies (BS) | Functional Strategies (FS) | Owner Satisfaction (OwS) | Community Satisfaction (CoS) | |||
| Chi-square (X2) | 0.05 < p ≤ 1.00 | Hair et al. [37] | 0.531 | 0.552 | 0.725 | 0.457 | 0.467 |
| Relative X2 (χ2/df) | 0 ≤ χ2=df ≤ 2 | Kline [38] | 0.374 | 0.354 | 0.759 | 0.935 | 0.984 |
| Goodness of Fit Index (GFI) | 0.09 ≤ GFI ≤ 1.00 | Hair et al. [37] | 0.994 | 0.999 | 0.988 | 0.992 | 0.983 |
| Root Mean Square Error of Approximation (RMSEA) | 0 ≤ RMSEA ≤ 0.08 | Hair et al. [37] | 0.000 | 0.000 | 0.000 | 0.000 | 0.000 |
| Comparative Fit Index (CFI) | 0.09 ≤ CFI ≤ 1.00 | Hair et al. [37] | 1.000 | 1.000 | 1.000 | 1.000 | 1.000 |
| Incremental Fit Index (IFI) | 0.9 ≤ IFI ≤ 1.00 | Bollen [39] | 1.000 | 1.000 | 1.000 | 1.000 | 1.000 |
| Tucker-Lewis Index (TLI) | 0.9 ≤ TLI ≤ 1.00 | Kline [38] | 1.000 | 1.000 | 1.000 | 1.000 | 1.000 |
| Results | passed | passed | passed | passed | passed | ||
Table 3.
Correlation coefficients between latent variables (under the bold diagonal) and the average variance extracted (AVE).
Table 3.
Correlation coefficients between latent variables (under the bold diagonal) and the average variance extracted (AVE).
| Latent Variables | CS | BS | FS | OwS | CoS |
|---|---|---|---|---|---|
| Corporate strategies (CS) | 1.00 | ||||
| Business strategies (BS) | 0.812 | 1.00 | |||
| Functional strategies (FS) | 0.794 | 0.812 | 1.00 | ||
| Owner satisfaction (OwS) | 0.764 | 0.781 | 0.815 | 1.00 | |
| Community satisfaction (CoS) | 0.604 | 0.618 | 0.665 | 0.558 | 1.00 |
| ρV (AVE) | 0.685 | 0.676 | 0.680 | 0.413 | |
| 0.828 | 0.822 | 0.824 | 0.642 |
Table 4.
Summary of latent and observed variables, relationships, and their associated theory.
| Latent Variables | Observed Variables (27 items) | Knowledge Base (Theory) |
|---|---|---|
| Corporate Strategies (CS) | Direction (CSD) Portfolio (CSPo) Parenting (CSPa) | Wheelen et al. [2] |
| Business Strategies (BS) | Cost Leadership (BSCl) Differentiation (BSD) Market Focus (BSM) Cooperation (BSC) | Porter [9], McGEE et al. [13] |
| Functional Strategies (FS) | Design (FSD) Construction (FSCo) Contract (FSC) Procurement (FSP) Estimating (FSE) Equipment/Machinery (FSEm) Financial (FSF) Public relations (FSPr) | Atanda [1], Karji [7], Ghodrati et al. [14], Shadan [15], Benton [18], Walker and Hampson [19], Trendowicz [20], Tatari and Skibniewski [21], Samee and Pongpeng [22], Ibn-Homaid [23], Eckles [24] |
| Owner Satisfaction (OwS) | Work Productivity (OwSW) Flexibility (OwSF) Owner Participation (OwSP) Project Members (OwSM) Project Goals (OwSG) | Kärnä et al. [6], Raadt et al. [25] |
| Community Satisfaction (CoS) | Accessibility (CoSA) Site Organization (CoSO) Health & Safety (CoSH) Environment (CoE) Community Property (CoSCp) Communication Channel (CoSC) Design (CoSD) | Atanda [1], Valdes-Vasquez and Klotz [5], Kärnä et al. [6], Karji [7], Mahmoudi et al. [8], Akadiri [27], Nikolaou [29], Wang et al. [30] |
| Multilevel strategy relationships | Salimian et al. [10], Mesarović et al. [31], Wooldridge et al. [32] | |
| Relationships from FS to OwS and Cos | Cheng and Proverbs [4], Valdes-Vasquez and Klotz [5], Wang et al. [30] | |
Table 5.
Criteria and theory of the values of GoF appraisal for the hypothesized structural equation model (SEM).
Table 5.
Criteria and theory of the values of GoF appraisal for the hypothesized structural equation model (SEM).
| Criteria Index | Recommended Criteria Values | SEM’s GoF Values | Results | Supporting Theory/Comments |
|---|---|---|---|---|
| Chi-square (X2) | 0.05 < p ≤ 1.00 | 0.055 | passed | Hair et al. [37] |
| Relative X2 (χ2/df) | 0 ≤ χ2/df ≤ 2 | 1.138 | passed | Kline [38] |
| Goodness of Fit Index (GFI) | 0.09 ≤ GFI ≤ 1.00 | 0.907 | passed | Hair et al. [37] |
| Root Mean Square Error of Approximation (RMSEA) | 0 ≤ RMSEA ≤ 0.08 | 0.025 | passed | Hair et al. [37] |
| Comparative Fit Index (CFI) | 0.09 ≤ CFI ≤ 1.00 | 0.963 | passed | Hair et al. [37] |
| Incremental Fit Index (IFI) | 0.9 ≤ IFI ≤ 1.00 | 0.965 | passed | Bollen [39] |
| Tucker-Lewis Index (TLI) | 0.9 ≤ TLI ≤ 1.00 | 0.955 | passed | Kline [38] |
| Cronbach’s Alpha | >0.70 | 0.833 | passed | Tavakol and Dennick [35] |
Table 6.
Standard coefficients of influence in the structural equation model of latent variables.
| Latent Variables | Influence | Latent Variables | ||
|---|---|---|---|---|
| CS | BS | FS | ||
| Corporate Strategies (CS) | DI | |||
| II | ||||
| TI | ||||
| Business Strategies (BS) (R2 = 0.96) | DI | 0.98 * | ||
| II | - | |||
| TI | 0.98 * | |||
| Functional Strategies (FS) (R2 = 0.87) | DI | - | 0.93 * | |
| II | 0.91 * | - | ||
| TI | 0.91 * | 0.93 * | ||
| Owner Satisfaction (OwS) (R2 = 0.71) | DI | - | - | 0.84 * |
| II | 0.76 * | 0.78 * | - | |
| TI | 0.76 * | 0.78 * | 0.84 * | |
| Community Satisfaction (CoS) (R2 = 0.44) | DI | - | - | 0.66 * |
| II | 0.60 * | 0.61 * | - | |
| TI | 0.60 * | 0.61 * | 0.66 * | |
* Sig. ≤ 0.01, DI = direct influence, II = indirect influence, and TI = total influence.
© 2020 by the authors. Licensee MDPI, Basel, Switzerland. This article is an open access article distributed under the terms and conditions of the Creative Commons Attribution (CC BY) license (http://creativecommons.org/licenses/by/4.0/).
Share and Cite
MDPI and ACS Style
Kawesittisankhun, K.; Pongpeng, J. Social Sustainability: Satisfying Owners and Communities by Multilevel Strategies of Contractors. Sustainability 2020, 12, 2131. https://0-doi-org.brum.beds.ac.uk/10.3390/su12052131
AMA Style
Kawesittisankhun K, Pongpeng J. Social Sustainability: Satisfying Owners and Communities by Multilevel Strategies of Contractors. Sustainability. 2020; 12(5):2131. https://0-doi-org.brum.beds.ac.uk/10.3390/su12052131
Chicago/Turabian StyleKawesittisankhun, Kittipos, and Jakrapong Pongpeng. 2020. "Social Sustainability: Satisfying Owners and Communities by Multilevel Strategies of Contractors" Sustainability 12, no. 5: 2131. https://0-doi-org.brum.beds.ac.uk/10.3390/su12052131
Note that from the first issue of 2016, this journal uses article numbers instead of page numbers. See further details here.