Optimization Design of X-ray Conveyer Belt Length for Subway Security Check Systems in Beijing, China


1
Beijing Key Laboratory of Traffic Engineering, College of Metropolitan Transportation, Beijing University of Technology, Beijing 100124, China
2
School of Civil Engineering, Central South University, Changsha 410075, China
*
Author to whom correspondence should be addressed.
Sustainability 2020, 12(5), 2133; https://0-doi-org.brum.beds.ac.uk/10.3390/su12052133
Submission received: 9 February 2020
/
Revised: 3 March 2020
/
Accepted: 4 March 2020
/
Published: 10 March 2020
Abstract
:The frequent terrorist attacks in subways has dramatically increased the necessity and importance of security check systems (SCSs). The implementation of a SCS in China has successfully eliminated lots of potential safety hazards. However, the excessive waiting time due to the SCS is also an issue. SCS efficiency is greatly affected by the length of the conveyer belt of the X-ray machine (CBXM). A scheme for optimizing the CBXM length to accommodate different passenger flows is proposed in this paper. A modeling framework is developed for associating the CBXM length with the queuing waiting time based on a M/M/1/N queuing model. The optimal scheme of CBXM length calculated from the model demonstrates that the passenger queuing time is saved by 15.7%, 16.0%, and 23.3% with the passenger arrival rate of 4000, 5000, and 6000, respectively, greatly reducing queuing crowdedness. The scheme can be used to select X-ray machines for subway stations by their passenger arrival rates. In addition, the findings of this paper could be a crucial supplement and perfect the design code of subway SCSs.
1. Introduction
The subway is the most widely used transportation mode in Beijing, the capital of China and a supercity with over 20 million people. By the end of 2017, Beijing had built a huge subway network with 19 lines and 574 km of route [1]. With over 10 million daily ridership [1], security is critical for the subway system, especially considering the globally increasing terrorist activities and violent crime incidents targeting subway systems [2]. Some recent events include the 1980 Bologna railway station bombing, 1987 Barcelona parking lot bombing, the 1998 Omagh car bombing, the 2004 Madrid train bombings, the 2005 London underground and bus bombings, the 2011 Oslo bombings, and the 2016 Brussels subway station bombing [3,4]. Globally, eight subway bombings have occurred leading to nearly 90 deaths since 2010 [5]. These events show the vulnerability of subways and demonstrate the significance and necessity of intensifying subway security checks.
Among a variety of measures, many countries have enhanced their subway security level. In China, 29 cities have been deploying security-check systems (SCSs) at subway lobbies since 2008. Cities like Beijing and Shanghai have also released related regulations specifically for subway SCS management. Since its implementation, Beijing Subway has safely inspected more than 7.9 billion passengers and more than 8.1 billion items and seized more than 1.02 million pieces of dangerous goods [6]. It has effectively played a role in gate prevention and shock warning and eliminating a large number of safety hazards for the safe operation of Beijing Subway. The successful practice of SCS in China has substantiated that the SCS is one of the most effective means to protect the subway from various threats.
The SCS was derived from the aviation industry [7]. Aviation safety has caught the attention of governments and the public since the September 11 attack [8,9,10]. As a response, the Traffic Security Administration (TSA) was established in the United States (U.S.) for airport passenger and bag security checks [11]. While the strict implementation of the airport SCS largely protects the safety of passengers and their property, it can also bring about much delay and even cause opposition and conflict between passengers and security operators. In the past ten years, a lot of work has been done to improve SCS efficiency while maintaining screening accuracy. There are two methods to screen passengers for the SCS: (i) uniform screening and (ii) risk-based screening [12]. The former is proved to be neither economically nor logistically feasible as it involves screening all passengers with an identical level of intensity. Thus, a risk-based screening strategy was implemented, whereby passenger and baggage screening procedures can be classified in two basic ways: selectees or non-selectees [13], based on their perceived risk levels [14,15]. A simulation-based selectee lane queuing design framework was proposed to study how to effectively utilize the selectee lane resource [11]. Additionally, a resulting optimal assignment policy was formulated to increase security and throughput by efficiently and effectively utilizing available screening resources [12]. Skorupski and Uchroński [16] explored the subjective factors that influence the effectiveness of SCS and took human factors into account in the screening process. Later, Skorupski and Uchroński [17] proposed a quantitative method for evaluating the effectiveness of walk-through metal detectors that were demonstrated to be very effective at assisting airport managers in selecting and configuring the equipment used at airport security screening checkpoints. Such viewpoints and measures have enhanced airport security efficiency to varying degrees.
Compared with the airport SCS, the subway SCS has significantly different characteristics [18]:
- Passengers are denser at subways than airports during the morning and afternoon peak hours. In addition, due to the space limitation, usually only one or two SCS lines can be deployed at each entrance of a subway station, which is much fewer than those in airports, causing very long queues during rush hours.
- The configurations and layouts of SCS facilities are often neglected in subway station designs due to lack of corresponding theoretical and regulatory support, resulting in a reduced passing capacity.
- The aviation SCS usually has uniform security-check requirements and inspection processes, unlike the subway SCS, which often varies a lot among stations and cities. There are no uniform norms to ensure the efficiency and safety of subway security-check operations.
Hence, adopting the full aviation screening mode in the subway would result in significant delays during rush hours, and thus is unrealistic. Therefore, the subway SCS must find a method to deal with periodical passenger flocks. However, few relevant studies have focused on the subway SCS. Peng et al. [19] analyzed the impact of passenger behaviors on SCS speed. Xu et al. [20] established simulation models to determine the security equipment layout. Two types (Type-A and Type-B) of paced inspection processes are designed for Beijing subway two-stage SCS [18]. While the design can improve the performance of the security-check machine, passengers experience in the SCS was ignored in the paper.
The temporary measure of the subway SCS has been retained since the 2008 Beijing Olympic Games for maintaining the safety operation environment. This obligatory measure further increased the burden of the SCS and average waiting time for passengers could reach 20 minutes during peak hour [6], which caused serious congestion in the subway. X-ray inspection is a key bottleneck for passengers to during security checks according to actual experiences. Owing to a lack of uniform regulation in the size of the X-ray machine, the length of CBXM varies in stations or cities. Because of the arbitrary length of the conveyer belt of the X-ray machine (CBXM), it is a common phenomenon that passengers with larger belongings generally occupy longer inspection times in large hub subway stations, which causes congestion in waiting areas, and this phenomenon not only affects the efficiency of security checks, but also makes passengers feel unpleasant and stressed. Furthermore, the random selection of X-ray machines also increases the operating cost if the screening capacity fails to match the arrival rate. Moreover, crowding in security-check waiting passageways is a potential risk from a security standpoint.
Hence, optimizing the length of the CBXM to eliminate SCS bottleneck and support a more efficient SCS is crucial in this research. The rest of the paper is organized as follows. In Section 2.1, a model framework for optimizing CBXM length is developed based on the M/M/1/N queuing system(M/M/1/N is a queuing model with passenger arrival following a Poisson distribution, security check output following a negative exponential distribution, one security check gate and the system capacity is N). Then, the underlying relationship between the CBXM length and the queuing waiting time is explored to consummate the model in Section 2.3. Finally, field data collected from subway stations are used to validate the proposed model in Section 3. The findings from this study will be conducive for improving security-check efficiency and reducing queue delays in the subway SCS.
2. Optimization of CBXM Length
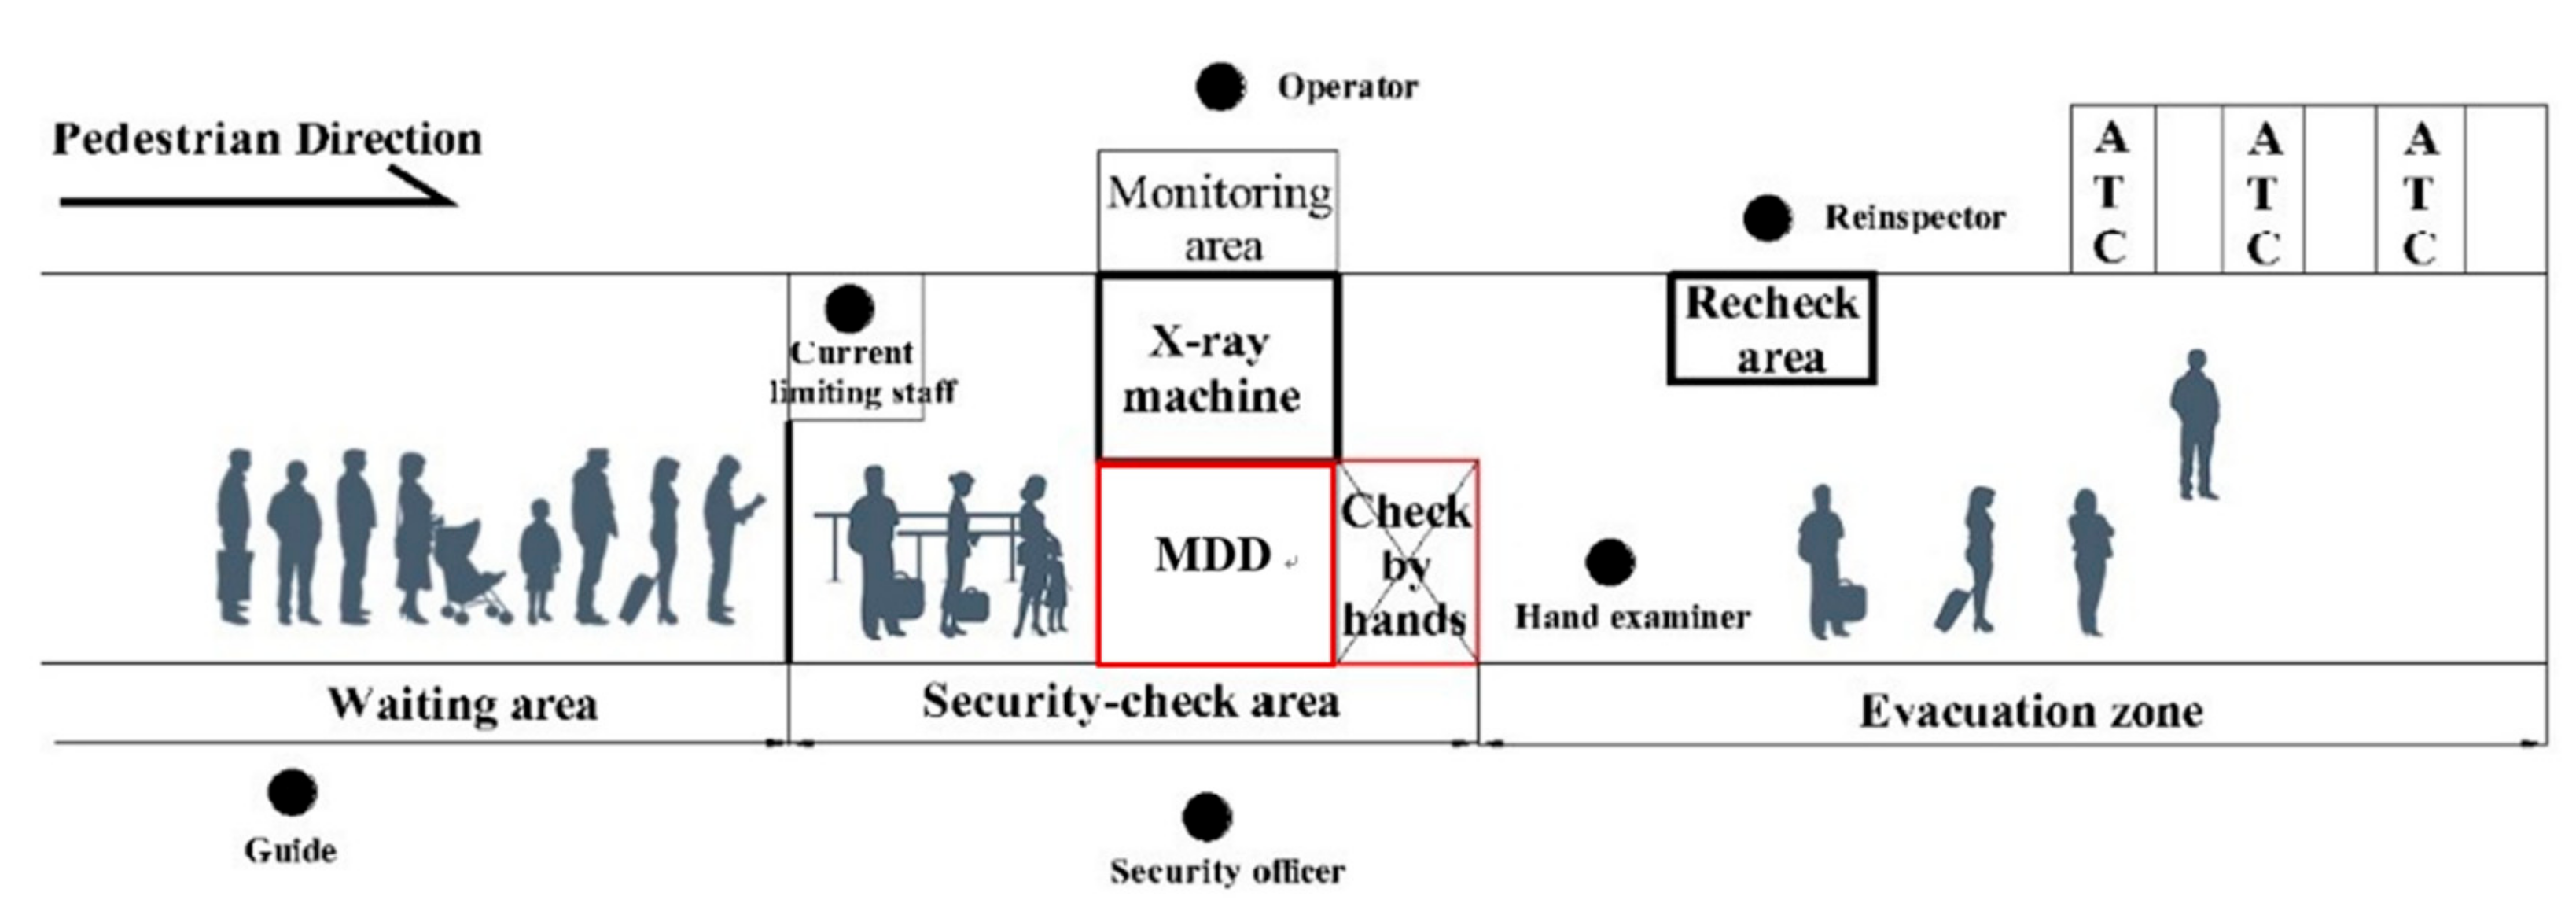
A SCS consists of three sections: waiting area, security-check area, and evacuation zone (Figure 1). The security-check area includes one metal detector door (MDD) for passenger check, one X-ray machine for bag check, and one hand wand for secondary inspection of passengers. The evacuation area includes a bag double-check table and an automatic ticket checker (ATC). A full security check procedure is shown as follows: after entering the station, passengers first wait in a line in the waiting area; then, after entering the security-check area, passengers leave their bags on the CBXM and receive a hand wand search after passing through the metal detector; if the bags are cleared, passengers can take them and enter the subway through the evacuation zone. Otherwise, the bags will be double-checked in the recheck area.
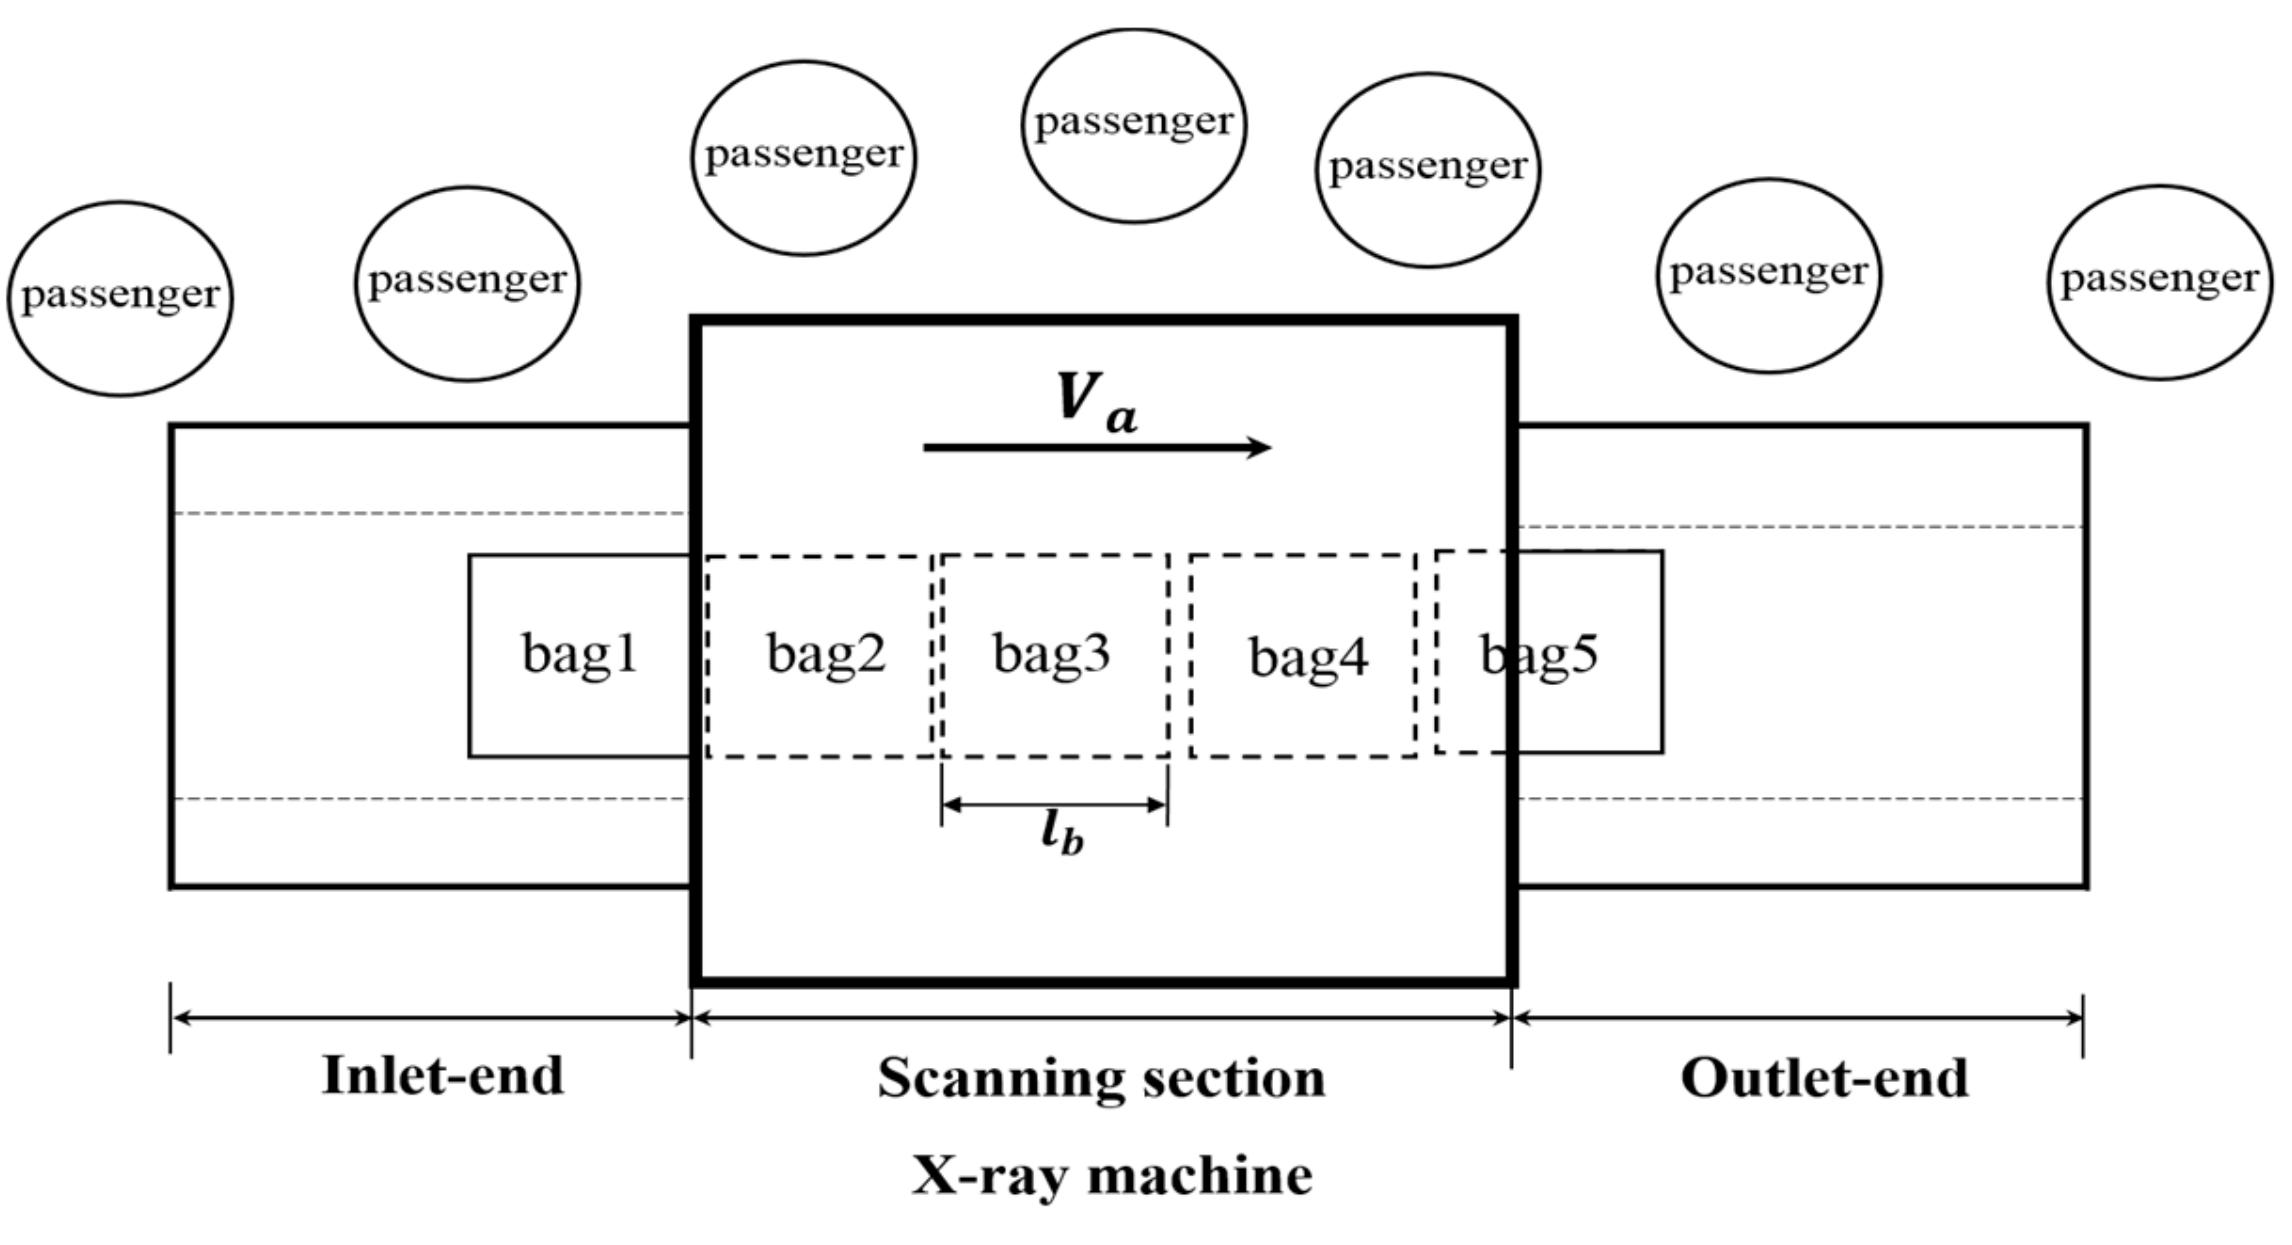
Based on the X-ray inspection process, the CBXM can also be divided into three sections (Figure 2): the inlet-end section, the scanning section, and the outlet-end section. It is found that the inlet-end and the outlet-end will generate delay for passengers if their length is designed improperly. For the inlet-end section, inadequate length of the CBXM brings up difficulties on placing bags, especially big ones, leading to more bag-placing time. In contrast, because most passengers’ walking speed (>0.3 m/s) is greater than the CBXM’s speed (0.22 m/s), passengers may need to wait a while for taking their bags at the exit section if the inlet-end is excessively long. As for the outlet-end section, bags may drop on the floor if it is too short, while a long outlet-end would lead to passenger confusion when taking their bags in a hurry, which would be exacerbated if passengers lose sight of their bags or pick up the wrong bag without the guidance of security personnel.
The queuing question for the SCS can be modeled as an M/M/1 system or M/M/S system [18,21], which however are not applicable to the queue system with limited capacity. In this case, since every subway SCS only includes one server with limited system capacity denoted by , an M/M/1/N queuing model is adopted.
2.1. M/M/1/N State-Dependence Security Queuing Model
A steady-state model, which assumes constant passenger arrival patterns for different time periods, is proposed in this section. Passengers are assumed to arrive at the waiting area following a Poisson process with arrival rate. In practice, for large subway hubs, trains arrive in succession, and the arrival times can be reasonably followed using a Poisson process. The bag check-in X-ray inspection includes leaving-bag, scanning-bag and retrieving-bag. In this research, the bag check time is assumed to be negatively exponentially distributed with rate.
In order to alleviate the tremendous pressure brought by the surge of large flow, Beijing subway has been implementing a current-limiting measure at some stations since February 2011. In the subway SCS, the measure of current limiting has been set before the waiting area as Figure 1 shows. The measure’s actualization in the SCS has two major roles that cannot be overlooked. Firstly, the security-check speed and passing capacity increase when the order of the security check is ensured. Secondly, the nonoccurrence of congestion at the security-check area leads to a large reduction in individual passing time, and the passenger average queuing time reduces correspondingly.
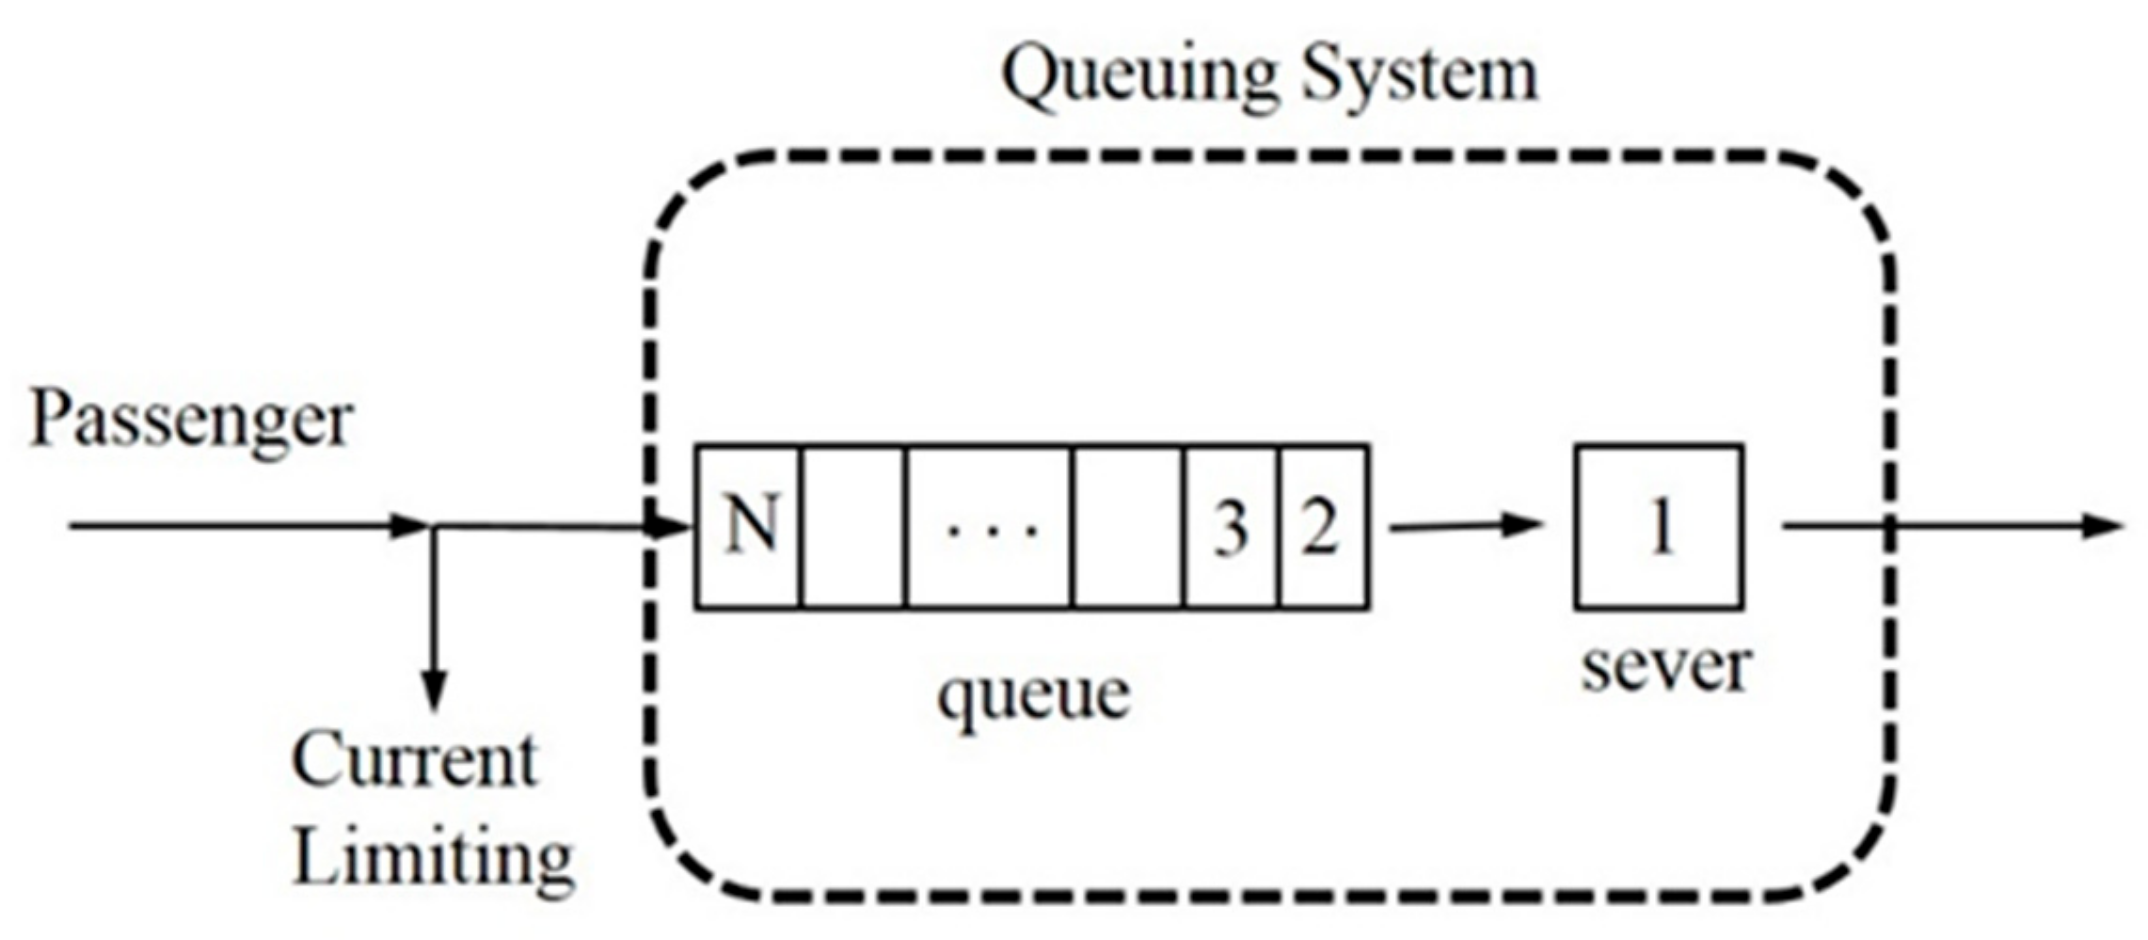
Affected by the measure of current limiting, the subway SCS capacity is limited. Passengers would not be allowed to enter into the security-check area until passengers in the security-check area are strictly fewer than , a predefined SCS capacity threshold value. Hence, it’s reasonable and convincing to derive that the M/M/1/N queuing model is more alternative and propitious than the M/M/1 system to describe the actual practice of the SCS in the Beijing subway. Let be the number of passengers currently in the security-check area. For jN, people at the waiting area could be allowed to the security-check area. Thus, the composition of the queuing system is depicted in Figure 3 on account of these settings.
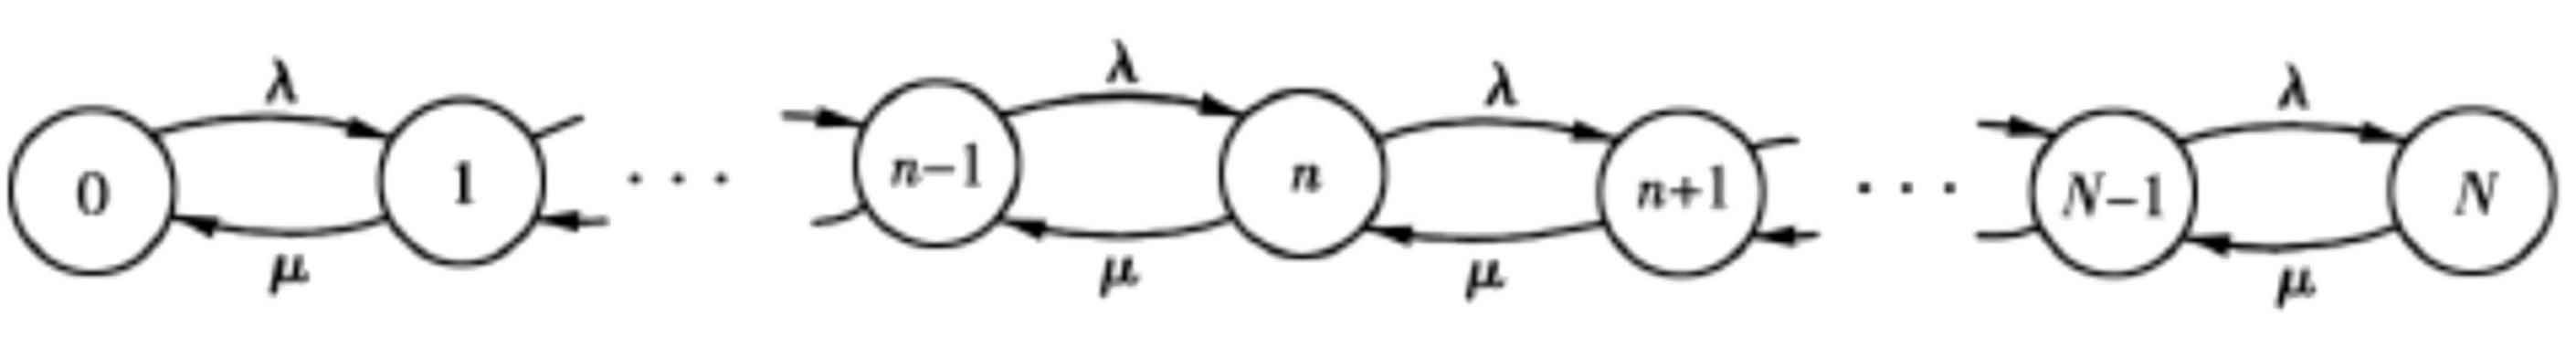
The M/M/1/N queuing system can be modeled as a continuous Markov chain with transition rates and. The transition diagram is shown in Figure 4 and the corresponding value, which is defined as the effective arrival rate, is calculated as follows:
Let be the limiting probability that there are passengers in the security-check area. Then the following set of balance equations from the transition diagram can be given:
where the system capacity could be calculated as follows:
Denote to be the density of pedestrians per unit area in the security-check area, which usually takes values of 4 or 5 [22]. It would be clearer to describe the length and width of the security-check area with and W, respectively, which is depicted in Figure 1.
Solving the above set of balance equations based on , we can get:
It should be noted, since the paper discuss the peak period of the subway, only the case of is considered.
The arrival rate will reach zero when the system is full (), and the effective arrival rate could be expressed by and or and as follows:
By denoting to be the average length of queuing system, it can be described as follows based on linking these equations with
As a result, the average queuing time of passengers in the system can be obtained by Equation (6) and Equation (7):
In the M/M/1/N model, the average queuing time is not just an important indicator to measure the efficiency of a queuing system, but a main SCS index for passenger satisfaction evaluation. As a consequence, what this study aims to achieve is shortening the average waiting time by optimizing the length of the CBXM.
2.2. Analysis of SCS Service Time
Corresponding to the three sections of the bag-check service process, the SCS service time can also be divided into three sections, that is, the leaving-bag time , the bag-scanning time and the taking-bag time .
The leaving-bag time and the taking-bag time are closely related to the characteristics of the passenger, therefore andcould be collected directly through manual counting. Since the bag-scanning process takes place on the inside of the X-ray machine, the bag-scanning time , which depends on the characteristics of X-ray machine, is not easy to obtain by manual recording directly. In the remainder of this subsection, the bag-scanning time is discussed in detail.
Bag-scanning means that the bag begins to enter the black box of the X-ray machine until it is sent to the exit of the black box. The X-ray inspection can provide a screening service for passengers’ bags in the continuous checking process or an unstoppable process. When passengers arrive, the passengers’ bags are placed on the conveyor belt in sequence, so bags can also be viewed as a single queue through the X-ray machine, as shown in Figure 2.
The bag-scanning time can be calculated through the next further analysis. The length of the CBXM is when a bag is located in the th section, =1,2,3. Here, the size of all bags, which is denoted by, is assumed to be equal. As the bags are arranged in a sequential manner through the X-ray machine, the bag-scanning time is independent of the width of the CBXM. Set denotes the moving speed of the conveyor belt. Hence, the scanning time of a single bag in the black box is given as.
It’s known that the number of bags on the th conveyor belt is . In steady state, when one bag moves from the entrance of the black box to the exit, the remaining bags, which locate before the passing bag, have passed through the X-ray inspection. Therefore, the average bag-scanning of each bag can yield the following model:
From Equation (10), the bag-scanning time in the black box, namely the second section of the CBXM, is linearly dependent on the length of the black box when all the bags almost share the same size and the screening machines operate at a uniform velocity.
2.3. The Optimization Model for CBXM
The SCS service time determined as ,, and are calculated, respectively, and the service ratevalue of SCS can be definitely settled, which is . Hence, the passenger queuing time can be obtained from Equation (9).
What needs to be considered from Equation (11) is how to determine the value such that the SCS passenger queuing time is minimized. For the purpose of getting the optimal combination of the three sections of the CBXM, the SCS service time attempts to forge linkage with the length of the three sections of the CBXM, namely , , and , and when the parameters and are given, that is
By uniting Equation (12), the corresponding problem of minimizing passenger queuing time turns to the following nonlinear binary integer program, formulated as follows:
where:
is the length of ith section of CBXM;
is the capacity of SCS;
is the necessary time for X-ray and security agents to recognize whether or not bags carry any prohibited objects;
denotes the time which the passengers spend from picking up their bags to turning away from the security corridor, and it takes a range value between 2s and 3s through manual recording. In this paper, it is limited to the middle value, 2.5s;
is the moving speed of CBXM;
is the average bag length.
Such a model framework is a nonlinear optimization problem with the above constraints. Among these constraints’ conditions, the first can be obtained from Equation (12) in the case where a passenger carries only one bag, and an inequality less than will be applied if the bags a passenger carry are more than one. The last one is given by the data collection in subway stations and technical consultation with the manufacturing enterprises of security-check facilities. The passenger queuing time is the objective function of the CBXM length at a given passenger arrival rate and the system capacity , which will be given in the following subsection. In order to accurately quantify the passengers’ queuing time with the length of the three sections of the CBXM, the underlying relationship between the CBXM length and the SCS service time will be further discussed in detail in the following section.
2.4. Parameter Determination
2.4.1. Determination of the Passenger Arrival Rate
The trend is not obvious for a small pedestrian flow. Considering the large variability of the CBXM length under different arrival rates, three levels of passenger arrival rate are chosen using the following aspects.
When the average spatial per person is less than , the crowding phenomenon can be seen [23]. The passenger flow in the security-check passageway is at this density based on the congestion model. Hence, the arriving rate is selected as , and the above arrival rate is considered. According to the definition in TRB’s Transit Cooperative Research Program (TCRP) Report 100: Transit Capacity and Quality of Service Manual and the Chinese national standard of Code for Design of Metro (50157–2013), the standard one direction maximum passageway capacity is [24,25]. Hence, the arriving rate is selected as . For the consideration of SCS operation costs, the cumulative 85% of the peak throughput is selected as an option, that is at Beijing South Station. Hence, the selected highest arriving rate is .
Taking the above three aspects into consideration, three levels of passenger arrival rates are determined in this research: , , and [26], and the corresponding subway stations investigated in the paper are Liuliqiao Station, Beijing Railway Station and Beijing South Railway Station, as shown in Table 1.
2.4.2. Determination of the System Capacity
The system capacity , which generally matches with the passenger arrival rate, is dependent on the value of the length and width of the security-check area. It is found that the length and width of the channel are positively related to the maximum pass capacity of the channel through experiments [22], so that the length and width of the checking area can be determined when the arrival rate is given. Through the field measurement of the security-check area of the investigated subway station, the width of the security-check area is defined as 0.5 m, and the length =2.5, 3, 4 with= 4000 p/h, 5000 p/h, and 6000 p/h, respectively.
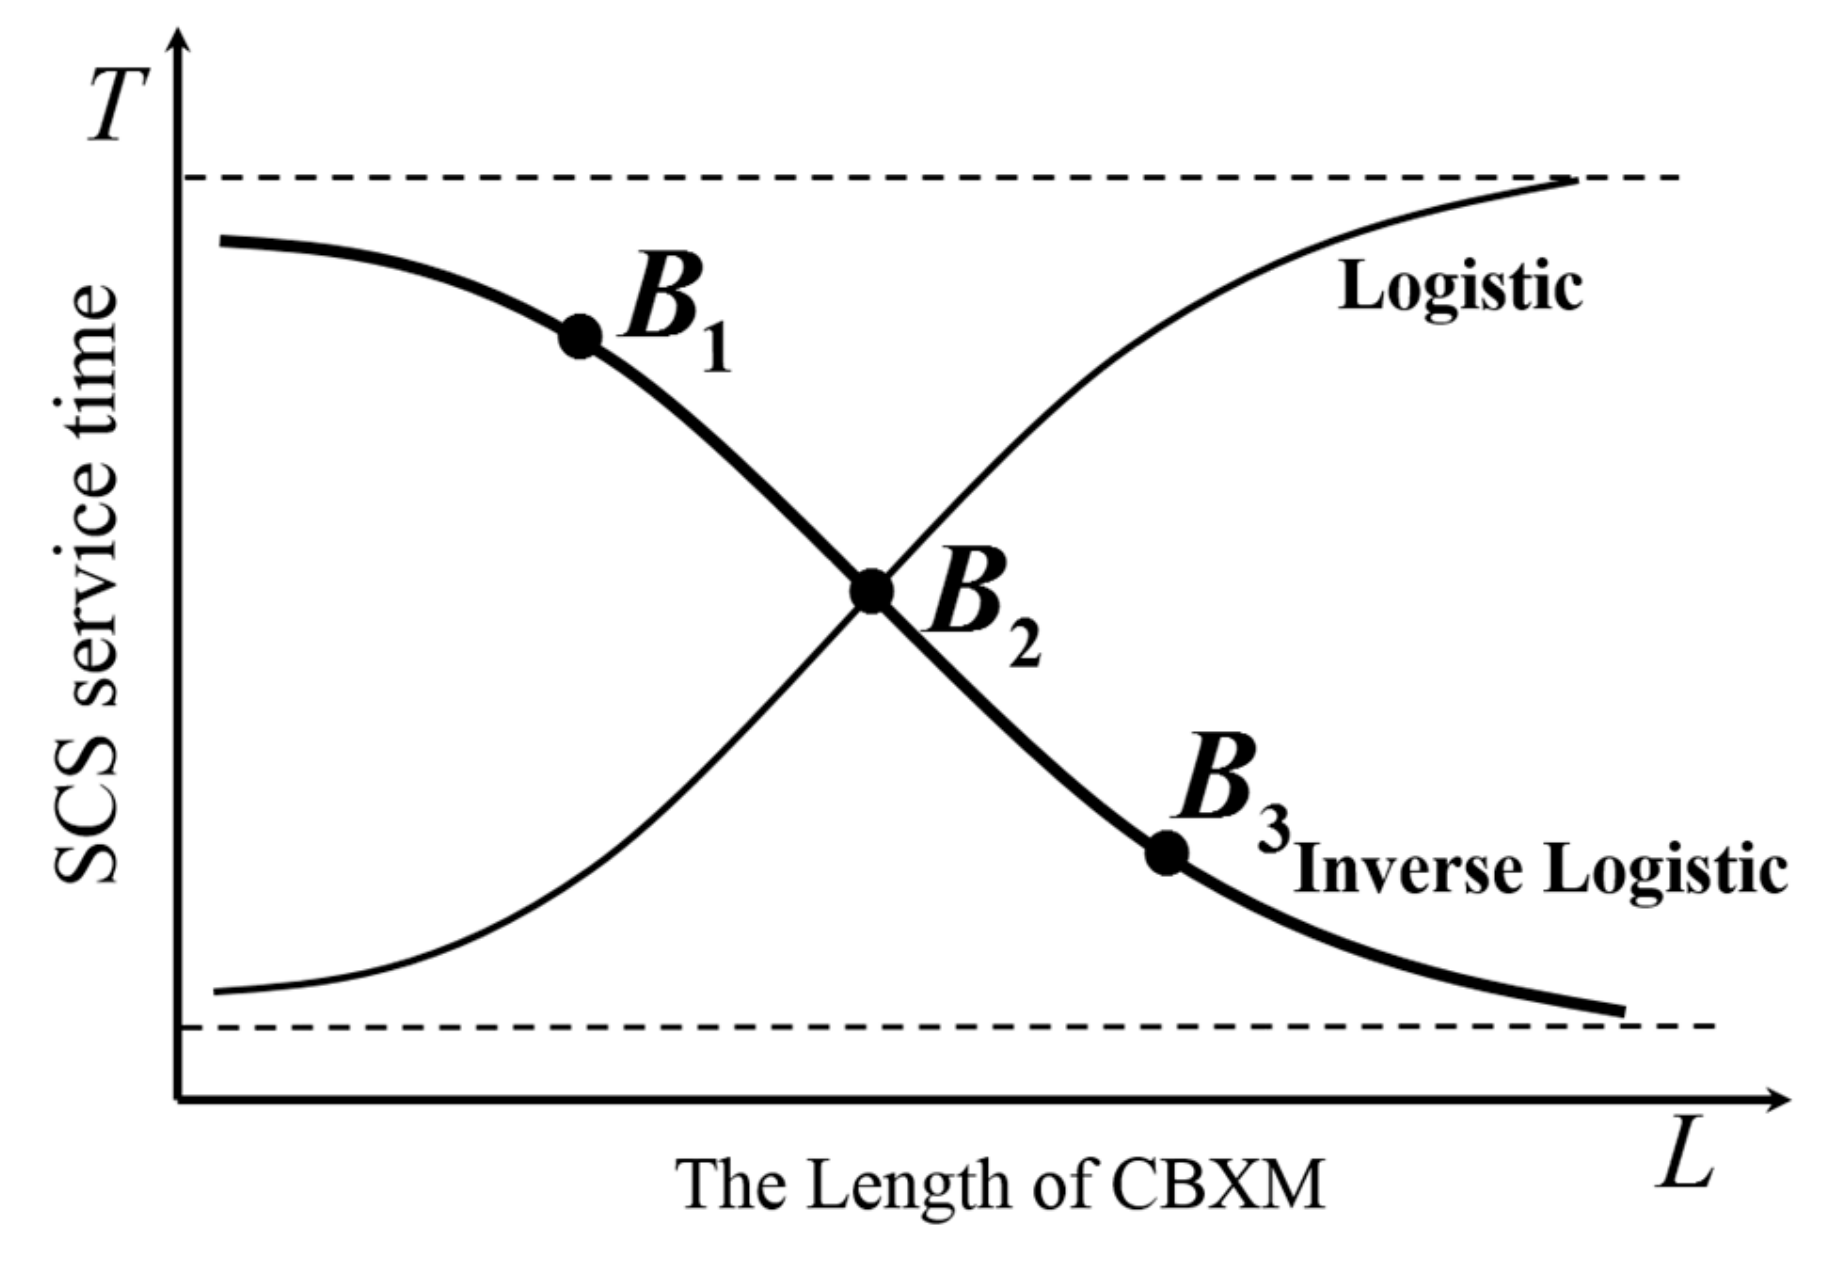
2.5. The Inverse Logistic Curve for X-ray Inspection
According to data preprocessing and trend analysis, the time of the X-ray inspection service is compromised by the CBXM length, resulting in an enhancement of inspection efficiency. In fact, the service time has a minimum threshold, which means the decline of the service time to a certain extent will remain unchanged. It is a reasonable and accepted assumption that the relationship between X-ray inspection service and the CBXM length is complementary to a logistic curve. Therefore, the efficiency of the X-ray inspection process can be described by a known CBXM length and SCS service time characteristic curve, namely an inverse logistic curve, as shown in Figure 5. By deriving the inverse logistic curve, one inflection point, , and two inflection points, and , of the first derivative can be obtained. The three points divide the curve into four segments.
This paper attempts to use a new formula to fit the inverse logistic curve based on the logistic formula:
where:
is the maximum threshold for SCS service time;
is the coefficient related to the base number of SCS service time;
is the growth rate needed for development.
Let, the inverse Logistic curve formula can be obtained after the simplification to Equation (14).
The inverse logistic curve can be determined when three parameters, , , and , are given in Equation (15). In this context, the Marquast method is applied to solve three parameters, and it will be conducted in the next section.
2.6. The Parameter Estimation for Inverse Logistic Model
The Marquast method is used to transform the nonlinear inverse logistic model into a linear equation and estimate the parameters of the nonlinear regression model. The transformed inverse logistic curve formula is shown in Equation (16).
Let and Equation (16) could be denoted as a typical linear equation, as shown in Equation (17).
The parameters of , , and can be derived once the three parameters, , , and , are estimated successfully. Three experimental data, , , and , are chosen randomly to substitute into Equation (17) and make without loss of generality. Through simultaneous equations and iterative schemes Equation (17) and the parameters and can be computed as Equation (18).
where S= and , by denoting to be the iterative initial value.
The derived parameter values , and were calculated only using the above three experimental data. Due to the existence of random error, all parameters values of , and calculated using all the experimental data are treated as approximate initial values to carry out a nonlinear least square, which meets the requirement of fitting for all experimental data, and then the best parameter value can be figured out.
3. Field Study
Six multi-mode transfer subway stations are selected largely due to the larger arrival rate than other stations with a cyclical passenger flow during peak hours. Field investigations and time fitting will be conducted to explore the relationship between the CBXM length and the SCS service time in this field study. In addition, the optimal length combinations of the CBXM under different arrival rates and system capacities are also suggested in this study.
3.1. Data Collection and Analysis
The transferring type and ID of all these stations are presented in Table 2, where three of them are transferring train stations and the others are inter-provincial long-distance bus stations.
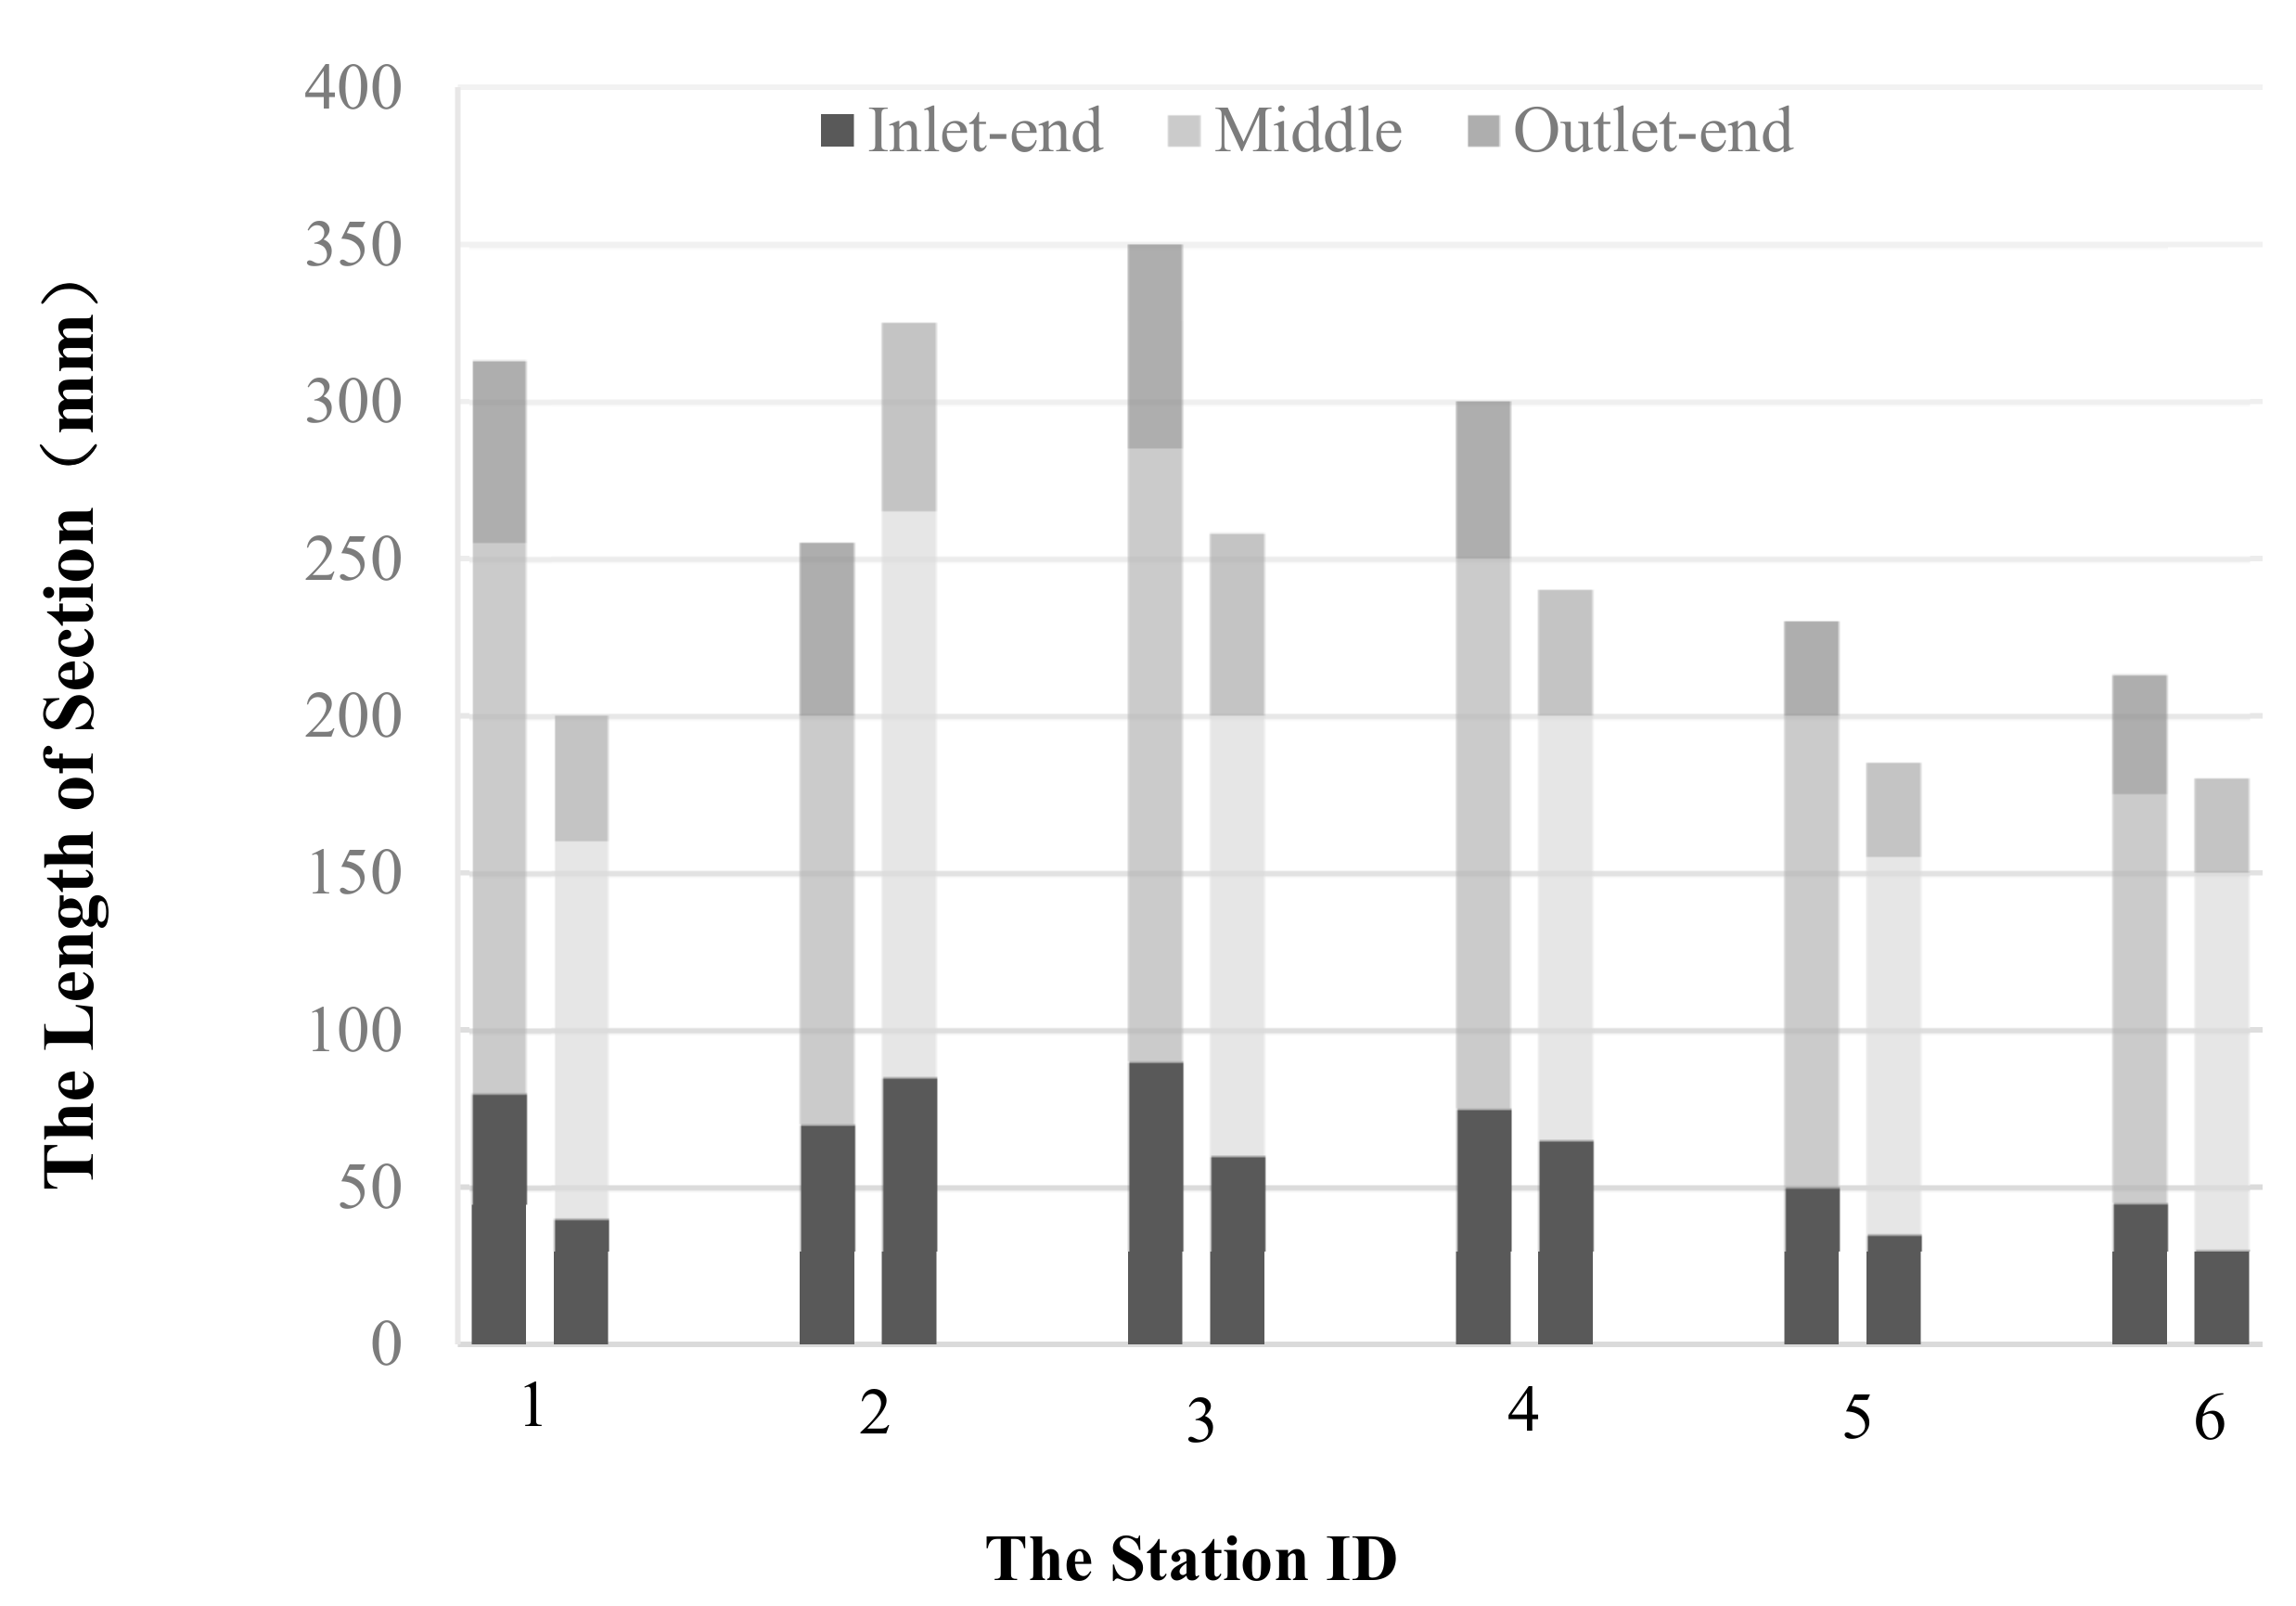
The filed investigated data of the security-check process in the subway station was manually measured using a stopwatch, tape measure, and others. Measurements for each section length of the CBXM are given in Table 3 and Figure 6, and the average time for leaving-bag and taking-bag is presented in Table 4, which is collected through manual timing and video recording from 5 weekday morning and afternoon peak hours. Invalid and erroneous data in Table 4 are manually removed before further analysis.
According to Table 3, the length of inlet-end ranges from 30 to 90 cm. Correspondingly, the time that passengers leave their bags on the inlet-end section ranges from 4.46 to 7.27 s according to Table 4. The average time for taking-bag varies more than the leaving-bag time when the outlet-end length increases from 20 to 65 cm. Field observation reveals that the trend of the relationship between the taking-bag time and the outlet-end length is consistent with the relationship between the leaving-bag time and the length of inlet-end.
3.2. Data Fitting and Validation
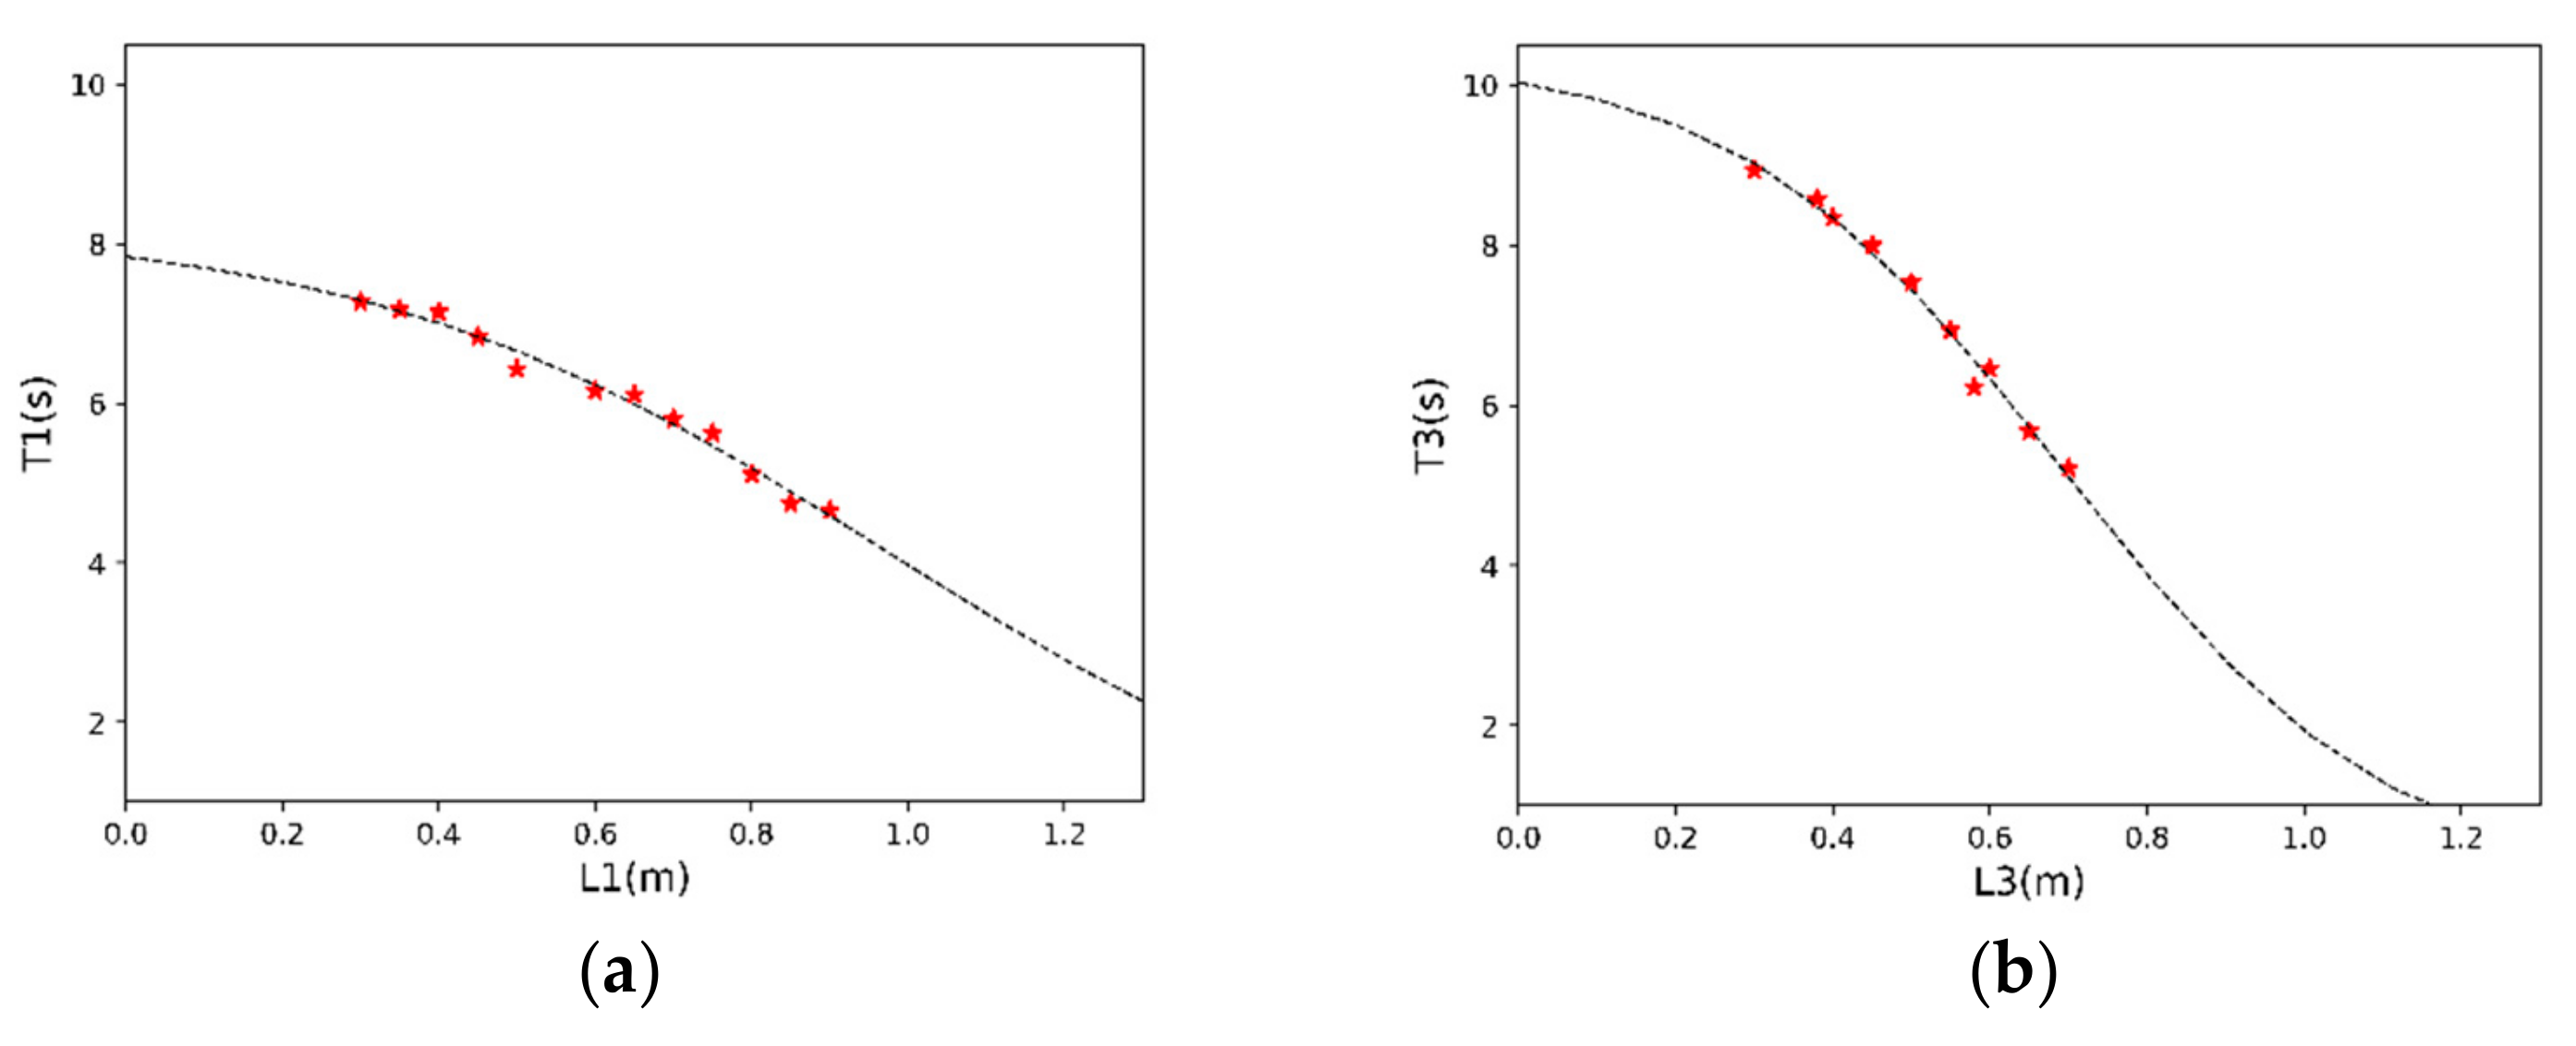
In the context, the data fitting is conducted using MATLAB. According to the monotonous decreasing trend of the data demonstrated in Table 4, the inverse logistic curve with inflection point shown in Figure 7 reflects the change regulation between the SCS service time and the CBXM length, which is confirmed sufficiently to fit all the data using the inverse logistic curve.
For further strengthening of the rationality of inverse logistic curve fitting, other empirical formulas, such as exponential function and power function, are used to describe the relationship between the SCS service time and the length of the CBXM. The calculation results for fitting the relationship between the leaving-bag time and the length of inlet-end are revealed in Table 5.
Comparing to the fitting results as Figure 7 and Table 5 show, adjusting of over 0.95 for the inverse logistic curve is achieved, which is also obviously better than the other empirical formulas mentioned above. By combining the liner relationship between the bag-scanning time and length of the black box, the relation between the SCS service time and the length of the CBXM can be obtained.
The second section in Equation (21), or namely, has been verified to closely relate to the bag length. Bags carried by passengers are generally larger in these multi-mode transfer stations than other common commuter stations. The size variance of bags carried by passengers has the most significant influence on the security inspection time [19]. Here, the length of the bag is considered a constant for the purpose and subjectivity of the study. In fact, according to the statistical data of the investigation report on market consumption of China’s suitcase [27], almost 70% of bags which appear in the X-ray inspection share similar sizes, and each bag occupies 0.5m of the CBXM length on average, that is, = 0.5. In light of technical reasons, the moving speed of the CBXM is usually 0.22 m/s. The SCS service time in the SCS can be calculated as
According to Equation (22), the optimization model is really refined when the connection between the SCS service time and the three-section length of the CBXM,, , and , has been determined, respectively.
3.3. Results
In total, according to the analysis of optimal model with parameters, including three scenarios of the passenger arrival rate and the system capacity , the descriptive statistics of optimum combination of the three-section length and homologous optimization of passenger queuing time under different arrival rates are summarized in Table 6.
As illustrated in Table 6, it can be demonstrated that the optimal design for the CBXM can effectively improve the SCS performance and lessen passenger queuing time. Particularly, with adaptation to the arrival rate =6000 p/h, there is a 23.3% reduction with the combination of cm. As for others, the queuing time of the optimized design is decreased by 15.7% and 16.0%, respectively.
4. Conclusions and Recommendations
Congestion caused by security checks is common for the Beijing subway system during peak hours. The key point of improving SCS efficiency is to determine a reasonable length for the CBXM, which is explored in this research. The inspection service time, including the leaving-bag time, the bag-scanning time and the taking-bag time, and the corresponding three-section length of the CBXM are investigated in this paper. The proposed model framework for obtaining the optimal length of the CBXM based on the M/M/1/N queuing model and inverse logistic curve is validated using the field data. It can be identified that the optimal design at different arrival rates derived from the model can greatly reduce queuing time with least costs. In addition, the findings of this paper could provide insights for the subway SCS design manuals. Furthermore, it could be extended to large railway and aviation hubs vulnerable to terrorist attacks, as well as the express industry. However, there are some valuable and meaningful elements, such as the bag size and passenger characteristics like age and gender, which are not taken into account with the recorded leaving-bag time and taking-bag time. Applying two or more conveyor belts can also be tested in a field operation for an improved capacity with consideration of costs. In further studies, more fundamental dimensions including more types of population, bag characteristics, as well as other constraint conditions would need to be considered.
Author Contributions
Z.W.: Methodology, Resources, Supervision, Writing—review & editing. S.C.: Data curation, Investigation, Writing—original draft. Z.H.: Data curation, Writing—original draft. S.Q.: Formal analysis, Methodology, Supervision, Writing—review & editing. Q.Z.: Writing—review & editing. All authors have read and agreed to the published version of the manuscript.
Funding
This research received no external funding.
Acknowledgments
The authors would like to acknowledge the financial support for this study provided by National Natural Science Foundation of China (Grant No. 51608019), Beijing Excellent Talent Program (Grant No. 2015000020124G035), Beijing Municipal Science and Technology Project (No. Z171100000517003 and No. Z171100000517004), and the Ri-Xin Talents Project of Beijing University of Technology (2017-RX(1)-16).
Conflicts of Interest
The authors declare no conflict of interest.
Data Availability Statements
The authors declare that all data supporting the findings of this study are available within the article.
References
- Chnrailway.com. Total Subway Passenger Flow in China’s Top 10 Cities in 2017. 2018. Available online: http://www.chnrailway.com/html/20180307/1817345.shtml (accessed on 7 March 2018).
- Zhao, G.M.; Liu, M.; Zhang, Q.S.; Yang, Y.; Wang, L. Terror attack risk assessment of subway station based of game theory. J. Saf. Environ. Anquan Yu Huanjing Xuebao 2006, 6, 47–50. [Google Scholar]
- Channel News Asia. The Seven Deadliest Attacks in Europe in Decades. 2015. Available online: http://www.channelnewsasia.com/news/world/the-seven-deadliest/382.html2260 (accessed on 21 November 2015).
- Estrada, M.A.R.; Koutronas, E. Terrorist attack assessment: Paris november 2015 and brussels march 2016. J. Policy Model. 2016, 38, 553–571. [Google Scholar] [CrossRef]
- Du, H.C. Overseas Subway Bombings in Recent Years. 2017. Available online: http://world.huanqiu.com/exclusive/2017-04/10422324 (accessed on 30 July 2017).
- Zhu, Y.J.; Tan, Q.Y.; Pei, Y.G.; Kong, X.; Zhou, Q. Construction of rapid passenger traffic safety inspection system for rail transit. J. Beijing Police Coll. 2016, 3, 34–38. [Google Scholar]
- Poole, R.W.; Passantino, G.M. Risk-Based Airport Security Policy (No. Policy Study 308); Reason Public Policy Institute: Los Angeles, CA, USA, 2003. [Google Scholar]
- Leone, K.; Liu, R.R. The key design parameters of checked baggage security screening systems in airports. J. Air Transp. Manag. 2005, 11, 69–78. [Google Scholar] [CrossRef]
- Leone, K.; Liu, R. Analysis of security system designs for ferry transportation. Transp. Res. Rec. 2006, 1955, 8–13. [Google Scholar] [CrossRef]
- Leone, K.; Liu, R.R. Improving airport security screening checkpoint operations in the US via paced system design. J. Air Transp. Manag. 2011, 17, 62–67. [Google Scholar] [CrossRef]
- Nie, X.; Parab, G.; Batta, R.; Lin, L. Simulation-based Selectee Lane queueing design for passenger checkpoint screening. Eur. J. Oper. Res. 2012, 219, 146–155. [Google Scholar] [CrossRef]
- Adrian, J.L.; Jacobson, S.H. Optimizing the Aviation Checkpoint Process to Enhance Security and Expedite Screening. In Wiley Encyclopedia of Operations Research and Management Science; American Cancer Society: Atlanta, GA, USA, 2011. [Google Scholar]
- McLay, L.A.; Jacobson, S.H.; Kobza, J.E. Integer programming models and analysis for a multilevel passenger screening problem. IIE Trans. 2007, 39, 73–81. [Google Scholar] [CrossRef]
- Sahin, H.; Feng, Q. A mathematical framework for sequential passenger and baggage screening to enhance aviation security. Comput. Ind. Eng. 2009, 57, 148–155. [Google Scholar] [CrossRef]
- McLay, L.A.; Jacobson, S.H.; Nikolaev, A.G. A sequential stochastic passenger screening problem for aviation security. IIE Trans. 2009, 41, 575–591. [Google Scholar] [CrossRef]
- Skorupski, J.; Uchroński, P. A fuzzy model for evaluating airport security screeners’ work. J. Air Transp. Manag. 2015, 48, 42–51. [Google Scholar] [CrossRef]
- Skorupski, J.; Uchroński, P. A fuzzy model for evaluating metal detection equipment at airport security screening checkpoints. Int. J. Crit. Infrastruct. Prot. 2017, 16, 39–48. [Google Scholar] [CrossRef]
- Zhang, X.; Wei, Z.; Wang, W.; Liu, S.; Qiu, S. Paced inspection process design of security check system in Beijing Subway. Transp. Res. Rec. 2017, 2604, 95–103. [Google Scholar] [CrossRef]
- Peng, C.; Zhang, Z.; Xiaofeng, H.U.; Xuewei, J.I. Analysis of Passenger Behaviors Impacting on Subway Station Security Test. Urban Mass Transit 2016, 19, 5–9. [Google Scholar]
- Xu, H.Z.; Zhang, W.H.; Wang, L.Z.; Xia, D.H. Simulation and Optimization of Security Equipment Layout in Metro Station. For. Eng. 2016, 32, 81–86. [Google Scholar]
- Yuhaski, S.J.; Smith, J.M. Modeling circulation systems in buildings using state dependent queueing models. Queueing Syst. 1989, 4, 319–338. [Google Scholar] [CrossRef]
- Xu, X.Y.; Liu, J.; Li, H.Y. Study on Walkway Capacity Computation Based on M/G/C/C State Dependent Queuing Model. Logist. Technol. 2012, 31, 187–189. [Google Scholar]
- Lam, W.H.; Cheung, C.Y.; Lam, C.F. A study of crowding effects at the Hong Kong light rail transit stations. Transp. Res. Part A Policy Pract. 1999, 33, 401–415. [Google Scholar] [CrossRef]
- Transit Cooperative Research Program (TCRP). Transit Capacity and Quality of Service Manual; Transportation Research Board: Washington, DC, USA, 2003; Volume 7, pp. 23–67. [Google Scholar]
- Beijing Municipal Planning Commission. Code for Design of Metro; China Architecture & Building Press: Beijing, China, 2014. [Google Scholar]
- Sun, L.; Luo, W.; Yao, L.; Qiu, S.; Rong, J. A comparative study of funnel shape bottlenecks in subway stations. Transp. Res. Part A Policy Pract. 2017, 98, 14–27. [Google Scholar] [CrossRef]
- Investigation Report on Market Consumption of China’s Suitcase; Shenzhen Enterprises in the Wisdom of Investment Advisory Co., Ltd.: Shenzhen, China, April 2017.
Figure 1.
Current practice of Beijing Subway security check.

Figure 2.
Sketch of an X-ray machine.

Figure 3.
Queuing system composition.

Figure 4.
Transition diagram.

Figure 5.
Inverse logistic curve.

Figure 6.
Variation in CBXM length.

Figure 7.
Fitting results. (a) Fitting result of leaving-bag time(T1) and inlet-end length(L1). (b) Fitting result of taking-bag time(T3) and outlet-end length(L3).
Figure 7.
Fitting results. (a) Fitting result of leaving-bag time(T1) and inlet-end length(L1). (b) Fitting result of taking-bag time(T3) and outlet-end length(L3).


Table 1.
Combination of security check area with given λ.
| λ | Represents of Station | ||
|---|---|---|---|
| 4000 | 2.5 | 0.5 | Liuliqiao Station |
| 5000 | 3 | 0.5 | Beijing Railway Station |
| 6000 | 4 | 0.5 | Beijing South Railway Station |
Table 2.
Six investigated stations in Beijing Subway.
| Name | Type of Transferring | Station ID |
|---|---|---|
| Beijing Railway Station | 1 | |
| Beijing West Railway Station | High Speed Rail | 2 |
| Beijing South Railway Station | 3 | |
| Liuliqiao Station | 4 | |
| Muxiyuan Station | Inter-provincial Bus | 5 |
| Sihui Station | 6 |
Table 3.
Configuration of conveyer belt of X-ray machine (CBXM).
| Size of Each Section of the Machine Conveyor Belt | |||
|---|---|---|---|
| Station ID | Inlet-End (cm) | Scanning Section (cm) | Outlet-End (cm) |
| 1 | 80 | 175 | 58 |
| 40 | 120 | 40 | |
| 2 | 70 | 130 | 55 |
| 85 | 180 | 60 | |
| 3 | 90 | 195 | 65 |
| 60 | 140 | 58 | |
| 4 | 75 | 175 | 50 |
| 65 | 135 | 40 | |
| 5 | 50 | 150 | 30 |
| 35 | 120 | 30 | |
| 6 | 45 | 130 | 38 |
| 30 | 120 | 20 | |
Table 4.
Leaving-bag time and taking-bag time in each screening machine.
| Station ID | Leaving-Bag Time (s) | Taking-Bag Time (s) |
|---|---|---|
| 1 | 5.11 | 6.80 |
| 7.15 | 8.34 | |
| 2 | 5.80 | 6.31 |
| 4.75 | 6.46 | |
| 3 | 6.16 | 6.23 |
| 4.46 | 5.22 | |
| 4 | 5.62 | 6.46 |
| 6.11 | 7.54 | |
| 5 | 6.43 | 6.23 |
| 7.18 | 6.23 | |
| 6 | 7.27 | 9.58 |
| 6.84 | 8.77 |
Table 5.
Relationship of leaving-bag time and length of inlet-end.
| Fitting Models | Relationship of Time (T1) and Lenght (L1) | |
|---|---|---|
| The inverse Logistic curve | 0.984 | |
| Exponential function curve | 0.943 | |
| Power function curve | 0.892 |
Table 6.
Descriptive statistics of passenger queuing time with different
| Combination Length of CBXM | Optimization of Wq | |||||
|---|---|---|---|---|---|---|
| λ | Practice (s) | Optimization (s) | Performance | |||
| 4000 | 65 | 130 | 65 | 17.03 | 14.35 | 15.7% |
| 5000 | 90 | 120 | 90 | 19.85 | 16.68 | 16.0% |
| 6000 | 95 | 110 | 95 | 24.26 | 19.47 | 23.3% |
© 2020 by the authors. Licensee MDPI, Basel, Switzerland. This article is an open access article distributed under the terms and conditions of the Creative Commons Attribution (CC BY) license (http://creativecommons.org/licenses/by/4.0/).
Share and Cite
MDPI and ACS Style
Wei, Z.; Chu, S.; Huang, Z.; Qiu, S.; Zhao, Q. Optimization Design of X-ray Conveyer Belt Length for Subway Security Check Systems in Beijing, China. Sustainability 2020, 12, 2133. https://0-doi-org.brum.beds.ac.uk/10.3390/su12052133
AMA Style
Wei Z, Chu S, Huang Z, Qiu S, Zhao Q. Optimization Design of X-ray Conveyer Belt Length for Subway Security Check Systems in Beijing, China. Sustainability. 2020; 12(5):2133. https://0-doi-org.brum.beds.ac.uk/10.3390/su12052133
Chicago/Turabian StyleWei, Zhonghua, Sinan Chu, Zhengde Huang, Shi Qiu, and Qixuan Zhao. 2020. "Optimization Design of X-ray Conveyer Belt Length for Subway Security Check Systems in Beijing, China" Sustainability 12, no. 5: 2133. https://0-doi-org.brum.beds.ac.uk/10.3390/su12052133
Note that from the first issue of 2016, this journal uses article numbers instead of page numbers. See further details here.