Article

Mapping Cultural Ecosystem Services Enables Better Informed Nature Protection and Landscape Management

Faculty of Natural Science, Constantine the Philosopher University in Nitra, Tr. A. Hlinku 1, 949 74 Nitra, Slovakia
*
Author to whom correspondence should be addressed.
Sustainability 2020, 12(5), 2138; https://0-doi-org.brum.beds.ac.uk/10.3390/su12052138
Submission received: 17 January 2020 / Revised: 3 March 2020 / Accepted: 4 March 2020 / Published: 10 March 2020

Abstract

:
Cultural ecosystem services (CES) have specific richness and diversity provision patterns related to particular landscape features and land cover forms. Studies of their spatial distribution, however, are quite rare in the Slovak Republic and surrounding countries. This paper links land cover information based on an ecosystem services (ES) matrix, field survey data and GIS method to assess CES supply in two selected Slovak regions. Our main focus is on the ecologically more valuable ‘hot-spots’ where socio-cultural values accumulate. We determined their spatial distribution, and our comparison with lower cultural value areas confirmed that mountainous landscapes have the highest capacity to provide CES. This especially applies to the landscapes under National Park protection. While Slovak forests, rocks and water areas also form essential ecosystems for overall CES provision, the lowest overall capacity is in areas with residential buildings, construction, industrial and other artificial habitats. Finally, a comparison of our results with the National Ecosystem Assessment indicates that our detailed CES assessment will be more effective in supporting future participatory planning and management processes.

1. Introduction

Ecosystem services (ES) is a globally recognized concept which highlights the material and non-material benefits humans gain from ecosystems [1]. These services are combined in the following classes: (1) provisioning ES to provide services such as food and water, (2) regulating ES to monitor climate stability and disease control, (3) supporting ES to cover pollination and nutrient cycling and (4) cultural ES to provide the “non-material benefits people obtain from ecosystems through spiritual enrichment, cognitive development, reflection, recreation and aesthetic experience” [2,3]. In practice, cultural ecosystem services (CES) express appreciation of aesthetic beauty in natural scenery and inspiration for culture, art and design. They also provide a sense of place, belonging and spiritual and religious motivation. This leads to opportunities for environmental science, education, recreation and economic tourism [4].
Research into ES mapping and valuation has significantly increased in the last decade. The literature analysis [5] indicates that CES in Denmark and Spain are mostly devoted to national assessments [6,7]. However, most countries use ecosystem, land use, Corine Land Cover maps and ES assessment indicators derived from natural-environmental databases. For example, Finland, Luxembourg and the United Kingdom use the most elaborate indicator systems [8,9,10]. The ES assessment methods also vary considerably in different countries. Simple methods include the ‘evaluation matrix’ used in Russia [11,12,13] and studies addressing ES stock capacity and demand and current ES flows.
These assessment indicators are also compared in different ways. The most frequent comparison is illustrated in Rabe et al.’s statistical evaluation of relationships between categories in German administrative regions [14]. Finally, CES are not yet fully integrated into operational frameworks or in nature protection and landscape management [15]. This contrasts sharply with provisioning and regulating services, and it risks non-objective assessment in nature conservation policy [16].
The Slovak Republic is no exception in this omission. Improving this problem requires essential analysis across disciplines to address the complex cultural ES issues. For example, the CES physical, intellectual and spiritual interactions with biota should be analyzed from the multiple ecological, social and behavioral perspectives. The challenging quantification of intangible CES benefits must then be solved, because these currently lack adequate assessment [17]. In addition, the primary source of information is provided by detailed surveys, and there is insufficient data available for large-scale assessments [18]. Braat and de Groot [19] report that CES identification and quantification is essential for landscape planning and ecosystem management. The CES are sensitive to external impacts such as landscape changes and inappropriate management. CES under-estimation in research and planning can lead to non-objective assessment in nature conservation policy [19].
Understanding how different landscape features contribute to diverse CES provision is essential for landscape planning. This is also important for evaluating landscape changes [20,21]. Therefore, the techniques used in ecosystem services valuation are usually grouped in the related biophysical, socio-cultural and economic domains [22]. This CES socio-cultural valuation is especially important for exploring human perceptions and their preferences in existing CES valuations [23].
Ecosystem services assessment has already been performed in the following protected National Parks: Slovenský raj [24], Veľká Fatra [25], Tatra [26,27,28], Muránska planina [29] and Malá Fatra [30]. However, CES still receive less priority. This is despite Tutka’s [31] economic evaluation of nature conservation functions in forest ecosystems and the on-going scientific interest in ecosystem services.
The first comprehensive assessment of CES in Slovakia was made as part of the National Ecosystem Services Assessment [32]. Three CES were analyzed, and the capacity for ecosystem services provision was expressed in a 0–100 scale. This scale is now the same for all ES. The results of this assessment also provided a reference point for our analyses on a more detailed scale. This target was the major inspiration for our research.
The main aim of our research is to map and assess the three recognized CES of recreation and tourism, aesthetic beauty and natural and cultural heritage for two model areas in the Slovak Republic (Central Europe). The mapping will enable more informed nature protection and landscape management. The assessment will establish if ecologically more valuable areas also have greater socio-cultural value for visitors than areas with a lower value. The added goal is to compare the results from our regional approach with results established in the Slovak national assessment [32].

2. Materials and Methods
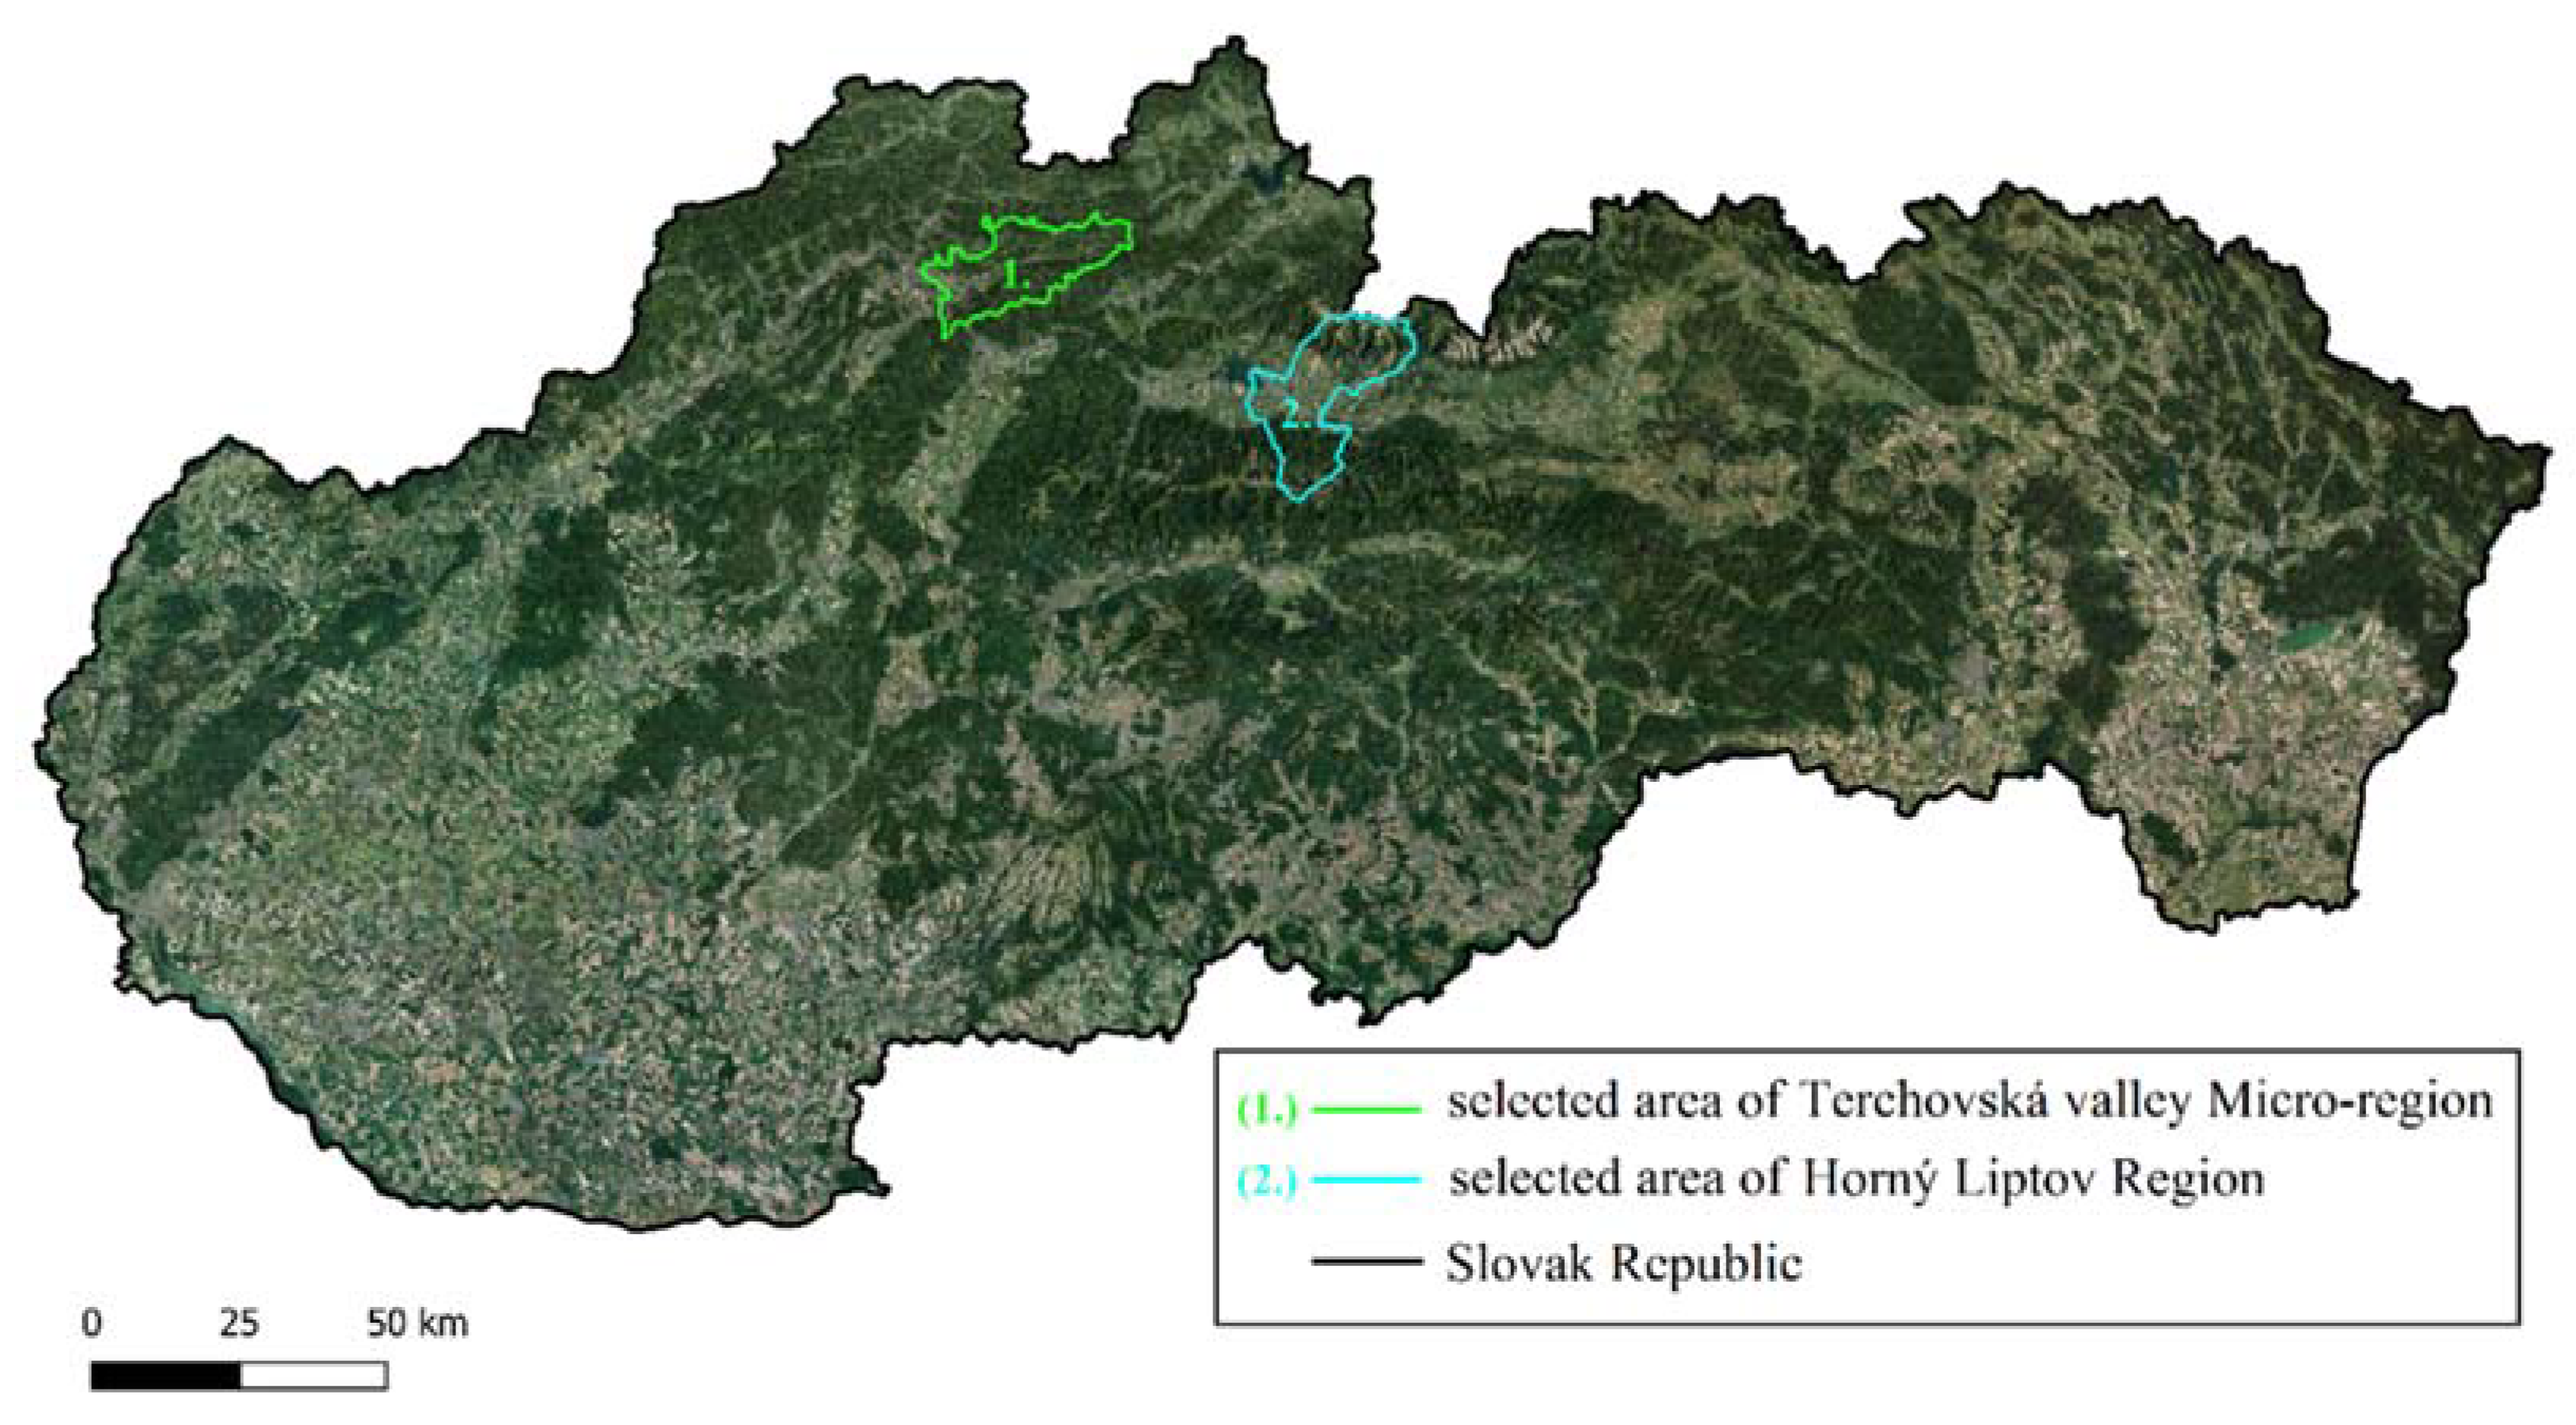
2.1. Study Area

Figure 1 depicts the two study areas assessed in the land-locked Slovak Republic in Central Europe. The Terchovská valley micro-region is in the Žilina and Dolný Kubín County in the country’s north-west. This region has 17 municipalities with 33,987 ha total area and 31,699 inhabitants. The western part is mostly industrial because it borders the Žilina regional capital city with its KIA car factory and related companies. In contrast, the eastern area covers municipalities with preserved nature and historical landscape structures. These latter include dispersed settlements and terrace fields created in the 16th and 17th centuries. The protected Mala Fatra National Park is situated in the south-east of the study area, and an edge of the Kysuce Landscape protected area is in the northern region. There is also a wide range of habitats in this small area. Both these protected areas harbor valuable endemic species and glacial plant and animal relics.
The Horný Liptov Region in north Slovakia has 15 municipalities and 41,414 inhabitants in its 40,560 ha. The central part is mostly industrial because it is close to Liptovsky Mikuláš city and surrounding municipalities. The industry there is mostly timber production, milk products and tourism. This region is one of the most attractive in Slovakia and it has unique natural assets and cultural monuments. The northern part contains the Tatra National Park (TANAP). This national park is a unique protected area with several endemic and protected species. The southern area has the Low Tatras National Park which is the largest in Slovakia. Its greatest attractions include numerous karstic phenomena and caves. The typical features of the Low Tatras National Park are long valleys, deep canyons and steep rocks coated by dwarf pines and grasslands.
Unfortunately, there has been extensive exploitation of Slovakia’s forests. Large forest areas are rapidly becoming fragmented from timber harvesting and massive tourism. They have also suffered natural disasters. In November 2004, the Tatra National Park was decimated by a calamitous windstorm that destroyed 12,000 ha of the forest at 700–1350 m altitude. Our study area covers 3237 ha of the affected area and this accounts for almost 27% of the park’s total area. This windstorm and consequent logging of damaged timber have radically changed the natural conditions for all ecosystem services [33].

2.2. Data and Methodology

We compared our regional results with the national CES assessment [32]. We chose the same three ecosystem services and the same valuation scale for the assessment that the national assessment used. The valuation methods are also similar. The main differences are our data accuracy and participatory approach. The national approach depended on the availability of national spatial data and statistics and our regional approach is based on local surveys. The primary data for our research was assembled from field research and structured stakeholder interviews. This was then supplemented by the CES matrix and land cover data. The collected field data comprised historical landscape structures, sacred, war and historical monuments and tourist infrastructure placement. This was followed by our important structured interviews, with the mayors of each municipality participating in the mapping.

2.2.1. Interviews and Participatory Mapping with Stakeholders

Participatory mapping enables stakeholders to express how and where they benefit from ecosystem services. This knowledge can then be used to understand their values in the area and possible conflicts between these services. It also has the potential to reveal perceptions of ecosystem services under different future management scenarios, although this has not been explored [34,35].
The 49 interviewed stakeholders included municipal mayors and their deputies, scientists working in national parks and the directors of regional tourism organizations. We conducted detailed interviews and requested respondents to identify positive and negative elements in the research areas (Table 1). We mapped the positive and negative landscape features also using GPS in the field and transformed the raw data into GIS. The locations were then transferred into QGIS 3.8 and used for later calculations [36].

2.2.2. Land Cover Maps and Cultural Ecosystem Services’ Matrix

The provision of ecosystem services is significantly influenced by land cover and land use [12]. Therefore, we created land cover spatial layers in QGIS 3.8 for each study area using Petrovič et al.’s [24] landscape classes. Google and the ‘Mapy.cz open map server’ added the most current information and data [37,38]. We then verified the land cover classes in core areas of both regions during field research. Our study area had 45 land use classes in 6 groups. These groups were Forest and Woodland vegetation, Grasslands and Shrublands, Agricultural areas, Bare rock and Screes, Surface water and Settlements and Built-up Areas.
The CES matrix created by expert estimations formed the basis for the reclassification of land cover maps and in accordance with Burkhard et al.’s “ES matrix” [12]. We used this matrix as the base value and adapted it to the Slovak land use classes [39]. Each element provided three values: one for each class of CES. These expert’s values were then verified with local stakeholders. In accordance with [12], each land cover element was then assigned to a 0–5 scaled land use class which measured its capacity to deliver CES. The zero value identified the lowest capacity and the value of “5” was allocated to the highest capacity. These values then provided the basis for further refinement in the following steps.

2.2.3. Mapping Important CES Features

To map the important CES features, we transferred our field research data to the QGIS map as spatial point, line and polygon layers. We then listed the positive and negative elements that affect ecosystem capacity in order to provide the three assessed CES (Table 1). Finally, we used these features to refine the values determined by land cover classes (see the next sub-section).

2.2.4. Data Processing and Evaluation

An expert estimation method assigned values to the positive and negative elements. The values depended on the extent of these elements’ effect on ecosystem capacity to produce the selected CES. The values for each element ranged from 1 for low influence to 3 for high impact. We made the resulting layers of positive and negative elements as a sum of values of all partial elements. Finally, we reclassify these values to the scale (1.0–2.0) in case of positive elements and (0.5–1.0) in case of negative elements.
Spatial analysis by QGIS employed vector and raster data for the calculation. All data were converted to raster shape by the rasterize tool with 25 × 25 m resolution after the selected vector elements were redesigned by ‘v.buffer’. The three layers of positive and negative elements and land cover layer with matrix data were then set for each CES category, and GRASS GIS [40] was used for all other calculations.
We then used ‘r.patch’ for layer-overlay. We combined the layers using ‘r.mapcal’ technology so that the final map was based on matrix values for the land cover layer.
Finally, we used multiplication coefficients to calculate all possible values. The matrix value of each element in a layer was multiplied by the resulting values of positive and negative element layers. The highest positive value adjusted the basic value by the coefficient of 2.0 and the highest negative value adjusted by 0.5. The coefficient of 1.0 means that no positive or negative features were identified.
Those calculations were made for each of the three CES, and the ’r.stat and r.univa’ tools determined the values of the layers and their occurrence for our statistical analyses. We recorded the data using the ‘r.univa’ tool and interpreted it with the ‘r.mapcalc’ tool. We then converted the data to a percentage scale by the Ixi = (Xi − Xmin/Xmax − Xmin) * 100 formula, so that the final values of the landscape capacity for CES provision fit the 0–100 range. Finally, we reclassified the data into “hot-spots” with higher than 85% value and “cold-spots” with under 10% value. The defined hot-spot and cold-spot areas were calculated by the ‘r.stat’ zonal mechanism which uses category or object-oriented statistics.

3. Results

The specific land use land cover categories (LULC) are crucial in determining the attractiveness of the landscape for CES. The CES also informs us of the appropriate nature protection and landscape management required for a specific region. This particularly applies to recreational and nature conservation areas. The material-technical facilities and the attractiveness of cultural–historical structures are then secondary criteria in assessing the area’s recreational value. Abiotic factors including morphometric relief parameters also confer importance. Our results indicate the landscape benefits to tourism from the natural conditions and preserved cultural–historical buildings, the cultural establishments and cultural and sports facilities. The resultant maps show the spatial distribution of cultural ecosystem services supply. The higher percentages indicate higher CES potential. The landscape’s capacity for CES provision increases according to the area’s importance for sustained nature and landscape conservation.

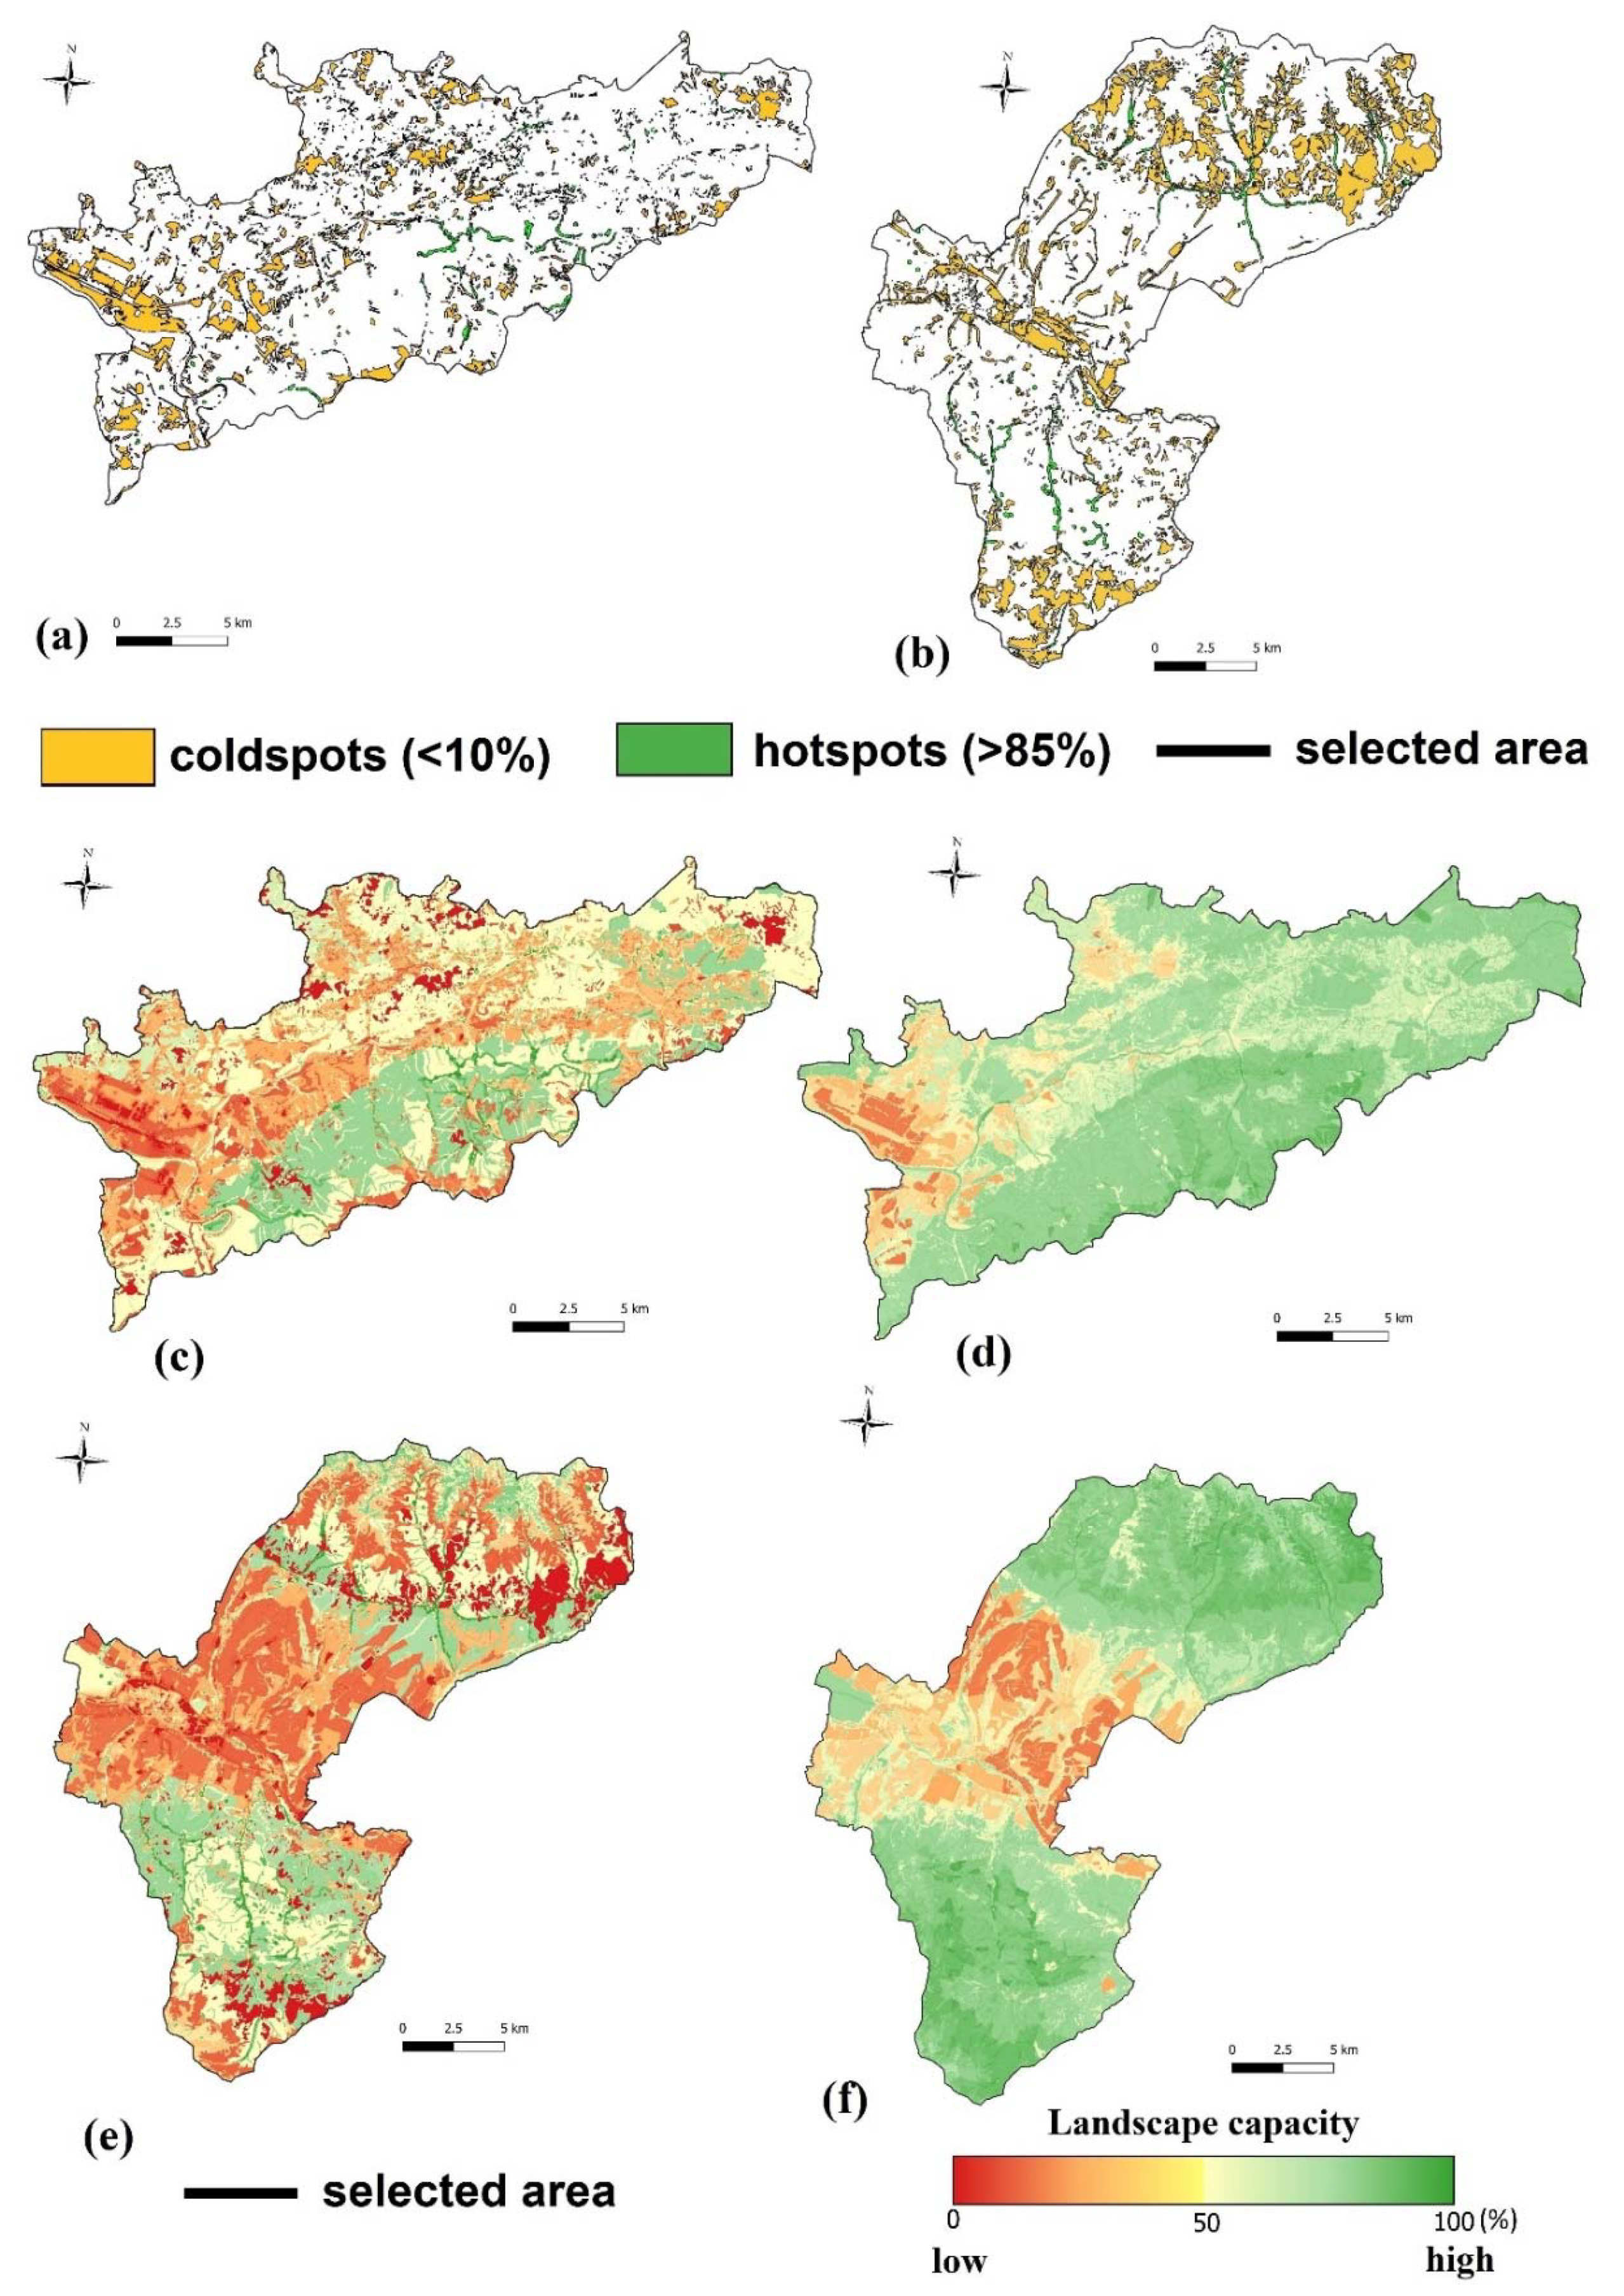
3.1. Recreation and Tourism

Only 1.6% of the study area contains hot-spots with very high capacity to provide eco-friendly recreation value. These hot-spots are also important for maintaining nature protection and landscape management. The areas are located in the Small Fatras, High Tatras and Low Tatras National Parks (Figure 2). The greatest number of recreation facilities are all in these areas. These include tourist trails, cycling routes, educational trails, climbing, skiing and cross-country skiing areas. Features that contribute to the attractiveness of these landscapes for visitors include the high natural value of preserved forests, alpine meadows with rich biodiversity, glacier lakes, geo-morphological localities and many wonderful observation points. However, there are limits imposed in high-value protected areas. These include seasonal closures and inaccessibility to some national park areas due to fauna and flora protection.
Additional hot-spots for recreation and tourism are related to cultural heritage. Historical landscape structures in dispersed settlements with preserved architecture and terrace fields are mainly used as recreational sites by urban residents [41,42,43]. The identified dispersed settlements are mostly located in the eastern parts of the Terchovská valley micro-region where Wallachian colonization occurred. The Horný Liptov region also has many war memorials which often form part of educational trails. These emphasize the objects themselves and the entire beauty of this historical area. Local castles are very important sites and significant historical objects greatly admired and appreciated by visitors. These are complemented by the interesting chateaus, bell towers, chapels and crucifixes in the natural environment.
We then selected areas up to 10% in value to highlight the cold-spots with very low capacity to provide CES (Figure 2a,b). These cover a larger area than hot-spots, with 14.5% of the entire study area. The proximity to negative landscape features decreases the attractiveness of a region. Negative features include industrial and built-up areas, opencast mining areas and highways and railways. These have little or no potential to develop recreation and tourism in their immediate vicinity. Further negative areas are found in forests affected by thunder-storms. These have unfavorable conditions for CES provision. From a long-term perspective, these areas can return to their natural state and then have very high potential to provide CES. However, their actual capacity to provide opportunities for recreation and tourism remains very low.
The most cold-spots in the Terchovská valley micro-region are located in the western, more industrial part of the study area (Figure 2a). Others are scattered in the north and east with intensive timber harvesting. However, those in the Horný Liptov region mostly surround the Liptovský Mikuláš city industrial sites. In addition, the High Tatras and Low Tatras National Park cold-spots are caused by timber harvesting initiated to limit bark beetle infestation (Figure 2b).

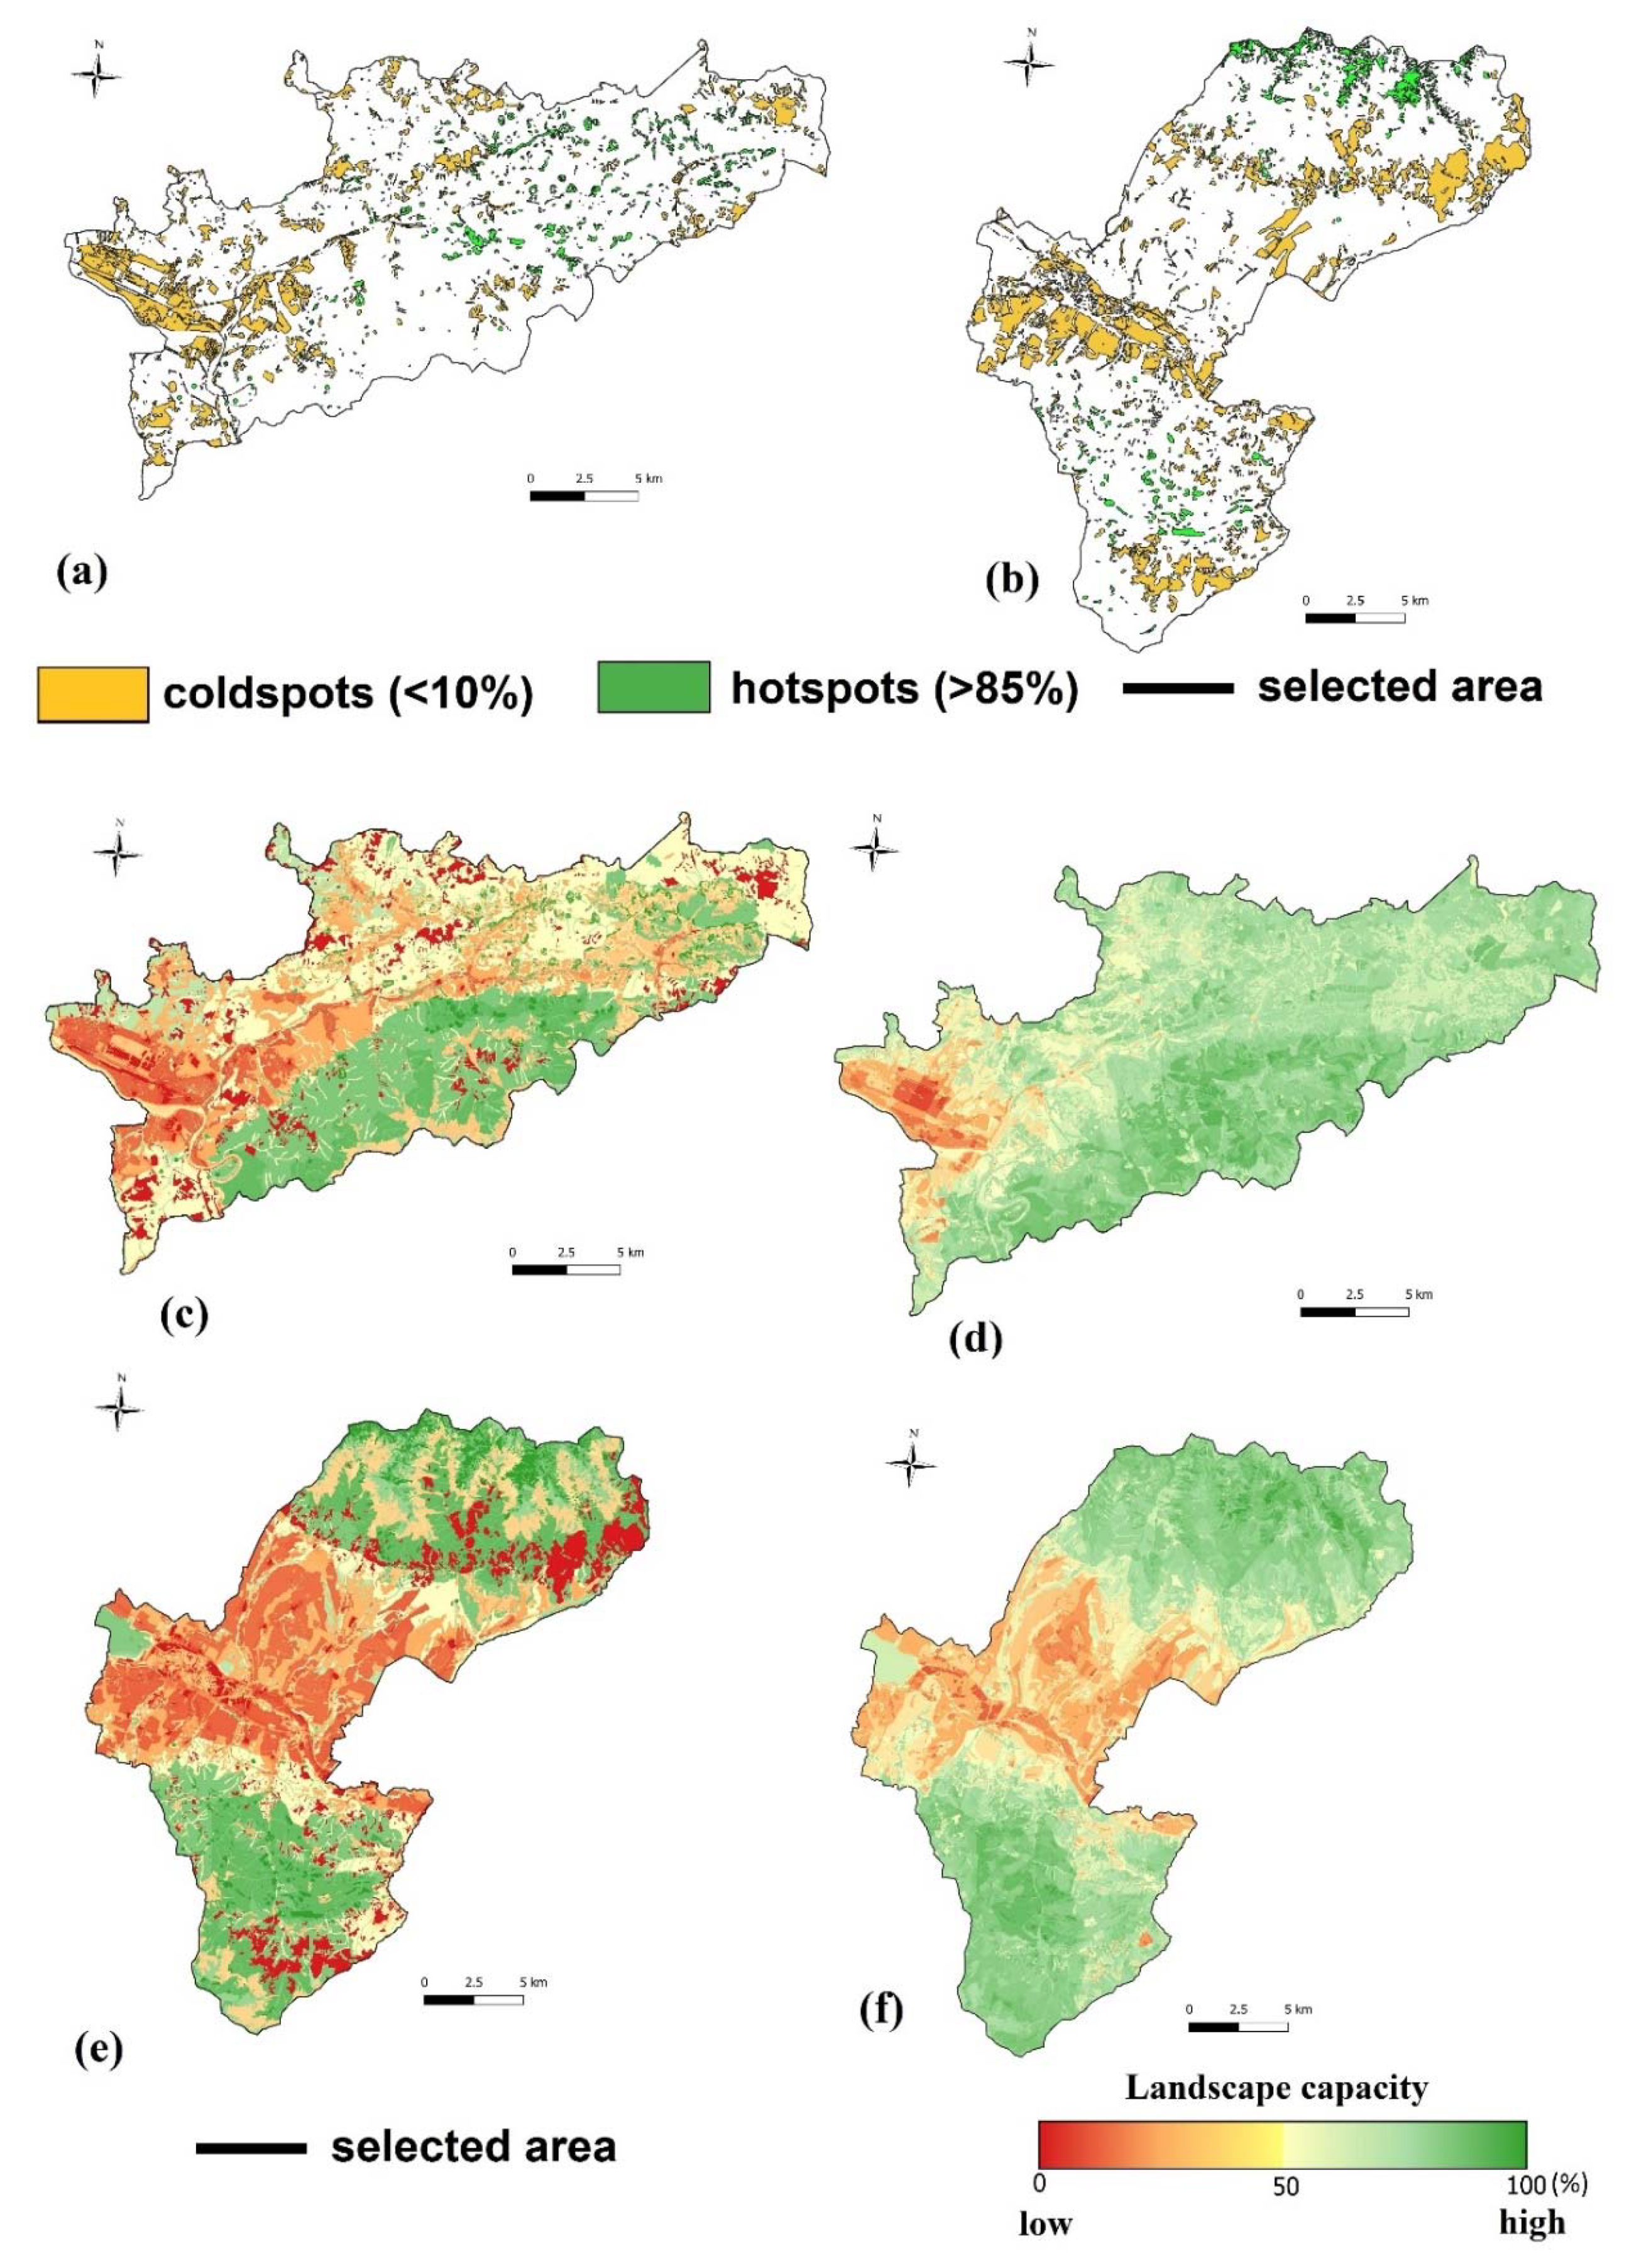
3.2. Landscape Aesthetics

Aesthetics are expressed as subtle, individual emotions, attitudes and perceptions of beauty. This applies to benefits accruing from landscape natural areas. It also includes their capacity to provide different kinds of scenic beauty but still maintain appropriate landscape management. These include the panoramic views and photogenic spots provided by Slovak water bodies, historical landscape structures, rock formations and wonderful mountains. In addition, landscape capacity relies on expert-based land-use ranking by ES matrix. The eco-service supply is then based on the visible properties of observation points, especially those along recreation routes.
Our results indicate that the landscape capacity for this ES is substantially higher in the core and buffer zones of protected regions than in surrounding areas (Figure 3). Hot-spots provide very high capacity to provide aesthetic value, but these are present in only 4.1% of the study area (Figure 3a,b). They include the water bodies, rock formations, forests and grassland in national parks and historical landscape structures and cultural heritage sites. In contrast, landscape cold-spots cover 12.9% of the total area, and they have low to very low capacity to provide aesthetic value. (Figure 3a,b). Cold-spots in the study area includes some agricultural land, built-up areas, industrial and commercial units, dumpsites and mining and forest calamity areas. This contrasts sharply with the National ES assessment which does not acknowledge any of these negative CES values. The national assessment uses different methodologies and emphasis and it has a lower level of detail.

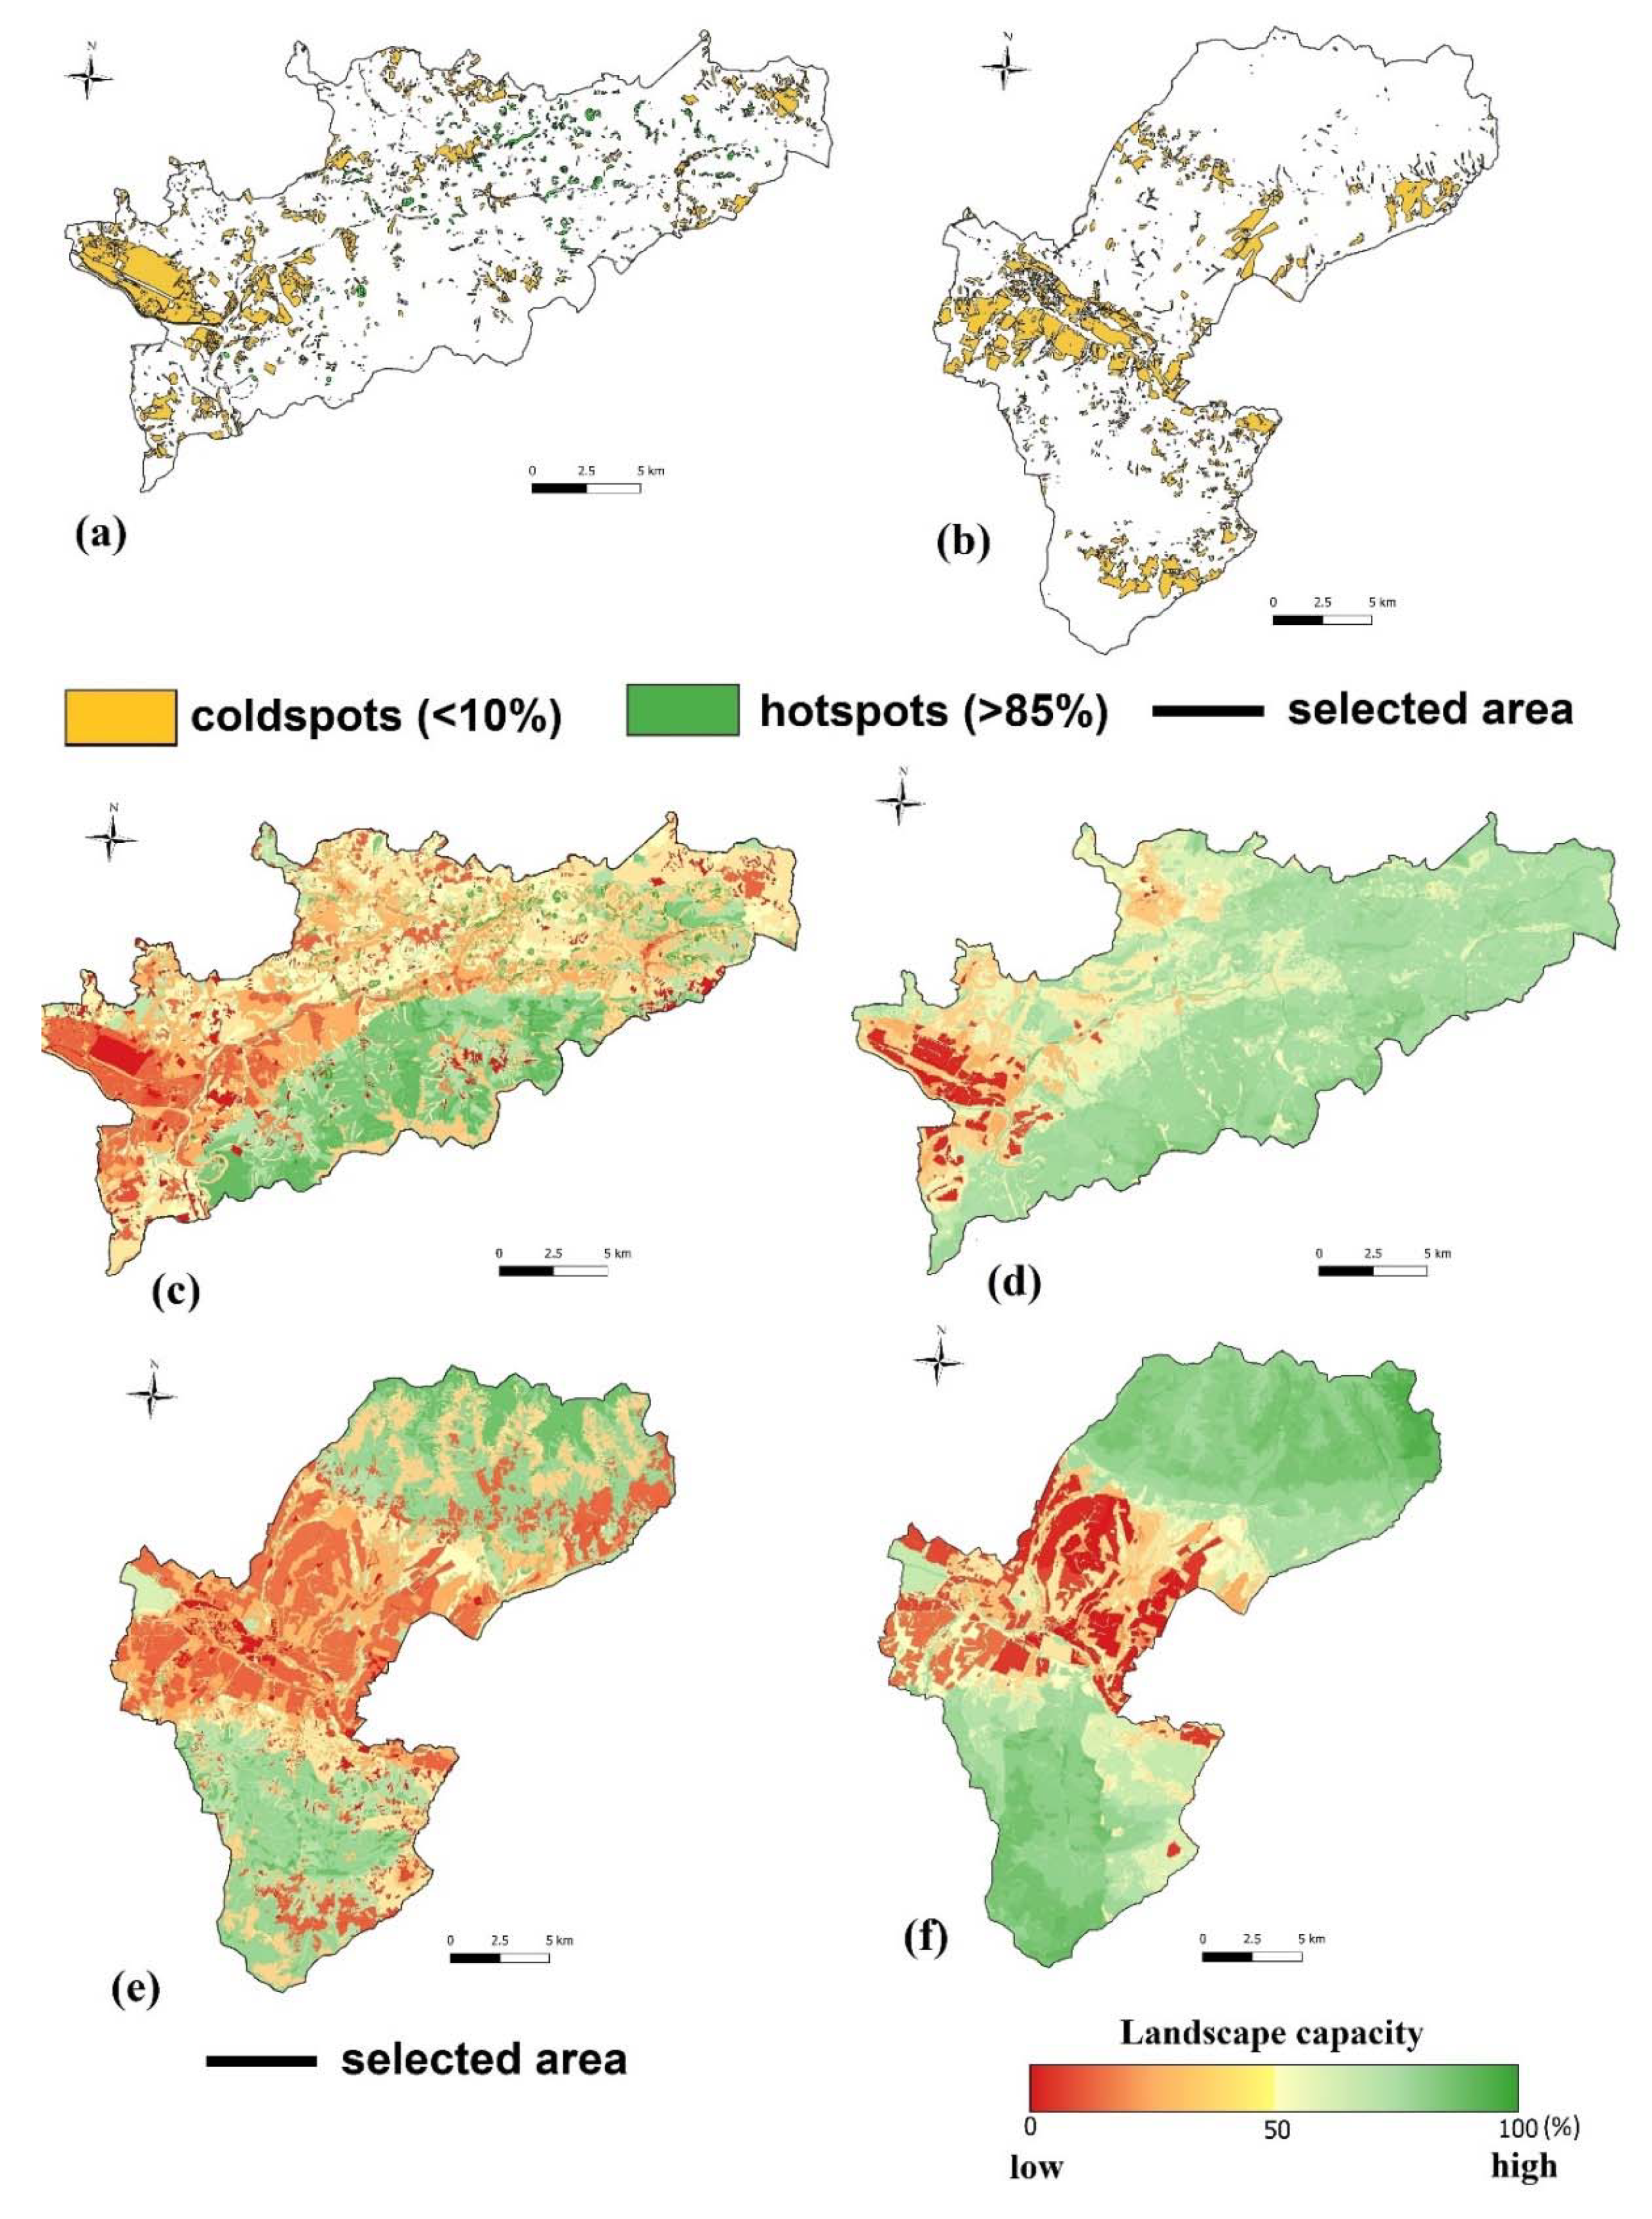
3.3. Natural and Cultural Heritage

We used a limited number of indicators to assess natural and cultural heritage. Our results identify landscapes with selected areas’ cultural and natural heritage hot-spots and cold-spots (Figure 4). Only 0.8% of the total study area has a very high potential to provide this CES.
The most valuable parts in Figure 4 comparison are the protected areas’ positive elements of water bodies, rock formations, historical monument and historical landscape structures. Figure 4a shows that the hot-spot density of cultural and natural heritage is higher in the Terchovská valley micro-region. It highlights that 0.8% of this area has a higher number of dispersed settlements and nature protected areas and less negative sites.
Figure 4 also shows the natural and cultural heritage cold-spots which cover 11.0% of the two areas. These cold-spots particularly affect the capacity of large-block agricultural fields to supply natural and cultural heritage ES. They include the dump-sites and damaged forest from calamitous wind-storm areas not included in the national assessment. Finally, our closer examination of the spatial relationships between heritage values, nature protection, land use and landscape management will help to improve the understanding of cultural ecosystem services in both the scientific community and the general public. This includes the historic influence on landscapes and the enhanced communal sense of place and nature protection.

4. Discussion and Conclusions

Spatially explicit studies are rare in the cultural ecosystem service literature. There is little documentation on how specific landscapes and their features and ecosystem properties contribute to public perception. This absence limits possible benefits for landscape planning and nature protection management [44,45]. Our approach combines analysis and expert estimation of the landscape’s capacity for the provision of recreation facilities and its aesthetic beauty. It also includes the values of the positive and negative landscape elements and utilizes important land use and land cover maps (LULC). This approach most closely resembles national ecosystem services assessments in Slovakia [32] and Russia [13]. However, we provide more detailed data from land cover, and we include the positive and negative elements that influence the selected cultural ecosystem services (CES).
Our mapping of the ecosystem potential for tourism and aesthetic value defines the extent to which Slovakia can potentially supply outdoor recreation services in selected areas. This potential is highly dependent on the spatial distribution of nature protection areas and its limits. It also depends on the quality of natural and semi-natural vegetation. Our results indicate high overall potential, with almost a third of the territory falling in the highest recreational capacity classes with several hot-spot areas. In contrast, the negative elements give uneven spatial distribution. In addition, 38% of the study area has cold-spots in regions with residential buildings, industrial and other artificial habitats, and these have very low CES capacity.
The results highlight the high tourist and aesthetic value of the traditionally used landscapes in the Terchovská valley micro-region dispersed settlements and the nature protected Tatra National Park. Coniferous forests, mixed and deciduous forests and rocks, screes and water areas are essential ecosystem types for national CES provision. However, these landscapes and ecosystems are currently at risk because of the labor-intensive care required and their low economic return. They are also vulnerable to future degradation, especially in remote municipal areas. Therefore, improved management is essential to ensure their future existence and negate the poor spatial extent of traditionally used landscapes. This will also help restore large damaged areas in nature parks and offset massive tourism expansion.
This paper presents the first comparison of Slovak national ecosystem services assessments [32] with a more detailed approach to recreation and landscape aesthetics. These assessments highlight that limitations in the present methods must be counteracted with improved tourist and recreational facilities. These include tourist rest-areas and seating-benches and more accessible pathways and scenic views. In addition to the current land use and land cover detail, future LULC maps should address changes in land use which reflect the low CES values of increased industrial zones, transportation, built-up areas, deforestation and in-growths.
We identified inconsistencies in the comparison of our results and the national ecosystem services assessment [32]. Our approach and results are more critical and stricter than the national assessment. We used specific land use maps and considered the accurate spatial distribution of recreational and cultural–historical attractions in both study areas. Our participatory mapping provides a great amount of information for use in CES mapping at the local and regional scale. A further significant difference between these approaches relates to the mountain areas. From the national perspective, it appears that larger mountain forest areas have a higher capacity to provide CES than our research showed. This is because national assessment uses less detailed and up to date data. Our results confirm that it is imperative to use actual and more detailed data for landscape planning and management at the municipal and regional levels than the data which is available at the national level.
Our approach provides a framework for CES assessment and identification of the areas where the supply of services should be restored and special management implemented. The framework is also adapted to respond to over-reaching national policy and nature-protection goals. The approach aims to promote sustainable regional tourism planning and the cartographic outputs provide additional information on the spatial patterns of CES supply. These patterns particularly include the hot-spots and cold-spots and their altitudinal distribution throughout different regions, as well as the mountain landscapes with their high CES provision.
In addition to other benefits, greater CES knowledge can help both landscape planning and regional development strategies. Our approach to landscape planning reveals values that stakeholders attach to landscapes. These especially include social values often ignored by biophysical and economic ecosystem service assessments. These values were not previously considered in most Slovak local and regional economic and social development planning documents. However, they can provide a significant incentive to owning, using, managing and protecting land. For example, the facilities and activities stimulated by CES in our study areas include the growth of private and public nature reserves, tourism facilities, hobby farms, residential houses and country cottages.
People already perceive and use cultural services but they should understand that the potential of these services is related to the natural and socio-economic environment. Our approach identifies the regions that can promote new activities, such as building new tourism facilities. Alternative landscape protection and maintenance of endangered and protected areas can also be prioritized. Finally, the implementation of these results in the previously mentioned development documents could promote planning and future development in each municipality.
Enterprising improvement can also be initiated by incorporating data from the online Public Participatory GIS (PPGIS) survey. This examines inhabitants’ CES perceptions and it can assess the actual regional CES supply and demand and the participant consumption of these ecosystem services. Finland [8] has already implemented this approach, and has arguably the most elaborate indicator system. The proposed methodology enabled a greater analytic scale, where information on recreation facilities can be included as elements that attract and promote the flow of visitors [41].
Recent scientific developments have also acknowledged social media potential for collecting data on recreation activities and landscape aesthetic beauty. Here, photographs uploaded to image-sharing websites provide information on the visited sites’ spatial distribution, visitor appreciation and locations of the most accessible sites [46,47,48,49,50,51,52,53]. This information can be used in modeling the density of infrastructure for recreation and valuable aesthetic sites. It can also monitor areas that need extra protection to maintain the study regions’ natural and cultural beauty.
Principally, our results provide the most important information base for design, regional implementation and evaluation of land use and nature protection policies. In addition, traditional landscape management can benefit both the state and society with sustainable and environmentally-friendly agro-tourism. Finally, the landscape can be redesigned so that it is more accessible for experiencing all the cultural ecosystem services available in these study areas.

Author Contributions

Conceptualization—G.V. and D.K.; methodology—M.M., P.M. and F.P.; formal analysis—M.M. and P.M.; data curation—G.V., D.K., M.M., P.M. and F.P.; writing—G.V., D.K. and P.M.; visualization—M.M.; supervision—F.P. and P.M.; project administration, funding acquisition and correspondence—F.P. All authors have read and agreed to the published version of the manuscript.

Funding

This research was supported by the APVV grant agency project APVV-17-0377; Assessment of recent changes and trends in the agricultural landscape of Slovakia.

Conflicts of Interest

The authors declare no conflict of interest.

References

  1. Chaudhary, S.; McGregor, A.; Houston, D.; Chettri, N. The evolution of ecosystem services: A time series and discourse-centered analysis Environ. Sci. Policy 2015, 54, 25–34. [Google Scholar] [CrossRef]
  2. MEA. Linking Ecosystem Services and Human Wellbeing; Island press: Washington, DC, USA, 2005; p. 60. [Google Scholar]
  3. Millennium Ecosystem Assessment. Millennium Ecosystem Assessment Ecosystems and Human Well-Being: A Framework for Assessment; Island Press: Washington, DC, USA, 2003; p. 245. [Google Scholar]
  4. De Groot, R.S.; Alkemade, R.L.; Braat, L.; Hein, L.; Willemen, L. Challenges in integrating the concept of ecosystem services and values in landscape planning, management and decision making. Ecol. Complex. 2010, 7, 260–272. [Google Scholar] [CrossRef]
  5. Schröter, M.; Albert, C.; Marques, A.; Tobon, W.; Lavorel, S.; Maes, J.; Brown, C.; Klotz, S.; Bonn, A. National Ecosystem Assessments in Europe: A Review. BioScience 2016, 66, 813–828. [Google Scholar] [CrossRef] [PubMed] [Green Version]
  6. Turner, K.G.; Vestergaard Odgaard, M.; Bøcher, P.K.; Dalgaard, T.; Svenning, J.C.H. Bundling ecosystem services in Denmark: Trade-offs and synergies in a cultural landscape. Landsc. Urban. Plan. 2014, 125, 89–104. [Google Scholar] [CrossRef]
  7. Santos-Martín, F.; García Llorente, M.; Quintas-Soriano, C.; Zorrilla-Miras, P.; Martín-López, B.; Loureiro, M.; Benayas, J.; Montes, M. Spanish National Ecosystem Assessment: Socio-economic valuation of ecosystem services in Spain. Synthesis of the key findings. In Biodiversity Foundation of the Spanish Ministry of Agriculture, Food and Environment; Ministry of Agriculture, Food and Environment: Madrid, Spain, 2016; p. 68. [Google Scholar]
  8. Jäppinen, J.P.; Heliölä, J. (Eds.) Towards a Sustainable and Genuinely Green Economy. The Value and Social Significance of Ecosystem Services in Finland (TEEB for Finland). Synthesis and Roadmap; The Finnish Ministry of Environment: Helsinki, Finland, 2015; p. 144.
  9. Becerra-Jurado, G.; Philipsen, C.; Kleeschulte, S. Mapping and Assessing Ecosystems and Their Services in Luxembourg—Assessment Results; Le Gouvernment du Grand -Duché de Luxembourg: Luxembourg, 2015; p. 74.
  10. UK NEA. The UK National Ecosystem Assessment: Synthesis of the Key Findings; UNEP-WCMC: Cambridge, UK, 2011; p. 87. [Google Scholar]
  11. Burkhard, B.; Kroll, F.; Muller, F.; Windhorst, W. Landscapes‘Capacities to Provide Ecosystem Services—A Concept for Land-Cover Based Assessments. Landsc. Online 2009, 15, 1–22. [Google Scholar] [CrossRef]
  12. Burkhard, B.; Kandziora, M.; Hou, Y.; Müller, F. Ecosystem Service Potentials, Flows and Demands–Concepts for Spatial Localisation, Indication and Quantification. Landsc. Online 2014, 34, 1–32. [Google Scholar] [CrossRef]
  13. Bukvareva, E.; Zamolodchikov, D.; Kraev, G.; Grunewald, K.; Narykov, A. Supplied, demanded and consumed ecosystem services: Prospects for national assessment in Russia. Ecol. Indic. 2017, 78, 351–360. [Google Scholar] [CrossRef]
  14. Rabe, S.-E.; Koellner, T.; Marzelli, S.; Schumacher, P.; Gret-Regamey, A. National ecosystem services mapping at multiple scales—The German exemplar. Ecol. Indic. 2016, 70, 357–372. [Google Scholar] [CrossRef]
  15. Milcu, A.I.; Hanspach, J.; Abson, D.; Fischer, J. Cultural ecosystem services: A literature review and prospects for future research. Ecol. Soc. 2013, 18, 1–34. [Google Scholar] [CrossRef] [Green Version]
  16. Chan, K.M.A.; Satterfield, T.; Goldstein, J. Rethinking ecosystem services to better address and navigate cultural values. Ecol. Econ. 2012, 74, 8–18. [Google Scholar] [CrossRef] [Green Version]
  17. Daniel, T.C.; Muhar, A.; Arnberger, A.; Aznar, O.; Boyd, J.W.; Chan, K.M.A.; Costanza, R.; Elmqvist, T.; Flint, C.G.; Gobster, P.H.; et al. Contributions of cultural services to the ecosystem services agenda. Proc. Natl. Acad. Sci. USA 2012, 109, 8812–8819. [Google Scholar] [CrossRef] [PubMed] [Green Version]
  18. Paracchini, M.L.; Zulian, G.; Kopperoinen, L.; Maes, J.; Schägner, J.P.; Termansen, M.; Zandersen, M.; Perez-Soba, M.; Scholefield, P.A.; Bidoglio, G. Mapping cultural ecosystem services: A framework to assess the potential for outdoor recreation across the EU. Ecol. Indic. 2014, 45, 371–385. [Google Scholar] [CrossRef] [Green Version]
  19. Braat, L.C.; de Groot, R. The ecosystem services agenda: Bridging the worlds of natural science and economics, conservation and development, and public and private policy. Ecosyst. Serv. 2012, 1, 4–15. [Google Scholar] [CrossRef] [Green Version]
  20. Bieling, C.; Plieninger, T.; Pirker, H.; Vogl, C.R. Linkages between landscapes and human well-being: An empirical exploration with short interviews. Ecol. Econ. 2014, 105, 19–30. [Google Scholar] [CrossRef] [Green Version]
  21. Plieninger, T.; Kizos, T.; Bieling, C.; Le DÛ-Blayo, L.; Budniok, M.A.; Bürgi, M.; Crumley, C.L.; Girod, G.; Howard, P.; Kolen, J. Exploring ecosystem-change and society through a landscape lens: Recent progress in European landscape research. Ecol. Soc. 2015, 20, 5. [Google Scholar] [CrossRef] [Green Version]
  22. Martín-López, B.; Gómez-Baggethun, E.; García-Llorente, M.; Montes, C. Trade-offs across value-domains in ecosystem services assessment. Ecol. Indic. 2014, 37, 220–228. [Google Scholar] [CrossRef]
  23. Martín-López, B.; Iniesta-Arandia, I.; García-Llorente, M.; Palomo, I.; Casado-arzuaga, I.; Amo, D.G.D.; Gómez-Baggethun, E.; Oteros-Rozas, E.; Palacios-Agundez, I.; Willaarts, B.; et al. Uncovering ecosystem service bundles through social preferences. PLoS ONE 2012, 7, e38970. [Google Scholar] [CrossRef] [Green Version]
  24. Getzner, M. Economic and cultural values related to protected areas. In Part A: Valuation of Ecosystem Services in Tatra (PL) and Slovensky Raj (SK) National Parks; Department of Economics (Klagenfurt University), Research Report to WWF International (World Wide Funds for Nature): Vienna, Austria, 2009; p. 57. [Google Scholar]
  25. Považan, R. Rekreačné hodnoty NP Veľká Fatra. Acta Univ. Matthiae Belii Séria Envirnomentálne Manažérstvo 2013, 15, 82–94. (In Slovak) [Google Scholar]
  26. Fűzyová, L.; Lániková, D.; Novorolský, M. Economic valuation of Tatras national park and regional environmental policy. Pol. J. Environ. Stud. 2009, 18, 811–818. [Google Scholar]
  27. Getzner, M.; Švajda, J. Preferences of tourists with regard to changes of the landscape of the Tatra National Park in Slovakia. Land Use Policy 2015, 48, 107–119. [Google Scholar] [CrossRef]
  28. Švajda, J.; Getzner, M.; Považan, R. Visitors´ perceptions and economic effects of the Tatra National Parks in Poland and Slovakia. In Visegrad countries—Environmental Problems and Policies; Šauer, P., Dvořák, A., Lisa, A., Eds.; Cenia: Prague, Czech Republic, 2013; pp. 118–126. [Google Scholar]
  29. Považan, R.; Getzner, M.; Švajda, J. Valuation of Ecosystem Services in the NP Muránska Planina (Slovakia)–Case Study (msc); OZ Pronatur: Zvolen, Slovakia, 2014; p. 10. [Google Scholar]
  30. Švajda, J.; Vološčuk, I. Hodnotenie ekosystémových služieb (rekreačné a neúžitkové hodnoty) v Národnom parku Malá Fatra. In Environmentálne indexy, oblasti ekologického záujmu a ekosystémové služby v krajine; VUPOP—Výskumný ústav pôdnoznalectva a ochrany pôdy: Bratislava, Slovakia, 2015; pp. 49–56. (In Slovak) [Google Scholar]
  31. Tutka, J. Ekonomické hodnotenie prírodno-ochranných funkcií lesných ekosystémov. In Aktuálne otázky ekonomiky LH SR; Odborný seminár: Zvolen, Slovak, 2009. (In Slovak) [Google Scholar]
  32. Mederly, P.; Černecký, J.; Špulerová, J.; Izakovičová, Z.; Jančovič, M.; Ďuricová, V.; Stašová, S.; Hreško, J.; Petrovič, F.; Štefunková, D.; et al. Katalóg ekosystémových služieb; Štátna ochrana prírody SR, Univerzita Konštantína Filozofa v Nitre, Ústav krajinnej ekológie SAV: Bratislava, Slovakia, 2019; p. 212. [Google Scholar]
  33. Kopecká, M. Destruction of the Forest Habitat in the Tatra National Park, Slovakia. In Biodiversity Loss in a Changing Planet; Grillo, O., Venora, G., Eds.; InTech: Rijeka, Croatia, 2011; pp. 257–276. [Google Scholar]
  34. Klain, S.C.; Chan, K.M.A. Navigating costal values: Participatory mapping of ecosystem services for spatial planning. Ecol. Econ. 2012, 82, 104–113. [Google Scholar] [CrossRef]
  35. Brown, G.; Raymond, C.M. Methods for identifying land use conflict potential using participatory mapping. Landsc. Urban. Plan. 2014, 122, 196–208. [Google Scholar] [CrossRef]
  36. QGIS 3.8 Development Team. QGIS Geographic Information System. Open Source Geospatial Fundation Project. 2019. Available online: http://qgis.osgeo.org (accessed on 5 March 2019).
  37. Google Maps. Available online: https://www.google.sk/maps (accessed on 16 November 2019).
  38. Mapy.cz. Available online: https://sk.mapy.cz/zakladni?x=19.0729779&y=49.2571053&z=9 (accessed on 16 November 2019).
  39. Petrovič, F.; Bugár, G.; Hreško, J. Zoznam krajinných prvkov mapovateľných na území Slovenska. Geo Inf. 2009, 5, 112–125. (In Slovak) [Google Scholar]
  40. Grass Development Team. Geographic resource Analysis Support System (GRASS) Software, Version 7.8 Open Source Geospatial Fundation. 2019. Available online: https://grass.osgeo.org (accessed on 5 March 2019).
  41. Petrovič, F.; Muchová, Z. The potential of the landscape with dispersed settlement (case study Čadca town). In Proceedings of the Conference on Public Recreation and Landscape Protection—with Man Hand in Hand, Mendel Univ, Brno, 1–3 May 2013; pp. 199–204. [Google Scholar]
  42. Kaisová, D. Dispersed settlement in the village Terchová. In MendelNet 2016, Proceeding of the International PhD. Students Conference, Brno Mendelova Univerzita, Brno, Czech Republic, 9th–10th Nov. 2016; Brno Mendelova Univerzita: Brno, Czech Republic, 2016; pp. 429–434. [Google Scholar]
  43. Kaisová, D.; Jančovič, M.; Nozdrovická, J. Use of dispersed settlement for agricultural tourism in three towns in Čadca District. In Public recreation and landscape protection—with nature hand in hand, Proceeding of the 8th conference, Brno Mendel University, Czech Republic, 1st–3rd May 2017; Brno Mendel University: Brno, Czech Republic, 2017. [Google Scholar]
  44. Scholte, S.S.K.; van Teeffelen, A.J.A.; Verburg, P.H. Integrating socio-cultural perspectives into ecosystem service valuation: A review of concepts and methods. Ecol. Econ. 2015, 114, 67–78. [Google Scholar] [CrossRef]
  45. Maes, J.; Braat, L.C.; Jax, K.; Hutchins, M.; Furman, E.; Termansen, M.; Luque, S.; Paracchini, M.L.; Chauvin, C.; Williams, R.; et al. Report: A Spatial Assessment of Ecosystem Services in Europe: Methods, Case Studies and Policy Analysis—Phase 1 PEER Report No 3 Ispra: Partnership for European Environmental Research; ISPRA: Rome, Italy, 2011; p. 143. [Google Scholar]
  46. Wood, S.A.; Guerry, A.D.; Silver, J.M.; Lacayo, M. Using social media to quantify nature-based tourism and recreation. Sci. Rep. 2013, 3, 7. [Google Scholar] [CrossRef]
  47. Belčáková, I. Strategic environmental assessment—an instrument for better decision-making towards urban sustainable planning. World multidisciplinary civil engineering-architecture-urban planning symposium. Procedia Eng. 2016, 161, 2058–2061. [Google Scholar] [CrossRef] [Green Version]
  48. Izakovičová, Z. Evaluation of the stress factors in the landscape. Ekológia Bratisl. 2000, 19, 92–103. [Google Scholar]
  49. Druga, M.; Falťan, V.; Herichová, M. The purpose of historical land cover change mapping in the territory of Slovakia in the scale 1:10 000—case study of historical cadastral area of Batizovce. Geogr. Cassoviensis 2015, 9, 17–34. [Google Scholar]
  50. Boltižiar, M.; Olah, B.; Gallay, I.; Gallayová, Z. Transformation of the Slovak cultural landscape and its recent trends. In Landscape and Landscape Ecology, 17th International Symposium on Landscape Ecology—Landscape and Landscape Ecology; Institute of Landscape Ecology SAS: Bratislava, Slovakia, 2016; pp. 57–67. [Google Scholar]
  51. Belčáková, I.; Pšenková, Z. Specifics and landscape conditions of dispersed settlements in Slovakia—a case of natural, historical and cultural heritage. In Best Practices in Heritage Conservation and Management From the World to Pompeii: Le vie dei Mercanti: XII Forum internazionale di studi/eds. Carmine Gambardella; La scuola di Pitagora editrice: Neapol, Italy, 2014; pp. 261–268. ISBN 978-88-6542-347-9. [Google Scholar]
  52. Slamová, M.; Belčáková, I. The Role of Small Farm Activities for the Sustainable Management of Agricultural Landscapes: Case Studies from Europe. Sustainability 2019, 11, 5966. [Google Scholar] [CrossRef] [Green Version]
  53. Skladaná, P.; Havlíček, M.; Dostál, I.; Skladaný, P.; Tucka, P.; Perútka, J. Land Use as a Motivation for Railway Trespassing: Experience from the Czech Republic. Land 2018, 7, 1. [Google Scholar] [CrossRef] [Green Version]
Figure 1. Location of the study areas in the Slovak Republic.
Sustainability 12 02138 g001
Figure 2. The landscape capacity for recreation and tourism in selected study areas. The landscape (a) hot-spots and cold-spots in the Terchovská dolina micro-region and (b) Horný Liptov region; (c) our approach in (a) above; (d) national assessment approach in (a) above; (e) our approach in (b) above; (f) national assessment approach in (b) above.
Sustainability 12 02138 g002
Figure 3. The landscape capacity for aesthetics in the selected study areas. (a) Hot-spots and cold-spots of the Terchovská dolina micro-region and (b) Horný Liptov region; (c) our approach in (a) above; (d) national assessment approach in (a) above; (e) our approach in (b) above; (f) national assessment approach in (b).
Sustainability 12 02138 g003
Figure 4. The landscape capacity of natural and cultural heritage in selected study areas. (a) Hot-spots and cold-spots of the Terchovská dolina micro-region and (b) Horný Liptov region; (c) our approach in (a) above; (d) national assessment approach in (a) above; (e) our approach in (b) above; (f) national assessment approach in (b) above.
Sustainability 12 02138 g004
Table 1. Positive and negative elements that influence ecosystem capacity to produce selected cultural ecosystem services (CES).
Positive ElementsRecreation and TourismAestheticNatural and Cultural Heritage
sacred monumentsxxx
war monumentsxxx
water bodyxxx
green urban areasxxx
geo-morphological formationsxxx
rock climbing areasx
tourist trailsx
cycle routesx
educational trailsx
cross-country skiing trailsx
historical landscape structuresxxx
protected trees xx
viewpointxxx
tourist features; benches, picnic shelters and fireplaces...x
accommodation facilities and restaurantsx
Negative ElementsRecreation and TourismAestheticNatural and Cultural Heritage
railwaysxx
roadsxx
highwaysxx
construction sitesxx
dump sitexxx
agricultural estatesxx
agricultural objectsxx
industrial estatesxx
industrial objectsxx
destructed areaxx
mining areas xx
small water power plantsxx
manure heapsxx
timber harvesting/calamityxxx
x = Elements included in the assessment.

