Capturing a Complexity of Nutritional, Environmental, and Economic Impacts on Selected Health Parameters in the Russian High North


School of Economics and Management, Harbin Engineering University, Harbin 150001, China
*
Author to whom correspondence should be addressed.
Sustainability 2020, 12(5), 2151; https://0-doi-org.brum.beds.ac.uk/10.3390/su12052151
Submission received: 24 January 2020
/
Revised: 8 March 2020
/
Accepted: 9 March 2020
/
Published: 10 March 2020
(This article belongs to the Collection Sustainable Economic Development: Challenges, Policies, and Reforms)
Abstract
:The rapid pace of economic exploration of the Arctic against the backdrop of progressing environmental change put a high priority on improving understanding of health impacts in the northern communities. Deficiencies in the capability to capture the complexity of health-influencing parameters along with a lack of observations in circumpolar territories present major challenges to establishing credible projections of disease incidence across varying northern environments. It is thus crucial to reveal the relative contributions of coacting factors to provide a basis for sustainable solutions in the sphere of public health. In order to better understand the adverse effects associated with public health, this study employed six-stage multiple regression analysis of incidence rates of fourteen diseases (International Classification of Diseases (ICD-11) codes most widespread in the Russian Arctic) against a set of environmental, nutritional, and economic variables. Variance inflationary factor and best-subsets regression methods were used to eliminate collinearity between the parameters of regression models. To address the diversity of health impacts across northern environments, territories of the Arctic zone of Russia were categorized as (1) industrial sites, (2) urban agglomerations, (3) rural inland, and (4) coastline territories. It was suggested that, in Type 1 territories, public health parameters were most negatively affected by air and water pollution, in Type 2 territories—by low-nutrient diets, in Type 3 and Type 4 territories—by economic factors. It was found that in the Western parts of the Russian Arctic, poor quality of running water along with low access to the quality-assured sources of water might increase the exposure to infectious and parasitic diseases and diseases of the circulatory, respiratory, and genitourinary systems. Low living standards across the Russian Arctic challenged the economic accessibility of adequate diets. In the cities, the nutritional transition to low-quality cheap market food correlated with a higher incidence of digestive system disorders, immune diseases, and neoplasms. In indigenous communities, the prevalence of low diversified diets based on traditional food correlated with the increase in the incidence rates of nutritional and metabolic diseases.
1. Introduction
Over the previous decades, many studies, including those conducted in the framework of the Arctic Monitoring and Assessment Program (AMAP), have explored major aspects of public health in circumpolar communities, as well as assessed various stressors on human populations living in the North [1]. The Arctic, however, is changing rapidly in many ways. The once established patterns are transforming and bringing new potential risks to human health, such as contaminants, climate change, industrialization, urbanization, economic disruptions, and nutritional transitions. Among the current health effects, whose study is prioritized by the AMAP, are immunological, neurobehavioral, cardiovascular, metabolic, diabetogenic, developmental, reproductive, endocrine, and epigenetic [2]. To address the diversity of ongoing changes, there is a need to investigate multivariate interactions of environmental contaminants, dietary nutrients, and other factors and reveal their combined effects on health outcomes across Arctic communities [3].
Air pollution in the Arctic has been emerging as one of the threats to ecosystems and public health since the 1950s [4]. According to Arnold et al. [5], Arctic air pollution includes harmful trace gases, such as tropospheric ozone, particles, such as black carbon and sulfate, and toxic substances, such as polycyclic aromatic hydrocarbons. They are responsible for detrimental effects on human health even at low concentrations [6,7], ranging from physiological changes in pulmonary functions and the respiratory and cardiovascular systems to premature death [8]. Pope et al. [9] and Dockery et al. [10] found out that long-term exposure to fine particles and sulfur oxide-related air pollution was positively associated with death from lung cancer and cardiopulmonary. Naess et al. [11] discovered the particularly strong effects of the concentration of air pollution on chronic obstructive pulmonary disease.
Increased air pollution due to the ongoing industrialization and urbanization in the Arctic creates new challenges in relation to the quality of water, sanitation, and wastewater handling [12]. According to Dudley et al. [13] and Parkinson et al. [14], environmental disruptions in the North could spur the discharge of pathogenic microorganisms from wastewater treatment systems into marine and freshwater environments, emerging human health risks. Out of four types of water and infectious diseases categorized by White et al. [15], two are believed to be of crucial importance in the Arctic: waterborne infectious acquired by consumption of contaminated water and water-washed diseases acquired through person-to-person spread that can be interrupted by the use of water for washing [16]. Hennessy et al. [17] demonstrated a direct positive association between the lack of complete plumbing and higher incidence rates of respiratory and skin infections. The households with in-home water service have lower infant hospitalization rates for pneumonia and respiratory syncytial virus [18]. An exposure to inappropriately treated wastewater is recognized as one of the reasons for higher rates of infectious diseases in circumpolar communities, such as tuberculosis and methicillin-resistant Staphylococcus aureus [19,20].
The majority of previous studies on environmental impacts on health in the Arctic focused mainly on persistent organic pollutants (POPs) and metals [2,21]. Stockholm Convention recognizes that Arctic ecosystems and indigenous communities are particularly at risk because of the biomagnification of POPs [22]. However, identified threats from POPs and other contaminants have emerged public health concerns in the Arctic and reduced confidence in understanding the full picture of environmental impacts on health [23]. Apart from POPs, the Arctic environment is increasingly affected by new chemicals of emerging concern (CECs), such as current use pesticides, pharmaceuticals, and personal care products, and per- and polyfluoroalkyl substances [24], but current understanding of their health outcomes is limited. In large parts of the Arctic, for some CECs, there is a general lack of toxicological and other data that are needed to better understand health issues related to such compounds and for health risk assessments [25]. For instance, no reliable environmental data have been available from Russia, where spatial and temporal patterns of air pollutant emissions and wastewater discharge are poorly reported by the manufacturers and thus remain generally unknown. Arctic zone of Russia is one of the major centers for the production of fluoropolymers with manufacturers that have not signed on to stewardship programs to reduce long-chain perfluoroalkyl carboxylic and sulfonic acids in products [26]. For some CECs used in consumer products (siloxanes and phthalates), concentrations have been found to be higher near settlements and urban sites, particularly, in receiving waters impacted by sewage effluents [22,25].
Alongside with air and water pollution, the fact of poorer nutritional status of people in the Arctic communities of Russia compared to other parts of the country is believed to be one of the most adverse impacts on public health [27,28]. A poor-quality diet has long been associated with increasing obesity, diabetes, and glucose intolerance in many circumpolar communities [29]. In the Arctic zone of Russia, there are critical gaps in per capita consumption of milk and dairy products (about 55% below the national average), eggs, potatoes, and bread (45% lower each), and meat and meat products (30% lower) [30]. Due to the shortages of milk and dairy products, vegetables, and fruits, there is a shift of macronutrients in the diet towards carbohydrates (an abundance of sugar, confectioneries, bread, pasta, cereals) and, therefore, a lack of almost all types of vitamins, mineral nutrients (particularly calcium, phosphorus, magnesium, potassium, iodine, zinc, fluorine, etc.), and contamination of food by pesticides, metals, antibiotics, nitrates, and biological agents.
Many studies have advocated traditional food as a premier source of healthy diets and improvement of public health parameters in indigenous communities. Kuhnlein et al. [31] and Lambden et al. [32] considered traditional food as critical for providing many essential nutrients in balanced diets and recognized the progressing transition to high-energy market food in circumpolar communities as a basis for obesity and other related health problems. However, due to climate change and environmental pollution, traditional food is becoming a less obvious solution to health problems in the North. Concentrations of some CECs are increasing in Arctic air and wildlife, indicating their potential for bioaccumulation and biomagnification, including in food webs [33]. Climate change acts through alteration of food web pathways for contaminants [34], while pollution increases the risk of disease transfer from animals to humans as a large volume of marine and terrestrial wildlife is consumed by humans in the Arctic, often raw and inadequately frozen [35]. Dudarev et al. [36,37] found that blubber of marine mammals in Chukotka was highly contaminated by POPs and some metals, which was the reason for the high exposure to those contaminants by indigenous people whose diets included marine mammals. The higher temperature of ocean water moves warmer marine species towards the northern latitudes [38]. Along with the change of the polar water habitats and the effect of ocean acidification, such migrations bring new biological threats to the health of the Arctic inhabitants (diseases and microorganisms previously not met in the North).
Along with the environmental and nutritional imbalances, northern territories report higher morbidity and incidence rates of many diseases and health disorders compared to the national average [39,40] (Figure 1).
The major health issues are the diseases of the respiratory, genitourinary, and digestive systems (Table 1); the extremes recorded in the Nenets and Yamal-Nenets autonomous districts.
While Schmale et al. [42], Law and Stohl [43], Shindell et al. [44], and Kuhnlein et al. [31], among others, conducted the estimates of Arctic-specific disease incidence through environmental and nutritional impacts, a question remains whether particular public health parameters might experience the effects of economic factors [45]. Chen and Kan [8] recognized the people with low socioeconomic status as high-risk subgroups in terms of proneness to respiratory, cardiovascular, and other health effects. During the times of economic and social transformations in Russia in the 1990–2000s, the environmental situation in the Arctic deteriorated substantially with by-all-means emergence of extractive industries. Larsen and Fondahl [46] expected that the industrialization and urbanization trends in the Arctic accelerate in the future. The emissions of air pollutants and wastewater discharge will increase and mostly be emitted around existing industrial sites and human settlements. Due to the environmental disruptions of traditional sources of food and water, circumpolar communities have become increasingly vulnerable to economic insecurity [47]. Morozova et al. [48], Erokhin [49], and Liefert and Liefert [50] reported degrading purchasing power of population in Russia, which resulted in the redistribution of family means in favor of food, as well as a shift to less expensive food products and more affordable sources of proteins of lower quality and nutrition value [51,52].
Another question that emerges is whether particular circumpolar territories might have health impacts different from other Arctic regions and whether populations in various environmental and economic patterns respond differently to the varying combinations of influence parameters. One of the priorities declared by the AMAP Human Health program is tailoring health-related studies in the Arctic to address local issues [2]. Adlard et al. [3] and Weihe et al. [53] made a similar recommendation to consider local specifics and allowed for better cross-territorial comparisons. Chowdhury and Dey [54] and Schmale et al. [42] found that disease incidence rates varied dramatically between Arctic countries but also between the territories within a country. As the per-territory disruptions of public health are becoming increasingly complex, identifying individual factors that affect them is crucial [55,56]. In this study, an attempt was made to capture overlapping environmental, nutritional, and economic dimensions and understand their impacts on selected diseases in different types of circumpolar territories.
2. Materials and Methods
Based on the previous discussion of diversified public health impacts in the Arctic, the authors applied multiple regression analysis to reveal the variables Xn that affect the incidence rates of health disorders Yn. The six-stage algorithm was employed (Figure 2).
The study started with a selection of Xn regressors to be considered for inclusion in the model and development of the regression model (Stage 1). To avoid redundancy, variance inflationary factor (VIF) was computed for each Xn at Stage 2. Based on the criteria developed by Snee [57] and further applied by Kutner et al. [58], Montgomery et al. [59], and Ermakov et al. [60], that VIF values should be less than 5, those Xn for which VIF > 5 were excluded from the model. At Stage 3, a best-subsets regression was performed with the remaining Xn for all models. To finalize the collinearity test, the parameters of adjusted R2 [61,62] and Mallows’ Cp statistic [63,64,65,66] were computed for each subset. The subsets with Cp > (k + 1) were eliminated; the study proceeded with those “best” subsets for which relative Cp were the lowest and/or adjusted R2 were high. At Stage 4, multiple regression analysis of the models chosen was performed across Yn regressands and territories. The revealed correlations allowed us to categorize the territories based on several parameters (Stage 5) and discover the effects of Xn regressors on Yn regressands (Stage 6).
2.1. Stage 1
The categorization of major types of diseases was made according to the 11th revision of the International Statistical Classification of Diseases and Related Health Problems (ICD-11) [67] of the World Health Organization (WHO). Out of 26 ICD-11 codes, fourteen types of diseases were included in the study as Yn regressands—those repeatedly reported by the WHO and many scholars among the most widespread health problems in both indigenous communities and urban settlements in the Arctic [68,69,70] (Table 2).
An array of Xn regressors was established along with three types of variables, reflecting environmental (X1–6), nutritional (X7–12), and economic (X13–16) dimensions of health-related effects (Table 3).
Physical environment, including quality of the air, safe drinking water, and adequate sanitary facilities, is one of the critical parameters of public health in the Arctic [71,72]. Despite the large gaps and significant uncertainties, which exist around quantification of influence of Arctic air pollution on public health [6], emissions can be severe, negatively affecting public health [42], particularly around the Russian cities of Norilsk, Vorkuta, and Monchegorsk, the areas of highest air pollution in the Arctic [5,73]. Nilsson et al. [47], Parkinson and Butler [74], and Thomas et al. [75] reported waterborne infectious diseases among the people living in the circumpolar territories in many Nordic countries.
Nutritional effects on health are measured as per capita consumption of major food products, including meat, fish, dairy, vegetables, and bread [49,76]. A parameter of traditional food proportion in a diet was included in the array like the one relevant in circumpolar and, particularly, indigenous communities. Many authors consider traditional food systems as essential sources of nutrients, n-3 polyunsaturated fatty acids [77], and vitamins C, B2, and B12 [78]. Sheehy et al. [79] reported that more traditional foods in a diet translated into greater dietary adequacy for proteins and a number of vitamins and minerals, including vitamin A, several B-vitamins, iron, zinc, magnesium, potassium, sodium, and selenium. According to Wesche and Chan [80], traditional food reduces the intake of saturated fats, sucrose, and excess carbohydrates that often are found in marketed food. However, while most of the studies report health advantages of traditional food patterns, including a lower incidence of cardiovascular disease [81], stability of gut microbiome [82], sources of bioavailable iron [83], among others, there are alternative findings of adverse health effects of traditional food. For instance, Jeppesen et al. [84] concluded that traditional food was positively associated with type 2 diabetes mellitus, impaired fasting glucose, and fasting plasma glucose. Bjerregaard et al. [85] found that impaired fasting glucose increased among the Inuit in Greenland with the consumption of traditional marine food, which might result in impaired insulin secretion – a link revealed by Færch et al. [86] and Weyer et al. [87,88]. Jørgensen et al. [89] discovered a strong association between persistent organic pollutants in a traditional seafood and low insulin secretion, while Kuhnlein [90] found higher health risks of traditional food systems containing sea mammals due to environmental pollution and increased organochlorine consumption. Contamination of traditional food sources is one of the reasons for lower β-cell function, an important early stage in the development of type 2 diabetes mellitus.
Among economic variables, the real value of cash incomes is used as one of the parameters of the economic accessibility of adequate healthcare services and nutrition [91]. The proportion of the population living below a minimum subsistence income along with the proportion of food expenditures in total household expenditures is the measures of economic accessibility of a healthy diet, which are commonly used by the Food and Agriculture Organization of the United Nations (FAO) [92]. They were included in the array to reflect the ability of households to generate sufficient income, which, along with their own production, can be used to meet food needs. The selection was also based on the idea that within a monetary dimension, access to food required a steady income to ensure a consistent, year-round supply of high-quality goods in the stores and a ready supply of healthy wildlife to be harvested [93]. Indigenous people do not rely much on marketed food; their food expenditures are low. But they still have to deal with the high cost of many commodities, such as oil, fuel, and transportation, essential for hunting, fishing, or reindeer herding activities [33]. Since the primary means for obtaining and producing food in indigenous communities are provided by hunting, herding, fishing, and gathering activities, a presence of a hunter, a herder, or a fisherman in a family is used as one of the economic regressors.
For all Yn and Xn, the data were obtained from the Federal Service of State Statistics of the Russian Federation [41], as well as from the authors’ calculations.
2.2. Stage 2
A critical issue in building multiple regression models is how to eliminate independent variables with strong correlations between each other, whether positive or negative. Identification of collinear variables involves several approaches, one of the most widely used being the variance inflationary factor (VIF) (Equation (1)). It has been successfully applied for measuring and reduction collinearity, for instance, by Zainodin et al. [94] in an ordinary least squares regression analysis, Bowerman and O’Connell [95] in expressing independent variables in regression models as the functions of the remaining regressors, and Dan and Vallant [96] in the analysis of variances between independent variables in complex survey data.
where VIF = variance inflationary factor; = coefficient of multiple determination for a regression model.
According to Snee [57], Kutner et al. [58], Montgomery et al. [59], and Levine et al. [61], collinearity between the variables is considered high when VIF exceeds 5. The approach used at Stage 2 was that if VIF for a particular set of Xn regressors was less than 5, these regressors were included in the model. In case it was not, the Xn variable was eliminated from a subset. The computation was made across eight subsets of Xn variables, one per territory included in the study (see Stage 4 for the list of territories).
2.3. Stage 3
Having eliminated the variables with high VIF, we then attempted to determine whether the resulting subsets all yield appropriate models with low redundancy. Most commonly, such a task is solved by employing stepwise regression, which allows revealing the optimal regression model without examining all subsets [97,98,99,100]. For many decades, this approach to regression model building has been extensively used in statistics and econometrics as an appropriate trade-off between time expenditures and model performance [101,102,103]. Nowadays, a stepwise regression model building commonly employs the best subsets approach (BSA) that allows evaluating all possible regression models for a given set of regressors in a timely-effective and accurate manner [104,105,106].
Generally, the BSA-based checking of regression models involves a parameter of adjusted R2 [107], which adjusts the R2 of each subset to account for the number of regressors and the sample size [61]. In this study, the employment of adjusted R2 instead of R2 was preferable due to the need to compare Stage 2 subsets with different numbers of Xn. Among the competing subsets, the study proceeded with the one with the largest adjusted R2. In addition to adjusted R2, when the goal is to find the most appropriate model involving multitude subsets of regressors, a criterion of Mallows’ Cp statistic (Equation (2)) is generally applied [60,61]. Examples include checking matchings between the subsets [108], model averaging [109,110,111], measuring the deviations from perfect rankings [112], and model selection [113].
where Cp = Mallow’s Cp statistic; n = number of observations; k = number of regressors; T = total number of variables in the full model, including the intercept; = coefficient of multiple determination for a model with k regressors; = coefficient of multiple determination for a model with all T variables.
In this study, Cp was applied as a tool to measure the differences between the models constructed at Stage 2 and optimal (or true) models that best explain the correlations. The idea was that the closer Cp to the number of variables included in a subset, the more accurate would be the model (only random differences from the optimal model might occur). Thus, Stage 3 resulted in identifying the subsets whose Cp were close to or below (k + 1). In total, eight subsets of independent Xn variables were built for eight territories.
2.4. Stage 4
At Stage 4, multiple regression analysis was performed for all combinations of the selected non-collinear Xn aggregated in fourteen multitudes separately for each Yn. The aim was to reveal the variables with the highest positive, positive, negative, and the most negative effects on respected Yn in the Russian Arctic, in general, as well as separately in eight territories included in the Arctic zone of Russia (Figure 3):
- Territory 1: Murmansk region;
- Territory 2: Arkhangelsk region (Arkhangelsk, Mezensk municipal area, Novaya Zemlya, Novodvinsk, Onezh municipal area, Primorsk municipal area, Severodvinsk);
- Territory 3: Nenets Autonomous District;
- Territory 4: Komi Republic (Vorkuta municipal area);
- Territory 5: Yamal-Nenets Autonomous District;
- Territory 6: Krasnoyarsk Krai (Norilsk, Taimyr Dolgan-Nenets municipal area, Turukhansk district);
- Territory 7: Republic of Sakha (Yakutia) (Allaikhovsky district, Anabar national (Dolgan-Evenk) district, Bulunsky district, Nizhnekolymsky district, Ust-Yansky district);
- Territory 8: Chukotka Autonomous District.
2.5. Stage 5
To reflect the division of regressors into three dimensions and make cross-country comparisons possible, the diversity of effects on public health was addressed by categorizing the territories based on the respective parameters:
- Type 1: territories adjacent to industrial agglomerations, where a level of air and water pollution was higher compared to the mean of the sample.
- Type 2: territories adjacent to urban agglomerations, where a share of market food in consumption was higher compared to the mean of the sample.
- Type 3: rural inland territories, where the traditional diets of indigenous people were based on meat.
- Type 4: rural coastline territories, where the traditional diets of indigenous people were based on fish and marine mammals.
It was supposed that, in different types of territories, the incidence rates of Yn diseases and related health problems were affected by different Xn variables, particularly:
Hypothesis 1 (H1):
In Type 1 territories, the strongest influence over Yn is exerted by environmental variables X1–6.
Hypothesis 2 (H2):
In Type 2 territories, the strongest influence over Yn is exerted by nutritional variables X7–12.
Hypothesis 3 (H3):
In Type 3 and Type 4 territories, the strongest influence over Yn is exerted by economic variables X13–16 and traditional food proportion in a diet X12.
2.6. Stage 6
To test the hypotheses, positive and negative impacts of Xn variables on the reduction of incidence rates of Yn were revealed separately for the four types of circumpolar territories. Positive effects were differentiated as high positive (HP), positive (P), and moderately positive (MP); the negative ones—extremely negative (EN), negative (N), and moderately negative (MN). To decide on the degree of positive or negative effect, maximum and minimum extremes (Xmax and Xmin, respectively) were excluded from the calculation, and then a mean value Xmed was determined for each of the multitudes (Equation (3)):
A degree of the effect of Xn on Yn was recognized, when a value of Xn fell into one of the intervals (Table 4).
3. Results
The results are presented across five sub-sections in accordance with stages 2–6 of the study flow algorithm (Figure 2). We first checked the array of Xn variables established at stage 1 for collinearity (Section 3.1.), then selected the best subsets from derived multitudes (Section 3.2.). After that, we performed multiple regression analysis in selected subsets and generalized the effects of Xn on Yn for the entire Arctic Zone of Russia (Section 3.3.). Based on the identified correlations, we then categorized the territories into types (Section 3.4.), revealed positive and negative determinants of incidence rates across them, and tested out hypotheses (Section 3.5.).
3.1. Checking Xn for Collinearity
Collinearity checks were performed in 128 multitudes of X1–16 variables in eight territories included in the study. Regression models were computed with all independent variables to find VIFs. Application of VIF > 5 criteria resulted in the elimination of high-collinear Xn variables from the models in respective territories (Table 5)—some of the water-use and environmental variables in the western and central territories of the Russian Arctic and economic variables in the Far East.
3.2. Selection of the Best Subsets
Best-subsets stepwise regression with the remaining Xn allowed to identify several more variables with high collinearity: X13 in territories 1 and 2, X5 in territory 2, X3 in territory 3, X4 in territory 5, and X4 in territory 6. Based on the parameters of adjusted R2 and Mallows’ Cp statistic, the best subsets of variables (one per territory) were chosen out of competing multitudes (Table 6).
3.3. Multiple regression
Multiple regression analysis was performed in 112 multitudes (fourteen Yn regressands and eight territories) with respective adjusted arrays of independent variables. High R2 in individual multitudes and average R2 demonstrated that all variations were well explained (Table 7).
Generalization of Xn values for eight territories allowed to reveal the health-related effects of independent variables in the entire Arctic Zone of Russia (Table 8). X6, the percentage of households with available sources of running water, posed the most diverse effects on selected health parameters, from the highest positive to the most negative. Air and water pollution massively had a net detrimental effect on the incidence rates of the diseases under study (excluding X4 eliminated from the subsets in most of the western territories of the Arctic Zone and X2 not considered in territories 3, 5, and 6). Economic parameters (excluding high-collinear X15 and X16 in the eastern areas of the Arctic Zone) made a positive impact on the reduction of the incidence rates. The effects of nutritional variables varied across Yn, the most positive being consumption of fish and marine mammals in case of the diseases of the circulatory and nervous systems.
3.4. Categorization of the Territories
Categorization based on the level of pollutant emissions, the proportion of market food in the diets, and the per capita consumption of meat and fish allowed to classify four types of territories (Table 9).
Type 1 territories were those most intensively explored by Russian hydrocarbon and mineral companies. The group included the territories of Yamal-Nenets Autonomous District and three areas of Krasnoyarsk Krai-Norilsk and Taimyr Dolgan-Nenets municipal areas and Turukhansk district, where the highest level of air pollutant emissions was registered. The percentage of households with access to quality-assured sources of water was low. In territory 6, the volume of wastewater discharge into the surface and underground water sources was the highest in the Russian Arctic.
Type 2 included the territories of Murmansk and Archangelsk oblasts adjacent to the biggest cities and seaports in the Russian North, Murmansk, and Archangelsk, respectively. In Type 2 territories, people had predominantly westernized type of nutrition with a low proportion of traditional foods in their diets. Due to the low standards of living in Type 2 territories (in 2017, the proportion of the population living below a minimum subsistence income was 18.0%, 15.0%, and 13.5% in Komi Republic, Arkhangelsk, and Murmansk regions, respectively), there was registered underconsumption of meat and dairy products and vegetables.
Inland territories of Russian Arctic relatively remote from either urban or industrial agglomerations were recognized as Type 3 (Republic of Sakha) and Type 4 (Chukotka and Nenets autonomous districts). In Type 3 and 4 territories, diets of people were more traditional compared to the western parts of the Russian North, with a predominance of reindeer meat, fish, and marine mammals. The Yakuts are historically semi-nomadic hunters engaged in animal husbandry, focusing on reindeer herding [114], while people in Type 4 territories depended on fishing. In Chukotka, per capita consumption of meat was the lowest in the Russian Arctic—44 kg/year in 2017.
Despite the relatively similar reliance of diets on traditional food in Type 3 and Type 4 territories, the average incidence rates of diseases under study varied widely (Table 10). This finding supported the assumption that in different types of circumpolar territories, public health parameters are affected by different combinations of factors, nutritional ones being but a few of them.
3.5. Revealing the Correlations
To reveal the determinants of varying incidence rates across the four types of territories, the impacts of Xn factors were graded on a scale from high positive to extremely negative. Based on the previous results of collinearity checks and categorization of the territories, the following independent variables were eliminated from the models: in Type 1 territories—X2 and X4; in Type 2 territories—X4 (X6 and X13 were considered in territory 4 only, X5—in territory 1); in Type 3 territories—X15 and X16. The highest positive impact on public health was exerted by the quality of nutrition (consumption of fish and marine mammals and vegetables) in Type 1 and Type 3 territories, economic variables of income, poverty, and food expenditures in Type 2 and Type 3 territories, and quality of running water supply and wastewater treatment in Type 3 and Type 4 territories (Table 11).
The most negative impact on public health was exerted by low percentage of households with the running water supply in Type 1, 2, and 4 territories, wastewater discharge into surface and underground water reservoirs in Type 4 territories, consumption of meat products in Type 1 and 2 territories and bread in Type 2 territories, and low economic standards of living in Type 3 and 4 territories (Table 12).
The revealed correlations between Xn variables and Yn health parameters allowed to test the hypotheses:
Hypothesis 1 (H1):
partly confirmed. Out of the environmental variables X1–6, the quality of running water and wastewater treatment have the most positive effect on the reduction of incidence rates of certain infectious and parasitic diseases; neoplasms; diseases of the nervous system; diseases of the skin and subcutaneous tissue; congenital malformations, deformations, and chromosomal abnormalities. Improvement of the access to the quality-assured sources of water decreases incidence rates of endocrine, nutritional, and metabolic diseases; diseases of the circulatory, respiratory, and genitourinary systems; diseases of the musculoskeletal system and connective tissue.
Hypothesis 2 (H2):
not confirmed. The most negative effect on the public health parameters is caused by the low quality of drinking water and the low percentage of households with running water available in their homes. Economic factors also negatively affect public health. As the economic accessibility of food decreases, nutritional habits of consumers change from high-fat animal products to bread, macaroni products, and low-nutritious starches. Per capita consumption of meat, dairy products, and vegetables is well below both the national average and Russia’s national standard of healthy nutrition [115]. In some of the territories, higher values of nutrition variables X7–12 correlate with the emergence of the diseases of the nervous system; diseases of the skin and subcutaneous tissue; diseases of the musculoskeletal system and connective tissue; congenital malformations, deformations, and chromosomal abnormalities (all four—increase in X7); certain infectious and parasitic diseases (increase in X8). The proportion of market food in the diets is the highest among the territories of the Russian Arctic, but due to low living standards, people cannot afford themselves consuming market foods of high quality. Available vegetables, dairy products, meat, and fish are frozen and with a high content of food preservatives to extend the shelf life.
Hypothesis 3 (H3):
confirmed. Low income, poverty burden, and a high proportion of food expenditures in households’ budgets (economic variables X13–16) along with the prevalence of traditional food in the diet exert a negative influence on the majority of Yn diseases in Type 3 and Type 4 territories. Low diversified meat-based and fish-based diets result in the increase in the incidence rates of diseases of the digestive system, diseases of the skin and subcutaneous tissue, diseases of the musculoskeletal system and connective tissue, and infectious and parasitic diseases. The growth of real value of cash incomes and reduction of the proportion of population living below a minimum subsistence income may allow reducing the incidence rates of the diseases of the circulatory system; congenital malformations, deformations, and chromosomal abnormalities; neoplasms; diseases of the blood and blood-forming organs; certain disorders involving the immune mechanism; endocrine, nutritional, and metabolic diseases.
4. Discussion
Across Arctic communities, public health outcomes are affected by different combinations of environmental, nutritional, and economic factors. Both the modes and degrees of the influence are determined by a location of a territory, level of industrial development, economic and social situation, and patterns of life and food consumption.
Environmental factors, primarily, air pollution, are commonly recognized as the sources of the most serious toxicological impacts on human health, including respiratory and cardiovascular diseases, neuropsychiatric complications, and cancer [116,117]. In the Russian Arctic, previous studies identified such emissions as sulfate aerosols from metal smelting [118] and flaring associated with oil and gas extraction [119] but found no evidence of direct health implications from air pollutant emissions [2,120]. In this study, the negative influence of air pollution on health parameters was revealed across all types of circumpolar territories. Among the most notable consequences were increased respiratory ailments – the incidence rates of Y9 were unacceptably high across all four territory types (Table 10). Syurin and Burakova [121] found that the development of respiratory pathology patterns (primarily, chronic bronchitis and chronic obstructive pulmonary disease) was closely associated with the locations of harmful industries in the western part of the Russian Arctic. In those Types 2 and 4 territories, people experienced increasing susceptibility to air irritant agents (X1 and X2) and the quality of water supply systems in the cities (X5 and X6). This corresponded with the recommendations to improve access to clean water to reduce respiratory morbidity made by Kovesi [122,123]. Miller and Gaudette [124] suggested that a lack of vitamins (particularly, vitamin A) in the diet might be a possible co-factor of higher lung cancer in northern communities, while Tse et al. [125] reported household crowding and living conditions to be significantly associated with respiratory infections among indigenous people. In relation to our findings, it seemed that the adequacy of nutrient intake (X7 and X11) along with the degree of outdoor physical activities (X13, hunting and fishing) had positive effects on the reduction of Y9 incidence rate. Other health issues for which a correlation with environmental factors was revealed included eye irritation, increased cardiovascular morbidity, and carcinogenic effect of pollutants. This finding supported earlier results of Li and Mallat [126], Vermaelen and Brusselle [127], and Chen and Kan [8].
Among environmental factors, air pollution was recognized as moderately negative, the most negative being the quality of water and the volume of wastewater discharge. This corresponded with Hennessy et al. [17], Thomas et al. [16], and Wenger et al. [128], who all demonstrated a direct correlation between clean water in sufficient quantities and significant reductions in the occurrence of illness and hospitalizations due to infectious disease. Our finding also supported Nilsson et al. [129], who reported that over one-third of the population in the circumpolar territories of Russia used drinking water from non-centralized sources; Bressler and Hennessy [130], who recognized poor access to safe water among the causes of gastrointestinal illness and water-washed infections, such as respiratory tract infections and skin infections; as well as Daley at al. [131], who associated inadequate domestic water quantities with transmissible diseases and bacterium infections in indigenous communities. According to Hennessy and Bressler [132], the burden of inadequate water and sanitation services on public health is higher among rural and indigenous populations in the Arctic. In contrast with this opinion, our study demonstrated extremely negative health effects of poor water supply systems and water pollution not only in the eastern parts of the Russian Arctic but also in urbanized Type 2 territories and industrialized Type 1 territories. In this part, our results corresponded with the data of Dudarev et al. [133], who discovered that 51% and 19% of water samples taken from the centralized water sources in Type 2 territories did not comply with hygienic norms in terms of chemical and biological contamination, respectively. In the industrialized territories of Type 1, the coverage of households by public water supply exceeds 80%, but the majority of water supply facilities have not been properly repaired, cleaned, and disinfected for a long time [133]. Centralized water sources and drinking water are highly contaminated by chemical and biological agents. In Type 1 and Type 2 territories, water of low quality is delivered through the outdated supply system to the majority of households, which results in the growth of incidence rates of endocrine, nutritional, and metabolic diseases; diseases of the circulatory, digestive, and genitourinary systems; diseases of the musculoskeletal system and connective tissue.
High pollution load increases the level of contamination of wildlife, a premier source of food for indigenous peoples in the Arctic. According to Vinokurova [134], Greaves [135], and Ignateva [136], pollution destabilizes the ecological base of the High North and threatens food and nutrition security. Previously, it was demonstrated that traditional food consumption patterns might benefit various health parameters in indigenous communities [32,77,78,79,80,81,82,83,137]. As distinct from these studies, we revealed the negative health impacts of traditional food in some indigenous habitats in Type 3 and 4 territories. This corresponded well with earlier findings of Jeppesen et al. [84], Bjerregaard et al. [85], and Jørgensen et al. [89] that traditional dietary pattern was associated with lower β-cell function and a higher risk of impaired fasting glucose and type 2 diabetes mellitus. It was found that undiversified meat and fish-based diets in Type 3 and Type 4 territories, respectively, correlated with higher incidence rates of endocrine, nutritional, and metabolic diseases and diseases of the circulatory and genitourinary systems.
In the indigenous communities and rural territories of Type 3 and Type 4, diversification of the diets may impact public health in a positive way, but the economic accessibility of market food among rural people is low. Dudarev et al. [36] complained about the prohibitively high cost and limited availability of market food across the Arctic zone of Russia. Wesche and Chan [80], Ford [138], and Guyot et al. [139] found that low levels of income and high food costs resulted in changing diets and neglecting healthy nutrition. Poverty forces people to seek a substitution to the expensive market food in traditional hunting and fishing, but the contribution of traditional economic activities to the improvement of public health is minor. There are economic barriers reported by Lambden et al. [32] and Goldhar et al. [140], such as high costs of hunting and fishing, tightening food sharing networks, and hunting and fishing regulations.
In industrialized and urbanized territories of the Arctic Zone of Russia, on the contrary, we registered the increase in the proportion of market food in the diets, which was in line with the emergence of “nutritional transition” previously conceptualized by Egeland et al. [141] and Kuhnlein et al. [31] in the case of the Canadian Arctic. Young et al. [142] supposed such transition to contribute to an increase in diabetes and other diseases among northerners. Receveur et al. [143] and Nakano et al. [144] recognized an increased consumption of market food as a contributing factor to a higher incidence of overweight and obesity. Our findings demonstrated that in the territories where the proportion of market food in the diets was above the Arctic average, the negative impact of the transition was limited to the increased incidence rates of the diseases of the digestive system, immune diseases, and neoplasms.
5. Conclusions
This study attempted to convey the existing complexity of public health impacts in the case of the Arctic zone of Russia. It was investigated how various factors were interrelated with the incidence rates of major diseases in different types of circumpolar communities. The establishment of the set of environmental, nutritional, and economic variables allowed for a particularly useful analysis of the variations within the groups of health impacts and thus made the levels of exposure to certain diseases comparable across the territories. The territories were grouped in four types based on the respective levels of influencing groups of factors: (1) industrial sites, the most negative health impacts of air and water pollution; (2) urban agglomerations, the most negative health impacts of nutritional factors; (3) inland and (4) coastline indigenous communities, the most negative health impacts of economic factors.
The testing of the three hypotheses resulted in the identification of positive and negative effects on selected health parameters. The relationships between the regressands and corresponding regressors were discovered individually for eight territories of the Arctic Zone of Russia and generalized for the four types of the territories, given the alternations between the highest positive and most negative influences on the dependent variables. In Type 1 and Type 2 territories, poor quality of running water along with low access to the quality-assured sources of water increased the exposure to infectious and parasitic diseases, neoplasms, diseases of the circulatory, respiratory, genitourinary, and nervous systems, and endocrine, nutritional, and metabolic diseases. In Type 3 and Type 4 territories, low diversified diets based on traditional food correlated with the increase in the incidence rates of nutritional and metabolic diseases. Underconsumption of milk and vegetables resulted in a lower intake of vitamins and mineral nutrients, including calcium, phosphorus, magnesium, and zinc. Declining economic accessibility of adequate diets further exacerbated nutrition-related health problems.
The set of environmental, nutritional, and economic variables applied in this study as regressors was open-ended and discussible. The six-stage regression analysis that involved collinearity checks based on the VIF and BSA methods allowed to build regression models in which regressands’ variations were well explained by independent variables. However, due to the ongoing environmental, climate, and economic changes in the Arctic, a further focus on finding the most feasible influencing factors of public health could place the issue in the larger context of social-ecological change that is affecting the resilience of the Arctic and health and well-being of its inhabitants. In such respect, further studies of health impacts in the High North should involve comparisons with other Arctic countries except Russia. Effectively addressing emerging health-related challenges require continued research into health risk factors and trends in order to facilitate the identification of priority areas for policy interventions.
Author Contributions
T.G. designed a research framework; V.E. conceptualized the methods, performed the data collection, analyzed the data, and wrote the paper. All authors have read and agreed to the published version of the manuscript.
Funding
This research and the APC were funded by the National Social Science Fund of China (grant no. 18BGJ004).
Conflicts of Interest
The authors declare no conflict of interest. The founding sponsor had no role in the design of the study; in the collection, analyses, or interpretation of data; in the writing of the manuscript, and in the decision to publish the results.
References
- Donaldson, S.; Adlard, B.; Odland, J.O. Overview of Human Health in the Arctic: Conclusions and Recommendations. Int. J. Circumpolar Health 2016, 75, 33807. [Google Scholar] [CrossRef] [PubMed] [Green Version]
- Arctic Monitoring and Assessment Programme. AMAP Assessment 2015: Human Health in the Arctic; AMAP: Oslo, Norway, 2015. [Google Scholar]
- Adlard, B.; Donaldson, S.G.; Odland, J.O.; Weihe, P.; Berner, J.; Carlsen, A.; Bonefeld-Jorgensen, E.C.; Dudarev, A.A.; Gibson, J.C.; Krummel, E.M.; et al. Future Directions for Monitoring and Human Health Research for the Arctic Monitoring and Assessment Programme. Glob. Health Action 2018, 11. [Google Scholar] [CrossRef] [PubMed] [Green Version]
- Mitchell, M. Visual Range in the Polar Regions with Particular Reference to the Alaskan Arctic. J. Atmos. Terr. Phys. 1957, 17, 195–211. [Google Scholar]
- Arnold, S.R.; Law, K.S.; Brock, C.A.; Thomas, J.L.; Starkweather, S.M.; von Salzen, K.; Stohl, A.; Sharma, S.; Lund, M.T.; Flanner, M.G.; et al. Arctic Air Pollution: Challenges and Opportunities for the Next Decade. Elem. Sci. Anthr. 2016, 4, 104. [Google Scholar] [CrossRef] [Green Version]
- Law, K.S.; Roiger, A.; Thomas, J.L.; Marelle, L.; Raut, J.C.; Dalsoren, S.; Fuglestvedt, J.; Tuccella, P.; Weinzierl, B.; Schlager, H. Local Arctic Air Pollution: Sources and Impacts. AMBIO 2017, 46, 453–463. [Google Scholar] [CrossRef] [PubMed] [Green Version]
- European Environment Agency. Air Quality in Europe—2018 Report; European Environment Agency: Copenhagen, Denmark, 2018. [Google Scholar]
- Chen, B.; Kan, H. Air Pollution and Population Health: A Global Challenge. Environ. Health Prev. Med. 2008, 13, 94–101. [Google Scholar] [CrossRef] [Green Version]
- Pope, C.A., III; Burnett, R.T.; Thun, M.J.; Calle, E.E.; Krewski, D.; Ito, K.; Thurston, G.D. Lung Cancer, Cardiopulmonary Mortality, and Long-term Exposure to Fine Particulate Air Pollution. J. Am. Med Assoc. 2002, 287, 1132–1141. [Google Scholar] [CrossRef] [Green Version]
- Dockery, D.W.; Pope, C.A., III; Xu, X.; Spengler, J.D.; Ware, J.H.; Fay, M.E.; Ferris, B.G., Jr.; Speizer, F.E. An Association between Air Pollution and Mortality in Six U.S. Cities. N. Engl. J. Med. 1993, 329, 1753–1759. [Google Scholar] [CrossRef] [Green Version]
- Naess, O.; Nafstad, P.; Aamodt, G.; Claussen, B.; Rosland, P. Relation between Concentration of Air Pollution and Cause-Specific Mortality: Four-Year Exposures to Nitrogen Dioxide and Particulate Matter Pollutants in 470 Neighborhoods in Oslo, Norway. Am. J. Epidemiol. 2007, 165, 435–443. [Google Scholar] [CrossRef]
- Jensen, P.E.; Hennessy, T.W.; Kallenborn, R. Water, Sanitation, Pollution, and Health in the Arctic. Environ. Sci. Pollut. Res. 2018, 25. [Google Scholar] [CrossRef] [Green Version]
- Dudley, J.P.; Hoberg, E.P.; Jenkins, E.J.; Parkinson, A.J. Climate Change in the North American Arctic: A One Health Perspective. EcoHealth 2015, 12, 713–725. [Google Scholar] [CrossRef] [PubMed]
- Parkinson, A.J.; Evengard, B.; Semenza, J.C.; Ogden, N.; Borresen, M.L.; Berner, J.; Brubaker, M.; Sjostedt, A.; Evander, M.; Hondula, D.M.; et al. Climate Change and Infectious Diseases in the Arctic: Establishment of a Circumpolar Working Group. Int. J. Circumpolar Health 2014, 73, 25163. [Google Scholar] [CrossRef] [PubMed]
- White, G.F.; Bradley, D.J.; White, A.U. Drawers of Water; Domestic Water Use in East Africa; University of Chicago Press: Chicago, IL, USA, 1972. [Google Scholar]
- Thomas, T.K.; Ritter, T.; Bruden, D.; Bruce, M.; Byrd, K.; Goldberger, R.; Dobson, J.; Hickel, K.; Smith, J.; Hennessy, T. Impact of Providing In-home Water Service on the Rates of Infectious Diseases: Results from Four Communities in Western Alaska. J. Water Health 2015, 14, 132–141. [Google Scholar] [CrossRef] [PubMed] [Green Version]
- Hennessy, T.W.; Ritter, T.; Holman, R.C.; Bruden, D.L.; Yorita, K.; Bulkow, L.; Cheek, J.E.; Singleton, R.J.; Smith, J. The Relationship between In-home Water Service and the Risk of Respiratory Tract, Skin, and Gastrointestinal. Am. J. Public Health 2008, 98, 2072–2078. [Google Scholar] [CrossRef]
- Gessner, B.D. Lack of Piped Water and Sewage Services Is Associated with Pediatric Lower Respiratory Tract Infection in Alaska. J. Pediatrics 2008, 152, 666–670. [Google Scholar] [CrossRef]
- Bourgeois, A.C.; Zulz, T.; Bruce, M.G.; Stenz, F.; Koch, A.; Parkinson, A.; Hennessy, T.; Cooper, M.; Newberry, C.; Randell, E.; et al. Tuberculosis in the Circumpolar Region, 2006–2012. Int. J. Tuberc. Lung Dis. 2018, 22, 641–648. [Google Scholar] [CrossRef]
- Byrd, K.K.; Holman, R.C.; Bruce, M.G.; Hennessy, T.W.; Wenger, J.D.; Bruden, D.L.; Haberling, D.L.; Steiner, C.; Cheek, J.E. Methicillin-Resistant Staphylococcus Aureus-Associated Hospitalizations among the American Indian and Alaska Native Population. Clin. Infect. Dis. 2008, 49, 1009–1015. [Google Scholar] [CrossRef] [Green Version]
- Poppel, B.; Kruse, J.; Duhaime, G.; Abryutina, L. SliCa Results; University of Alaska Anchorage: Anchorage, AL, USA, 2007. [Google Scholar]
- United Nations Environment Programme. Stockholm Convention on Persistent Organic Pollutants (POPs) as Amended in 2009. Available online: https://www.wipo.int/edocs/trtdocs/en/unep-pop/trt_unep_pop_2.pdf (accessed on 15 January 2020).
- Douglas, V.; Chan, L. Food and Cultural Security. In From Science to Policy in the Canadian Western and Central Canadian Arctic: An Integrated Regional Impact Study (IRIS) of Climate Change and Modernization; Stern, G., Gaden, A., Eds.; ArcticNet: Quebec City, QC, Canada, 2015; pp. 343–359. [Google Scholar]
- Arctic Monitoring and Assessment Programme. AMAP Assessment 2009: Persistent Organic Pollutants (POPs) in the Arctic. Sci. Total Environ. Spec. Issue 2010, 408, 2851–3051. [Google Scholar]
- Arctic Monitoring and Assessment Programme. AMAP Assessment 2016: Chemicals of Emerging Arctic Concern; Arctic Monitoring and Assessment Programme (AMAP): Oslo, Norway, 2016. [Google Scholar]
- Bock, R. Global Industry Risk Reduction Initiatives. In Proceedings of the International Conference on Chemicals Management (ICCM4), Geneva, Switzerland, 28 September–2 October 2015. [Google Scholar]
- Tutelyan, V. Nutrition and Health of Far North Population: Priority Directions. Occup. Health Ind. Ecol. 1996, 6, 16–19. [Google Scholar]
- Gao, T. Food Security and Rural Development on Emerging Markets of Northeast Asia: Cases of Chinese North and Russian Far East. In Establishing Food Security and Alternatives to International Trade in Emerging Economies; Erokhin, V., Ed.; IGI Global: Hershey, PA, USA, 2017; pp. 155–176. [Google Scholar]
- Murphy, N.J.; Schraer, C.D.; Thiele, M.C.; Boyko, M.K.; Bulkow, L.R.; Doby, B.J.; Lanier, A.P. Dietary Change and Obesity Associated with Glucose Intolerance in Alaska Natives. J. Am. Diet. Assoc. 1995, 95, 676–682. [Google Scholar] [CrossRef]
- Erokhin, V. Establishing Food Security and Alternatives to International Trade in Emerging Economies; IGI Global: Hershey, PA, USA, 2018. [Google Scholar]
- Kuhnlein, H.; Receveur, O.; Soueida, R.; Egeland, G. Arctic Indigenous Peoples Experience the Nutrition Transition with Changing Dietary Patterns and Obesity. J. Nutr. 2004, 134, 1447–1453. [Google Scholar] [CrossRef] [PubMed]
- Lambden, J.; Receveur, O.; Marshall, J.; Kuhnlein, H. Traditional and Market Food Access in Arctic Canada Is Affected by Economic Factors. Int. J. Circumpolar Health 2006, 65, 331–340. [Google Scholar] [CrossRef] [PubMed] [Green Version]
- Inuit Circumpolar Council. Food Security across the Arctic; Inuit Circumpolar Council: Ottawa, ON, Canada, 2012. [Google Scholar]
- McKinney, M.A.; Iverson, S.J.; Fisk, A.T.; Sonne, C.; Riget, F.F.; Letcher, R.J.; Arts, M.T.; Born, E.W.; Rosing-Asvid, A.; Dietz, R. Global Change Effects on the Long-Term Feeding Ecology and Contaminant Exposures of East Greenland Polar Bears. Glob. Chang. Biol. 2013, 19, 2360–2372. [Google Scholar] [CrossRef] [PubMed]
- Jenssen, B.M.; Villanger, G.D.; Gabrielsen, K.M.; Bytingsvik, J.; Bechshoft, T.; Ciesielski, T.M.; Sonne, C.; Dietz, R. Anthropogenic Flank Attack on Polar Bears: Interacting Consequences of Climate Warming and Pollutant Exposure. Front. Ecol. Evol. 2015, 3, 1–7. [Google Scholar] [CrossRef] [Green Version]
- Dudarev, A.A.; Yamin-Pasternak, S.; Pasternak, I.; Chupakin, V.S. Traditional Diet and Environmental Contaminants in Coastal Chukotka I: Study Design and Dietary Patterns. Int. J. Environ. Res. Public Health 2019, 16, 702. [Google Scholar] [CrossRef] [PubMed] [Green Version]
- Dudarev, A.A.; Chupakin, V.S.; Vlasov, S.V.; Yamin-Pasternak, S. Traditional Diet and Environmental Contaminants in Coastal Chukotka II: Legacy POPs. Int. J. Environ. Res. Public Health 2019, 16, 695. [Google Scholar] [CrossRef] [PubMed] [Green Version]
- Garcia, S.M.; Rosenberg, A.A. Food Security and Marine Capture Fisheries: Characteristics, Trends, Drivers and Future Perspectives. Philos. Trans. R. Soc. B 2010, 365, 2869–2880. [Google Scholar] [CrossRef] [Green Version]
- Bengtson, J.L.; Nikitina, E. Impacts and Consequences for Northern Communities and Society. In Adaptation Actions for a Changing Arctic: Perspectives from the Bering-Chukchi-Beaufort Region; Nikitina, E., Outridge, P., Walsh, J.E., Eds.; Arctic Monitoring and Assessment Programme (AMAP): Oslo, Norway, 2017; pp. 125–152. [Google Scholar]
- Erokhin, V. Health-Related Effects of Food and Nutrition Security: An Evidence of the Northern Communities in Russia. West. Balk. J. Agric. Econ. Rural Dev. 2019, 1, 11–28. [Google Scholar] [CrossRef] [Green Version]
- Federal Service of State Statistics of the Russian Federation. Official Statistics. Available online: http://www.gks.ru/wps/wcm/connect/rosstat_main/rosstat/ru/statistics/accounts/ (accessed on 3 January 2020).
- Schmale, J.; Arnold, S.R.; Law, K.S.; Thorp, T.; Anenberg, S.; Simpson, W.R.; Mao, J.; Pratt, K.A. Local Arctic Air Pollution: A Neglected but Serious Problem. Earth’s Future 2018, 10. [Google Scholar] [CrossRef]
- Law, K.S.; Stohl, A. Arctic Air Pollution: Origins and Impacts. Science 2007, 315, 1537–1540. [Google Scholar] [CrossRef] [Green Version]
- Shindell, D.; Kuylenstierna, J.C.I.; Vignati, E.; Dingenen, R.; Amann, M.; Klimont, Z.; Anenberg, S.S.; Muller, N.; Janssens-Maenhout, G.; Raes, F.; et al. Simultaneously Mitigating Near-Term Climate Change and Improving Human Health and Food Security. Science 2012, 335, 183–189. [Google Scholar] [CrossRef] [PubMed] [Green Version]
- Erokhin, V.; Gao, T.; Zhang, X. Handbook of Research on International Collaboration, Economic Development and Sustainability in the Arctic; IGI Global: Hershey, PA, USA, 2019. [Google Scholar]
- Larsen, J.N.; Fondahl, G. Arctic Human Development Report: Regional Processes and Global Linkages; Nordic Council of Ministers: Oslo, Norway, 2015. [Google Scholar]
- Nilsson, L.M.; Berner, J.; Dudarev, A.A.; Mulvad, G.; Odland, J.O.; Parkinson, A.; Rautio, A.; Tikhonov, C.; Evengard, B. Indicators of Food and Water Security in an Arctic Health Context–Results from an International Workshop Discussion. Int. J. Circumpolar Health 2013, 72, 21530. [Google Scholar] [CrossRef] [PubMed] [Green Version]
- Morozova, E.; Glushakova, O.; Fadeikina, N. Food Consumption as an Indicator of the Quality of Life of the Population in Regions. Foods Raw Mater. 2016, 4, 171–180. [Google Scholar] [CrossRef]
- Erokhin, V. Self-Sufficiency versus Security: How Trade Protectionism Challenges the Sustainability of the Food Supply in Russia. Sustainability 2017, 9, 1939. [Google Scholar] [CrossRef] [Green Version]
- Liefert, W.M.; Liefert, O. Russia’s Economic Crisis and Its Agricultural and Food Economy. Choices 2015, 30, 1–6. [Google Scholar]
- Ivanov, V.; Ivanova, E. Arctic Specifics of Food Supply and Development of Agriculture of the European North-East of Russia. Arct. Ecol. Econ. 2017, 26, 117–130. [Google Scholar] [CrossRef]
- Hiyama, T.; Takakura, H. Global Warming and Human-Nature Dimension in Northern Eurasia; Springer: Singapore, 2018. [Google Scholar]
- Weihe, P.; Bjerregaard, P.; Bonefeld-Jorgensen, E.; Dudarev, A.A.; Halling, J.; Hansen, S.; Muckle, G.; Nost, T.; Odland, J.O.; Petersen, M.S.; et al. Overview of Ongoing Cohort and Dietary Studies in the Arctic. Int. J. Circumpolar Health 2016, 75, 33803. [Google Scholar] [CrossRef] [Green Version]
- Chowdhury, S.; Dey, S. Cause-specific Premature Death from Ambient PM2.5 Exposure in India: Estimate Adjusted for Baseline Mortality. Environ. Int. 2016, 91, 283–290. [Google Scholar] [CrossRef]
- Bardhan, K.; Klasen, S. UNDP’S Gender Related Indices: A Critical Review. World Dev. 1999, 27, 985–1010. [Google Scholar] [CrossRef]
- Svedberg, P. 841 Million Undernourished? World Dev. 1998, 27, 2081–2098. [Google Scholar] [CrossRef]
- Snee, R.D. Some Aspects of Nonorthogonal Data Analysis, Part I. Developing Prediction Equations. J. Qual. Technol. 1973, 5, 67–79. [Google Scholar] [CrossRef]
- Kutner, M.; Nachtsheim, C.; Neter, J.; Li, W. Applied Linear Statistical Models; McGraw-Hill/Irwin: New York, NY, USA, 2005. [Google Scholar]
- Montgomery, D.; Peck, E.; Vining, G. Introduction to Linear Regression Analysis; Wiley: New York, NY, USA, 2012. [Google Scholar]
- Ermakov, V.; Barbaumov, V.; Kriventsova, N.; Lebedev, A.; Matveev, V.; Rudyk, B.; Silaeva, E.; Smagina, O. Handbook on Mathematics for Economists; Plekhanov Russian University of Economics: Moscow, Russia, 2007. [Google Scholar]
- Levine, D.M.; Stephan, D.F.; Szabat, K.A. Statistics for Managers. Using Microsoft Excel; Pearson: London, UK, 2017. [Google Scholar]
- Irurozki, E.; Calvo, B.; Lozano, J. PerMallows: An R Package for Mallows and Generalized Mallows Models. J. Stat. Softw. 2016, 71, 1–30. [Google Scholar] [CrossRef] [Green Version]
- Mallows, C.L. Non-Null Ranking Models. Biometrika 1957, 44, 114–130. [Google Scholar] [CrossRef]
- Mallows, C.L. Some Comments on Cp. Technometrics 1973, 15, 661–675. [Google Scholar]
- Xue, F.; Liu, J.; Li, Z.; Liu, S.; Meng, G.; Zhang, L. Mallows’ Statistics CL: A Novel Criterion for Parametric PSF Estimation. J. Vis. Commun. Image Represent. 2015, 33, 115–122. [Google Scholar] [CrossRef]
- Fujikoshi, Y.; Kan, T.; Takahashi, S.; Sakurai, T. Prediction Error Criterion for Selecting Variables in a Linear Regression Model. Ann. Inst. Stat. Math. 2011, 63, 387–403. [Google Scholar] [CrossRef]
- World Health Organization. International Classification of Diseases, 11th Revision. Available online: https://icd.who.int/ (accessed on 13 January 2020).
- Eganyan, R. Nutritional Characteristics in Dwellers of the Far North of Russia (A Review of Literature). Russ. J. Prev. Med. Public Health 2013, 5, 41–47. [Google Scholar]
- Dudarev, A.A.; Alloyarov, P.R.; Chupakhin, V.S.; Dushkina, E.V.; Sladkova, Y.N.; Dorofeyev, V.M.; Kolesnikova, T.A.; Fridman, K.B.; Nilsson, L.M.; Evengard, B. Food and Water Security Issues in Russia I: Food Security in the General Population of the Russian Arctic, Siberia and Far East, 2000-2011. Int. J. Circumpolar Health 2013, 72, 21848. [Google Scholar] [CrossRef] [Green Version]
- Revich, B.; Chashchin, V.; Kharkova, T.; Kvasha, Y.; Bogoyavlensky, D.; Tronin, A.; Tokarevich, N.; Buzinov, R.; Kershengolts, B.; Chernyavskiy, V.; et al. Climate Change Impact on Public Health in the Russian Arctic; United Nations in the Russian Federation: Moscow, Russia, 2008. [Google Scholar]
- Weingartner, L. The Concept of Food and Nutrition Security. In Achieving Food and Nutrition Security: Actions to Meet the Global Challenge–A Training Course Reader; Klennert, K., Ed.; Inwent: Bonn, Germany, 2010; pp. 3–28. [Google Scholar]
- Erokhin, V. Measuring Food and Nutrition Security in Circumpolar Communities. Macro Manag. Public Policies 2019, 2, 18–28. [Google Scholar] [CrossRef]
- Revich, B. Public Health and Ambient Air Pollution in Arctic and Subarctic Cities of Russia. Sci. Total Environ. 1995, 160, 585–592. [Google Scholar] [CrossRef]
- Parkinson, A.J.; Butler, J.C. Potential Impacts of Climate Change on Infectious Diseases in the Arctic. Int. J. Circumpolar Health 2005, 64, 478–486. [Google Scholar] [CrossRef] [PubMed]
- Thomas, K.M.; Charron, D.F.; Waltner-Toews, D.; Schuster, C.; Maarouf, A.R.; Holt, J.D. A Role of High Impact Weather Events in Waterborne Disease Outbreaks in Canada, 1975–2001. Int. J. Environ. Health Res. 2006, 16, 167–180. [Google Scholar] [CrossRef] [PubMed]
- Kovalev, M.; Chernetskaya, M.; Shiray, O. Analysis of Food Security in the Republic of Belarus and Other Countries of the World. Bull. Assoc. Belarus. Banks 2014, 34, 8–19. [Google Scholar]
- Calder, R.S.D.; Bromage, S.; Sunderland, E.M. Risk Tradeoffs Associated with Traditional Food Advisories for Labrador Inuit. Environ. Res. 2018, 168, 496–506. [Google Scholar] [CrossRef] [PubMed]
- Fediuk, K.; Hidiroglou, N.; Madere, R.; Kuhnlein, H. Vitamin C in Inuit Traditional Food and Women’s Diets. J. Food Compos. Anal. 2002, 15, 221–235. [Google Scholar] [CrossRef]
- Sheehy, T.; Kolahdooz, F.; Roache, C.; Sharma, S. Traditional Food Consumption Is Associated with Better Diet Quality and Adequacy Among Inuit Adults in Nunavut, Canada. Int. J. Food Sci. Nutr. 2015, 66, 445–451. [Google Scholar] [CrossRef] [PubMed]
- Wesche, S.D.; Chan, H.M. Adapting to the Impacts of Climate Change on Food Security among Inuit in the Western Canadian Arctic. EcoHealth 2010, 7, 361–373. [Google Scholar] [CrossRef]
- Blanchet, C.; Dewailly, E.; Ayotte, P.; Bruneau, S.; Receveur, O.; Holub, B. Contribution of Selected Traditional and Market Foods to the Diet of Nunavik Inuit Women. Can. J. Diet. Pract. Res. 2000, 61, 50–59. [Google Scholar]
- Dubois, G.; Girard, C.; Lapointe, F.J.; Shapiro, B.J. The Inuit Gut Microbiome Is Dynamic over Time and Shaped by Traditional Foods. Microbiome 2017, 5, 151. [Google Scholar] [CrossRef] [Green Version]
- Jamieson, J.; Weiler, H.; Kuhnlein, H.; Egeland, G. Traditional Food Intake Is Correlated with Iron Stores in Canadian Inuit Men. J. Nutr. 2012, 142, 764–770. [Google Scholar] [CrossRef] [Green Version]
- Jeppesen, C.; Bjerregaard, P.; Jorgensen, M.E. Dietary Patterns in Greenland and Their Relationship with Type 2 Diabetes Mellitus and Glucose Intolerance. Public Health Nutr. 2013, 17, 462–470. [Google Scholar] [CrossRef] [PubMed] [Green Version]
- Bjerregaard, P.; Pedersen, H.S.; Mulvad, G. The Associations of a Marine Diet with Plasma Lipids, Blood Glucose, Blood Pressure and Obesity among the Inuit in Greenland. Eur. J. Clin. Nutr. 2000, 54, 732–737. [Google Scholar] [CrossRef] [PubMed] [Green Version]
- Færch, K.; Vaag, A.; Holst, J.J.; Glümer, C.; Pedersen, O.; Borch-Johnsen, K. Impaired Fasting Glycaemia vs Impaired Glucose Tolerance: Similar Impairment of Pancreatic Alpha and Beta Cell Function but Differential Roles of Incretin Hormones and Insulin Action. Diabetologia 2008, 51, 853–861. [Google Scholar] [CrossRef] [PubMed] [Green Version]
- Weyer, C.; Bogardus, C.; Mott, D.M.; Pratley, R.E. The Natural History of Insulin Secretory Dysfunction and Insulin Resistance in the Pathogenesis of Type 2 Diabetes Mellitus. J. Clin. Investig. 1999, 104, 787–794. [Google Scholar] [CrossRef]
- Weyer, C.; Tataranni, P.A.; Bogardus, C.; Pratley, R.E. Insulin Resistance and Insulin Secretory Dysfunction Are Independent Predictors of Worsening of Glucose Tolerance During Each Stage of Type 2 Diabetes Development. Diabetes Care 2001, 24, 89–94. [Google Scholar] [CrossRef] [Green Version]
- Jørgensen, M.E.; Borch-Johnsen, K.; Bjerregaard, P. A Cross-Sectional Study of the Association between Persistent Organic Pollutants and Glucose Intolerance among Greenland Inuit. Diabetologia 2008, 51, 1416–1422. [Google Scholar] [CrossRef] [Green Version]
- Kuhnlein, H.V. Benefits and Risks of Traditional Food for Indigenous Peoples: Focus on Dietary Intakes of Arctic Men. Can. J. Physiol. Pharmacol. 1995, 73, 765–771. [Google Scholar] [CrossRef]
- Erokhin, V. Economic Aspects of Food and Nutrition Security in the Territories of the Russian Arctic. Theory Pract. Soc. Dev. 2019, 131, 49–54. [Google Scholar]
- Food and Agriculture Organization of the United Nations. Nutrition Indicators for Development; Food and Agriculture Organization of the United Nations: Rome, Italy, 2005. [Google Scholar]
- Erokhin, V. Factors Influencing Food Markets in Developing Countries: An Approach to Assess Sustainability of the Food Supply in Russia. Sustainability 2017, 9, 1313. [Google Scholar] [CrossRef] [Green Version]
- Zainodin, H.J.; Khuneswari, G.; Noraini, A.; Haider, F.A.A. Selected Model Systematic Sequence via Variance Inflationary Factor. Int. J. Appl. Phys. Math. 2015, 5, 105–114. [Google Scholar] [CrossRef] [Green Version]
- Bowerman, B.L.; O’Connell, R.T. Linear Statistical Models: An Applied Approach; PWS-Kent Publishing Company: Boston, MA, USA, 1990. [Google Scholar]
- Dan, L.; Vallant, R. Variance Inflation Factors in the Analysis of Complex Survey Data. Surv. Methodol. 2012, 38, 53–62. [Google Scholar]
- Evans, R.D. Two Experiments with Stepwise Regression. J. Econ. Financ. 1991, 15, 35–42. [Google Scholar]
- Johnsson, T. A Procedure for Stepwise Regression Analysis. Stat. Pap. 1992, 33, 21–29. [Google Scholar] [CrossRef]
- Qi, Y.; Liu, G.; Zhang, W. A Matlab Program for Stepwise Regression. Netw. Pharmacol. 2016, 1, 36–41. [Google Scholar]
- Zhou, X.; Jiang, T. Metamodel Selection Based on Stepwise Regression. Struct. Multidiscip. Optim. 2016, 54, 641–657. [Google Scholar] [CrossRef]
- Gupta, S.S. On Some Multiple Decision (Selection and Ranking) Rules. Technometrics 1965, 7, 225–245. [Google Scholar] [CrossRef]
- Sullivan, D.W.; Wilson, J.R. Restricted Subset Selection Procedures for Simulation. Oper. Res. 1989, 37, 52–71. [Google Scholar] [CrossRef]
- Hosmer, D.; Jovanovic, B.; Lemeshow, S. Best Subsets Logistic Regression. Biometrics 1989, 45, 1265–1270. [Google Scholar] [CrossRef]
- Tamura, R.; Kobayashi, K.; Takano, Y.; Miyashiro, R.; Nakata, K.; Matsui, T. Best Subset Selection for Eliminating Multicollinearity. J. Oper. Res. Soc. Jpn. 2017, 60, 321–336. [Google Scholar] [CrossRef] [Green Version]
- Lambert, J.; Gong, L.; Elliott, C.; Thompson, K.; Stromberg, A. rFSA: An R Package for Finding Best Subsets and Interactions. R J. 2018, 10, 295–308. [Google Scholar] [CrossRef] [Green Version]
- Chen, L.-Y.; Lee, S. Best Subset Binary Prediction. J. Econom. 2018, 206, 39–56. [Google Scholar] [CrossRef]
- Rencher, A.; Pun, F.C. Inflation of R in Best Subset Regression. Technometrics 1980, 22, 49–53. [Google Scholar] [CrossRef]
- Irurozki, E.; Calvo, B.; Lozano, J. Mallows and Generalized Mallows Model for Matchings. Bernoulli 2019, 25, 1160–1188. [Google Scholar] [CrossRef] [Green Version]
- Hansen, B.E. Least Squares Model Averaging. Econometrica 2007, 75, 1175–1189. [Google Scholar] [CrossRef] [Green Version]
- Liao, J.; Zou, G. Corrected Mallows Criterion for Model Averaging. Comput. Stat. Data Anal. 2020, 144, 106902. [Google Scholar] [CrossRef]
- Feng, Y.; Liu, Q.; Okui, R. On the Sparsity of Mallows Model Averaging Estimator. Econ. Lett. 2020, 187, 108916. [Google Scholar] [CrossRef]
- Nikolov, N.; Stoimenova, E. Mallows’ Models for Imperfect Ranking in Ranked Set Sampling. Asta Adv. Stat. Anal. 2019, 1–26. [Google Scholar] [CrossRef]
- Xue, F.; Liu, J.; Mu, C.; Zhao, M.; Zhang, L.; Jiao, S. A New Approach to Blind PSF Estimation Based on Mallows’ Statistics Cp. In Proceedings of the International Symposium on Optoelectronic Technology and Application 2014, Beijing, China, 13–15 May 2014. [Google Scholar]
- Sannikova, Y. Traditional Economy of the Indigenous People of the North Yakutia in the Post-Soviet Period: Some Research Result. Arct. North 2017, 28, 92–105. [Google Scholar] [CrossRef]
- Ministry of Public Health of the Russian Federation. Decree #614 from August 19, 2016 “Recommendations on Rational Intake of Food Products According to Contemporary Standards of Healthy Nutrition”. Available online: http://docs.cntd.ru/document/420374878 (accessed on 14 January 2020).
- Ghorani-Azam, A.; Riahi-Zanjani, B.; Balali-Mood, M. Effects of Air Pollution on Human Health and Practical Measures for Prevention in Iran. J. Res. Med. Sci. 2016, 21, 65. [Google Scholar] [CrossRef]
- Zhang, W.; Qian, C.; Zeng, Y. Air Pollution: A Smoking Gun for Cancer. China J. Cancer 2014, 33, 173–175. [Google Scholar] [CrossRef]
- Prank, M.; Sofiev, M.; Denier van der Gon, H.; Kaasik, M.; Ruuskanen, T.; Kukkonen, J. A Refinement of the Emission Data for Kola Peninsula Based on Inverse Dispersion Modelling. Atmos. Chem. Phys. 2010, 10, 10849–10865. [Google Scholar] [CrossRef] [Green Version]
- Stohl, A.; Klimont, Z.; Eckhardt, S.; Kupiainen, K.; Shevchenko, V.; Kopeikin, V.; Novigatsky, A. Black Carbon in the Arctic: The Underestimated Role of Gas Flaring and Residential Combustion Emissions. Atmos. Chem. Phys. 2013, 13, 8833–8855. [Google Scholar] [CrossRef] [Green Version]
- Arctic Monitoring and Assessment Programme. AMAP Assessment 2006: Acidifying Pollutants, Arctic Haze, and Acidification in the Arctic; AMAP: Oslo, Norway, 2006. [Google Scholar]
- Syurin, S.; Burakova, O. Respiratory Pathology Pattern of Aluminium Industry Workers in Russian Arctic. Proc. Murm. State Tech. Univ. 2012, 15, 627–632. [Google Scholar]
- Kovesi, T. Respiratory Medicine in Nunavut and Northern Canada. Can. J. Respir. Crit. Careand Sleep Med. 2019, 3, 166–171. [Google Scholar] [CrossRef]
- Kovesi, T. Respiratory Disease in Canadian First Nations and Inuit Children. Paediatr. Child Health 2012, 17, 376–380. [Google Scholar]
- Miller, A.B.; Gaudette, L.A. Cancer of the Respiratory System in Circumpolar Inuit. Acta Oncol. 1996, 35, 571–576. [Google Scholar] [CrossRef] [Green Version]
- Tse, S.M.; Weiler, H.; Kovesi, T. Food Insecurity, Vitamin D Insufficiency and Respiratory Infections among Inuit Children. Int. J. Circumpolar Health 2016, 75, 29954. [Google Scholar] [CrossRef]
- Li, M.; Mallat, L. Health Impacts of Air Pollution. SCOR Paper #42. 2018. Available online: https://www.scor.com/sites/default/files/sp42-air_pollution.pdf (accessed on 14 January 2020).
- Vermaelen, K.; Brusselle, G. Exposing a Deadly Alliance: Novel Insights into the Biological Links between COPD and Lung Cancer. Pulm. Pharmacol. Ther. 2013, 26, 544–554. [Google Scholar] [CrossRef]
- Wenger, J.D.; Zulz, T.; Bruden, D.; Singleton, R.; Bruce, M.G.; Bulkow, L.; Parks, D.; Rudolph, K.; Hurlburt, D.; Ritter, T.; et al. Invasive Pneumococcal Disease in Alaskan Children: Impact of the Seven-Valent Pneumococcal Conjugate Vaccine and the Role of Water Supply. Pediatric Infect. Dis. J. 2010, 29, 251–256. [Google Scholar] [CrossRef] [Green Version]
- Nilsson, A.E.; Nilsson, L.M.; Quinlan, A.; Evengard, B. Food Security in the Arctic: Preliminary Reflections from a Resilience Perspective. Arctic Council. In Arctic Resilience Interim Report 2013; Stockholm Environment Institute, Stockholm Resilience Centre: Stockholm, Sweden, 2013; pp. 113–116. [Google Scholar]
- Bressler, J.; Hennessy, T. Results of an Arctic Council Survey on Water and Sanitation Services in the Arctic. Int. J. Circumpolar Health 2018, 77, 1421368. [Google Scholar] [CrossRef] [Green Version]
- Daley, K.; Castleden, H.; Jamieson, R.; Furgal, C.; Ell, L. Municipal Water Quantities and Health in Nunavut Households: An Exploratory Case Study in Coral Harbour, Nunavut, Canada. Int. J. Circumpolar Health 2014, 73. [Google Scholar] [CrossRef] [PubMed] [Green Version]
- Hennessy, T.; Bressler, J. Improving Health in the Arctic Region through Safe and Affordable Access to Household Running Water and Sewer Services: An Arctic Council Initiative. Int. J. Circumpolar Health 2016, 75, 31149. [Google Scholar] [CrossRef] [PubMed]
- Dudarev, A.A.; Dushkina, E.V.; Sladkova, Y.N.; Alloyarov, P.R.; Chupakhin, V.S.; Dorofeyev, V.M.; Kolesnikova, T.A.; Fridman, K.B.; Evengard, B.; Nilsson, L.M. Food and Water Security Issues in Russia II: Water Security in General Population of Russian Arctic, Siberia and Far East, 2000–2011. Int. J. Circumpolar Health 2013, 72, 22646. [Google Scholar] [CrossRef] [PubMed]
- Vinokurova, L. Rural Yakutia: Perception Indigenous Population Changes in Environment. Arct. North 2011, 4, 1–8. [Google Scholar]
- Greaves, W. Securing Sustainability: The Case for Critical Environmental Security in the Arctic. Polar Rec. 2016, 52, 660–671. [Google Scholar] [CrossRef]
- Ignateva, V. Sakha Republic (Yakutia): Local Projections of Climate Changes and Adaptation Problems of Indigenous Peoples. In Global Warming and Human-Nature Dimension in Northern Eurasia; Hiyama, T., Takakura, H., Eds.; Springer: Singapore, 2018; pp. 11–28. [Google Scholar]
- Berner, J.; Brubaker, M.; Revitch, B.; Kreummel, E.; Tcheripanoff, M.; Bell, J. Adaptation in Arctic Circumpolar Communities: Food and Water Security in a Changing Climate. Int. J. Circumpolar Health 2016, 75. [Google Scholar] [CrossRef] [Green Version]
- Ford, J.D. Vulnerability of Inuit Food Systems to Food Insecurity as a Consequence of Climate Change: A Case Study from Igloolik, Nunavut. Reg. Environ. Chang. 2009, 9, 83–100. [Google Scholar] [CrossRef]
- Guyot, M.; Dickson, C.; Paci, C.; Furgal, C.; Chan, H.M. Local Observations of Climate Change and Impacts on Traditional Food Security in Two Northern Aboriginal Communities. Int. J. Circumpolar Health 2006, 65, 403–415. [Google Scholar] [CrossRef]
- Goldhar, C.; Ford, J.D.; Berrang-Ford, L. Prevalence of Food Insecurity in a Greenlandic Community and the Importance of Social, Economic and Environmental Stressors. Int. J. Circumpolar Health 2010, 69, 285–303. [Google Scholar] [CrossRef]
- Egeland, G.M.; Johnson-Down, L.; Cao, Z.R.; Sheikh, N.; Weiler, H. Food Insecurity and Nutrition Transition Combine to Affect Nutrient Intakes in Canadian Arctic Communities. J. Nutr. 2011, 141, 1746–1753. [Google Scholar] [CrossRef] [Green Version]
- Young, K.; Carraher, S.; Goodman, K.J. Inuit Health Survey. In From Science to Policy in the Canadian Western and Central Canadian Arctic: An Integrated Regional Impact Study (IRIS) of Climate Change and Modernization; Stern, G., Gaden, A., Eds.; ArcticNet: Quebec City, QC, Canada, 2015; pp. 255–269. [Google Scholar]
- Receveur, O.; Boulay, M.; Kuhnlein, H. Decreasing Traditional Food Use Affects Diet Quality for Adult Dene/ Métis in 16 Communities of the Canadian Northwest Territories. J. Nutr. 1997, 127, 2179–2186. [Google Scholar] [CrossRef] [PubMed]
- Nakano, T.; Fediuk, K.; Kassi, N.; Kuhnlein, H. Food Use of Dene/Métis and Yukon Children. Int. J. Circumpolar Health 2005, 64, 137–146. [Google Scholar] [CrossRef] [PubMed]
Figure 1.
Morbidity across the Arctic territories of Russia, cases registered per 1000 people. Source: authors’ development based on the Federal Service of State Statistics of the Russian Federation [41].
Figure 1.
Morbidity across the Arctic territories of Russia, cases registered per 1000 people. Source: authors’ development based on the Federal Service of State Statistics of the Russian Federation [41].

Figure 2.
Study flow algorithm. Source: authors’ development.

Figure 3.
Territories of the Arctic zone of Russia included in the study. Source: authors’ development.
Figure 3.
Territories of the Arctic zone of Russia included in the study. Source: authors’ development.


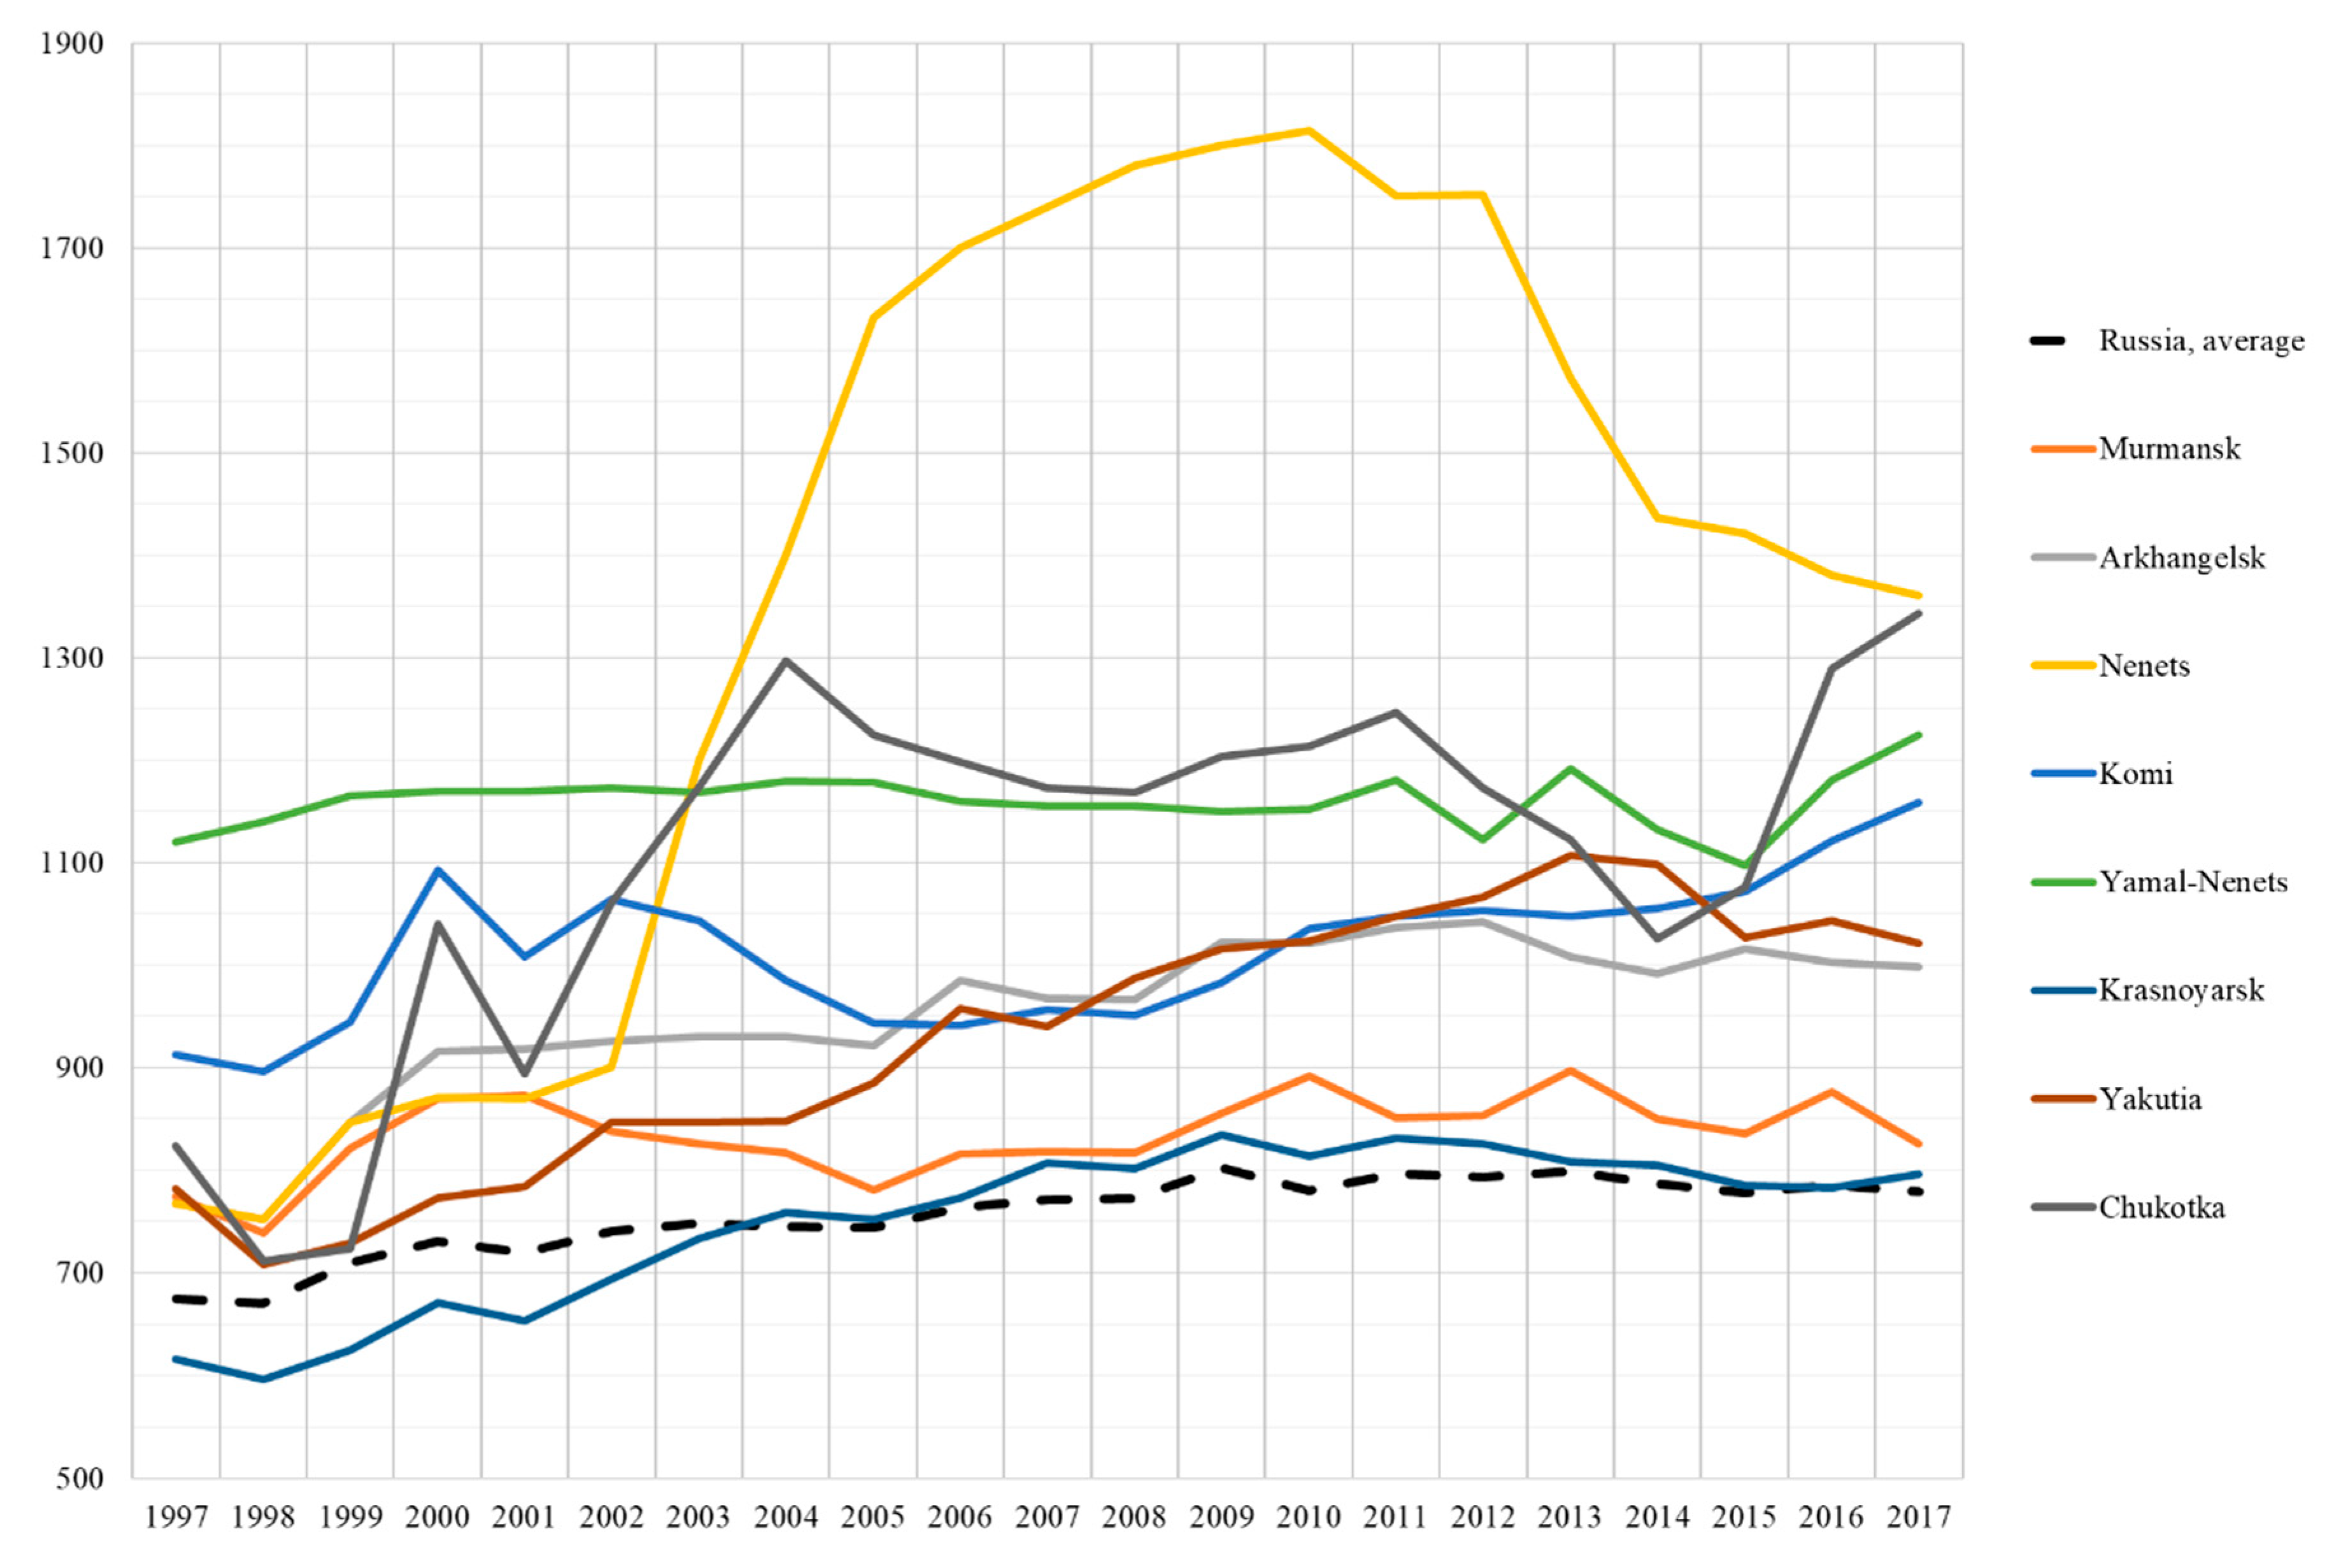
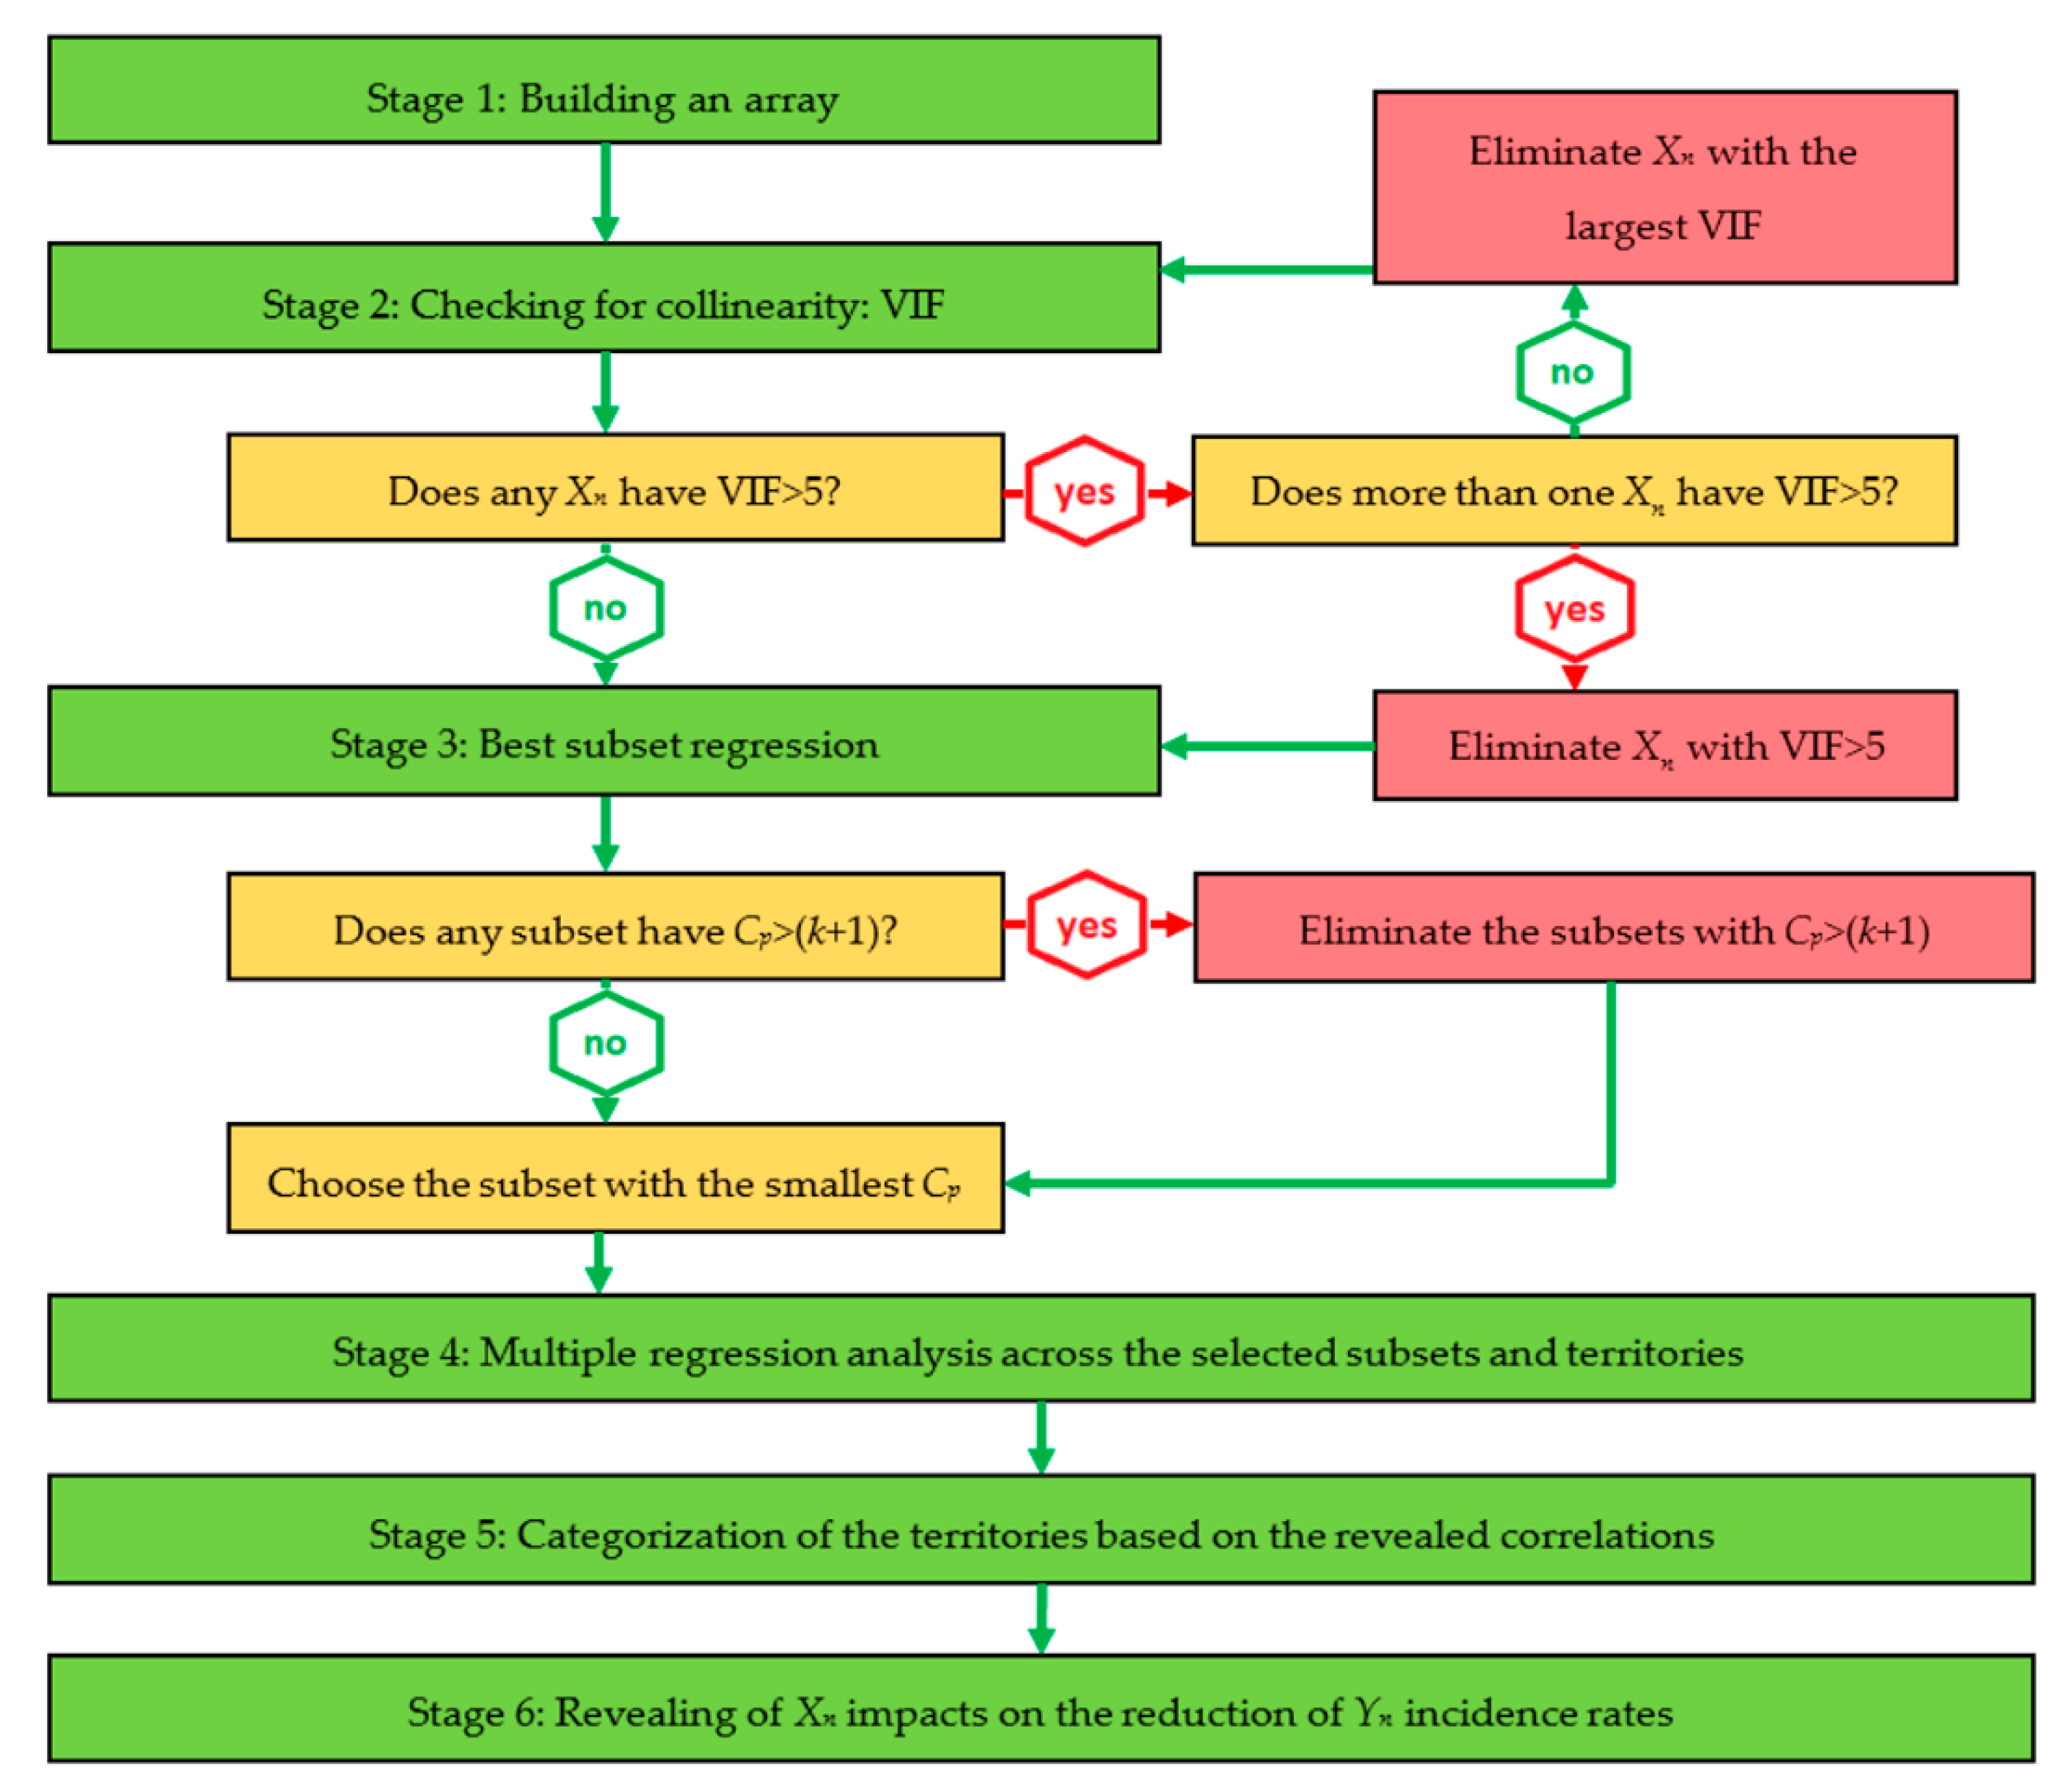
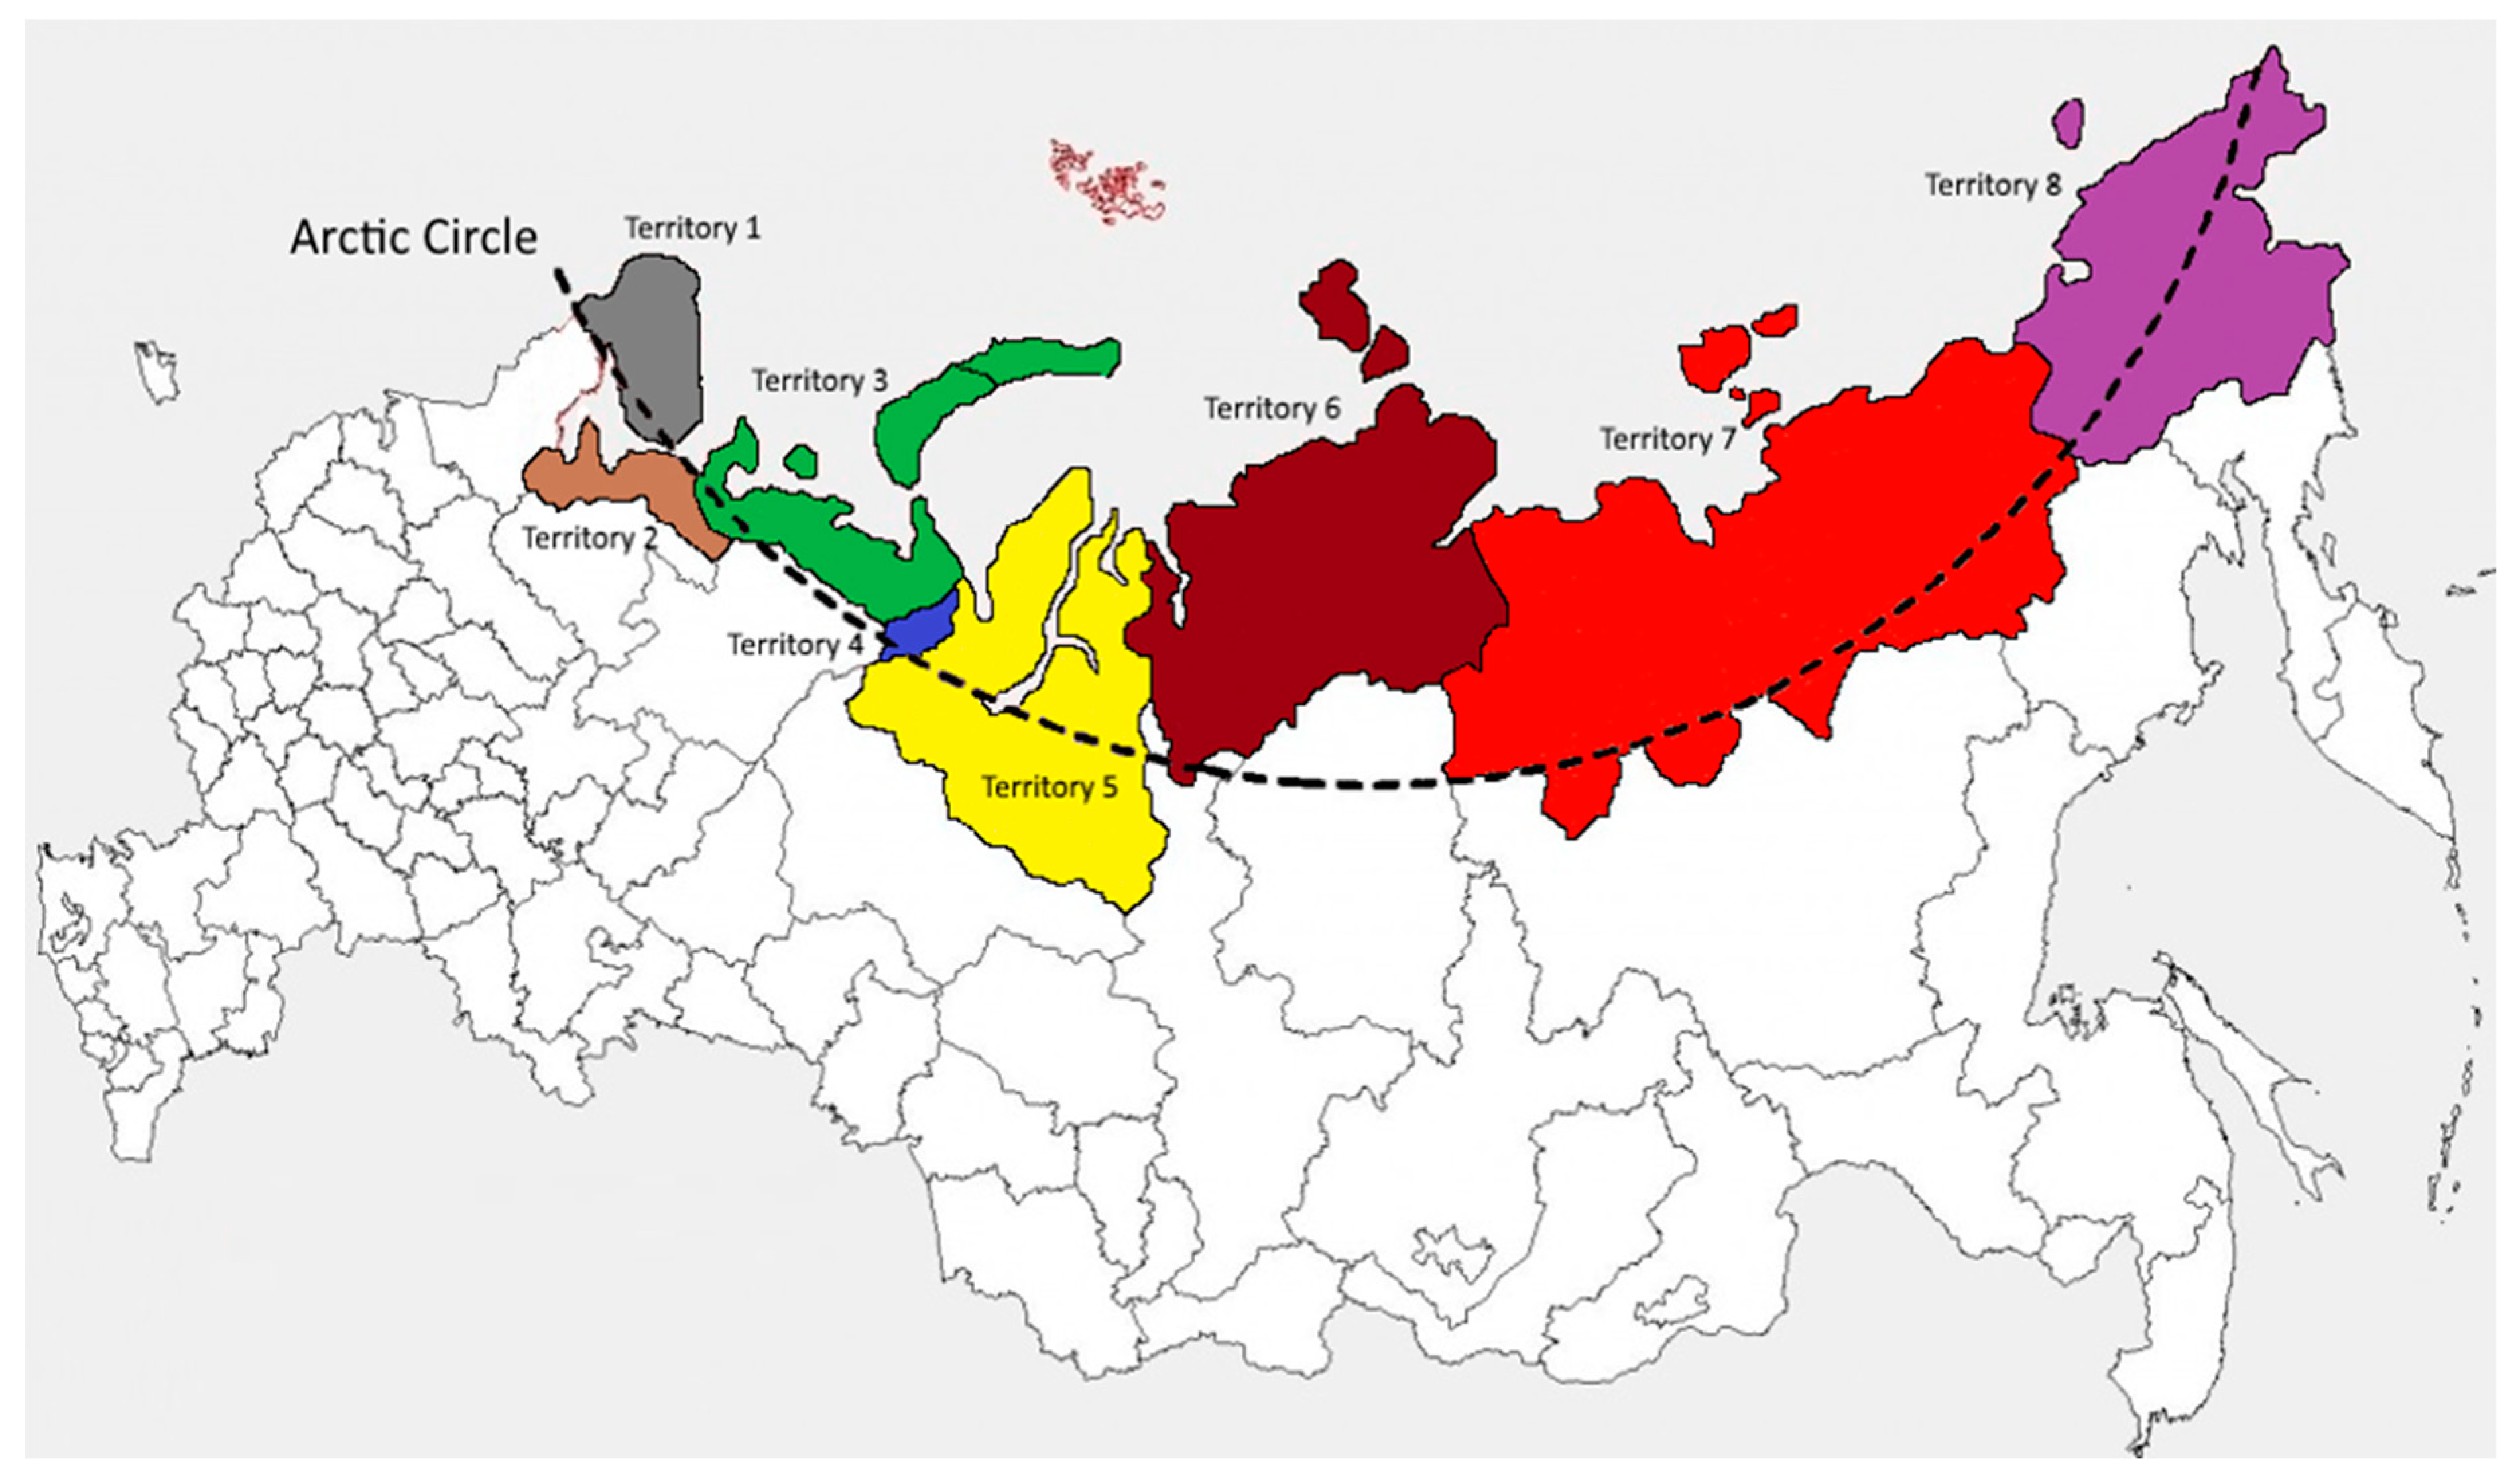
Table 1.
Major diseases and health disorders in the Russian Arctic, average in 1997–2017, incidence rates per 1000 people.
Table 1.
Major diseases and health disorders in the Russian Arctic, average in 1997–2017, incidence rates per 1000 people.
| Diseases and Health Disorders * | Russia | Arctic Zone of Russia | Territories ** | |||||||
|---|---|---|---|---|---|---|---|---|---|---|
| 1 | 2 | 3 | 4 | 5 | 6 | 7 | 8 | |||
| Diseases of the respiratory system | 333.66 | 430.46 | 366.94 | 404.63 | 561.92 | 464.59 | 435.86 | 273.94 | 416.65 | 519.18 |
| Diseases of the genitourinary system | 47.61 | 62.00 | 49.56 | 55.88 | 108.71 | 60.25 | 73.12 | 45.80 | 47.10 | 55.60 |
| Diseases of the skin and subcutaneous tissue | 46.02 | 56.34 | 50.95 | 48.64 | 69.04 | 70.11 | 56.09 | 45.22 | 54.09 | 54.86 |
| Diseases of the digestive system | 34.84 | 53.36 | 29.81 | 48.63 | 106.31 | 32.85 | 53.38 | 35.27 | 66.30 | 54.29 |
| Infectious and parasitic diseases | 31.07 | 47.08 | 42.44 | 49.63 | 66.63 | 54.19 | 49.60 | 39.49 | 34.45 | 40.22 |
| Diseases of the nervous system | 15.87 | 25.20 | 18.59 | 18.60 | 28.76 | 22.22 | 34.09 | 20.57 | 32.21 | 26.58 |
| Diseases of the circulatory system | 28.44 | 23.62 | 17.78 | 23.16 | 32.65 | 17.81 | 21.54 | 27.04 | 24.67 | 24.88 |
| Endocrine, nutritional, and metabolic diseases | 11.52 | 14.34 | 14.05 | 11.01 | 26.94 | 12.14 | 13.67 | 9.92 | 14.87 | 12.12 |
| Neoplasms | 11.13 | 11.23 | 12.57 | 10.09 | 12.86 | 10.56 | 12.69 | 12.13 | 9.14 | 9.76 |
| Diseases of the blood and blood-forming organs | 4.68 | 5.49 | 3.01 | 5.11 | 10.24 | 5.31 | 5.34 | 3.57 | 5.71 | 5.63 |
Note: * In descending order of the incidence rates across the Arctic zone of Russia; ** 1: Murmansk region; 2: Arkhangelsk region; 3: Nenets Autonomous District; 4: Komi Republic; 5: Yamal-Nenets Autonomous District; 6: Krasnoyarsk region; 7: Republic of Sakha (Yakutia); 8: Chukotka Autonomous District. Source: authors’ development based on the Federal Service of State Statistics of the Russian Federation [41].
Table 2.
Types of diseases included in the model as regressands.
| Index | Regressands |
|---|---|
| Y1 | Certain infectious and parasitic diseases |
| Y2 | Neoplasms |
| Y3 | Diseases of the blood and blood-forming organs and disorders involving the immune mechanism |
| Y4 | Endocrine, nutritional, and metabolic diseases |
| Y5 | Diseases of the nervous system |
| Y6 | Diseases of the eye and adnexa |
| Y7 | Diseases of the ear and mastoid process |
| Y8 | Diseases of the circulatory system |
| Y9 | Diseases of the respiratory system |
| Y10 | Diseases of the digestive system |
| Y11 | Diseases of the skin and subcutaneous tissue |
| Y12 | Diseases of the musculoskeletal system and connective tissue |
| Y13 | Diseases of the genitourinary system |
| Y14 | Congenital malformations, deformations, and chromosomal abnormalities |
Note: for all Yn, the measure is the incidence rate per 1000 people. Source: authors’ development.
Table 3.
Regressors included in the model.
| Index | Regressors | Measure |
|---|---|---|
| X1 | Air pollutant emissions | Thousand tons |
| X2 | The capture of air pollutant emissions | Thousand tons |
| X3 | Freshwater utilization | Mln m3 |
| X4 | Recycled and reused water | Mln m3 |
| X5 | Wastewater discharge into the surface and underground water sources | Mln m3 |
| X6 | Percentage of households having running water available in their homes | % |
| X7 | Per capita consumption of meat products | kg/year |
| X8 | Per capita consumption of dairy products | kg/year |
| X9 | Per capita consumption of vegetables | kg/year |
| X10 | Per capita consumption of bread | kg/year |
| X11 | Per capita consumption of fish and marine mammals | kg/year |
| X12 | Traditional food proportion in a diet | % |
| X13 | The proportion of households with a hunter, a herder, or a fisherman in a family | % |
| X14 | The real value of cash incomes | Percentage over the previous year |
| X15 | The proportion of the population living below a minimum subsistence income | % |
| X16 | The proportion of food expenditures in total household’s expenditures | % |
Source: authors’ development.
Table 4.
Xn intervals and effects on Yn.
| Intervals | Effects on Yn |
|---|---|
| (Xmax + Xmed)/2 ≥ Xmed ≥ (Xmin + Xmed)/2 | Positive (P) Negative (N) |
| Xmax ≥ Xn > (Xmax + Xmed)/2 | High positive (HP) Extremely negative (EN) |
| (Xmin + Xmed)/2 > Xn ≥ Xmin | Moderately positive (MP) Moderately negative (MN) |
Note: Xn – regressors, Yn – regressands. Source: authors’ development.
Table 5.
Coefficient of multiple determination (R2) and variance inflationary factor (VIF) values of X1–16 variables to be selected for the model.
Table 5.
Coefficient of multiple determination (R2) and variance inflationary factor (VIF) values of X1–16 variables to be selected for the model.
| Variables | Values per Territories 1–8 | |||||||||||||||
|---|---|---|---|---|---|---|---|---|---|---|---|---|---|---|---|---|
| 1 | 2 | 3 | 4 | 5 | 6 | 7 | 8 | |||||||||
| R2 | VIF | R2 | VIF | R2 | VIF | R2 | VIF | R2 | VIF | R2 | VIF | R2 | VIF | R2 | VIF | |
| X1 | 0.658 | 2.924 | 0.505 | 2.020 | 0.883 | 8.547 * | 0.722 | 3.597 | 0.664 | 2.976 | 0.684 | 3.165 | 0.583 | 2.398 | 0.565 | 2.299 |
| X2 | 0.703 | 3.367 | 0.782 | 4.587 | 0.908 | 10.870 * | 0.784 | 4.630 | 0.866 | 7.463 * | 0.821 | 5.587 * | 0.502 | 2.008 | 0.632 | 2.717 |
| X3 | 0.794 | 4.854 | 0.669 | 3.021 | 0.734 | 3.759 | 0.693 | 3.257 | 0.729 | 3.690 | 0.533 | 2.141 | 0.668 | 3.012 | 0.602 | 2.513 |
| X4 | 0.892 | 9.259 * | 0.809 | 5.236 * | 0.729 | 3.690 | 0.856 | 6.944 * | 0.768 | 4.310 | 0.738 | 3.817 | 0.771 | 4.367 | 0.718 | 3.546 |
| X5 | 0.707 | 3.413 | 0.741 | 3.861 | 0.710 | 3.448 | 0.923 | 12.987 * | 0.901 | 10.101 * | 0.453 | 1.828 | 0.359 | 1.560 | 0.391 | 1.642 |
| X6 | 0.826 | 5.747 * | 0.840 | 6.250 * | 0.780 | 4.545 | 0.765 | 4.255 | 0.814 | 5.376 * | 0.557 | 2.257 | 0.538 | 2.165 | 0.597 | 2.481 |
| X7 | 0.238 | 1.312 | 0.304 | 1.437 | 0.338 | 1.511 | 0.404 | 1.678 | 0.327 | 1.486 | 0.289 | 1.406 | 0.244 | 1.323 | 0.248 | 1.330 |
| X8 | 0.572 | 2.336 | 0.620 | 2.632 | 0.547 | 2.208 | 0.528 | 2.119 | 0.488 | 1.953 | 0.390 | 1.639 | 0.372 | 1.592 | 0.447 | 1.808 |
| X9 | 0.729 | 3.690 | 0.783 | 4.608 | 0.702 | 3.356 | 0.675 | 3.077 | 0.662 | 2.959 | 0.582 | 2.392 | 0.497 | 1.988 | 0.523 | 2.096 |
| X10 | 0.448 | 1.812 | 0.426 | 1.742 | 0.413 | 1.704 | 0.449 | 1.815 | 0.493 | 1.972 | 0.299 | 1.427 | 0.265 | 1.361 | 0.298 | 1.425 |
| X11 | 0.582 | 2.392 | 0.605 | 2.532 | 0.526 | 2.110 | 0.572 | 2.336 | 0.504 | 2.016 | 0.451 | 1.821 | 0.493 | 1.972 | 0.513 | 2.053 |
| X12 | 0.730 | 3.704 | 0.752 | 4.032 | 0.699 | 3.322 | 0.730 | 3.704 | 0.726 | 3.650 | 0.504 | 2.016 | 0.478 | 1.916 | 0.571 | 2.331 |
| X13 | 0.401 | 1.669 | 0.369 | 1.585 | 0.454 | 1.832 | 0.467 | 1.876 | 0.552 | 2.232 | 0.373 | 1.595 | 0.401 | 1.669 | 0.389 | 1.637 |
| X14 | 0.385 | 1.626 | 0.358 | 1.558 | 0.405 | 1.681 | 0.501 | 2.004 | 0.487 | 1.949 | 0.596 | 2.475 | 0.660 | 2.941 | 0.725 | 3.636 |
| X15 | 0.772 | 4.386 | 0.730 | 3.704 | 0.683 | 3.155 | 0.656 | 2.907 | 0.702 | 3.356 | 0.882 | 8.475 * | 0.854 | 6.849 * | 0.836 | 6.098 * |
| X16 | 0.745 | 3.922 | 0.777 | 4.484 | 0.761 | 4.184 | 0.700 | 3.333 | 0.711 | 3.460 | 0.847 | 6.536 * | 0.871 | 7.752 * | 0.883 | 8.547 * |
Note: * collinearity detected. Source: authors’ development
Table 6.
Subsets of Xn variables selected for the inclusion in the model per territories.
| Territories | Adjusted R2 | Mallows‘ Cp Statistic | Number of Variables (k+1) | Variables | |
|---|---|---|---|---|---|
| Included in the Best Subsets | Eliminated from the Model | ||||
| 1 | 0.738 | 9.185 | 14 | X1–3, X5, X7–12, X14–16 | X4, X6, X13 |
| 2 | 0.641 | 10.117 | 13 | X1–3, X7–11, X12–16 | X4–6, X13 |
| 3 | 0.790 | 5.499 | 14 | X4–16 | X1–3 |
| 4 | 0.704 | 11.343 | 15 | X1–3, X6–16 | X4, X5 |
| 5 | 0.529 | 8.170 | 13 | X1, X3, X7–16 | X2, X4–6 |
| 6 | 0.674 | 12.274 | 13 | X1, X3, X5–14 | X2, X4, X15, X16 |
| 7 | 0.742 | 10.398 | 15 | X1–14 | X15, X16 |
| 8 | 0.787 | 13.926 | 15 | X1–14 | X15, X16 |
Source: authors’ development.
Table 7.
R2 coefficients across the territories and regressands.
| Regressands | Territories | Average/Yn | |||||||
|---|---|---|---|---|---|---|---|---|---|
| 1 | 2 | 3 | 4 | 5 | 6 | 7 | 8 | ||
| Y1 | 0.9362 | 0.9719 | 0.9394 | 0.9773 | 0.9274 | 0.9628 | 0.9548 | 0.9555 | 0.9532 |
| Y2 | 0.9459 | 0.9558 | 0.9428 | 0.9854 | 0.9556 | 0.9733 | 0.9729 | 0.9780 | 0.9637 |
| Y3 | 0.9638 | 0.9250 | 0.9551 | 0.9660 | 0.9781 | 0.9709 | 0.9882 | 0.9702 | 0.9647 |
| Y4 | 0.9721 | 0.9289 | 0.9483 | 0.9748 | 0.9770 | 0.9612 | 0.9446 | 0.9773 | 0.9605 |
| Y5 | 0.9690 | 0.9499 | 0.9444 | 0.9619 | 0.9733 | 0.9883 | 0.9895 | 0.9805 | 0.9696 |
| Y6 | 0.8882 | 0.9726 | 0.9702 | 0.9834 | 0.9712 | 0.9714 | 0.9697 | 0.9699 | 0.9621 |
| Y7 | 0.9314 | 0.9515 | 0.9619 | 0.9286 | 0.9843 | 0.9770 | 0.9726 | 0.9763 | 0.9605 |
| Y8 | 0.9792 | 0.9772 | 0.9825 | 0.9779 | 0.9708 | 0.9823 | 0.9711 | 0.9218 | 0.9704 |
| Y9 | 0.8513 | 0.9610 | 0.9803 | 0.9118 | 0.9755 | 0.9465 | 0.9835 | 0.9505 | 0.9451 |
| Y10 | 0.9619 | 0.8981 | 0.9814 | 0.9623 | 0.9357 | 0.9496 | 0.9804 | 0.9715 | 0.9551 |
| Y11 | 0.8474 | 0.9057 | 0.9810 | 0.8517 | 0.9689 | 0.9449 | 0.9566 | 0.9311 | 0.9234 |
| Y12 | 0.9317 | 0.9511 | 0.9882 | 0.9362 | 0.9544 | 0.9755 | 0.9709 | 0.9017 | 0.9512 |
| Y13 | 0.9440 | 0.8842 | 0.9507 | 0.9814 | 0.9725 | 0.9883 | 0.9745 | 0.9447 | 0.9550 |
| Y14 | 0.8863 | 0.9702 | 0.9415 | 0.9793 | 0.8813 | 0.8028 | 0.9330 | 0.8966 | 0.9114 |
| Average/territory | 0.9292 | 0.9431 | 0.9620 | 0.9556 | 0.9590 | 0.9568 | 0.9687 | 0.9518 | 0.9533 |
Source: authors’ development.
Table 8.
The effects of independent variables on Yn: generalization for the Russian Arctic *.
| Y1 | Y2 | Y3 | Y4 | Y5 | Y6 | Y7 | Y8 | Y9 | Y10 | Y11 | Y12 | Y13 | Y14 | |
|---|---|---|---|---|---|---|---|---|---|---|---|---|---|---|
| X1 | N | N | N | N | N | N | N | N | N | N | N | P | N | P |
| X2 | N | P | N | P | N | N | P | N | P | N | P | P | P | P |
| X3 | P | N | N | N | N | N | P | N | P | P | P | P | N | P |
| X4 | P | N | P | N | N | N | P | N | N | P | P | P | N | N |
| X5 | N | HP | N | N | P | P | EN | P | N | P | P | N | N | P |
| X6 | HP | EN | P | EN | HP | EN | HP | EN | EN | EN | HP | N | EN | HP |
| X7 | P | N | EN | P | N | N | N | N | P | P | N | N | HP | N |
| X8 | N | P | P | N | N | P | N | P | N | P | N | P | P | P |
| X9 | P | P | N | N | N | N | P | P | N | HP | N | N | P | N |
| X10 | P | N | N | P | N | P | N | N | P | N | N | N | N | N |
| X11 | N | P | HP | P | N | N | N | HP | P | P | P | P | N | EN |
| X12 | P | N | P | P | P | N | N | N | P | N | N | P | N | N |
| X13 | EN | P | P | HP | N | N | P | N | N | N | EN | EN | N | N |
| X14 | P | N | N | P | P | P | P | P | HP | P | P | P | N | N |
| X15 | P | N | N | P | EN | P | P | N | P | P | P | HP | P | N |
| X16 | P | P | N | N | N | HP | P | N | P | P | P | P | P | N |
Note: * for particular Xn, the generalizations cover only those territories in which the respective Xn is included in the per-territorial models; HP—the highest positive impact of Xn on the reduction of Yn; P—positive impact of Xn on the reduction of Yn; N—negative impact of Xn on the reduction of Yn; EN—extremely negative impact of Xn on the reduction of Yn. Source: authors’ development.
Table 9.
Types of the territories.
| Type | Territory | Parameter Value, 1997–2017 Average | |
|---|---|---|---|
| Arctic Zone | Territory | ||
| Type 1 | Territory 5 | X1 = 627.32 | X1 = 813.77 |
| Territory 6 | X1 = 2672.13 | ||
| Type 2 | Territory 1 | X12 = 51.64 | X12 = 73.15 |
| Territory 2 | X12 = 80.02 | ||
| Territory 4 | X12 = 59.60 | ||
| Type 3 | Territory 7 | X7 = 63.46 | X7 = 89.76 |
| Type 4 | Territory 8 | X11 = 17.99 | X11 = 34.44 |
| Territory 3 | X11 = 23.58 | ||
Source: authors’ development.
Table 10.
Incidence rates of Yn diseases and related health problems across the territories of the Russian Arctic, average in 1997–2017, cases per 1000 people.
Table 10.
Incidence rates of Yn diseases and related health problems across the territories of the Russian Arctic, average in 1997–2017, cases per 1000 people.
| Diseases and Health Disorders | Territories | Russian Arctic | |||
|---|---|---|---|---|---|
| Type 1 | Type 2 | Type 3 | Type 4 | ||
| Y1 | 44.55 | 48.75 | 34.45 | 53.43 | 45.30 |
| Y2 | 12.41 | 11.07 | 9.14 | 11.31 | 10.98 |
| Y3 | 4.45 | 4.48 | 5.71 | 7.94 | 5.65 |
| Y4 | 11.79 | 12.40 | 14.87 | 19.53 | 14.65 |
| Y5 | 27.33 | 19.80 | 32.21 | 27.67 | 26.75 |
| Y6 | 49.15 | 35.66 | 43.67 | 61.50 | 47.50 |
| Y7 | 29.22 | 28.53 | 21.84 | 37.35 | 29.24 |
| Y8 | 24.29 | 19.58 | 24.67 | 28.77 | 24.33 |
| Y9 | 354.90 | 412.05 | 416.65 | 540.55 | 431.04 |
| Y10 | 44.33 | 37.10 | 66.30 | 80.30 | 57.01 |
| Y11 | 50.66 | 56.57 | 54.09 | 62.80 | 56.03 |
| Y12 | 41.47 | 40.78 | 31.68 | 58.42 | 43.09 |
| Y13 | 59.46 | 55.23 | 47.10 | 82.16 | 60.99 |
| Y14 | 2.11 | 2.50 | 2.07 | 4.18 | 2.72 |
Source: authors’ development.
Table 11.
Positive effects of Xn variables on the reduction of Yn.
| Type 1 Territories | Type 2 Territories | Type 3 Territories | Type 4 Territories | |||||||||
|---|---|---|---|---|---|---|---|---|---|---|---|---|
| HP | P | MP | HP | P | MP | HP | P | MP | HP | P | MP | |
| Y1 | X9 | X11, X12 | X16 | X7, X10, X14 | X9, X15 | X6, X12 | X10 | X4, X2, X3, X9 | X5 | X6, X8 | X12, X4 | |
| Y2 | X11, X8 | X13, X10, X14 | X1 | X13 | X16, X8 | X2, X9, X14 | X13, X14 | X8 | X1, X9 | X5 | X8, X9, X13 | X14, X4 |
| Y3 | X11 | X8 | X7 | X9, X12, X11, X3 | X14, X2 | X6, X11 | X8 | X1, X3, X10, X14 | X11, X5 | X4, X7 | X14, X8 | |
| Y4 | X11, X8 | X12 | X14, X1 | X7, X8 | X9, X15 | X14, X2, X3 | X14 | X6, X11 | X1, X8 | X11, X10, X5 | X4, X9, X12 | X14, X8 |
| Y5 | X6 | X12 | X1, X5 | X14 | X8, X9 | X3 | X6 | X12, X14 | X5, X2 | X5, X11 | X10, X13 | X8, X7, X12 |
| Y6 | X11, X9 | X12, X8 | X1, X3, X10 | X16 | X8, X10 | X12 | X6, X11 | X10, X14 | X5, X1, X2, X7 | X6 | X7 | X14, X12 |
| Y7 | X7 | X9, X10 | X14, X3 | X16 | X8 | X14 | X6, X12 | X11 | X2, X4, X10 | X6, X10 | X4, X8 | X13 |
| Y8 | X11 | X8, X9 | X12 | X15 | X9 | X10, X8, X14 | X11, X14 | X6 | X2, X1, X7 | X6, X11 | X10, X5 | X14, X8 |
| Y9 | X9, X13 | X10, X11 | X14, X3, X8 | X13, X15 | X7, X14 | X1, X3, X8 | X12 | X5, X10 | X4, X2, X3 | X5 | X11, X7 | X8 |
| Y10 | X11, X13 | X9, X10 | X1, X3 | X13, X15 | X10, X16 | X3, X8, X9 | X6 | X11, X12, X14 | X1, X2 | X9, X6 | X10, X11 | X4, X12, X14 |
| Y11 | X11, X9 | X7, X12 | X3 | X16, X15 | X8, X11, X13, X14 | X3 | X6, X14 | X10, X11, X12 | X4, X1, X2, X7 | X6 | X8 | X4, X14, X11 |
| Y12 | X11 | X10, X13 | X8 | X13 | X8 | X1, X3, X12, X14, X16 | X6, X11 | X10, X14 | X5, X2, X7, X8 | X6, X11 | X7, X15, X4 | X12, X14 |
| Y13 | X11, X7 | X10, X13, X14 | X3, X9 | X15, X12 | X7, X9 | X2, X14 | X14 | X6, X11 | X2, X1, X7, X8 | X6, X5 | X8, X15, X11 | X14, X4 |
| Y14 | X7 | X10 | X15 | X14, X12 | X1, X8, X3 | X14 | X6 | X1, X2, X7, X8 | X4, X5 | X9, X10 | X13, X8 | |
Note: HP—high positive, P—positive, MP—moderately positive. Source: authors’ development.
Table 12.
Negative effects of Xn variables on the reduction of Yn.
| Type 1 Territories | Type 2 Territories | Type 3 Territories | Type 4 Territories | |||||||||
|---|---|---|---|---|---|---|---|---|---|---|---|---|
| EN | N | MN | EN | N | MN | EN | N | MN | EN | N | MN | |
| Y1 | X7, X10, X13 | X8, X14 | X1, X3 | X8, X12 | X13, X14 | X1, X2, X3 | X13 | X11, X14 | X7, X8 | X7, X13 | X10, X9 | X14, X11 |
| Y2 | X12, X7 | X9 | X3 | X12, X10 | X15, X11, X7 | X1, X3 | X12, X6 | X5, X10 | X4, X2, X3 | X7, X6 | X1, X12 | X11, X10 |
| Y3 | X7, X12 | X6, X13, X14 | X3, X10, X1 | X16 | X15, X10 | X8, X1 | X7, X12 | X5 | X2, X9, X13 | X3 | X6, X12, X13 | X10, X9 |
| Y4 | X6 | X7, X10 | X13, X9 | X16 | X12, X11 | X5, X1, X10 | X12 | X5, X7, X9, X13 | X2, X3, X4 | X6 | X7 | X16 |
| Y5 | X10 | X11, X7, X13 | X8, X3, X14 | X11, X7 | X12, X16, X15 | X2, X1 | X13 | X7, X9, X10 | X4, X1, X3 | X9, X6 | X3 | X14, X4 |
| Y6 | X7 | X15, X14 | X13 | X6 | X9, X11, X14, X15 | X3, X2, X1, X7 | X13 | X9, X12 | X4, X3 | X5, X13 | X8, X9, X10 | X11, X4 |
| Y7 | X11, X8 | X12, X13 | X1, X16 | X6 | X15, X9, X10, X12 | X2, X1, X3, X7 | X13 | X7, X9, X14 | X1, X5, X8 | X5 | X9, X11, X7 | X14, X12 |
| Y8 | X10, X7 | X13, X14 | X3, X1 | X6 | X7, X11, X12 | X2, X3, X16, X1 | X12 | X9, X10, X13 | X4, X3, X5 | X12, X13 | X4, X7 | X3, X9 |
| Y9 | X6 | X7, X5 | X12, X1 | X16 | X10, X11, X12 | X2, X5, X9 | X13 | X6, X8, X11 | X7, X1, X9 | X6, X12 | X4, X10, X13 | X9, X14 |
| Y10 | X12 | X14 | X8, X7 | X6 | X7, X14, X11 | X2, X1 | X9 | X13 | X4, X3, X5, X8 | X5, X13 | X3, X7 | X8, X15 |
| Y11 | X10, X8 | X13, X14 | X1 | X7 | X9, X12, X10 | X2, X1 | X13 | X9 | X3, X8 | X5, X13 | X9, X10, X12 | X7 |
| Y12 | X7, X6 | X12, X14 | X3, X1, X9 | X7 | X10, X11, X15 | X2, X9 | X13, X9 | X12 | X4, X3 | X5, X13 | X8, X9 | X10 |
| Y13 | X15, X6 | X8, X12 | X5, X1 | X6 | X8, X10, X11 | X3, X1, X16 | X12 | X9, X10, X13 | X4, X3, X5 | X9, X13 | X7 | X12, X10 |
| Y14 | X8, X11 | X12, X14, X13 | X1, X9, X3 | X11, X7 | X16, X9 | X10, X2 | X12 | X3, X10, X11 | X4, X5, X13 | X6, X11 | X7, X15 | X12, X14 |
Note: EN—extremely negative, N—negative, MN—moderately negative. Source: authors’ development
© 2020 by the authors. Licensee MDPI, Basel, Switzerland. This article is an open access article distributed under the terms and conditions of the Creative Commons Attribution (CC BY) license (http://creativecommons.org/licenses/by/4.0/).
Share and Cite
MDPI and ACS Style
Gao, T.; Erokhin, V. Capturing a Complexity of Nutritional, Environmental, and Economic Impacts on Selected Health Parameters in the Russian High North. Sustainability 2020, 12, 2151. https://0-doi-org.brum.beds.ac.uk/10.3390/su12052151
AMA Style
Gao T, Erokhin V. Capturing a Complexity of Nutritional, Environmental, and Economic Impacts on Selected Health Parameters in the Russian High North. Sustainability. 2020; 12(5):2151. https://0-doi-org.brum.beds.ac.uk/10.3390/su12052151
Chicago/Turabian StyleGao, Tianming, and Vasilii Erokhin. 2020. "Capturing a Complexity of Nutritional, Environmental, and Economic Impacts on Selected Health Parameters in the Russian High North" Sustainability 12, no. 5: 2151. https://0-doi-org.brum.beds.ac.uk/10.3390/su12052151
Note that from the first issue of 2016, this journal uses article numbers instead of page numbers. See further details here.