Urban Digital Twins for Smart Cities and Citizens: The Case Study of Herrenberg, Germany


1
High-Performance Computing Center Stuttgart (HLRS), Nobelstraße 19, 70569 Stuttgart, Germany
2
Fraunhofer IAO, Smart Urban Environments, Nobelstraße 12, 70569 Stuttgart, Germany
3
Research Center for Interdisciplinary Risk and Innovation Studies (ZIRIUS), University of Stuttgart, Seidenstraße 36, 70174 Stuttgart, Germany
4
Faculty of Spatial Sciences, University of Groningen, Landleven 1, 9747AD Groningen, The Netherlands
*
Author to whom correspondence should be addressed.
Sustainability 2020, 12(6), 2307; https://0-doi-org.brum.beds.ac.uk/10.3390/su12062307
Submission received: 28 January 2020
/
Revised: 10 March 2020
/
Accepted: 12 March 2020
/
Published: 16 March 2020
(This article belongs to the Special Issue Smart Cities, City Dashboards, Planning and Evaluation of Urban Performances)
Abstract
:Cities are complex systems connected to economic, ecological, and demographic conditions and change. They are also characterized by diverging perceptions and interests of citizens and stakeholders. Thus, in the arena of urban planning, we are in need of approaches that are able to cope not only with urban complexity but also allow for participatory and collaborative processes to empower citizens. This to create democratic cities. Connected to the field of smart cities and citizens, we present in this paper, the prototype of an urban digital twin for the 30,000-people town of Herrenberg in Germany. Urban digital twins are sophisticated data models allowing for collaborative processes. The herein presented prototype comprises (1) a 3D model of the built environment, (2) a street network model using the theory and method of space syntax, (3) an urban mobility simulation, (4) a wind flow simulation, and (5) a number of empirical quantitative and qualitative data using volunteered geographic information (VGI). In addition, the urban digital twin was implemented in a visualization platform for virtual reality and was presented to the general public during diverse public participatory processes, as well as in the framework of the “Morgenstadt Werkstatt” (Tomorrow’s Cities Workshop). The results of a survey indicated that this method and technology could significantly aid in participatory and collaborative processes. Further understanding of how urban digital twins support urban planners, urban designers, and the general public as a collaboration and communication tool and for decision support allows us to be more intentional when creating smart cities and sustainable cities with the help of digital twins. We conclude the paper with a discussion of the presented results and further research directions.
1. Introduction
In general, digital technologies and their applications are of great importance for processes bridging formal and rational knowledge for smarter, more sustainable governance of cities involving the experience of citizens, supporting a smart, democratic urban planning process. Herein, modeling and visualization of complex processes and data, including the participation of marginalized groups, are essential. Herein, digital twins have the capacity to tackle complex challenges for cities. However, until now, in the arena of modeling and simulation, digital twins have been mainly used in the field of engineering, and their implementation for towns has only recently been discussed [1]. They are digital representations of material or immaterial objects, e.g., machines of the real world. Digital twins enable comprehensive data exchange and can contain models, simulations, and algorithms describing their counterpart, including its features and behavior in the real world [2]. To enhance real-life perception, they can be implemented in virtual reality (VR).
To that end, we developed an urban digital twin applied to the town of Herrenberg in Germany, which can be applied and visualized almost seamlessly across all scales, on multiple layers, and in different categories of data in virtual and augmented reality (VR, AR) for collaborative and participatory processes, focusing on urban planning, urban design, and decision support.
The Herrenberg digital twin differs from other simulation-based studies in the field of smart cities, in particular by linking and combining various urban data from models, analysis, and simulation and by the implementation of social data collected from citizens. Furthermore, the visualization in virtual reality (“virtual twin”) not only enables broad citizen participation but also collaboration between stakeholders. The advantage of using virtual reality environments—such as stereoscopic back projection units, large 3D display respectively tiled display systems or CAVEs (Cave Automatic Virtual Environment), for example—is that different participants with diverging professional and personal backgrounds can be informed simultaneously. These technologies can enhance discussion and help build consensus among stakeholders [3]. In this context, virtual reality facilities, urban digital twins, and visualization techniques are highly useful: As Arnstein (1969) points out, it needs real power and not only empty rituals to affect the outcome of such processes [4]. Our approach described here supports not only citizens but also decision-makers and planning professionals with tools to achieve partnership. Enriched with quantitative and qualitative empirical data, they serve as one promising approach for not only tackling the complexity of cities but also involving citizens in urban planning and design processes [3].
An urban digital twin is not the exact copy of reality, but a sophisticated abstraction of ibidem. This results from a classical dilemma in the field of modeling, as models always have a certain level of abstraction. An urban digital twin can be best characterized as a container for models, data, and simulations. Beyond these challenges, it has great potential to support scenario development processes and testing of these at all scales. Using an urban digital twin in virtual reality is not only a novel way of using smart technologies for collaborative planning processes, but also facilitates consensus-building among participants with different backgrounds [3]. This is further connected to a common learning process linked to educational aspects such as involving youth or other different groups of citizens that are usually less involved in such processes. As Glaeser et al. (2006) rightly pointed out, better-educated citizens are more likely to preserve and strengthen democracy [4].
Consequently, the paper is structured as follows. In the following Section 2, we connect the urban digital twin to the smart and sustainable city debate. This is followed by Section 3, where the research methodology is described. Section 4 follows with an elaboration on the findings and discussions, and finally, Section 5 concludes with insights into the practical implication and directions for future research.
2. Background: The Smart(er) City
Let us recall that cities are complex systems [5,6,7,8] inter alia connected to dynamic economic, ecological, and demographic dynamics. Within these, complex systems challenges are increasingly addressed and attempted to be overcome by applying a diverse range of more or less innovative and technological concepts, such as car-sharing and autonomous driving, decentralized smart energy grids, smart housing concepts, or digitization of administrational tasks. Cities, established firms, and startups, as well as individual citizens, are driving these developments, often with diverging perceptions, motivations, and interests with regard to goals and outcomes. It pursues solutions based on information and communications technologies, which have often been summarized under the term smart city in recent years.
Even though the concept itself is not entirely new for public administration, the beginning of the term dates back to the 1990s and is associated with the concept of smart growth [9]; in fact, there is no generally accepted definition of smart cities that would correspond to the smart cities concept on a global level [10]. The definition of the matter ranges from the interrelationship between the education of the urban population, local amenities and attractiveness for educated citizens [11,12], and emphasizing the importance of the creative class [13] up to theories describing cities or projects that use information and communication technologies in order to improve the life quality of their inhabitants within the scope of sustainable development [14,15]. Sustainability considers the spheres of social, ecological, and economic conditions. Herein, sustainable smart planning deals with the development of strategies to reduce and recycle resources, increase economic efficiency, and improve the integration of social aspects. These are, for example, pedestrian-friendly environments, efficient road networks and mobility systems, sustainable land use, circular economy, or access for all to jobs, retail, services, healthcare, culture, and leisure. Some authors are combining the sustainable and smart city approach [16,17,18], and for others, the concept is considered to be a response to global climate change or a step in an effort to make city management more effective, or even to try to attract more Y and Z generations, which are often seen as promoters of new economic effectiveness [18]. The social and ethical implications of the development of these digital technologies, as well as the growing influence of technology giants on city economics, the freedom and privacy of its inhabitants [19] are a separate issue and not taken into account adequately within many of these definitions and concepts.
Smart cities are opening the way for the collection of so-called "big data", i.e., simply, cheaply, and efficiently created databases or sensor networks (internet of things, IoT), which collects information from various sources to test and create sophisticated simulations on urban processes and also behavioral aspects of their citizens.
In fact, smart city is a giant market. Based on analysis by Grand View Research Inc. (2019), the overall market value for smart cities will surpass USD 2376 billion by 2025 [20]. The underlying asset of these investments is business models based on technologies, algorithms, and data that are often in the hands of large ICT (information and communications technology) companies, creating dependencies of municipalities, administrations, politics, and society. The smart city as a product for the rationalization and technologization of the city becomes a neoliberal product. This dependency applies in particular to small and medium-sized cities, where administrative bodies often have limited resources in personnel and budget. Nevertheless, challenges in achieving the smart, sustainable city, similar to those in big cities, must be met. This is under the pressure of the digital transformation era with ever-growing complexity and higher demands for data management as well as an increasing need for transparency of processes and the corresponding demand from citizens to participate in shaping them.
Where big cities often have administrative employees with expertise and financial resources to acquire, analyze, and manage big data internally, small and medium-sized cities often outsource these tasks to ICT companies due to limited resources. ICT companies lure with the seemingly all-encompassing data solutions to urban challenges. The fact that models, software, and data are in the hands of the companies, and that cities not only outsource responsibilities but also lose sovereignty to commercial interests, is often not realized until late in the game when the business models of these solutions show their impact on a societal scale. Dependencies have emerged that have to be met financially; they repurchase their “own” data and access to software in expensive “subscription models” or offer other incentives to the ICT companies. This, in the long term, does not only mean a financial burden to small and medium-sized towns, but also increases social inequality due to a data monopoly, discourages civic participation, and weakens public administration by limiting their possibilities to proactively transform the city.
Thus, we advocate that, for a city to be “smart”, technical innovations and concepts must be people-centered and improve the quality of life of all its inhabitants rather than achieving process or economic efficiency. To achieve this, we need a better understanding of the complex problems occurring in today’s urban systems, as well as the heterogeneous needs and requirements of its inhabitants and the impact of new solutions and concepts not only on the economic scale but also on the social and environmental scales. Conventional planning tools and methods fail to deal with the complexity of urban systems, as well as with the understanding of citizen needs and requirements.
The prototype of a digital twin for urban planning, set up in Herrenberg, has the potential to tackle urban complexity by visualizing complex processes and dependencies in urban systems, simulating possible outcomes, and impacts and taking into account the heterogeneous needs and requirements of its citizens by enabling participatory and collaborative planning. This is based on open access data and open source software, giving back sovereignty of the data and access to information to the citizens. All of these are crucial factors for building democratic cities.
3. Methods and Data
Our research method is empirical and computational, using a mixed method approach. In this research, we developed a prototype of an urban digital twin and visualized it in virtual reality for supporting participative and collaborative planning and design processes. The urban digital twin is set up as follows: (1) A 3D model of the built environment, (2) a mathematical street network model using the theory and method of space syntax, (3) an urban mobility simulation with SUMO, (4) an air-flow simulation with OpenFOAM, (5) a pollution simulation using empirical quantitative data from a sensor network, (6) empirical quantitative data, namely, pedestrian and cyclist routes, (7) empirical qualitative social data indicating how urban places are perceived, and (8) photographic documentation of these places. The urban digital twin was embedded in the collaborative visualization and simulation environment COVISE, an extendable distributed software environment to integrate simulations, post-processing and visualization functionalities in a seamless manner. COVISE is designed for collaborative working, allowing users’ distant collaboration during the analysis and visualization of empirical and real-time data, e.g., of the urban digital twin but also other scientific data from simulations or models such as BIM (building information modeling). COVISE supports virtual environments such as CAVEs and head-mounted displays (HMDs), but also 2D representations. Users can then analyze their data sets intuitively in a fully immersive environment through state-of-the-art visualization techniques. In greater depth, the urban digital twin prototype was modeled as follows.
(1) 3D city model
The urban digital twin builds on a solid 3D city model based on geographic data and information such as a digital elevation model (DEM) or a digital building model provided by regional authorities (Landesamt für Geoinformation und Landentwicklung Baden-Württemberg). The digital building model was supplemented with detailed 3D laser scan data. The overall Herrenberg model is a hybrid model combining less and more detailed neighborhoods, including selected architectural projects. The decision for the level of detail was based on the selected area under scrutiny, where information about a highly accurate expected environmental impact on the neighborhood was necessary.
The 3D scan was created with the help of a Faro laser scanner (Laser Scanner Focus 3D S 120). These scanners enable fast, simple, and accurate measurement of complex geometries of objects and buildings. A built-in camera provides high-contrast image information in natural colors for scan data, recorded in lighting conditions with extreme differences in brightness. Through the mobility of the scanner, which has to be positioned on a tripod and is battery powered, it is possible to capture large areas within a short time. In the case of Herrenberg, this was achieved within an early summer day in May 2017. The images cover the major part of the medieval town center, which is famous for its half-timbered houses typical for the region. The city center is an important urban development area for the municipality, with a focus on its preservation, restoration, and revitalization.
Building information models (BIM) is another level for the integration of building data. In this case, the possibilities go far beyond pure building geometry: If available, data from HVAC technology (heating, ventilation, air conditioning) and data from electricity, water, and sewage networks can be coupled with the urban digital twin. For the Herrenberg urban digital twin, among other applications, the data of a new large-scale commercial and office building to be constructed, the “Seeländer Areal”, were integrated in order to enable the involvement of stakeholders in decision-making processes through visualization even before the construction phase began. Specifically, design variants and scenarios could be visualized, and the geometry and volume of the building complex in relation to the existing (historical) cityscape could be presented. Here, as is often the case, data acquisition was also an issue: due to the complex nature of responsibilities, it was difficult to obtain comprehensive BIM data. The basic 3D city model was a collaborative effort between colleagues from the High-Performance Computing Center Stuttgart and Fraunhofer IAO. The 3D city model contains data across scales.
(2) Mathematical street network model with space syntax
The application of the theory and method of space syntax, which utilizes a graph theoretical approach, allowed us to analyze the through movement potentials for cars and pedestrians using the measure of normalized angular choice (NACH). NACH refers to the movement passing of the shortest angular routes from all points to all points in the road network [21,22]. This allows us to understand how “central” a street segment is relative to all others in the urban system. This centrality, represented as accessibility, allows us to indicate high to low potentials of usage or, rather, traffic.
For the street network model, a hybrid model approach was chosen that combines geo-referenced road-center lines with axial lines for areas where greater detail was needed. An axial line is a sightline representing movement paths [22]. The reason for applying the space syntax method was to increase an understanding of the street network configuration, which refers to the underlying logic of the urban system’s public accessible places. This is in contrast with the visualization of traffic census data, which depicts the real-life usage of the street network, but not its spatial configuration. Understanding spatial configuration not only allows us to develop scenarios but also to test them against the whole system. The street network graph was computed using the open-source multi-platform software depthmapX (https://varoudis.github.io/depthmapX/).
In order to implement the space syntax model into the urban digital twin, the street network was converted from two-dimensional to three-dimensional data for the visualization in virtual reality. To achieve the three-dimensional visualization of space syntax analysis, we developed new modules for COVISE and OpenCOVER software. These allowed for automated processing of two-dimensional geo-referenced space syntax data to represent them three-dimensionally in virtual realities. The space syntax results for each street segment were coupled with emission data, collected with the help of a sensor network. The emission data themselves were coupled with airflow simulation data to simulate the distribution of particulate matter in the urban system, respectively, urban geometry and topography. This allowed the estimation of emission generation even in certain areas of the city not covered by sensors. Furthermore, it was also possible to test scenarios in order to verify the effects of spatial (geometric/topographic) or traffic-dependent (street network) interventions with regard to the impact of traffic and emissions.
In addition to the status quo of the road network in 2018, nine different traffic-planning scenarios for the reduction of congestion and pollution in the city’s core were tested with regard to their applicability and quality.
(3) Urban mobility simulation with SUMO
For a better understanding of traffic behavior, we extended the model with a traffic simulation using the open-source software SUMO—Simulation of Urban Mobility (https://sumo.dlr.de). This simulation uses a microscopic, space continuous, and time discrete car-following and lane-changing model [23]. The results of the simulation are displayed in 3D as individual cars, trucks, and buses, and also bicycles and pedestrians moving through the virtual city model. For the urban digital twin, a new plugin was developed to simulate and visualize changes in modal-split and the amount of travel in real-time. This allows testing and illustrating different scenarios and visions addressing traffic and exhaust reduction.
(4) Air flow simulation
For the integrated airflow simulation, official weather and climate data were integrated. This simulation and combination of data allows investigators to relate emissions to the potential volume of traffic and the distribution of emissions taking wind and factors like temperature and humidity into account. This is also transferable to other emission or climate data such as flooding or the simulation of urban heat islands. The processing of these big data sets and simulations in real-time requires high-performance computing (HPC). Both the wind flow and pollution simulations were carried out with OpenFOAM, an open-source computational fluid dynamics (CFD) application (www.openfoam.org). Boundary conditions to these simulations were so far often based on historic empirical data. Including historical data allows for a more accurate prediction of future scenarios.
(5) Sensor network data
With a sensor network, the empirical, real-life data collection included data about particulate matter, temperature, and humidity. The sensors were pre-built by the research team and handed over to committed citizens as part of a “citizen science” project (Figure 1). During the installation and assembly, colleagues from the High-Performance Computing Center Stuttgart supported citizens when necessary. In order to enable the area-wide and fine-grained recording of measurement data, citizens of respective households were specifically selected. It was also important to record measurement data from sensors along streets with varying levels of traffic or in more and less frequented areas. The sensors were installed outdoors, e.g., on balconies or other suitable locations. The location and the exact position (e.g., street or courtyard side) and the height at which the sensors were installed were documented. Special attention was also paid to data protection. The exact location is not visible in the visualizations. In addition, all personal data of the operators were anonymized. The data was transmitted via the operators’ personal wireless networks. The existing platform, “LuftdatenInfo” (https://luftdaten.info/), was used. Alternatively, data transmission via long range wide area networks (LoRaWAN) would be possible by a minor redesign of the sensor. The measurement data can be read in COVISE in almost real-time via an interface and combined with other data, and finally visualized via OpenCOVER. Data such as particulate matter (PM 2.5 and 10), temperature, and humidity from the sensor network were correlated with results from the space syntax analysis for adjacent street segments and combined with wind flow and pollution simulation to learn more about the distribution of particulate matter in spatial street geometries and urban topography.
(6) People’s movement routes, social data, and photographic impression
In order to collect these empirical data using volunteered geographic information (VGI), the mobile application “Reallabor Tracker” (Real Lab Tracker) (Figure 1) was developed. The application, which is based on the OSM Tracker, allowed users to trace their daily routes, rate the quality of the public realm, register their stationary activities and to record imagery and sound samples, and to make comments in the form of notes. The application allowed us to trace the daily routes, the speed—in order to be able to analyze the modal split or also stationary activity in public space—and time of the movements, for example, in certain time windows or over certain periods of time. In addition, the participants were able to evaluate public spaces on-site and by georeferencing, to locate urban barriers and to take photos and audio recordings of traffic noise and other sounds, and further to add comments as text notes. The collected data was gathered under consideration of data protection and after the participants had been informed accordingly and subsequently anonymized.
The urban digital twin was integrated into COVISE (collaborative visualization and simulation environment). COVISE is an open-source modular visualization system designed to support collaborative visualization of data in virtual environments as well as on the desktop. The software is easily accessible on GitHub (https://github.com/hlrs-vis/covise).
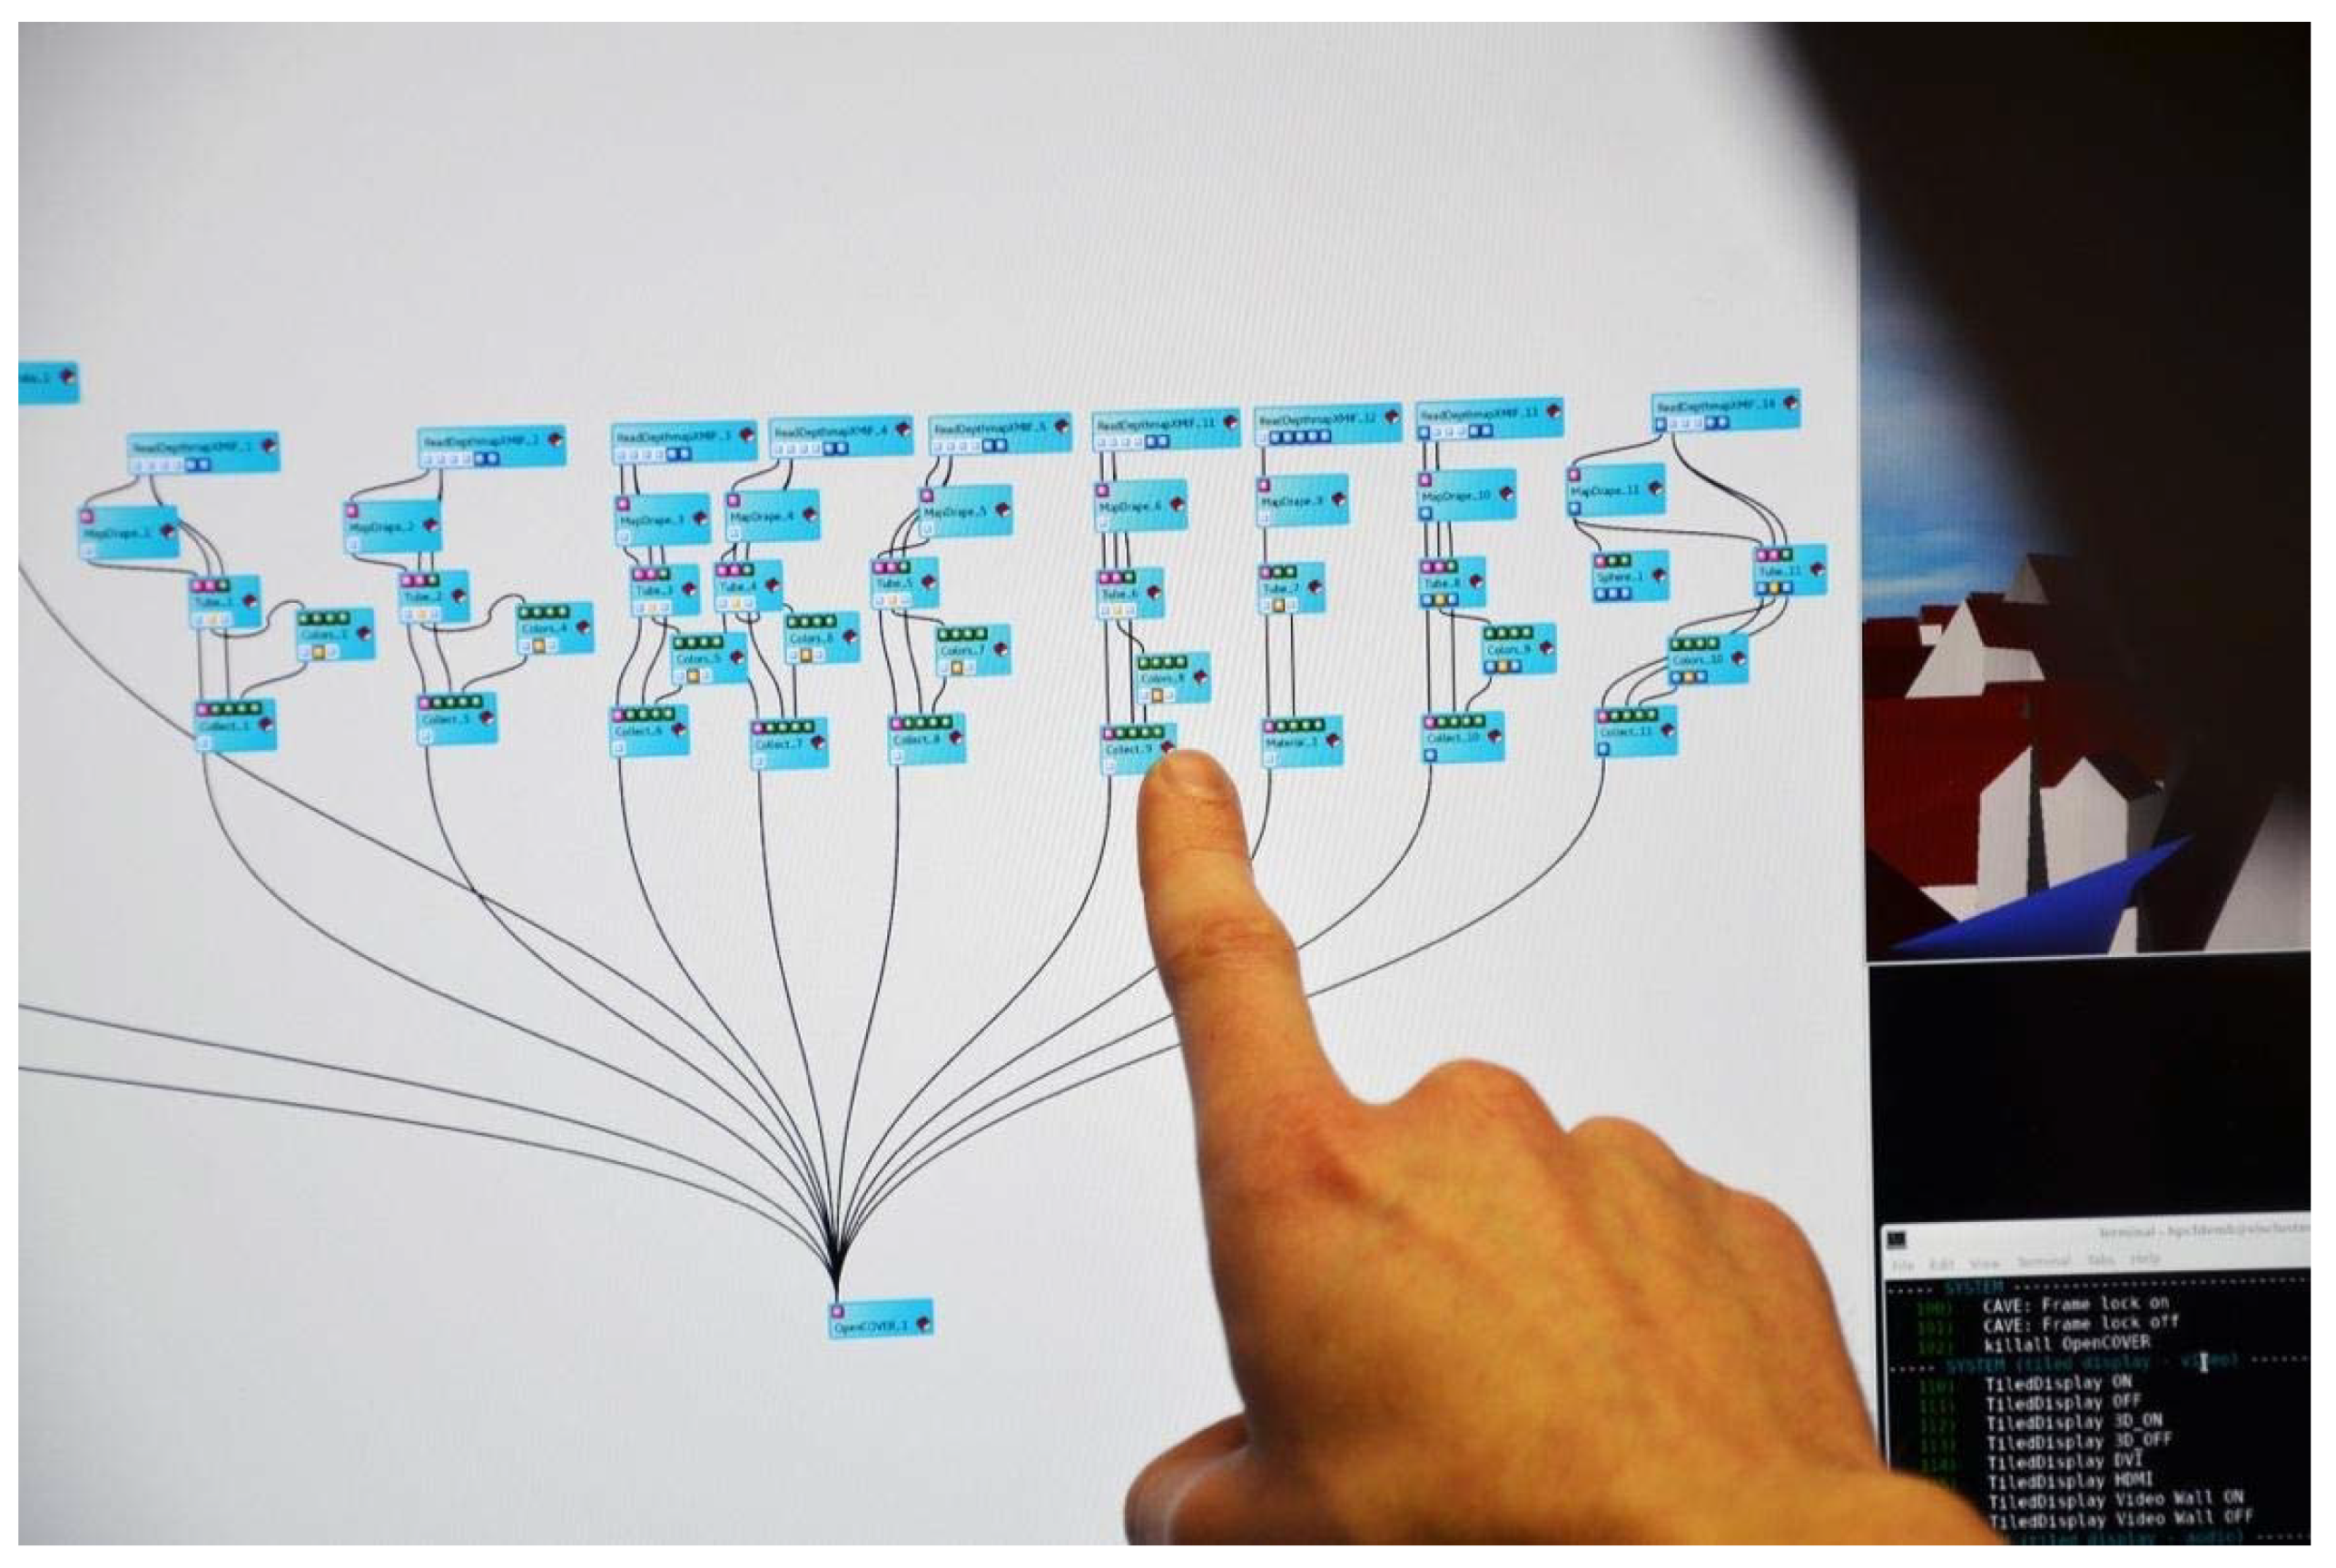
The architecture of COVISE allows developers to extend the existing functionality by integrating new code as modules. In a visual application builder, these modules are connected to form a dataflow network (Figure 2). COVISE also integrates the render module OpenCOVER, which allows us to render for virtual, augmented reality environments. Modules within COVISE support reading results from simulation codes such as OpenFOAM to extract geometry and generate isosurfaces, streamlines, and other visualization features. We have introduced new modules to COVISE to provide live access to sensor databases, read depthmapX (space syntax), and general georeferenced data to transform these 2D data into 3D data, including elevation maps. In the next step, all data and the 3D city model are rendered in OpenCOVER. The application OpenCOVER is based on OpenScene Graph. OpenScene Graph is an open-source 3D graphics library for visual simulations, computer games, virtual reality, and scientific visualization and modeling (http://www.openscenegraph.org). OpenCOVER supports any type of projection-based virtual reality environment, such as CAVEs, power walks, domes, or tiled displays, and also head-mounted displays. For the urban digital twin prototype, a number of plugins have been developed in C++ to extend the functionality of OpenCOVER.
Large-scale terrains are rendered through Virtual Planet Builder (VPB) or osgEarth. VPB had to be extended to align the uneven terrain to high-resolution streets represented in the OpenDRIVE format in order to prevent visual artefacts. Point clouds from terrestrial LIDAR scans (light detection and ranging) have been sorted into an octree data structure for efficient rendering. 3D city models can be loaded in various data formats: CityGML and DXF in case of the pilot-application Herrenberg.
OpenCOVER not only provides 3D navigation in the virtual model but also allows for interaction with the COVISE visualization modules, thus cutting surfaces and streamlines can be interactively placed anywhere within the city to analyze the airflow. The results of color maps or the size of tubes representing space syntax data, for example, can be interactively adjusted to one’s liking or needs.
4. Results and Discussion
4.1. Case Study: The Town of Herrenberg, Germany
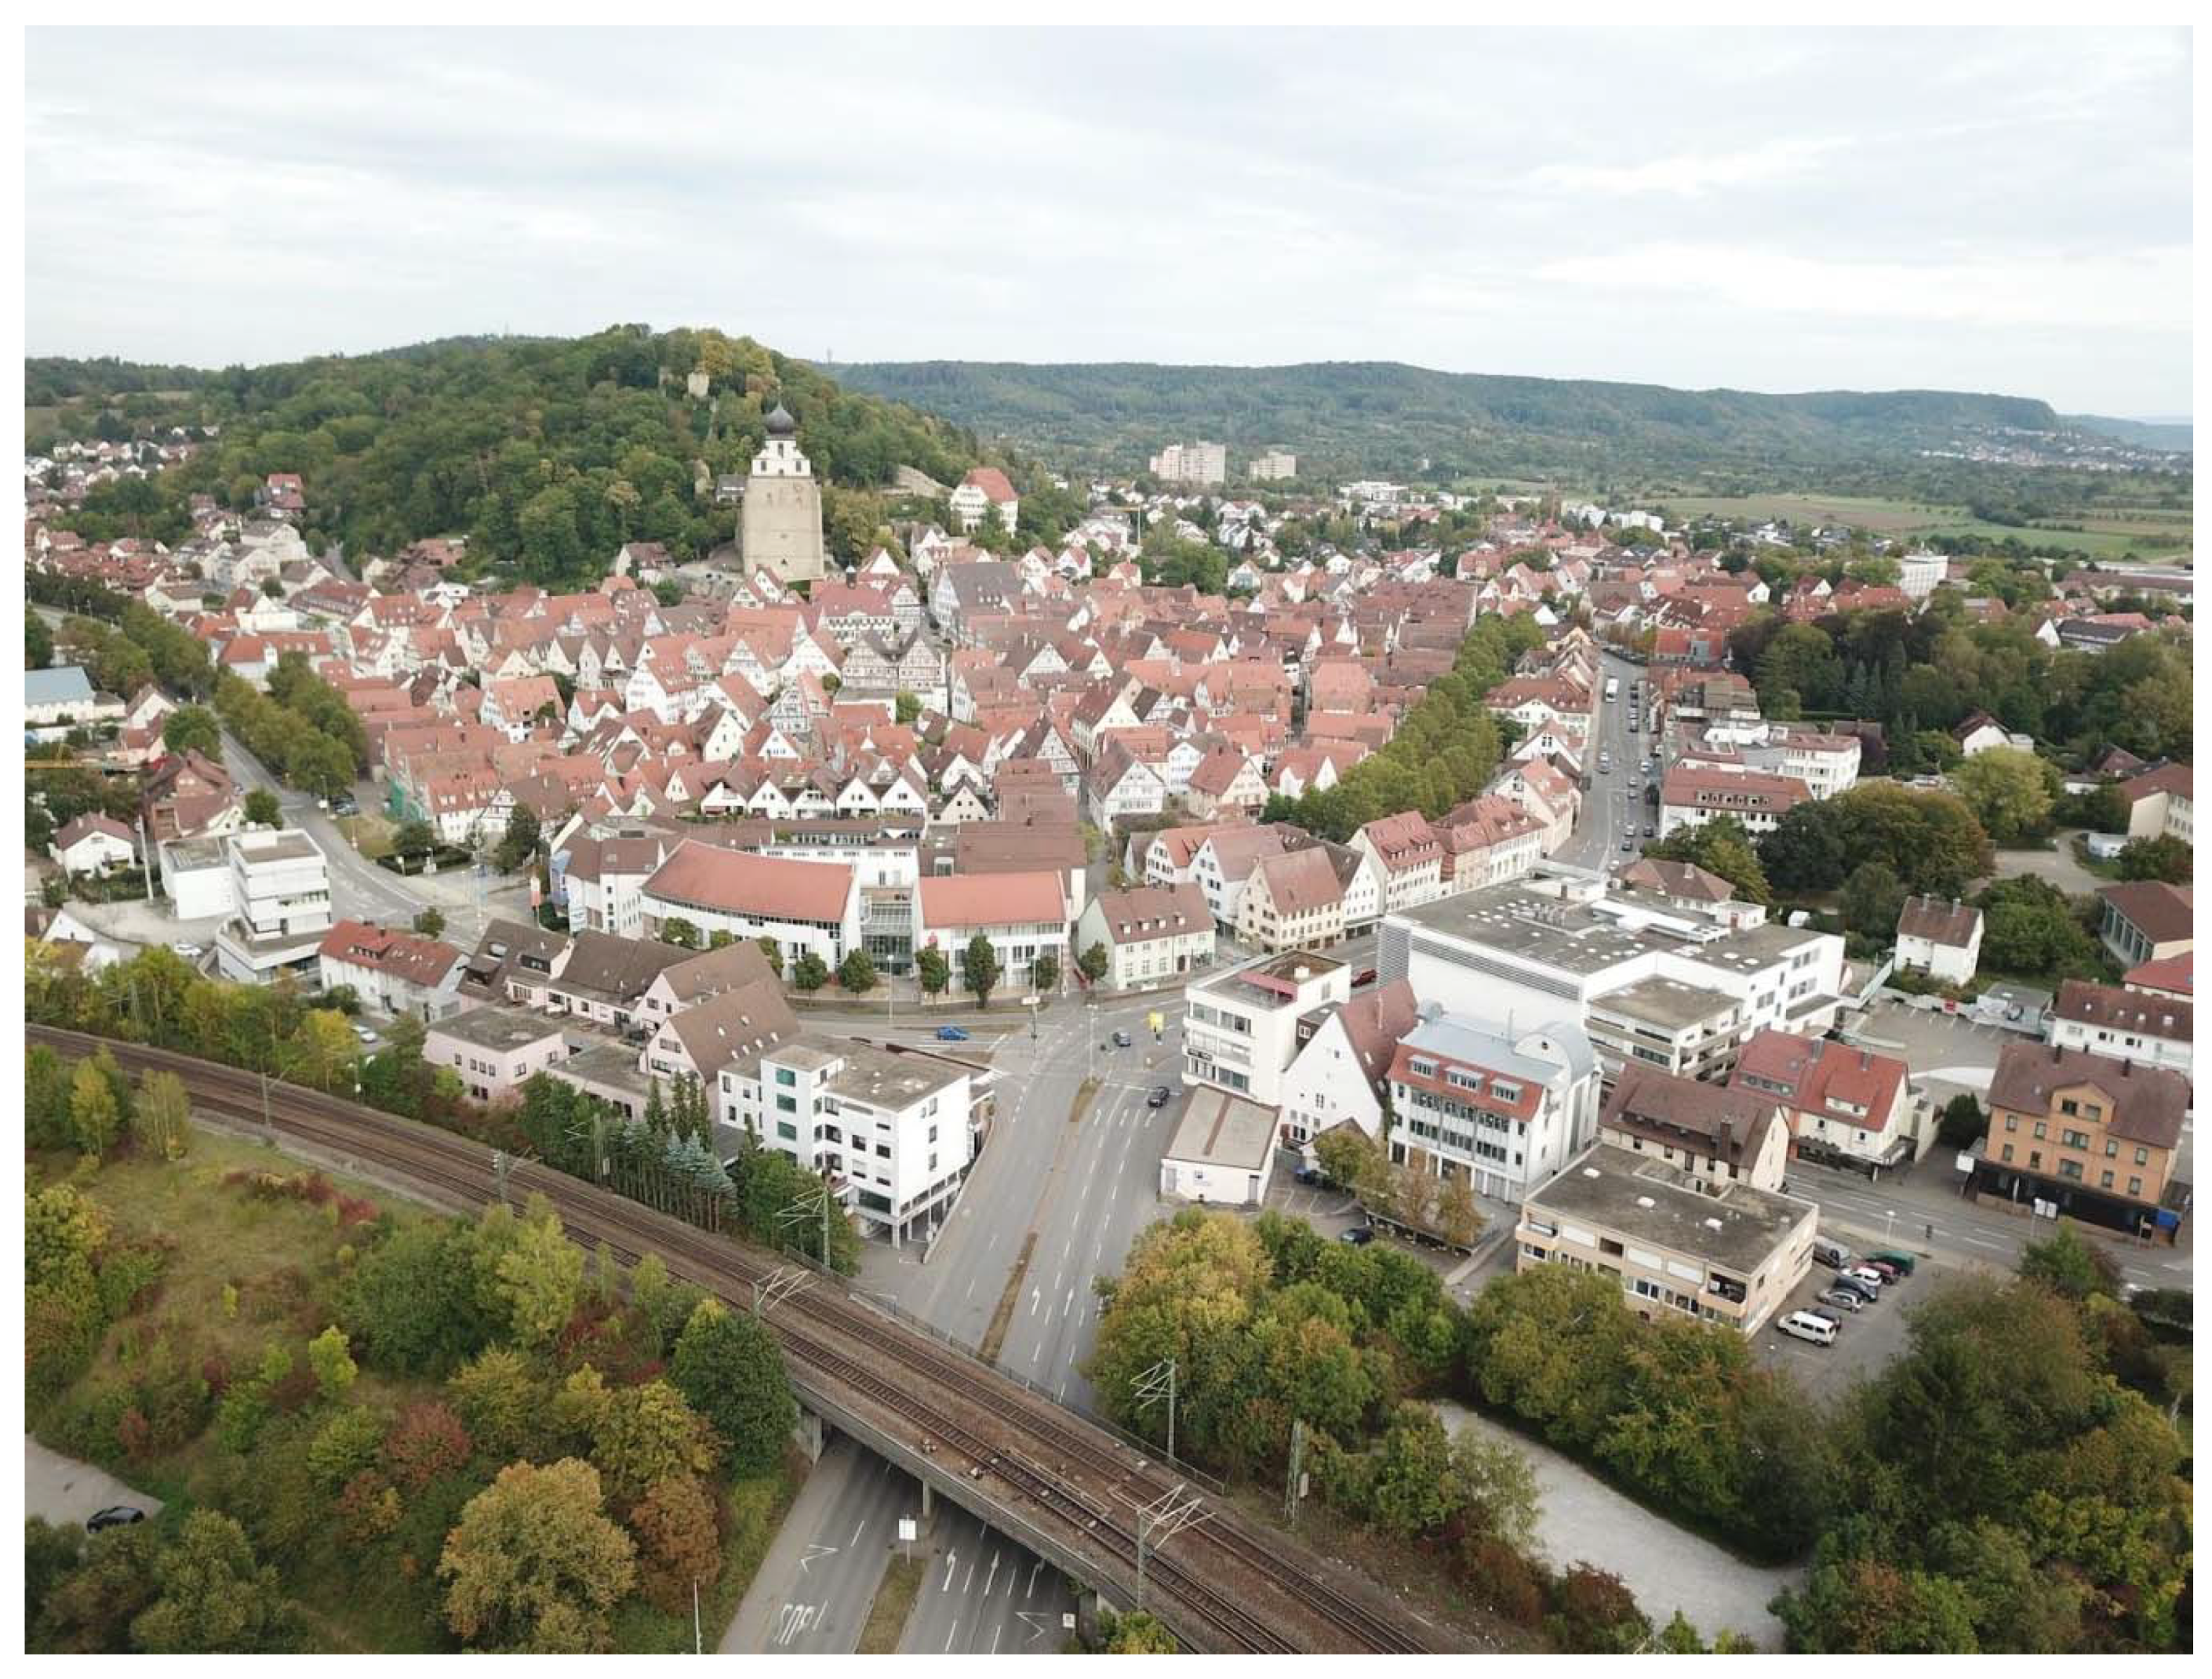
The town of Herrenberg, with 30,000 inhabitants, is located in Baden-Württemberg in the southwest of Germany (Figure 3). The town experienced rapid urban growth, especially during the industrialization and after the Second World War. Herrenberg is part of the Stuttgart metropolitan region, with around 5.2 million inhabitants. This region is characterized by a fragmented suburban location with a diffuse belt between urban settlements and rural landscapes with low population density. This results in a high dependency on the infrastructure and increasing individualized automobile traffic. In general, the Stuttgart hinterland can be characterized by a high traffic volume, mainly due to the high dependency on commuting, fragmented communities, and a lack of spatial governance [24]. Herrenberg itself consists of a homogeneous historic core and a fragmented city periphery. Its historical core, however, is strongly affected by car traffic due to earlier planning decisions and implementation. Therefore, the city is strongly affected by environmental pollution through emissions and noise. This is especially true for a main road that circles the historic core and collects and distributes traffic on three federal roads. To solve this urban challenge, the integrated mobility plan IMEP 2030 was developed for the city of Herrenberg, which is supported by civic engagement. It is intended as a guideline for mobility development over the next decade. The urban scenarios of IMEP 2030 were used as test applications for our urban digital twin to test a novel approach to improve the collaborative planning process.
4.2. Participatory and Collaborative Planning with Urban Digital Twins
Digital tools can support citizen participation, but must be embedded in “serious dialogues” that are valued by policymakers [25]. In this context, for example, visualizations of digital twins in virtual and augmented realities can significantly support communication and decision-making between politicians and responsible administrative staff, experts from practice and different disciplines, and citizens. This is made possible by the reduction of complexity and the spatial and visual representation acting as a “translational aid”. Results, for example, from simulations, can also be presented in a way that is easier to understand than with conventional methods or in specialist language [25]. This makes participation more attractive and can include groups of people that are otherwise not easily reached by such formats, such as children, teenagers, residents with a migration background, language barriers, or with a low level of education.
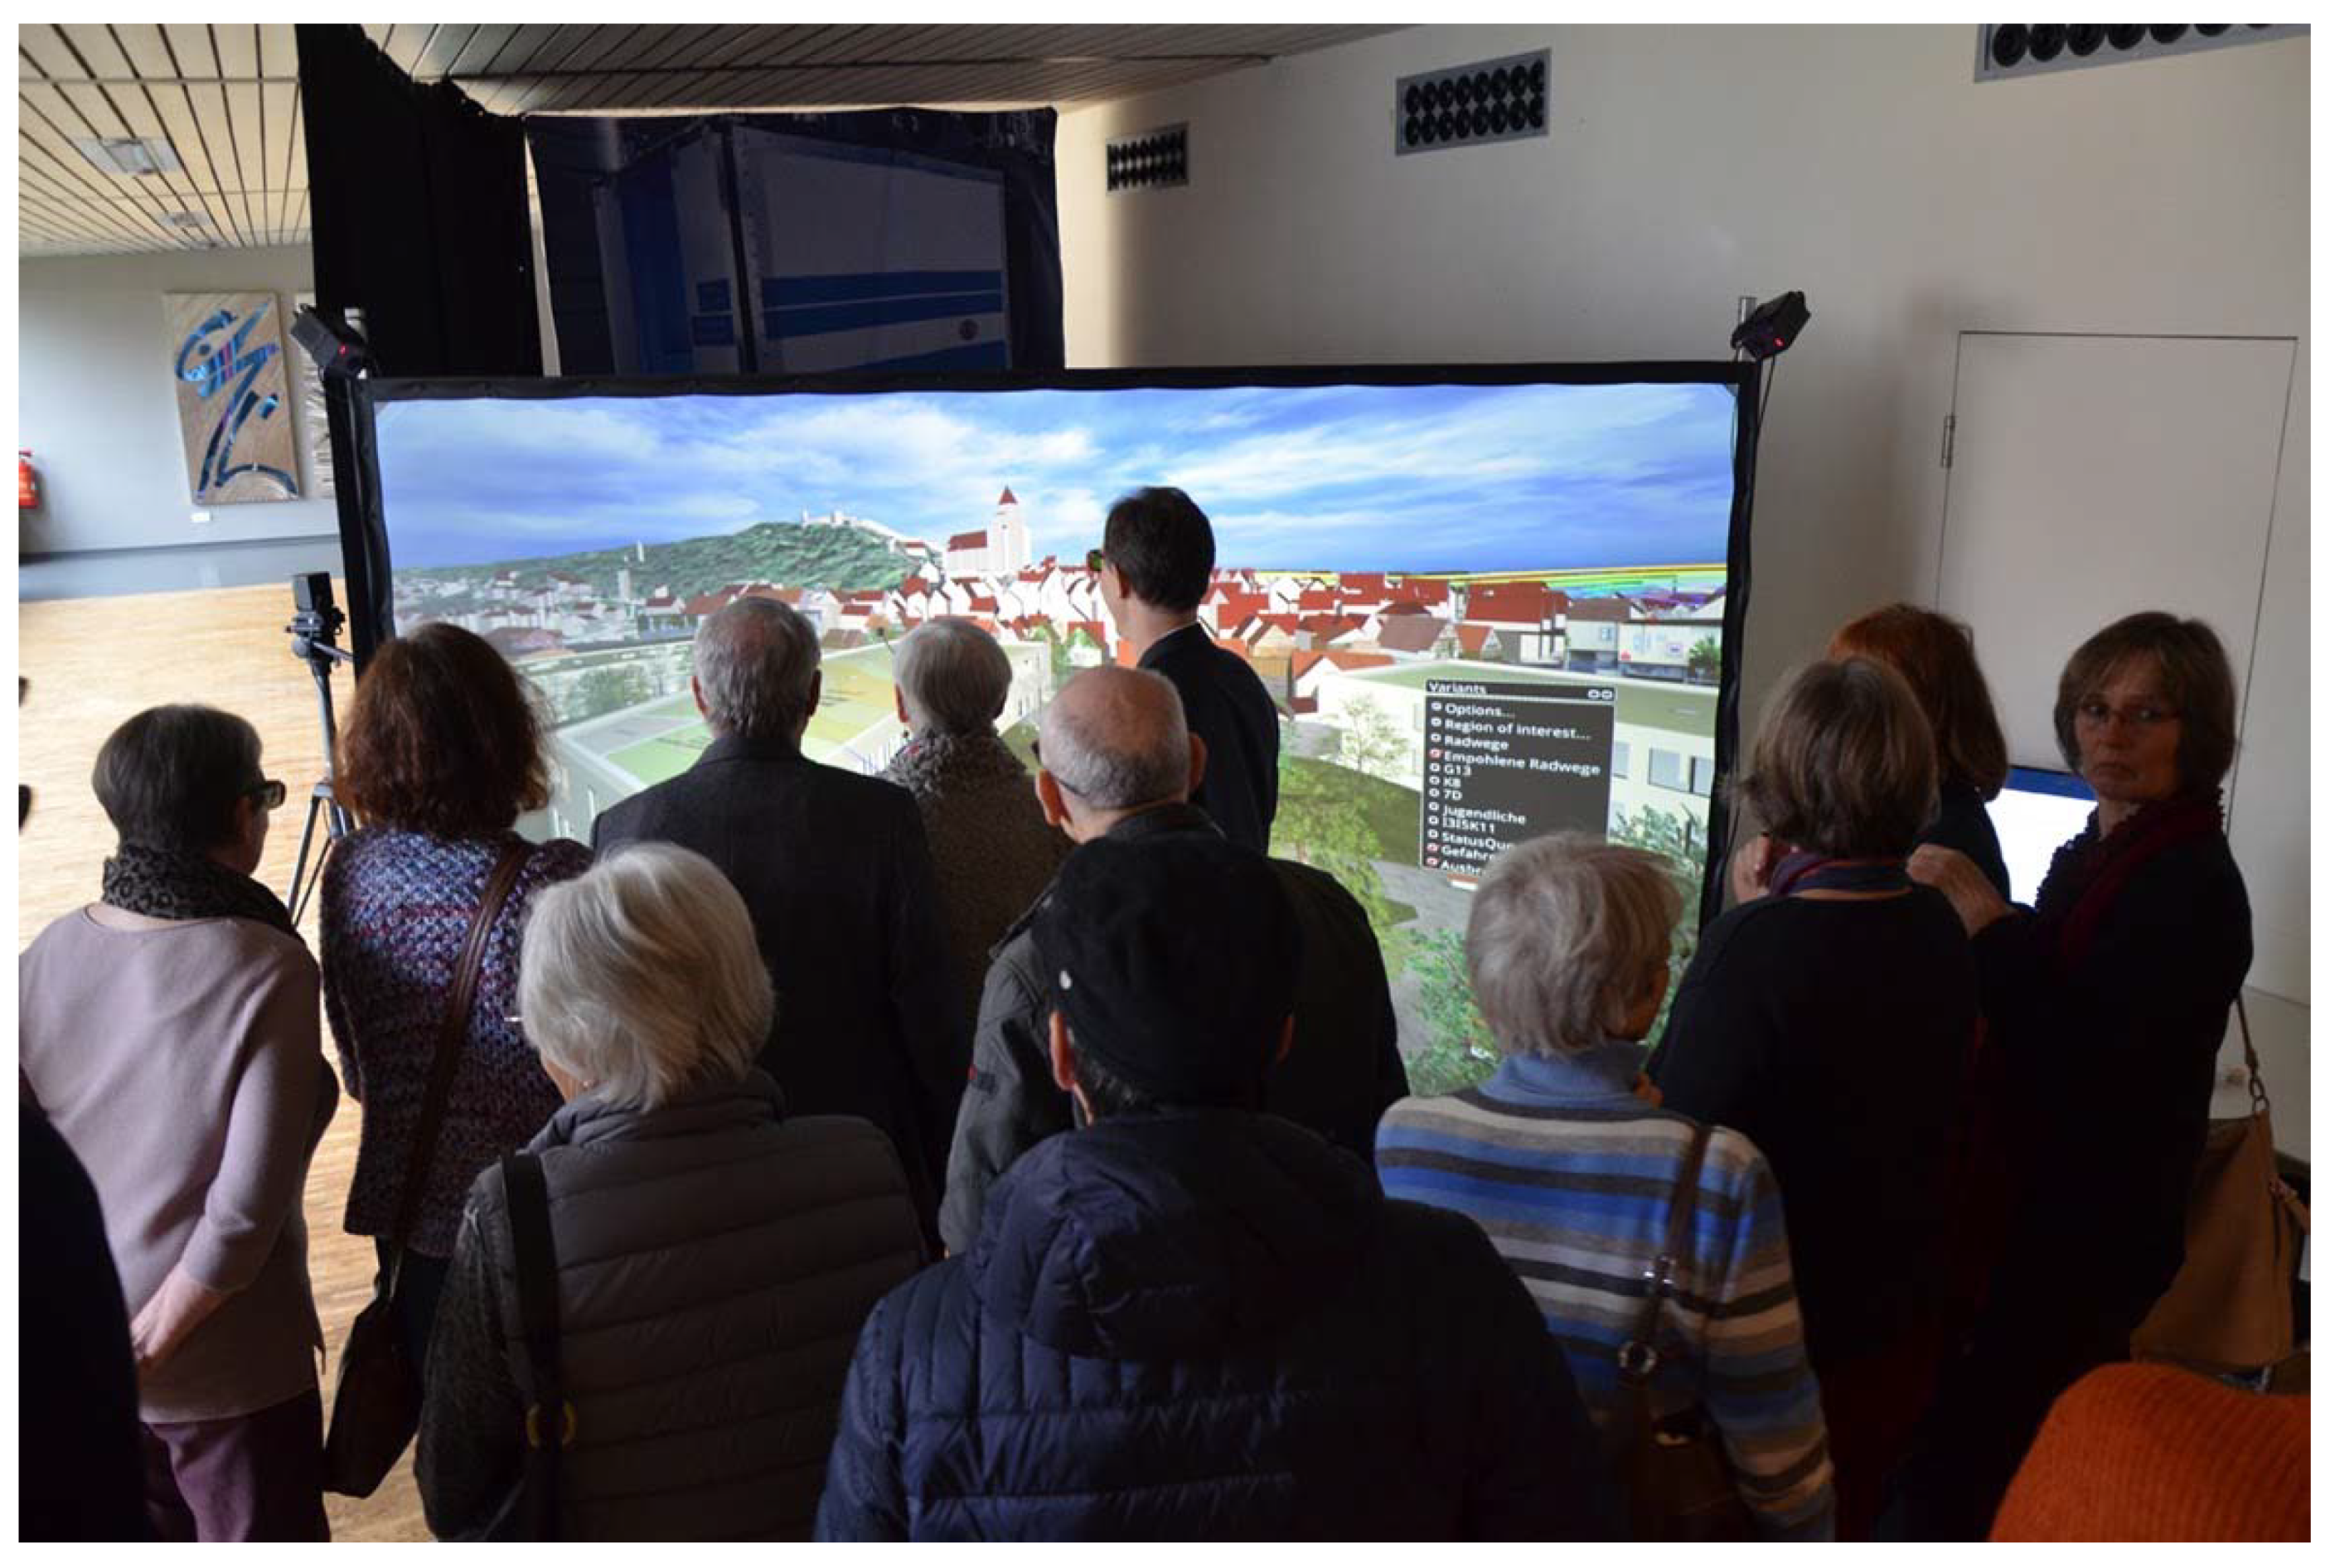
Using collaborative formats like stationary CAVEs or mobile facilities like VR back projection allows the engagement of up to 15 participants at the same time. This supports the involvement of a significant number of people in multiple sessions. For even larger formats, on-site facilities such as 3D cinemas, which can be adapted for this purpose with relatively little effort, could also be suitable. In Herrenberg’s specific case, stakeholders from the administration, politics, and representatives of certain groups (such as young people) participated at the HLRS in the CAVE set up there (Figure 4, Figure 5 and Figure 6). On the other hand, hundreds of people were involved in participatory processes by using mobile VR directly on-site during major events (Figure 7).
Changes and the representation of, e.g., variants, future designs, or visions were only possible in this form in virtual reality. It is also a matter of preventing high risks and the associated costs for the “real world” through collaborative planning and participation, or minimizing the risk, e.g., by being able to estimate the effects of large investments in advance or for evaluating infrastructure for future developments in relation to the existing building stock, to name just a few.
Citizen participation using the digital twin in VR proceeded well; at least that was our subjective opinion. However, we were very interested in the users’ opinions of how they would experience it from their own point of view with different professional and personal backgrounds. Is the visualization of complex data even understandable? What level of detail should we choose, and is this form of participation too complicated or even too simple? In order to obtain usable information and to evaluate and adapt the visualization or form of presentation in VR for such new forms of participatory processes, we conducted surveys of the participants.
4.3. Participant Survey
A questionnaire was developed and we gathered 39 answers from people aged between 16 and 80. The respondents had diverse professional and educational backgrounds, from students, educators, and police officers to IT experts and decision-makers. The questionnaire consisted of nine questions focusing on quantitative queries about the perception of the visualization in the form of a polarity profile as well as open questions relating to the perceived use and potentially missing information. This enabled us to collect both quantitative and qualitative data.
The empirical work and results of this chapter are originally published in Deckert, A., Dembski, F., Ulmer F., Ruddat, M., Wössner, U. (2020): Digital tools in stakeholder participation for the German Energy Transition. Can digital tools improve participation and its outcome? In: Renn, O., Ulmer, F., Deckert, A. (eds): The Role of Public Participation in Energy Transitions. April 2020, Academic Press Imprint, Copyright Elsevier INC.
We used polarity profiles to capture the perception of the digital twin model of Herrenberg. The respondents could give their judgments for six pairs of opposing attributes.
These pairs were:
- abstract—concrete
- uninteresting—interesting
- complicated—simple
- not clearly arranged—clearly arranged
- boring—entertaining
- incomprehensible—comprehensible
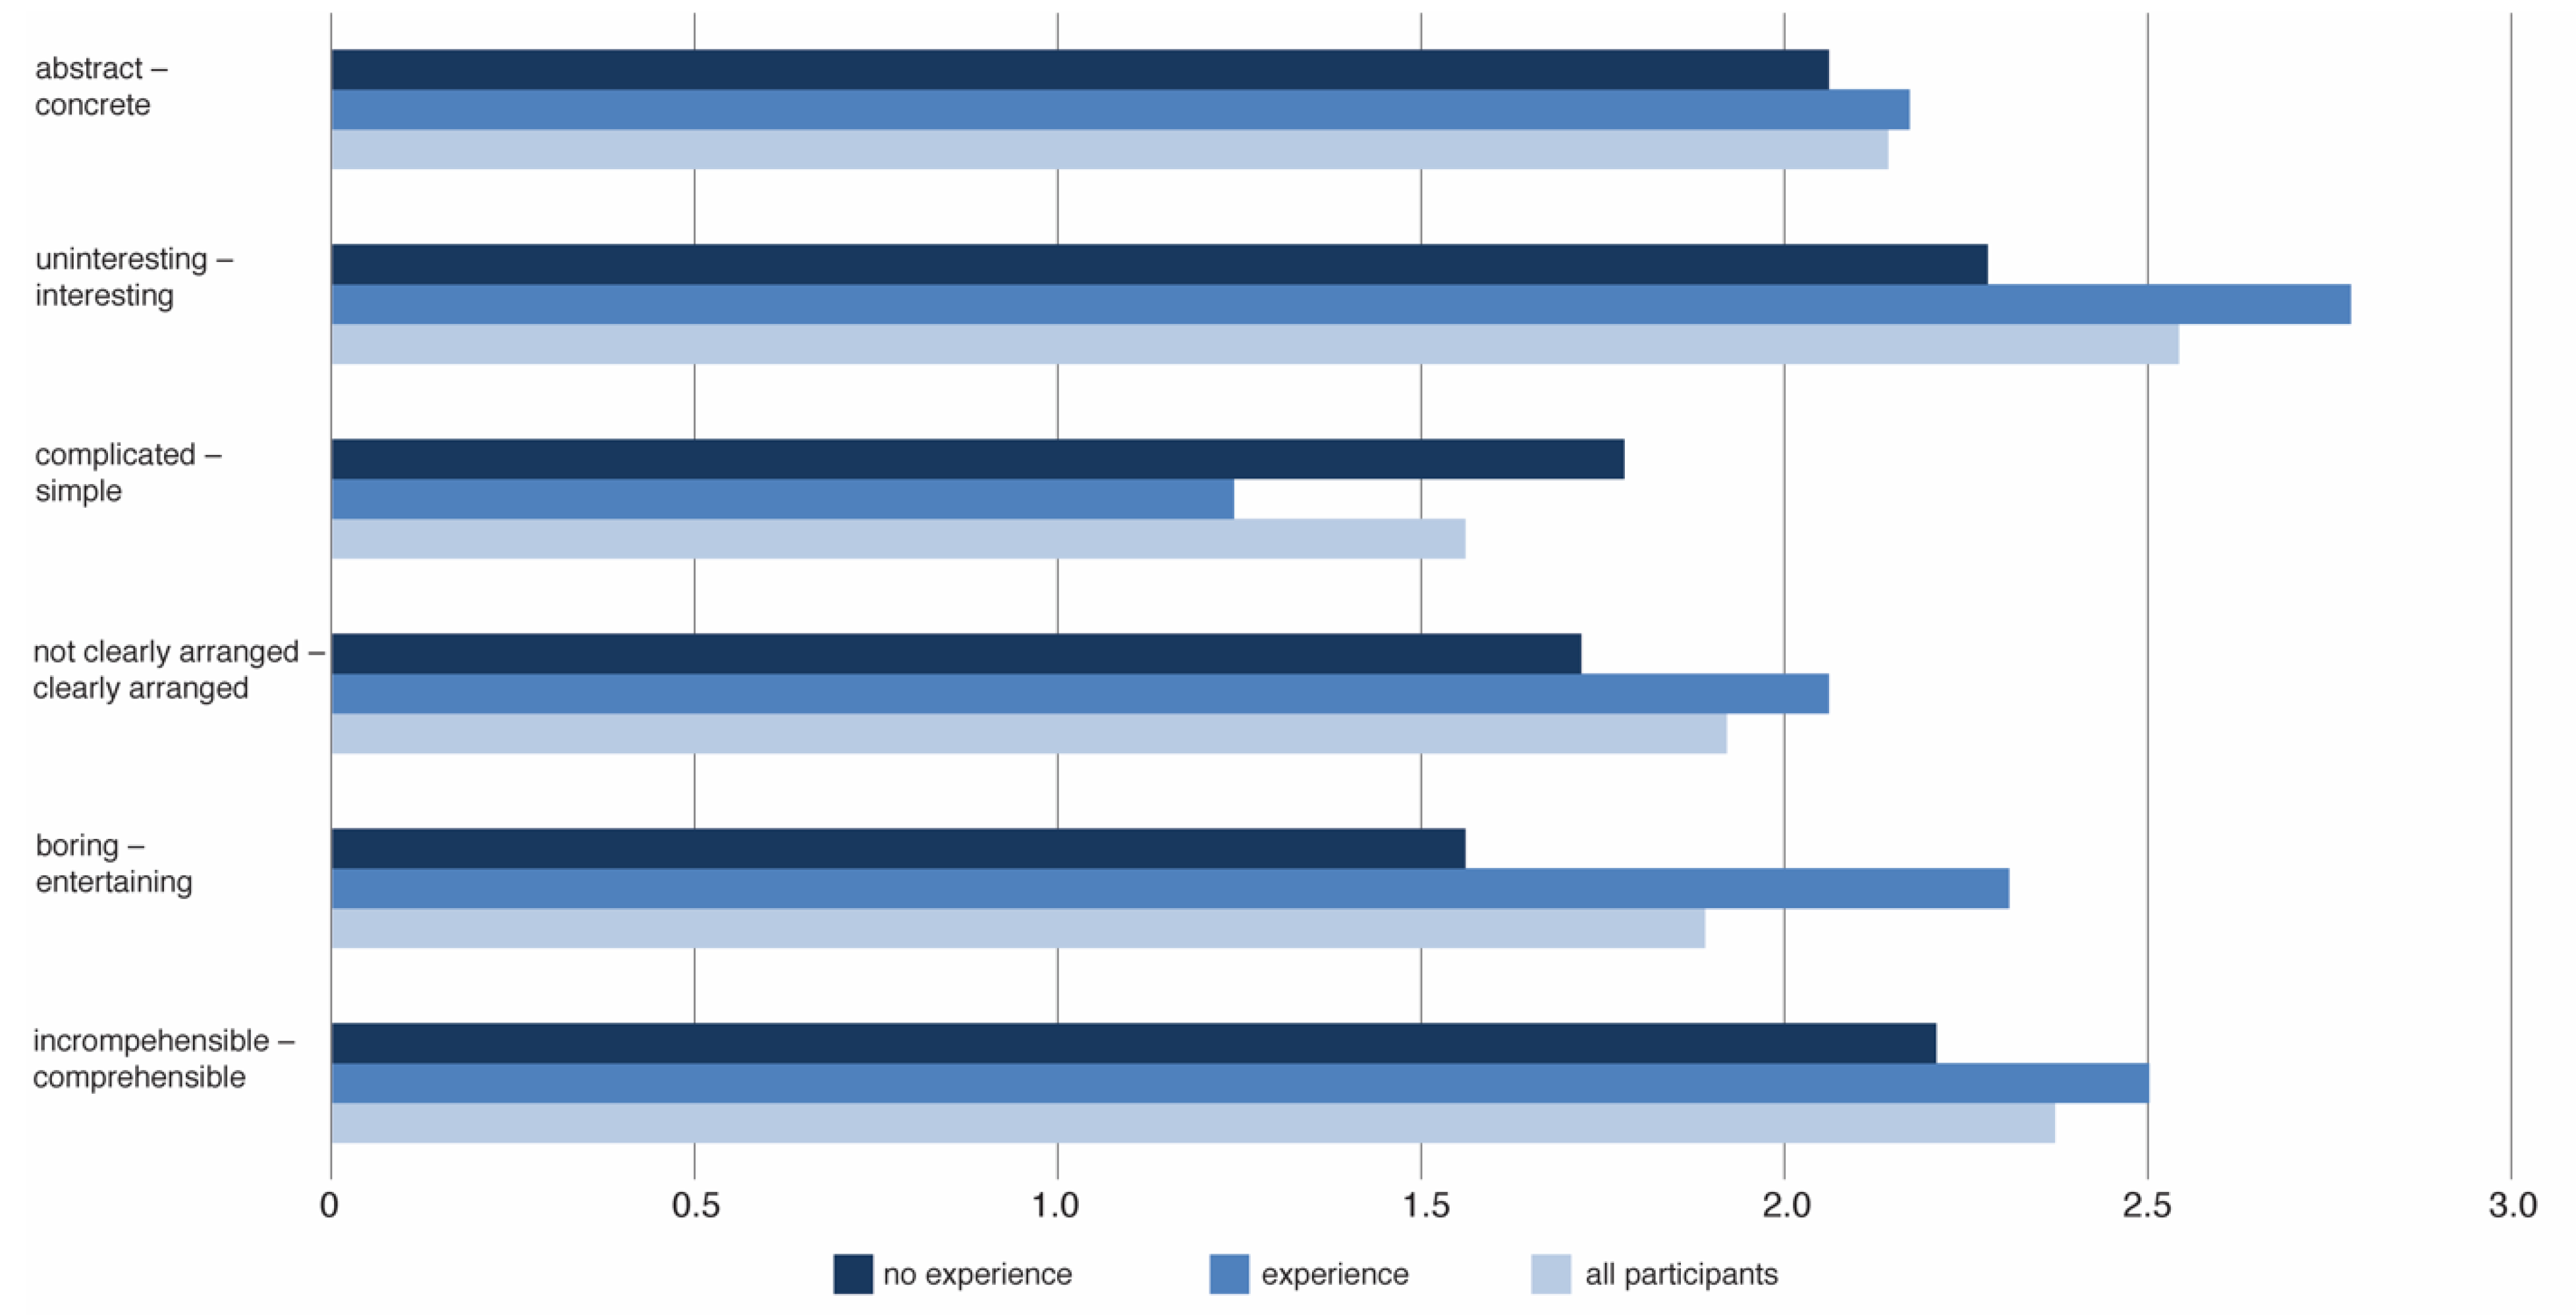
The scale ranged from −3.00 to +3.00 for each pair. The urban digital twin model of Herrenberg was all-in-all judged very positively (Figure 8). It was seen as interesting (+2.54), comprehensible (+2.37), concrete (+2.14), clearly arranged (+1.92), entertaining (+1.89), and simple (+1.56). Additionally, we asked for prior experiences with public participation processes. Almost half of the respondents had these experiences as a citizen (46%) or as an official local representative (13%). Three people stated that they had done both before. Comparing the judgments of the two groups with and without prior experiences, respectively, yields some interesting insights. People who took part in public participation processes tend to give more positive evaluations of the model than people who lack this experience. They find it to be more concrete, interesting, clearly arranged, entertaining, and comprehensible. The only exception of this pattern is the attribute pair “complicated—simple”. Here, the group with prior experience judges the model more negatively in the sense of being complicated compared to the group without prior experience.
4.4. Discussion of Results
We suspect that participatory processes are still mainly carried out using 2D city representations like plans and planning concepts in mainly technical and/or expert language. Virtual, interactive models remain uncommon in the context of urban planning processes. Hence, experienced groups can implicitly or explicitly compare these classical formats with the urban digital twin model of Herrenberg. Following this assumption, the fact that the model is judged more positively on five of the six dimensions by people with prior experience compared to people without this experience leads to the conclusion that virtual models have the potential to improve participatory processes. This could be applied, for example, by facilitating communication processes between experts and laypeople through better presentation of complex information. There is some additional evidence supporting this conclusion. We asked respondents directly whether or not they believed virtual urban models could have a positive effect on local planning and public participatory processes, respectively. Almost everyone who filled out a questionnaire stated perceived positive effects (95% and 97%, respectively). According to this data, virtual models seem to be a good tool with respect to urban planning processes.
However, this conclusion needs to be tested in more detail because of several reasons. First, it was only a small, non-representative sample. Different groups in society may have different views on this new tool (e.g., technical sceptics vs. technical optimists). Social science survey research is needed to analyze the perception and evaluation of virtual urban models in the population as a whole. Second, we have only the view of our respondents. We do not know how well the models will actually work under real-life conditions. A test in an urban planning process encompassing all stages from the very beginning to the end would possibly yield more valuable insights with respect to the assumed positive communication effects. Third, the implicit or explicit links to former participation formats in the minds of our respondents were done by the research team in our context. Further empirical research with experimental settings could confirm or reject our findings. So the results have to be treated with some caution.
In addition to these quantitative findings, we also generated some qualitative results. Questions concerned the benefits of virtual urban models in the context of urban planning and possible missing types of information (e.g., specific data) in the presented virtual urban model from the perspective of the respondents. The results are quite encouraging. The potential for the visualization of urban planning processes, consequences, places, buildings, and so on, is rated as high. Concreteness and transparency are the two main advantages of virtual models mentioned in the questionnaires. They can help to improve the interaction processes between citizens on the one hand and official local representatives on the other, especially in view of the fact that urban planning processes can be very complex and time-consuming activities.
Citations:
- “Situations/circumstances can be presented in many perspectives.”
- “Better imagination of consequences/implications.”
- “Complex planning processes can become more concrete.”
- “One can better imagine the spatial impact.”
- “Simple presentation, everyone can imagine the plans better.”
Of course, the urban digital twin cannot cover all aspects of real life or meet all expectations of participants in visualizations. There are some comments in the questionnaire concerning missing aspects and possible improvements. First, the aspect of traffic plays a central role here. The respondents wanted to know more about traffic flows, parking situations from Monday to Saturday, or the neighborhoods used only by pedestrians or cyclists. Second, accessibility should be high, which means that citizens should be able to use the model in public (for example, in the town hall) as well as in their private life (for example, using 3D-glasses at home). Third, the graphical presentation should be better in the sense of more realism, such as in Google Earth.
5. Conclusions
In this paper, we set out to present the development of an urban digital twin prototype involving different models, methods, analysis, and simulation. It summarizes our development of an urban digital twin, a novel tool in the field of urban planning. We used a variety of techniques and methods such as 3D modeling, mathematical street network modeling using graph theory, urban mobility simulation, wind flow simulation, people’s movement patterns, stationary activity data, and qualitative data about people’s perception to configure the urban digital twin. For our application, we chose the 30,000-people town of Herrenberg, Germany. The town located in the peri-urban region of Stuttgart is affected by a high traffic load and, consequently, a certain amount of air pollution. This provided the opportunity to test a series of scenarios and potential solutions as well as evaluate their impacts using a real-life case. The urban digital twin allowed us to gain a better understanding of potential solutions for urban challenges involving public decision-making to reach consensus. This opens up the potential to apply such digital twins in a similar configuration, of course, adapted to the respective situation and problems, to other small and medium-sized cities, of which there are thousands in Europe alone, facing similar challenges due to digital transformation and scarce resources.
Model validation and consolidation were carried out with a questionnaire with 39 participants, enabling us to evaluate the meaningfulness of our approach. All in all, the perception and evaluation of the urban digital twin model of Herrenberg was very positive and encouraging. It was seen as interesting, comprehensible, concrete, clearly arranged, simple, and entertaining. People who already had prior experience with public participation processes rated these attributes, apart from simplicity, very highly. There is a recognizable potential for improving urban planning processes by using digital twins in VR as a communication tool. Experts and laypeople could interact more efficiently and effectively through better presentation of the complex information in urban planning processes. However, more in-depth social science research is needed to arrive at more valid conclusions in a real-life setting. This information allows us to adjust the urban digital twin to the needs of citizens in order to provide an easy-to-comprehend model for the growing complexity of cities and towns.
With this digital twin, we also tried to demonstrate an approach to democratize urban data and to preserve data sovereignty by, for example, cities and their citizens. In contrast to Google, Cisco, IBM, and many other providers of urban data and smart city solutions, our aim is not to create a commercial product and the dependencies of cities on the providers of the data, but rather to preserve the sovereignty of smaller communities in particular. The project also tries to grant the approach of software and data availability by using open source software like COVISE, OpenCOVER, and OpenFOAM in order to enable future research and to give planners and decision-makers the possibility to use and advance these approaches.
Moreover, the aim is to visualise the complex “invisible”, such as urban data and simulations, to support the participation of citizens or the collaboration of experts. The users of the visualizations in virtual reality were enabled to experience different scales and take their own perspective (e.g., in scale 1:1 but also on any other scale). Some complex data are difficult or impossible to understand in any other form, especially for laymen or for people unfamiliar with the subject. Not only images of the real world are presented, but also different variants or plans of the future. This is especially helpful in participatory processes to facilitate communication, to involve large heterogeneous groups of citizens, and, consequently, to build consensus.
Embedding the urban digital twin in the smart city transformation debate, it is not surprising that only a few have been singularly successful. Smart city projects demand two crucial competencies: an understanding of the impact of implementing digital technologies in the context of urban systems, and integrating solutions that overcome departmental thinking. If these competencies are not taken into account, the great potential of digital technologies and solutions remains unused. The urban digital twin, as set up in Herrenberg, embraces both. It has the potential to enable decision-makers to gain an understanding of the added value and limitation of digital technologies in the context of urban systems and applies digital technologies as a solution-oriented holistic approach. Urban digital twins allow us to pave a path towards sustainable urban development at all scales.
However, by its nature as a model, the urban digital twin does not include all the information from the physical world and real life. It is an objective to achieve similarities to the real world at a level of detail accurate enough to tackle complex problems. Furthermore, Batty (2018) stated that there remains a strong need for additional social, economic, and environmental data [1]. Thus, future research includes the development of an integrative toolbox that focuses on methodological advances with regard to socio-economic data.
(For an insight into the digital twin and its representation in virtual reality, a video is available at https://www.youtube.com/watch?v=hNiRhOLDdeY).
Author Contributions
Conceptualization, F.D. and M.L.; methodology, F.D., U.W., M.L., M.R., C.Y.; software, U.W.; visualization, F.D., U.W., M.L.; writing—original draft preparation, F.D., C.Y., U.W., M.R., M.L.; writing—review and editing, F.D., U.W. All authors have read and agreed to the published version of the manuscript.
Funding
Reallabor Stadt:quartiere 4.0—Frühzeitige gestaltende Bürgerbeteiligung für eine nachhaltige Entwicklung Baden-Württembergs (“Living Lab: City Districts 4.0”). Funded by the Ministerium für Wissenschaft, Forschung und Kunst Baden-Württemberg.
Conflicts of Interest
The authors declare no conflict of interest.
References
- Batty, M. Digital twins. Environ. Plan. B Urban Anal. City Sci. 2018, 45, 817–820. [Google Scholar] [CrossRef]
- Kuhn, T. Digitaler Zwilling. Informatik Spektrum 2018, 40, 440–444. [Google Scholar] [CrossRef]
- Dembski, F.; Wössner, U.; Yamu, C. Digital Twin, Virtual Reality and Space Syntax: Civic engagement and decision support for smart, sustainable cities. In Proceedings of the 12th International Space Syntax Conference, Beijing, China, 8–13 July 2019; pp. 316:1–316:13. [Google Scholar]
- Glaeser, E.L.; Ponzetto, G.; Shleifer, A. Why Does Democracy Need Education? NBER Working Paper Series; Working Paper 12128; NBER: Cambridge, MA, USA, 2006; p. 45. [Google Scholar]
- Batty, M. The New Science of Cities; The MIT Press: Cambridge, MA, USA, 2013. [Google Scholar]
- Portugali, J.; Meyer, H.; Stolk, E.; Tan, E. (Eds.) Complexity Theories of Cities Have Come of Age: An Overview with Implications to Urban Planning and Design; Springer: Berlin/Heidelberg, Germany, 2012. [Google Scholar]
- Yamu, C. It is Simply Complex(ity). Modelling and simulation in the light of decision-making, emergent structures and a world of non-linearity. disP Plan. Rev. 2014, 199, 43–53. [Google Scholar] [CrossRef]
- De Roo, G.; Silva, E. A Planner’s Encounter with Complexity; Ashgate Publishing: Farnham, UK, 2010. [Google Scholar]
- Caldwell, W.J. Rediscovering Thomas Adams: Rural Planning and Development in Canada; UBC Press: Vancouver, BC, Canada, 2011. [Google Scholar]
- Neirotti, P.; De Marco, A.; Cagliano, A.; Mangano, G.; Scorrano, F. Current trends in Smart City initiatives: Some stylized facts. Cities 2014, 38, 25–36. [Google Scholar] [CrossRef] [Green Version]
- Shapiro, J. Smart Cities: Quality of Life, Productivity, and the Growth Effects of Human Capital. Rev. Econ. Stat. 2006, 88, 324–335. [Google Scholar] [CrossRef]
- Glaeser, E.; Gottlieb, J.D. Urban resurgence and the consumer city. Urban Stud. 2006, 43, 1275–1299. [Google Scholar] [CrossRef]
- Florida, R. Bohemia and Economic Geography. J. Econ. Geogr. 2002, 2, 55–71. [Google Scholar] [CrossRef]
- Bakici, T.; Almirall, E.; Warham, J. A Smart City Initiative: The case of Barcelona. J. Knowl. Econ. 2013, 4, 133–148. [Google Scholar] [CrossRef]
- D’Auria, A.; Trequa, M.; Vallejo-Martos, M.C. Modern Conceptions of Cities as Smart and Sustainable and Their Commonalities. Sustainability 2018, 10, 2642. [Google Scholar] [CrossRef] [Green Version]
- Nam, T.; Pardo, T.A. Conceptualizing Smart City with dimensions of technology, people and institutions. In Proceedings of the 12th Annual International Conference on Digital Government Research, College Park, MD, USA, 12–15 June 2011; pp. 282–291. [Google Scholar]
- Caragliu, A.; Del Bo, C.; Nijkamp, P. Smart Cities in Europe. In Proceedings of the 3rd Central European Conference in Regional Science, Košice, Slovakia, 7–9 October 2009; pp. 45–59. [Google Scholar]
- Harrison, C.; Donelly, I.A. A theory of smart cities. In Proceedings of the 55th Annual Meeting of the International Society for the System Sciences, Hull, UK, 17–22 July 2011; p. 15. [Google Scholar]
- Viitanen, J.; Kingston, R. Smart cities and green growth: Outsourcing democratic and environmental resilience to the global technology sector. Environ. Plan. A Econ. Space 2015, 46, 803–819. [Google Scholar] [CrossRef] [Green Version]
- Grand View Research. Smart Cities Market Analysis Report by Application, by Region, and Segment Forecasts 2019–2025. Available online: https://www.grandviewresearch.com/industry-analysis/smart-cities-market (accessed on 20 January 2020).
- Van Nes, A.; Yamu, C. Space Syntax: A method to measure urban space related to social, economic and cognitive factors. In The Virtual and the Real in Planning and Urban Design: Perspectives, Practices and Applications; Yamu, C., Poplin, A., Devisch, O., De Roo, G., Eds.; Routledge: London, UK, 2018; pp. 136–150. [Google Scholar]
- Van Nes, A.; Yamu, C. Introduction to Space Syntax in Urban Studies; Springer: Berlin/Heidelberg, Germany, 2020. [Google Scholar]
- Krajzewicz, D. Traffic Simulation with SUMO—Simulation of Urban Mobiliy. In Fundamentals of Traffic Simulation; Barceló, J., Ed.; International Series in Operations Research & Management Science; Springer: New York, NY, USA, 2010; Volume 145, pp. 269–293. [Google Scholar]
- Brenner Ingenieurgesellschaft GmbH. Verkehrsvarianten zur Entlastung der Innenstadt; Report; Stadt Herrenberg: Aalen/Stuttgart, Germany, 2014. [Google Scholar]
- Deckert, A.; Dembski, F.; Ulmer, F.; Ruddat, M.; Wössner, U. Digital tools in stakeholder participation for the Germany Energy Transition. Can digital tools improve participation and its outcome? In The Role of Public Participation in Energy Transitions; Renn, O., Ulmer, F., Deckert, A., Eds.; Academic Press Imprint: Cambridge, MA, USA, 2020. [Google Scholar]
Figure 1.
Mounting a test sensor in the street (top) to collect environmental data and the developed mobile application “Reallabor Tracker” used in the citizens’ science project to collect qualitative perceptual data and quantitative data on people’s movement paths and urban obstacles (below) (photos credited to Dembski, 2019).

Figure 2.
Visualization workflow in COVISE used for the urban digital twin (photo credited to Dembski, 2020).
Figure 2.
Visualization workflow in COVISE used for the urban digital twin (photo credited to Dembski, 2020).

Figure 3.
The town of Herrenberg in Germany on a Sunday: Aerial view of the historic city center. In the foreground, the railway embankment and the usually heavily-congested high-ranking streets (photo credited to Obst, 2019).
Figure 3.
The town of Herrenberg in Germany on a Sunday: Aerial view of the historic city center. In the foreground, the railway embankment and the usually heavily-congested high-ranking streets (photo credited to Obst, 2019).

Figure 4.
The urban digital twin for Herrenberg in a mobile VR during a participatory process in Herrenberg (photo credited to Dembski, 2019).
Figure 4.
The urban digital twin for Herrenberg in a mobile VR during a participatory process in Herrenberg (photo credited to Dembski, 2019).

Figure 5.
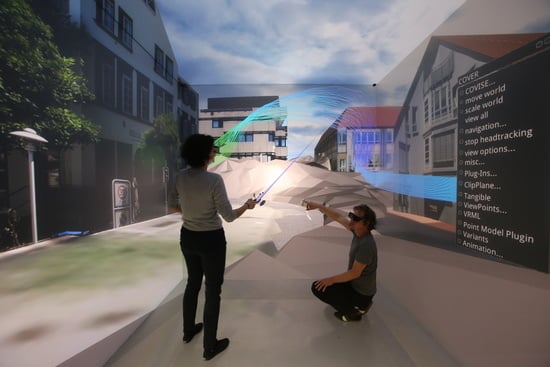
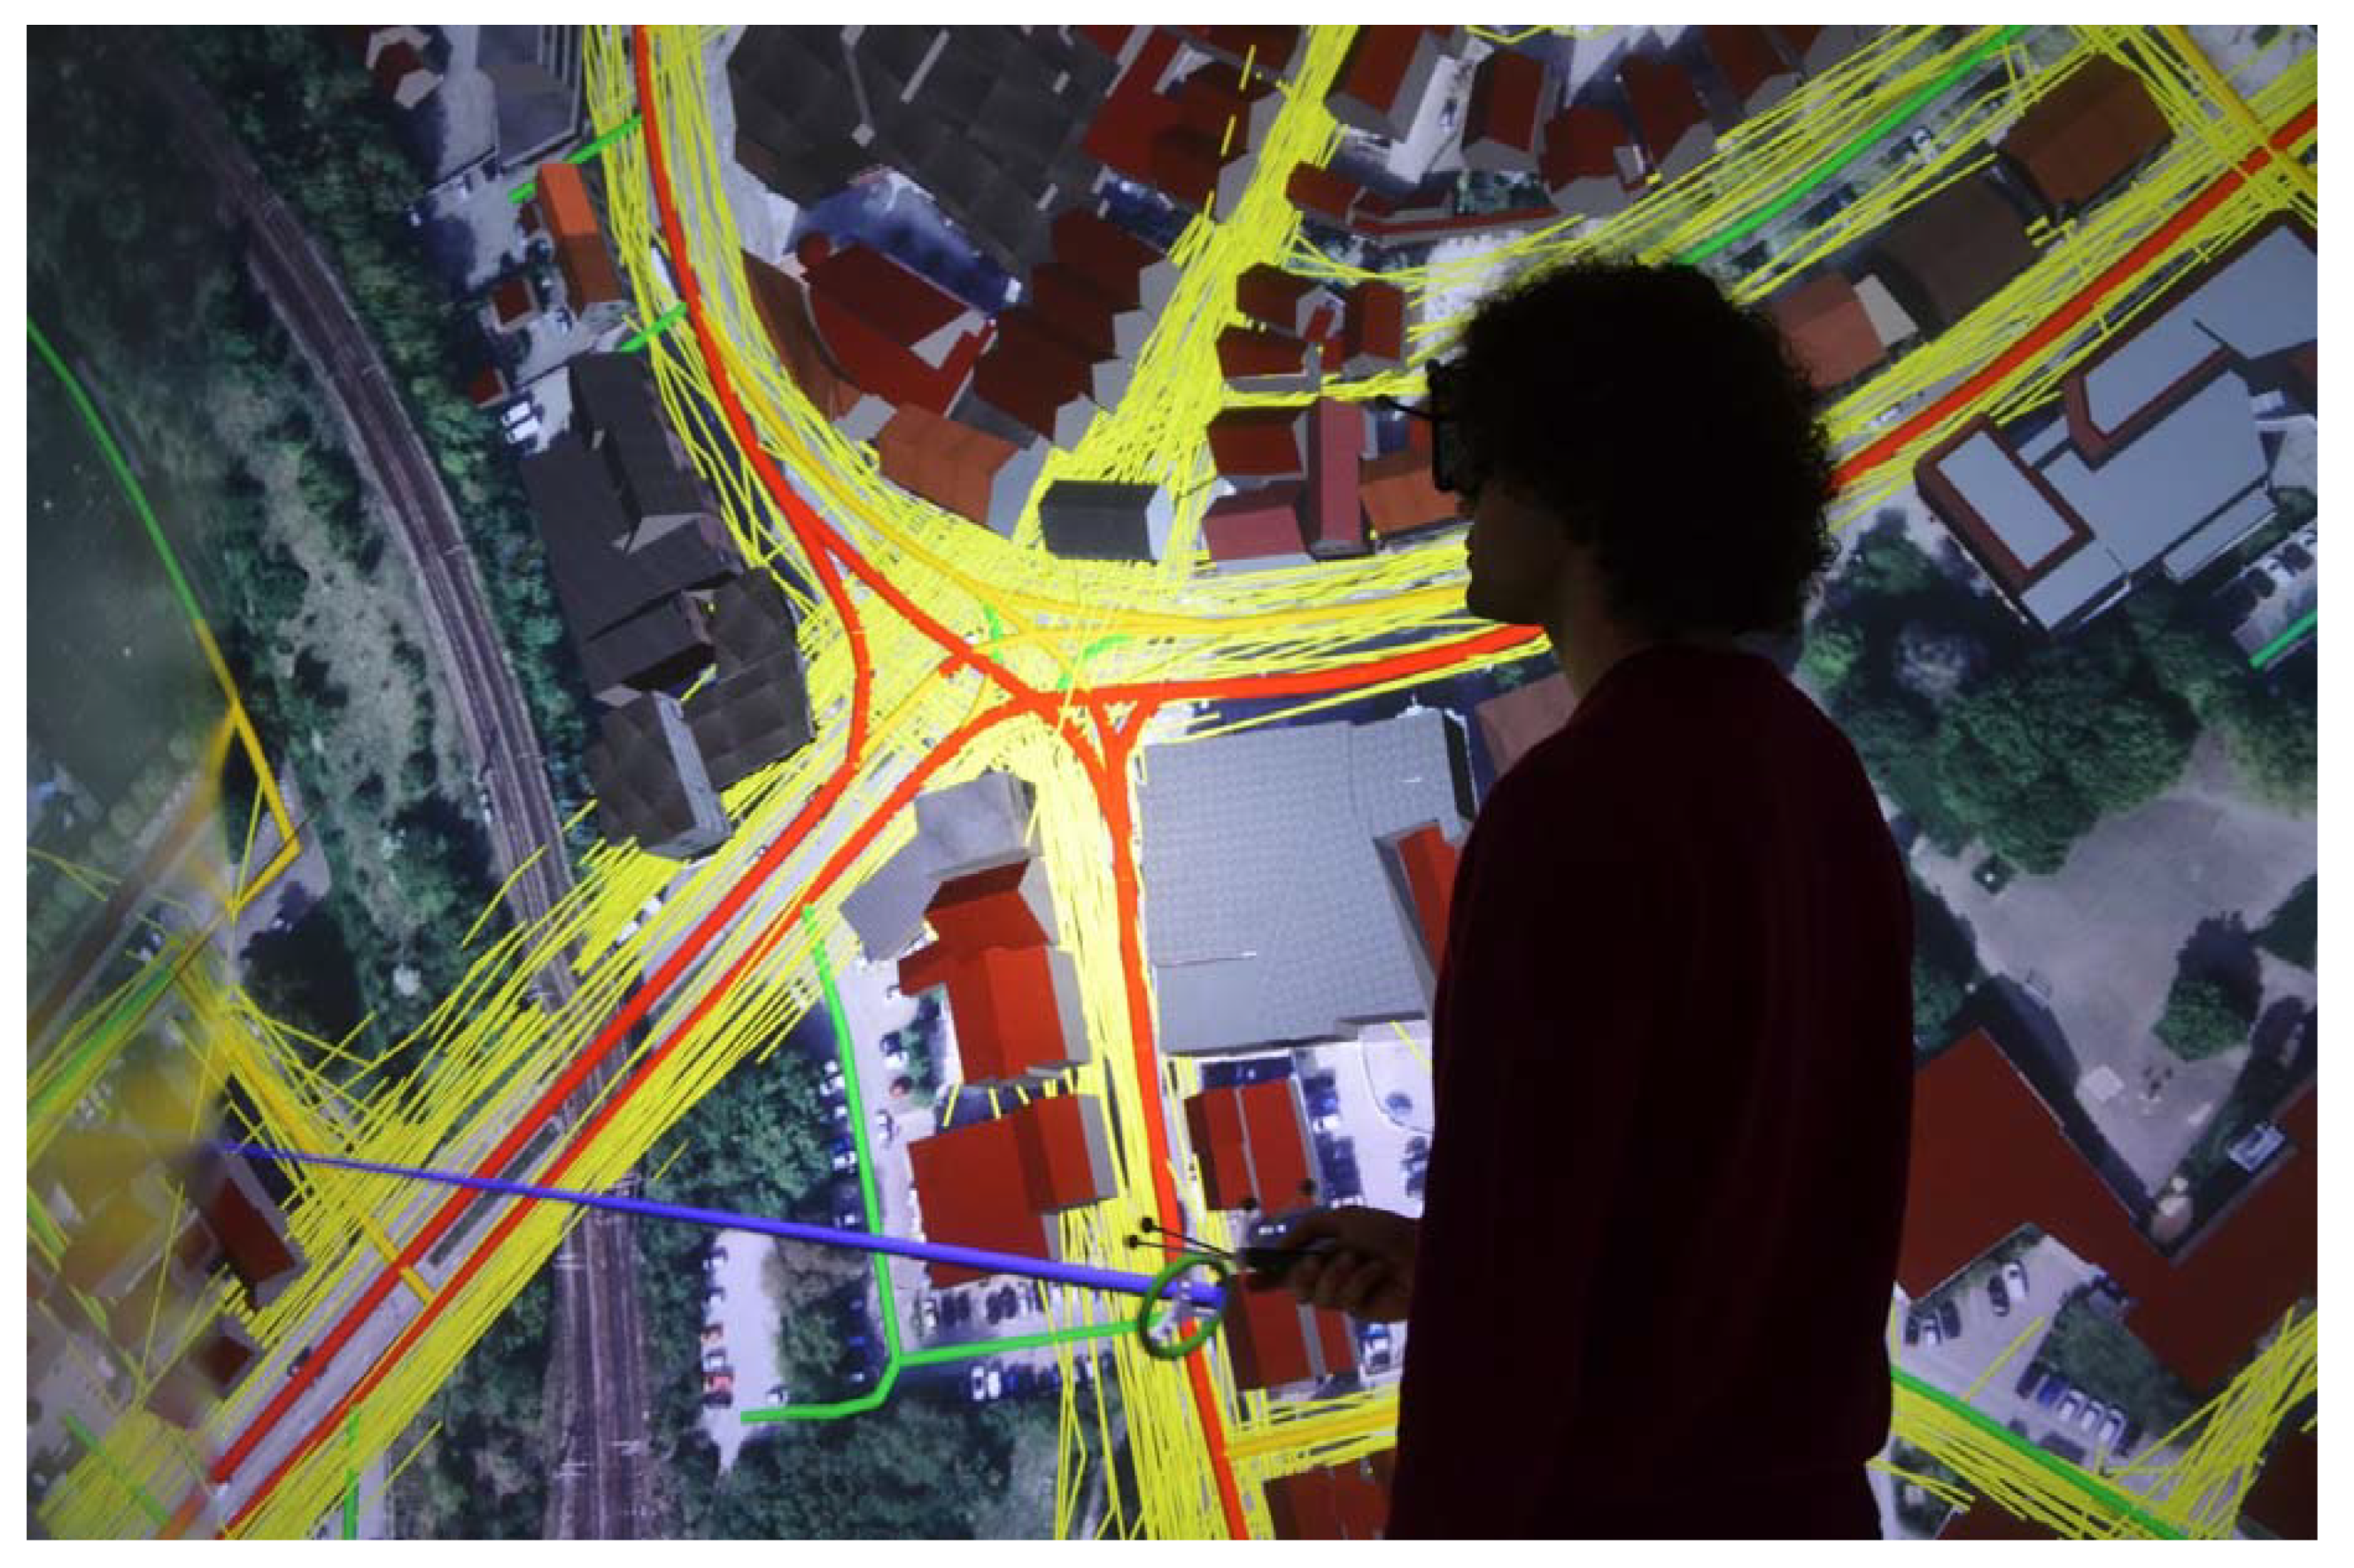
Empirical data set for pedestrian routes and the space syntax model implemented in the urban digital twin. This allows us to compare the movement potential of the street network to real-life uses (photo credited to Dembski, 2018).
Figure 5.
Empirical data set for pedestrian routes and the space syntax model implemented in the urban digital twin. This allows us to compare the movement potential of the street network to real-life uses (photo credited to Dembski, 2018).

Figure 6.
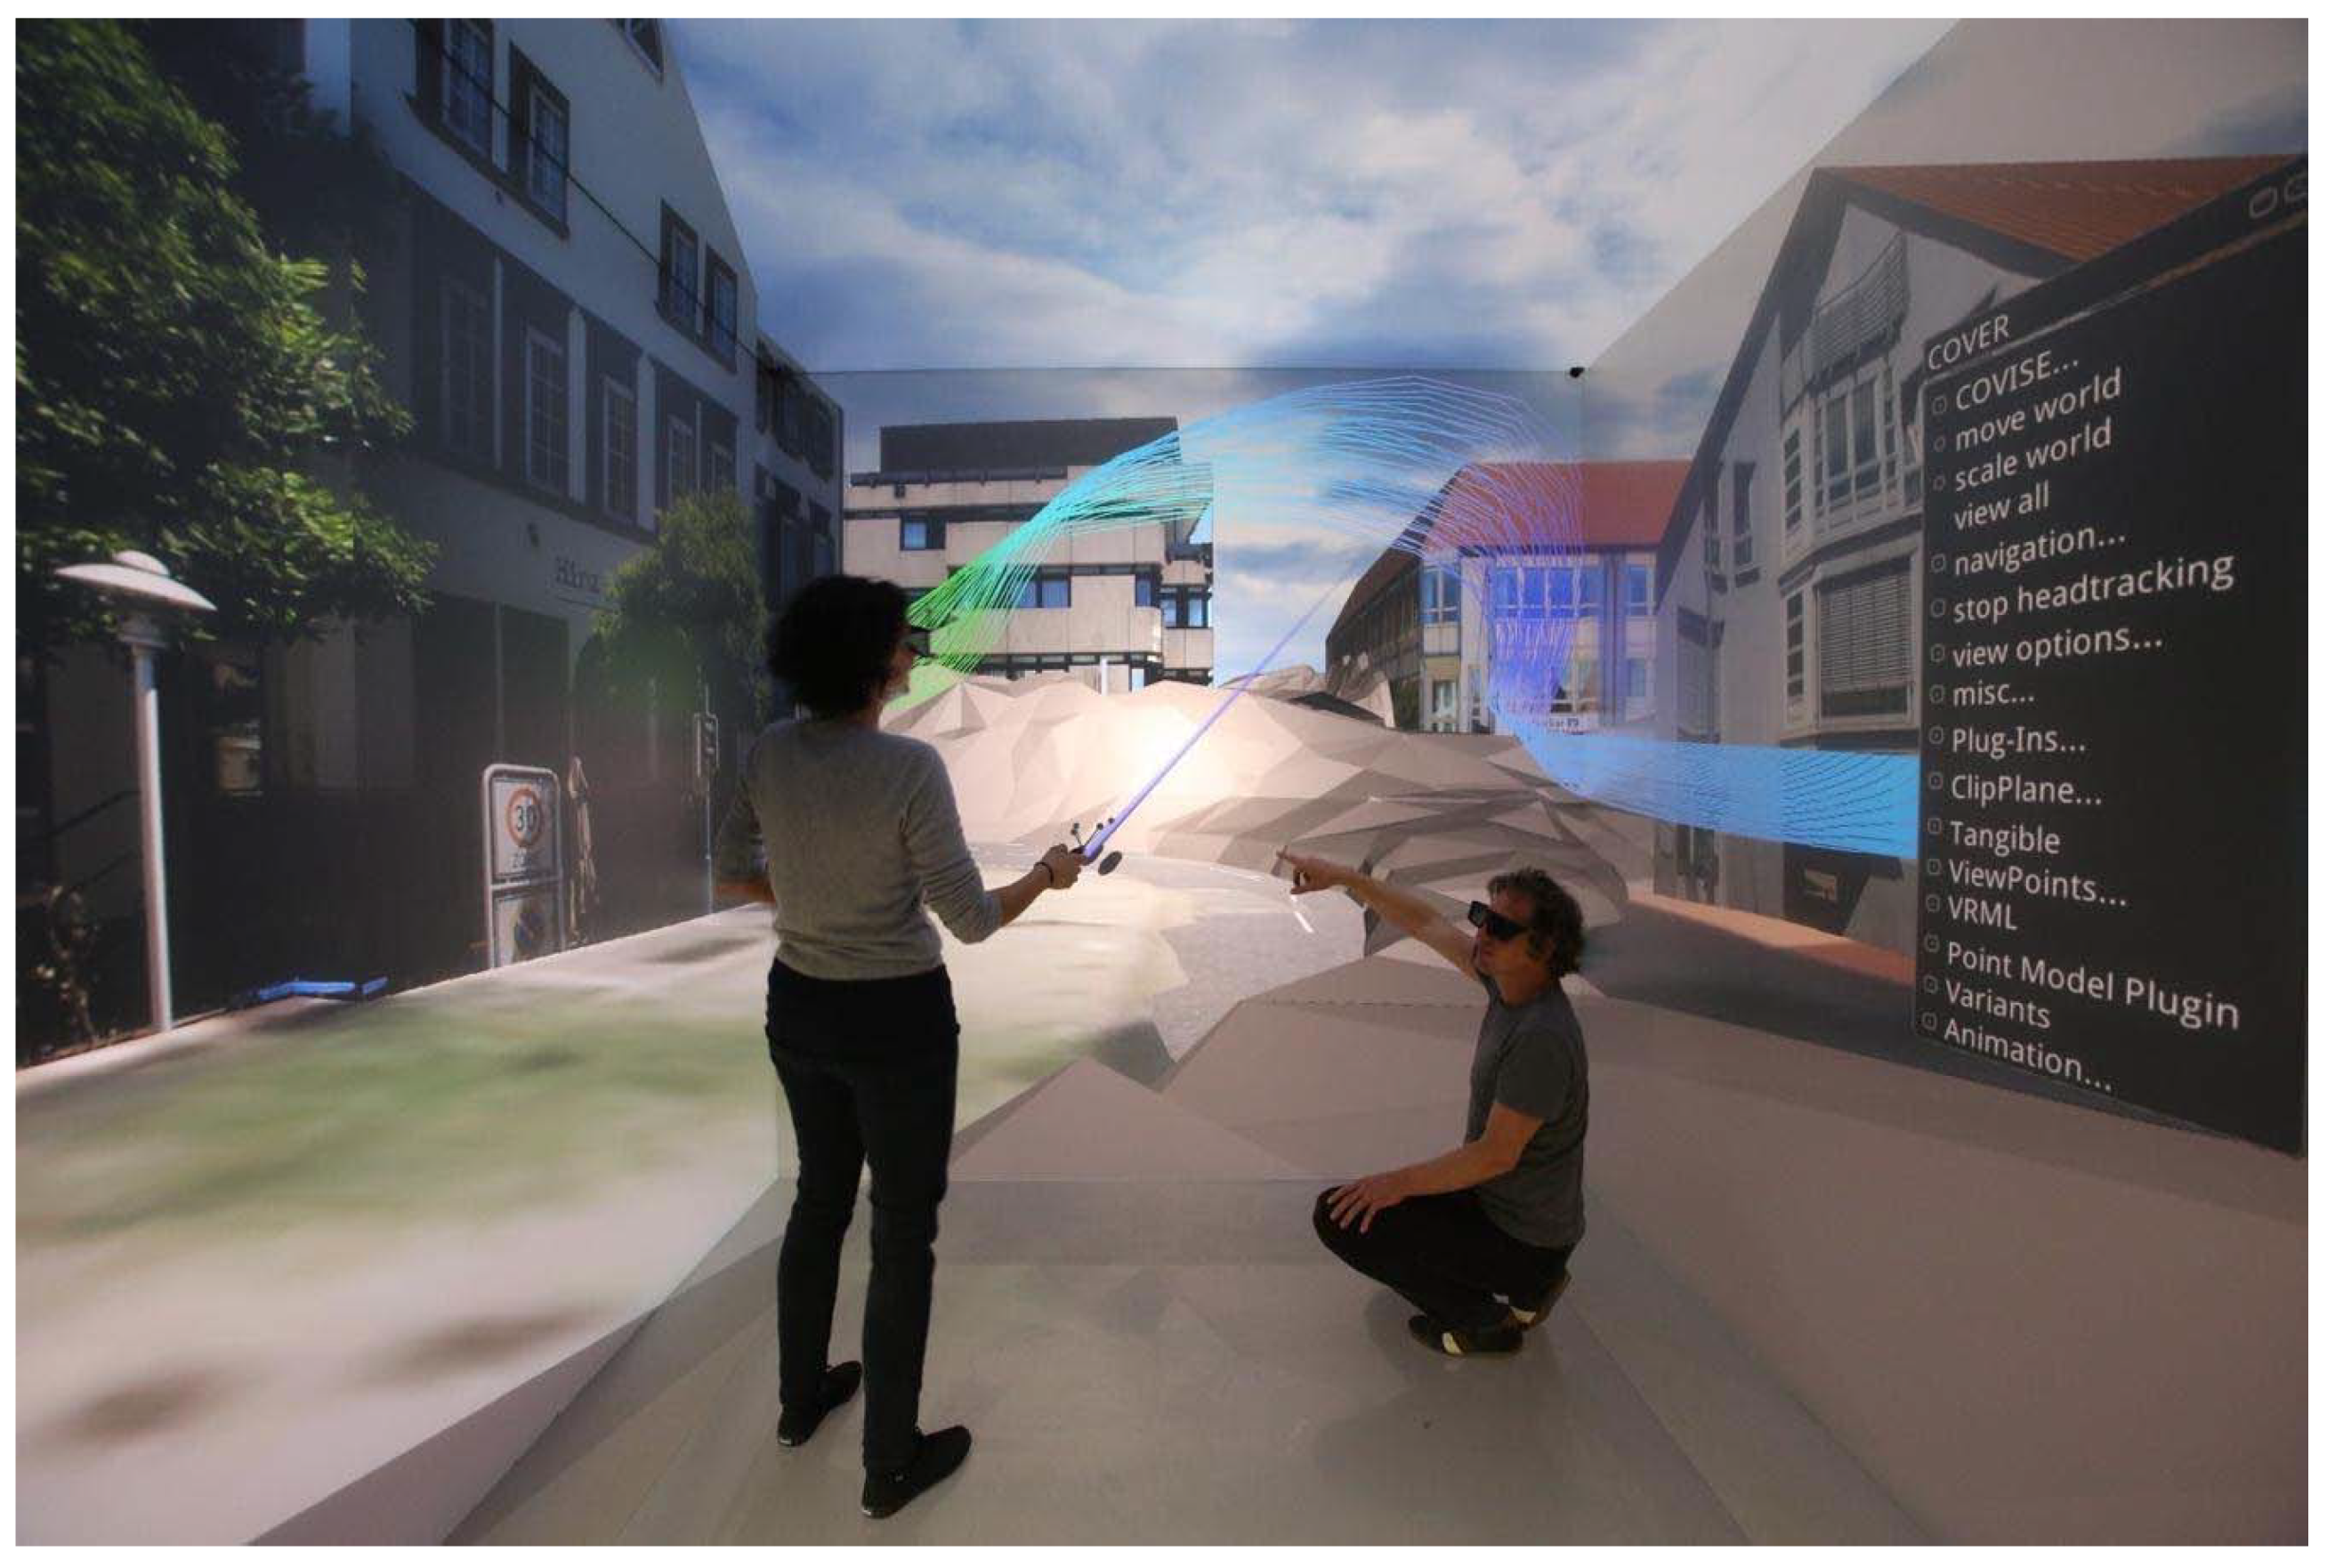
Particulate matter and wind flow simulation visualized in the CAVE. The particulate matter concentration is represented as an iso-surface. For the wind flow simulation, the color range from blue to green indicates wind speed from low to intermediate. The CAVE is a stationary five-sided cube for VR back-projection run by a 22-node cluster, five 3D-projectors, a tracking system, and active shutter glasses for the participants (photo credited to Wössner, 2017).
Figure 6.
Particulate matter and wind flow simulation visualized in the CAVE. The particulate matter concentration is represented as an iso-surface. For the wind flow simulation, the color range from blue to green indicates wind speed from low to intermediate. The CAVE is a stationary five-sided cube for VR back-projection run by a 22-node cluster, five 3D-projectors, a tracking system, and active shutter glasses for the participants (photo credited to Wössner, 2017).

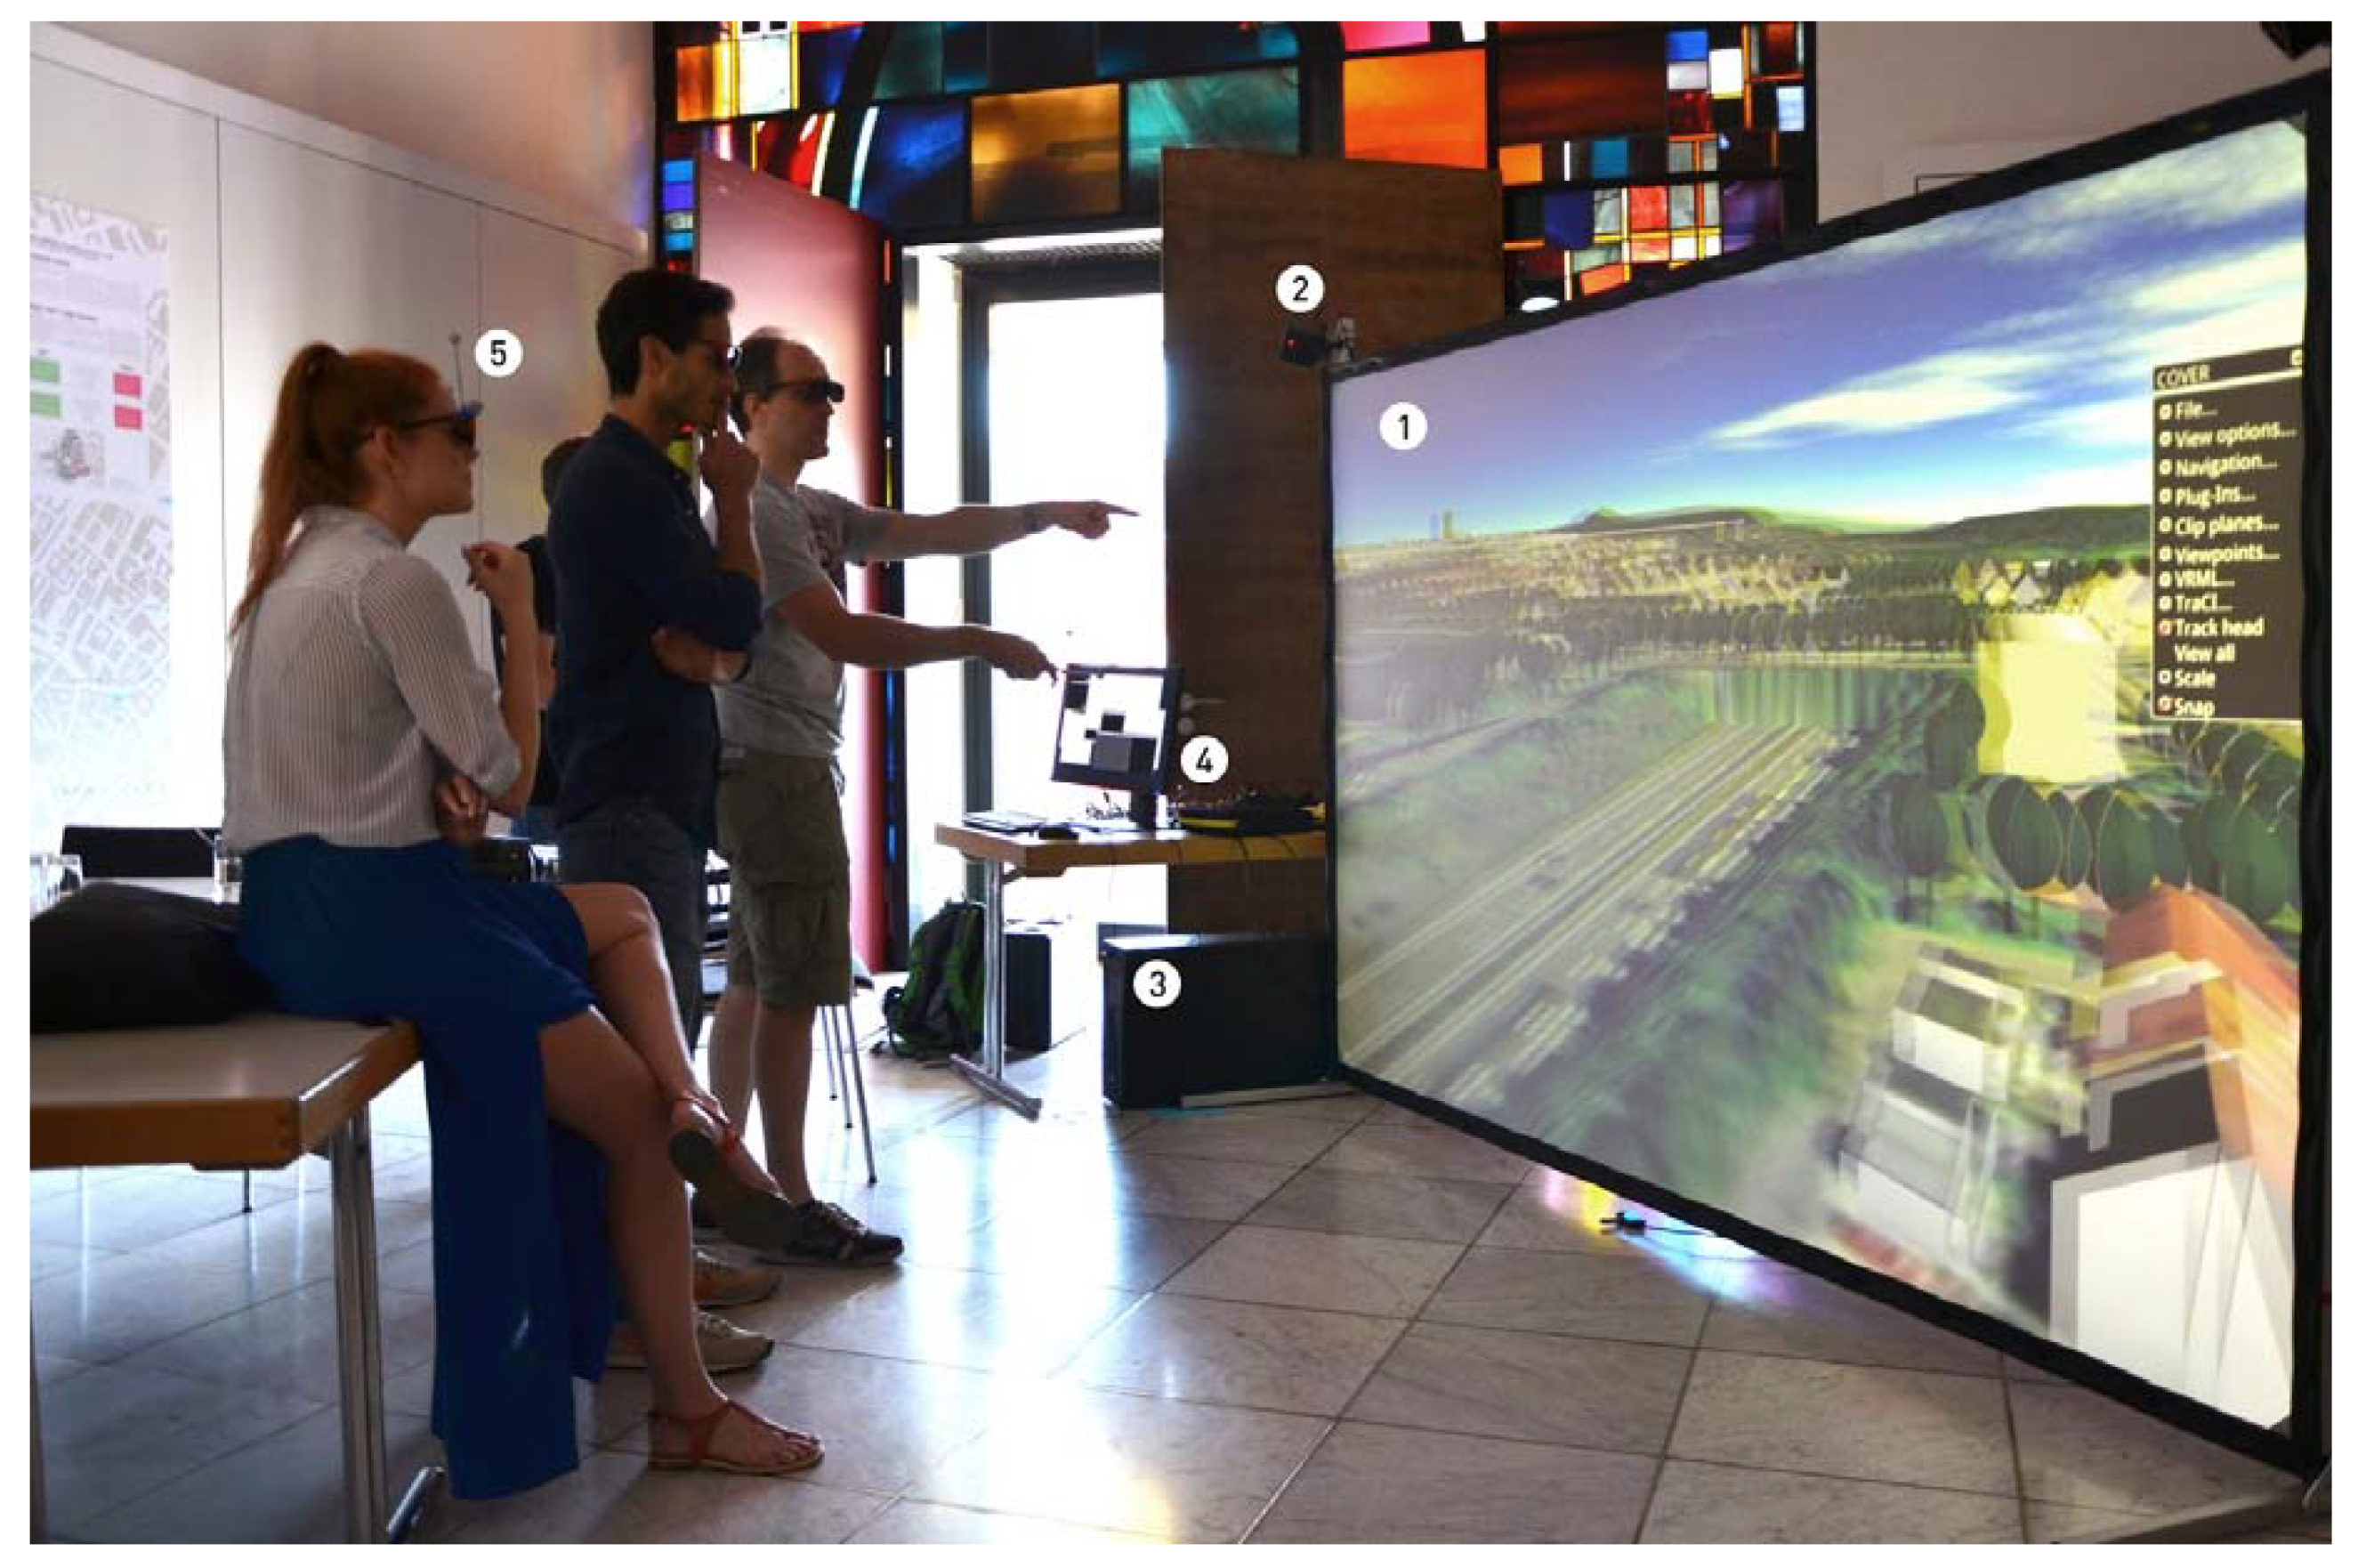
Figure 7.
The mobile VR setup during a participatory process including a back-projection wall [1], tracking system [2], computer [3,4], a 3D-projector, and active shutter glasses [5] for the participants (photo credited to Dembski, 2019).

Figure 8.
Visualization of the survey results. n = 39; scales ranged from −3.00 to +3.00.

© 2020 by the authors. Licensee MDPI, Basel, Switzerland. This article is an open access article distributed under the terms and conditions of the Creative Commons Attribution (CC BY) license (http://creativecommons.org/licenses/by/4.0/).
Share and Cite
MDPI and ACS Style
Dembski, F.; Wössner, U.; Letzgus, M.; Ruddat, M.; Yamu, C. Urban Digital Twins for Smart Cities and Citizens: The Case Study of Herrenberg, Germany. Sustainability 2020, 12, 2307. https://0-doi-org.brum.beds.ac.uk/10.3390/su12062307
AMA Style
Dembski F, Wössner U, Letzgus M, Ruddat M, Yamu C. Urban Digital Twins for Smart Cities and Citizens: The Case Study of Herrenberg, Germany. Sustainability. 2020; 12(6):2307. https://0-doi-org.brum.beds.ac.uk/10.3390/su12062307
Chicago/Turabian StyleDembski, Fabian, Uwe Wössner, Mike Letzgus, Michael Ruddat, and Claudia Yamu. 2020. "Urban Digital Twins for Smart Cities and Citizens: The Case Study of Herrenberg, Germany" Sustainability 12, no. 6: 2307. https://0-doi-org.brum.beds.ac.uk/10.3390/su12062307
Note that from the first issue of 2016, this journal uses article numbers instead of page numbers. See further details here.