Fuzzy Cognitive Map Clustering to Assess Local Knowledge of Ecosystem Conservation in Ecuador


1
Department of Agricultural Economics, Universidad Politécnica de Madrid, ETSIAAB, Avda. Puerta Hierro 2, 28040 Madrid, Spain
2
CEIGRAM, Universidad Politécnica de Madrid, Calle Senda del Rey 13, 28040 Madrid, Spain
*
Author to whom correspondence should be addressed.
Sustainability 2020, 12(6), 2550; https://0-doi-org.brum.beds.ac.uk/10.3390/su12062550
Submission received: 25 February 2020
/
Revised: 19 March 2020
/
Accepted: 21 March 2020
/
Published: 24 March 2020
(This article belongs to the Special Issue Global Environmental Policy and Governance in Sustainability)
Abstract
:Smallholder farmers in developing countries such as Ecuador have contributed widely to ecosystem conservation. Although they have been affected by the consequences of climate change, the synergy of Pachamama care and technical knowledge has become key to sustaining dynamics in their local territories. This paper presents a combined methodology approach based on fuzzy cognitive mapping (FCM) and hierarchical cluster analysis (HCA) to capture perceptions of ecosystem conservation. The purpose was to assess the impact of the “Biocorridors for Living Well” program on the application of local knowledge by smallholder farmers. The findings showed that program managers had a limited narrow focus based on the general program ideology, whereas peasants’ perceptions revealed a more complex map, highlighting the importance of building capacities beyond sustainable agricultural techniques. Also, both groups were aware of the contribution of ecosystem conservation to rural development. However, it is essential to stress that the contribution of smallholder farmers to conservation was critical, and most of the time, their efforts were not valued. Therefore, to scale up program outcomes, national and international institutions require an understanding of local peasants’ perceptions to guarantee action sustainability and to avoid repetitive actions in their local territories.
1. Introduction
Smallholder farmers in Ecuador have made good progress toward ecosystem conservation [1], where the synergies between local and scientific knowledge have become key elements in sustaining the governance of ecosystems [2]. In some cases, local knowledge has helped to enhance biodiversity resilience within the ecosystems [2,3], due to the peasants’ awareness of biological biodiversity and their know-how [3,4,5]. In Ecuador, “Pachamama” (a Quichua word that means “motherland” in English) represents an element of respectfulness and caring among peasants [3,6]; hence, it is a strong incentive for sustaining biodiversity in their own environment.
Currently, many international development institutions are working in the rural zones of developing countries with the formulation and implementation of alternative agricultural systems, such as agroecology, organic farming, and forestry systems [7,8]. These alternative systems consider a sustainable agriculture model approach [9], in which attention becomes focused on smallholders worldwide [10]. In Ecuador, the intervention process of Non-Governmental Organizations (NGOs) and governmental institutions continues to focus efforts on achieving the Sustainable Development Goals (SDGs) [11]. Indeed, several studies have mainly focused on strengthening the adoption of sustainable agricultural practices (SAPs) by smallholders using a broad range of approaches, including surveys, qualitative methods, and experimental models [12,13,14,15]. Education, age, economic incentives, forms of assistance, and the level of organizations, among other factors, are highlighted as main contributors to SAP adoption. Notwithstanding the importance of the abovementioned factors, is it not necessary to focus on how to strengthen and scale up efforts of ecosystem conservation in local communities based on a technical assistance approach by institutions?
For over 30 years, smallholders have been involved in environmental management programs. Several institutions in Ecuador have been working to enhance rural development with local people. Simultaneous interests, such as poverty alleviation, food security, ecological management, empowerment of rural communities, and supportive policies in the local territories, have been considered as the backbone in agriculture development [16,17,18,19]. As a result of these interventions, some peasants have recognized the environmental benefits of SAPs, whereas others have reinforced their know-how with a technical approach [20]. There is a need to support rural livelihoods using an approach where the farmer becomes gripped by the market and cares for the environment based on local knowledge [21]. However, the current economic system in Ecuador does not present public politics focused on smallholder farming [22], where the market demands that the smallholder farmer acts as a rational economic agent to natural resource availability [4].
In this context, to avoid repetitive actions of farmers and for scaling-up the actions on the local territories, the institutions should relate to the current local knowledge accumulated and perceptions related to the ecosystem dynamics. The intention is to not only combine ancestral and technical knowledge, but also to capture the views of local farmers on climate change as a way to take a bottom-up approach to representation.
Although participatory approaches have allowed researchers to capture the complexity of the linkage between ecosystem conservation and livelihoods through participatory modeling methodologies [23,24], it is also suitable to compare stakeholders’ perspectives [25,26]. This study was framed within the actions intended to link biodiversity and well-being within an ecosystem conservation program known as “Biocorridors for Living Well” in Ecuador. A fuzzy cognitive mapping (FCM) approach was used to (1) quantify the differences in group perceptions, and (2) identify the main dimensions of the program perceived by each study group. The program outcomes, issues faced, and strategies related to the activities developed during the program were represented and assessed from two points of views: Program managers and local peasants. It is important to mention that the actions related to ecosystem conservation are evident in the case study.
This study is a valuable contribution to understanding what has been happening, and could continue to happen, in the local territories in developing countries such as Ecuador, regarding the efforts by different institutions to link ecosystem conservation and well-being. Therefore, this paper provides an empirical-based community-level analysis of the current perspective of the peasants on the ecosystem conservation program compared to the perspective of project managers. The findings of this study may be useful to policy-makers in designing effective strategies and policies for the next stages of the “Biocorridors for Living Well” program. In addition, it is expected that the study will contribute to the existing literature on the adoption of SAPs, and that researchers and policy-makers will find the work useful for further research. The information presented in this paper is based on between three and four months of field season in Ecuador in 2019.
2. Materials and Methods
2.1. The Case Study
Biocorridors are a frequent conservation strategy that involves social participation and the building of capacities at the territorial level [27,28]. Its main purpose is to counter the effects of habitat loss and fragmentation, which are the primary causes of biodiversity loss worldwide [29,30].
The “Biocorridors for Living Well” program in Ecuador was established to promote interventions related to soil and water conservation, with local people at the focal point of the program [30]. Protected areas such as forests, mangroves, and moors form the different ecosystems found in these biocorridors. As well as providing local species richness to land, moors act as a water sponge (located at an altitude of 3200–4700 m above sea level), generating ecosystem services for the local population, such as irrigation and drinking water [31] (Figure 1).
According to Ulloa [32], the term biocorridor relates to conservation and local development. Many semi-natural habitats have been threatened by some traditional agricultural practices, causing a loss of biodiversity in the territories [11,28,33,34,35]. Here, SAPs have been promoted as an alternative to enhance people’s well-being, while integrating environmental considerations into agricultural activities [8].
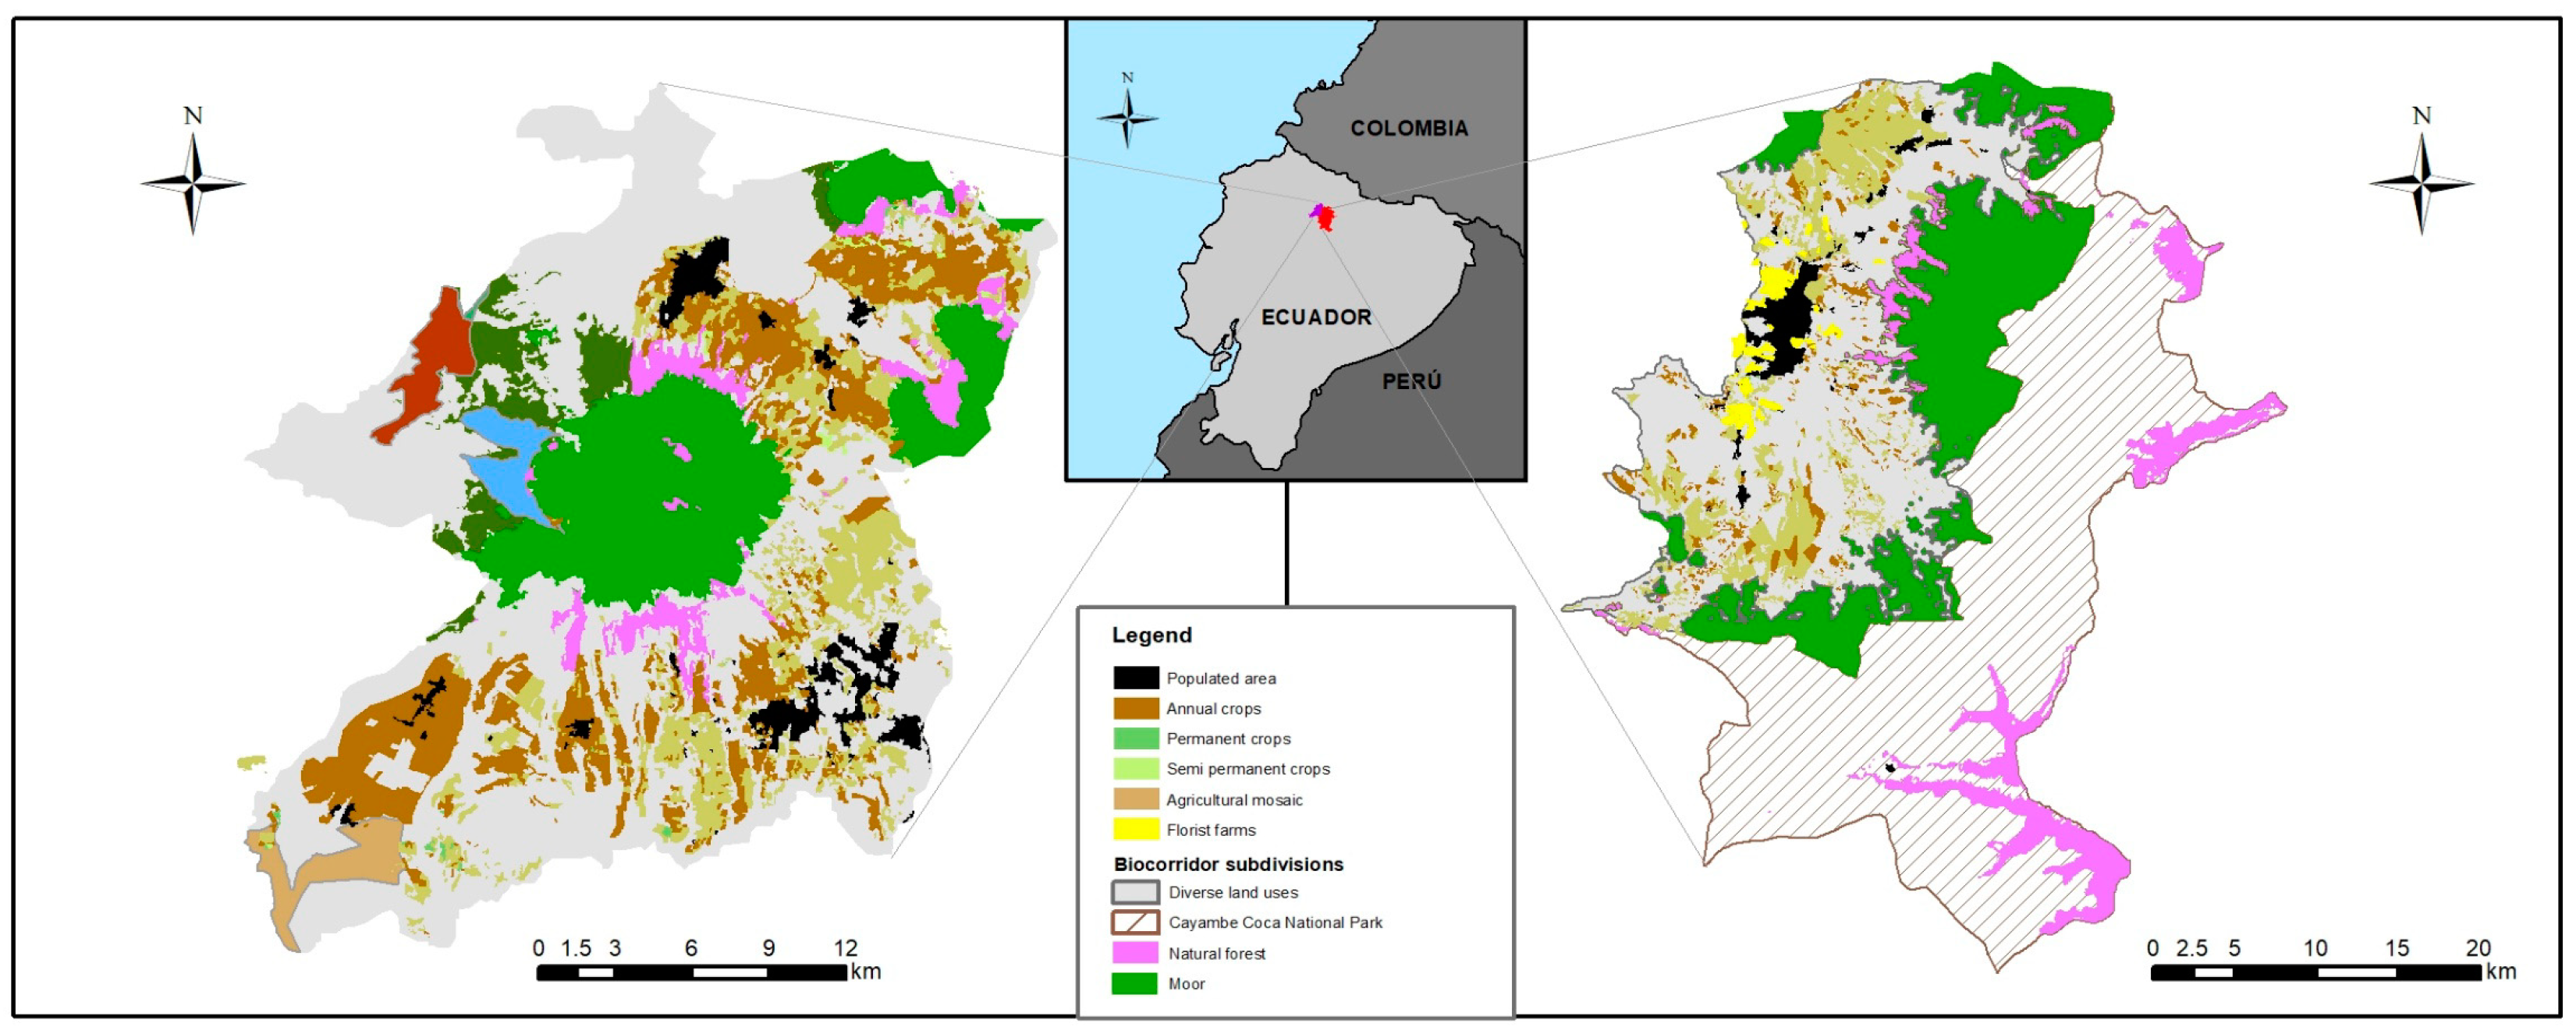
In identifying integral actions that strengthen the adoption of SAPs by the local people, the environmental conservation program “Biocorridors for Living Well” in Ecuador was selected. The Pisque Mojanda San Pablo (PMSP) and Cayambe Coca (CC) biocorridors were the territories chosen to study (Figure 2). These biocorridors have been previously identified as vulnerable zones to climate change [30,36,37].
About two-thirds (69%) of the PMSP biocorridor is located in the Pichincha province, and is extended over five rural parishes that belong to the Pedro Moncayo canton. The other 31% is located in the Otavalo canton, Imbabura province, comprising four rural parishes. This biocorridor extends to 49.089 ha. In addition, the PMSP biocorridor has important natural areas: Native forests (4.66% of the total biocorridor), moors (20.01%), and Andean forests (4.26%). However, the level of pressure and threats faced by this territory is extremely high [36,37,38,39]. On the other hand, the CC biocorridor extends to 127.806 ha, which includes four rural parishes from the Cayambe canton, Pichincha province, and one from the El Chaco canton, Napo province, as seen in Figure 2. Similarly, the CC biocorridor presents a high level of threat to its ecosystems. Important conservation areas such as native forest (6.76% of the total biocorridor) and moors (0.17%) are located in this biocorridor, and the Andean forest presents a significant conservation area in the biocorridor (28.38%).
Both biocorridors are biologically rich ecosystems. They share moor ecosystems, characterized by their diverse sources of water: Glaciers, lakes, rivers, and other groundwater sources [30,36]. Moor soil is rich in organic matter, which allows significant water-storage capacity and CO2 stock [36]. In addition, protected areas such as the Mojanda and Cayambe Coca National Park are located within these biocorridors [36,40]. They host a diverse range of endemic plants, mammal species, and birds [40].
Nevertheless, the expansion of agriculture in frontier areas, forest burning, and the increase of livestock activities on the moor have been identified as the main problems that threaten the ecosystems in these territories [36]. In addition, the principal exposures to climate hazards are droughts, hailstorms, and frosts [37,39]. For this purpose, the “Biocorridors for Living Well” program has established an integral intervention framework, where the actions are linked in a sustainable approach. Among the actions implemented are environmental education regarding ecological connectivity, reforestation, and natural resources. Smallholders are also trained on SAPs (as agroecological and agroforestry practices), nutrient management strategies, and forest and fruit species recovery. More recently, actions to enhance the added value chain have been implemented, and some farmers have participated in different commercialization channels such as agroecological fairs. This approach was developed in the Sixth Operational Phase of the program. For 2020, they plan to begin the Seventh Operational Phase.
In terms of economic activity, the PMSP and CC biocorridors have a relevant floricultural sector, followed by milk production [36,37,41]. Soils present a high fertility content in both biocorridors [37,39]. According to Ecopar [36,37], PMSP has 9.034 ha of agricultural area, whereas CC has 2.882 ha [38]. Both biocorridors provide opportunities for making traditional craft, tourist routes, and other activities developed by the local peasants. Despite the remarkable opportunity offered by these territories for different agriculture activities, a gradual increase of labor force has shifted to horticulture. This has caused changes in the local economy, consumption patterns, and natural resources. Table 1 shows the socio-economic characteristics of the two selected biocorridors.
Nowadays, the “Biocorridors for Living Well” program ideology is based on a “Sumak-Kawsay” vision (a Quichua word that means “well-being” in English) [42]. This approach seeks to connect humans with the Pachamama [43]. In an attempt to reach an integrated rural development by these ecosystem conservation programs, there is still a clear gap between ecosystem conservation and livelihood in the long term that deserves to be highlighted. For this purpose, it is crucial to understand the current perceptions of smallholder farmers after program implementation to identify the adequate strategies and established recommendations for scaling up the actions for sustainability.
2.2. Methodological Framework
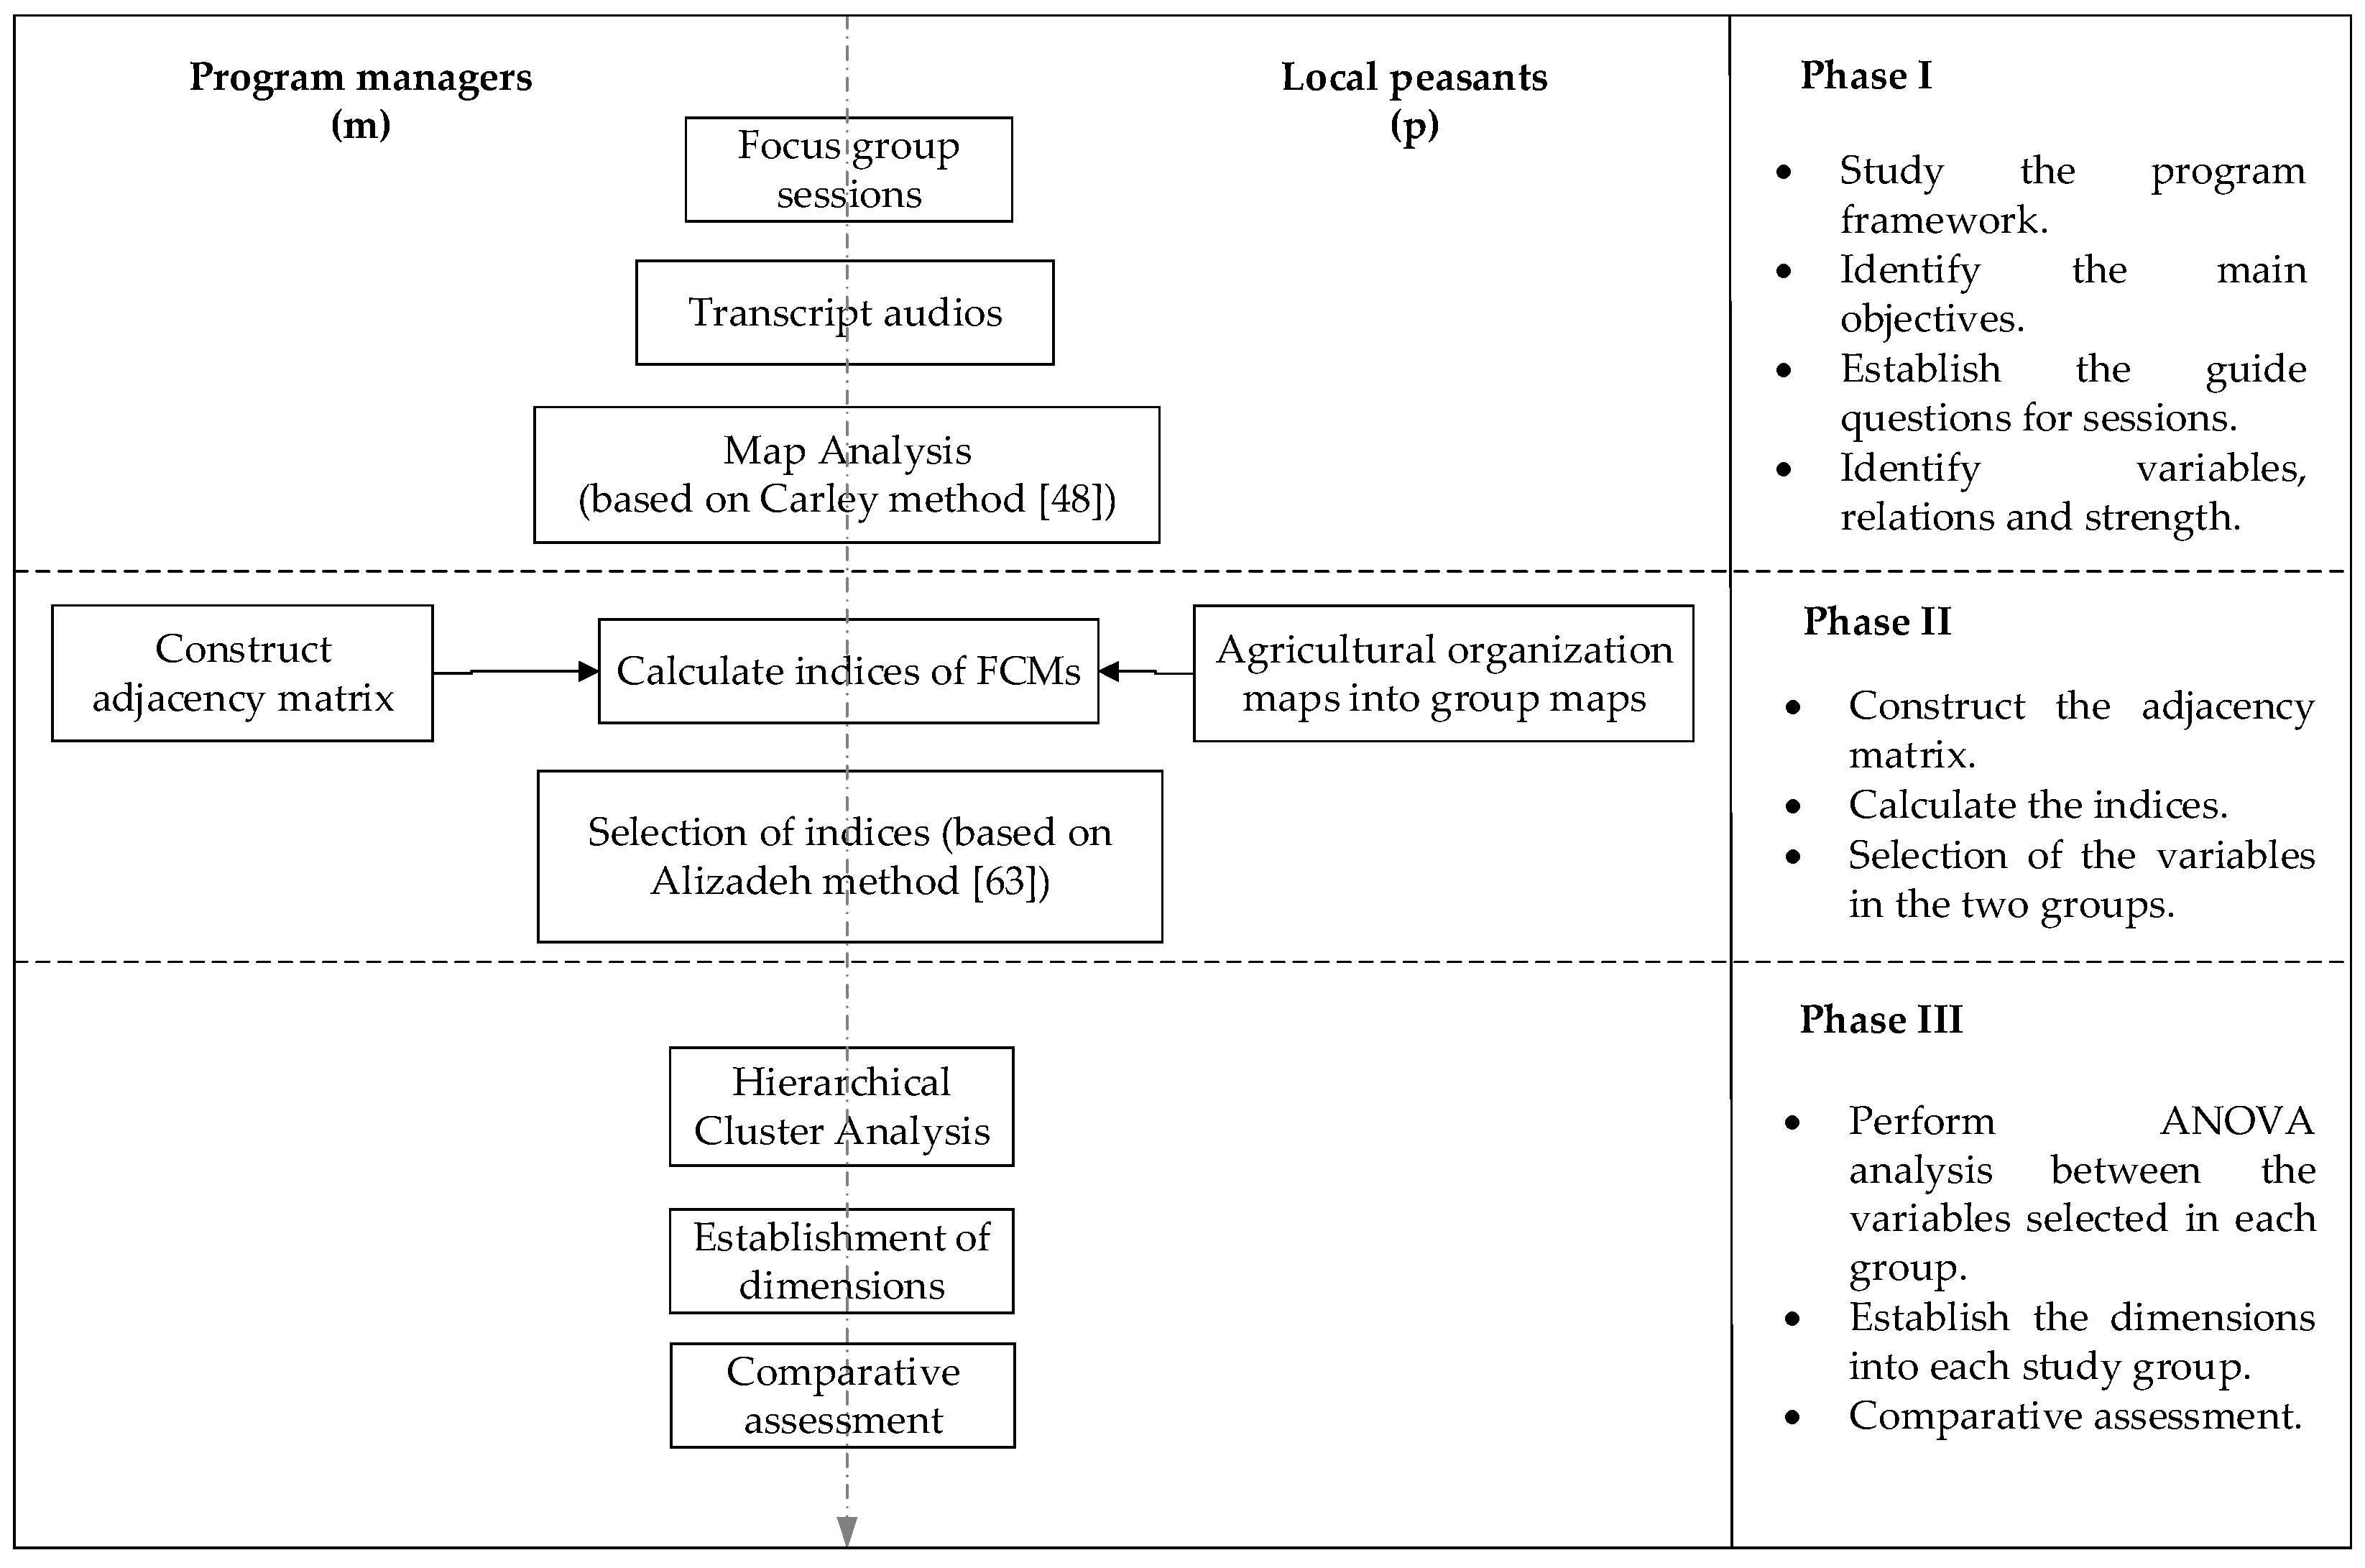
A semi-quantitative approach was developed through three subsequent phases. The method was designed to assess peasants’ and project managers’ perceptions about environmental conservation and livelihood in the “Biocorridors for Living Well” program.
The study had three stages, as shown in Figure 3. First, a participatory approach was conducted through focus group sessions with different stakeholders. Second, map analysis and FCM construction were used to identify the key variables and causal relationships in the program intervention. Finally, hierarchical cluster analysis (HCA) using Ward’s linkage criteria was performed to assess and compare program managers’ and peasants’ perceptions on the “Biocorridors for Living Well” program.
2.2.1. Focus Groups and Map Analysis in the Program Intervention
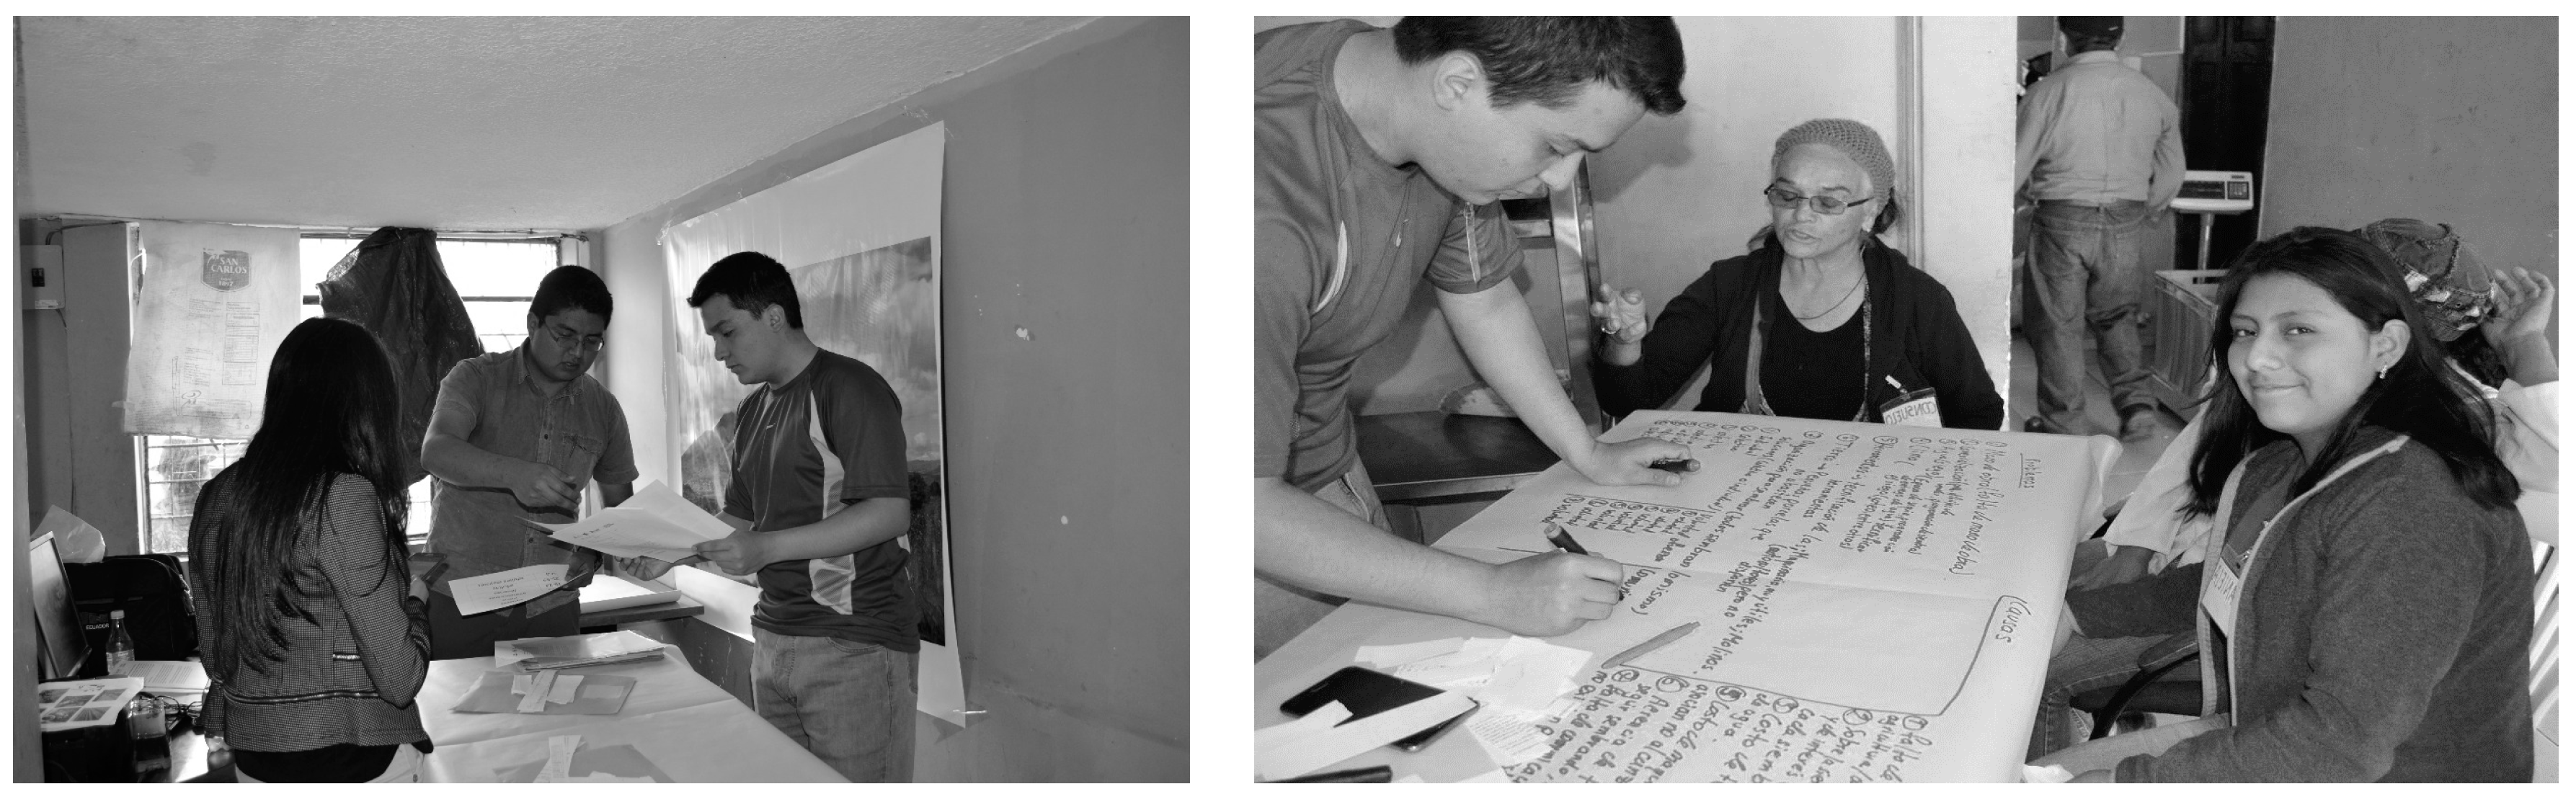
A qualitative technique focus group [45] was used to gather information on current knowledge of the “Biocorridors for Living Well” program from smallholder farmers and project managers (see Figure 4). In our analysis, both groups mentioned were analyzed in a separate way to ensure they had a precise understanding [46] of the outcomes and reflections.
As a preliminary step, we established a workshop with program managers, where we discussed the key concepts (keywords) that underlie the actions taken in the “Biocorridors for Living Well” program. Based on the reports available for the program intervention, we maintained an interactive discussion about the keywords, which allowed us to obtain up-to-date knowledge. The reports available on the program intervention were studied. In addition, some peasants’ plots in the study area were visited to gain initial insight into the project activities implemented in the area, as well as into the implications for their daily lives. Subsequently, focus group sessions were conducted using semi-structured interviews to gather data on current agricultural activities and to discuss the challenges, drivers, and impacts within the program framework. Interview questions targeted for local peasants contributed to understanding current outcomes and thinking about possible strategies for the next stage. Local peasants were selected and recruited with the help of a local leader and the project coordinator in each biocorridor. Several aspects were considered, such as meeting attendance, participation in environmental management training, and farmers that applied SAPs on their plots. Essentially, peasants that participated in the workshops had actively participated in activities related to the biocorridors. A semi-structured approach was developed in five sessions with different focus groups. The focus groups were separated by agricultural organization in such a way that allowed us to reach a balanced dialogue with smallholder farmers.
Another focus group was conducted with the territorial project coordinators to identify the main dimensions of the program intervention. Discussions were voice recorded and analyzed through map analysis [47,48]. This technique focuses on the concepts of relationships in a quantitative way. We employed three basic steps in the representation scheme of the map analysis: (1) Distinction of concepts through discussion with program managers; (2) relationships between the concepts in the record statements; and (3) directionality and strength in the causal relations between two concepts. In the next section, we explain in detail the map analysis process in connection with FCM construction. Exploratory analysis of statements took place using the voice recordings, and map analysis was conducted using Excel worksheets.
Our sample was not designed to be representative of the farmer population in each biocorridor, but instead aimed to capture in-depth insight into a small set of local peasants. Not all farmers who were selected and contacted from the two biocorridors participated in the workshops. The number of participants in each workshop was as follows: 7 belonged to the PMSP biocorridor, 13 to the CC biocorridor, and 4 participants were program managers who worked in both biocorridors. The focus group sessions took place in November and December 2018. On average, each session lasted one hour.
2.2.2. Fuzzy Cognitive Mapping
In the second step, FCMs were constructed using map analysis [47,48] to codify results from the focus groups sessions. As the name indicates, FCMs are based on cognitive mapping and allow for semi-quantitative analysis [49,50,51]. This methodology was based on the work of Axelrod [52] and Kosko [51]. Fuzzy cognitive mapping has been widely used in a large number of fields, where sustainable development is addressed by Dodouras [53]. He linked the existing local knowledge or ancestral knowledge to scientific knowledge, which is an essential area of inquiry in this study. FCM is based on the establishment of an adjacency matrix [54], which represents causal relationships between variables. As a first step of map analysis, the main concepts (variables or nodes) were identified in a parallel way between program managers and peasant groups. The causal relationships and their strength between two variables were assigned through Carley and Palmquist’s methodology [47,51]. The directionality was established by positives edges, which represented a causal increase, whereas negative edges represented a causal decrease [51,55]. A discrete range of values in the interval [−0.75,0.75] was used to denote whether the relationship was implied in the text (0.25), stated explicitly (0.50), or emphasized (0.75). A positive (negative) value indicated a positive (negative) relationship. Finally, 0 was assigned when no relation was identified. For example, a peasant said that “production factors such as land, seeds, water, and commercialization are the most important.” This statement clearly involves four variables (land, seeds, water, and commercialization) which were coded as having a positive link with agricultural production. Also, the phrase “the most important” emphasized the level of importance, which, in this case, was 0.75.
Subsequently, identified variables were reduced by combining them into common variable categories for both peasants and project managers. The idea was to allow a comparison between both groups. These results were averaged by category in each study group considering the strength values previously established. Finally, using the adjacency matrix [54] between variables in the interval [−0.75,0.75], FCMs were constructed for each focus group session, making five in total. Four cognitive maps were obtained from the farmer groups and one by the program manager group. To obtain the opinions of the stakeholder groups, the FCMs of farmers were subsequently aggregated. In the process of combining farmers’ maps, each map was given equal weight.
Once the FCMs were obtained, and following the calculation procedure explained by Özesmi and Özesmi [56], the connection indices were calculated: Outdegree, indegree, and centrality. The outdegree index (od(vi)) is defined by the row sum of the absolute values of coefficients in the adjacency matrix (i.e., the total strength of influence on other variables), where aik represents the weight in rows as in Equation (1):
The indegree measurement (id(vi), see Equation (2)) was calculated from the sum of the values in the column in the adjacency matrix (i.e., the total strength of influence on the variable), where aki represents the weight in columns.
Finally, the sum of the indegree and the outdegree of a variable is a centrality measurement (c). This measurement represents the importance level of individual variables [57,58]. According to the connection indices, the type of variable [59] was identified as shown in Equation (3).
To assess the level of the participation variable within the system, the centrality index, complexity, density, and hierarchy (h) index were analyzed. The complexity index represents the ratio of the receiver-to-transmitter variables, where a higher complexity shows complex systems thinking [58,60]. The number of connections divided by the maximum number of all possible connections represents the density index. A higher density index offers potential management policies within the model [58,60]. On the other hand, the h index depends on the total number of variables (N), as shown in Equation (4):
2.2.3. Comparison Assessment by HCA
This research aimed to analyze the different perspectives of the program intervention from the point of view of the peasants and the program managers, and to identify potential strategies for the next stage of the program. Hierarchical cluster analysis [62] was performed based on the resultant metrics of the FCMs of each studied group (m for managers and p for peasants). For this purpose, new variables were proposed and defined as the difference between the outdegree and the indegree metrics, as shown in Equations (5) and (6).
According to the resultant sign of sim and sip, the variables were explained. For example, a positive sign belongs to a cause group, and a negative sign belongs to the effect variable [63]. Then, differences between the variables c and s were taken. This difference is between program managers and peasants. Equations (7) and (8) show the formulas applied:
Dc = cmi – cpi, where i = 1,…,N
Ds = smi – spi, where i = 1,…,N
A condition of Equations (7) and (8) is that the groups of the study share the same variables. Also, if dc is negative, it belongs to the managers’ group. On the other hand, to analyze the variable ds, we analyzed the behavior of smi and spi, and so identified the position of the group.
Hierarchical cluster analysis was conducted to define the clusters, and Euclidean distance was used to identify the similarities between different variables. The appropriate number of clusters was chosen according to the objectives of the analysis [64]. Subsequently, ANOVA was carried out to test for significant differences among the clusters in each group. Then, descriptive statistical analysis was conducted by calculating the mean and the standard deviation of each cluster obtained. The main objective was to understand the position of the studied groups regarding the program intervention. The data were processed with RStudio using the package FactoExtra [65].
3. Results and Discussion
Focus Groups, Text Analysis, and FCM
The identification through text analysis for the project managers in the focus group session resulted in a total of 38 concepts, whereas 155 concepts came up in the farmers’ focus group. Data processing resulted in four FCMs for local peasants and one for program managers. One aggregated map was obtained for peasants. The total number of variables in the map was 155, which was combined into 24 categorical variables. Here, around 57% of the variables was common among both groups (see Appendix A and Appendix B for the variable aggregation list). Table 2 provides farmers’ FCM metrics (average values) and the aggregated maps (peasants’ and program managers’ maps). The average number (±SD) of variables in the agricultural organizations’ map was 17.25 (±1.71). The mean number of connections between variables was 48 (±6.38). After FCM data processing, peasants’ concepts resulted in 106 connections, whereas project managers presented a total of 20 concepts and 54 connections in their map. Peasants presented a value of density index close to 0.18, whereas the project managers were close to 0.14. The peasant group presented a large value compared to the program managers, contrary to what is reported in other studies [66,67].
Also, the project manager map had more receiver variables than the peasant group, that is, they perceived program intervention as a complex system [56]. Hierarchy indices show values close to 0 for both groups, mainly peasants, which means that theirs are fully democratic maps [56]. This finding reveals that the work can be seen as a participatory approach, where the decision-making does not concentrate on only one group of participants.
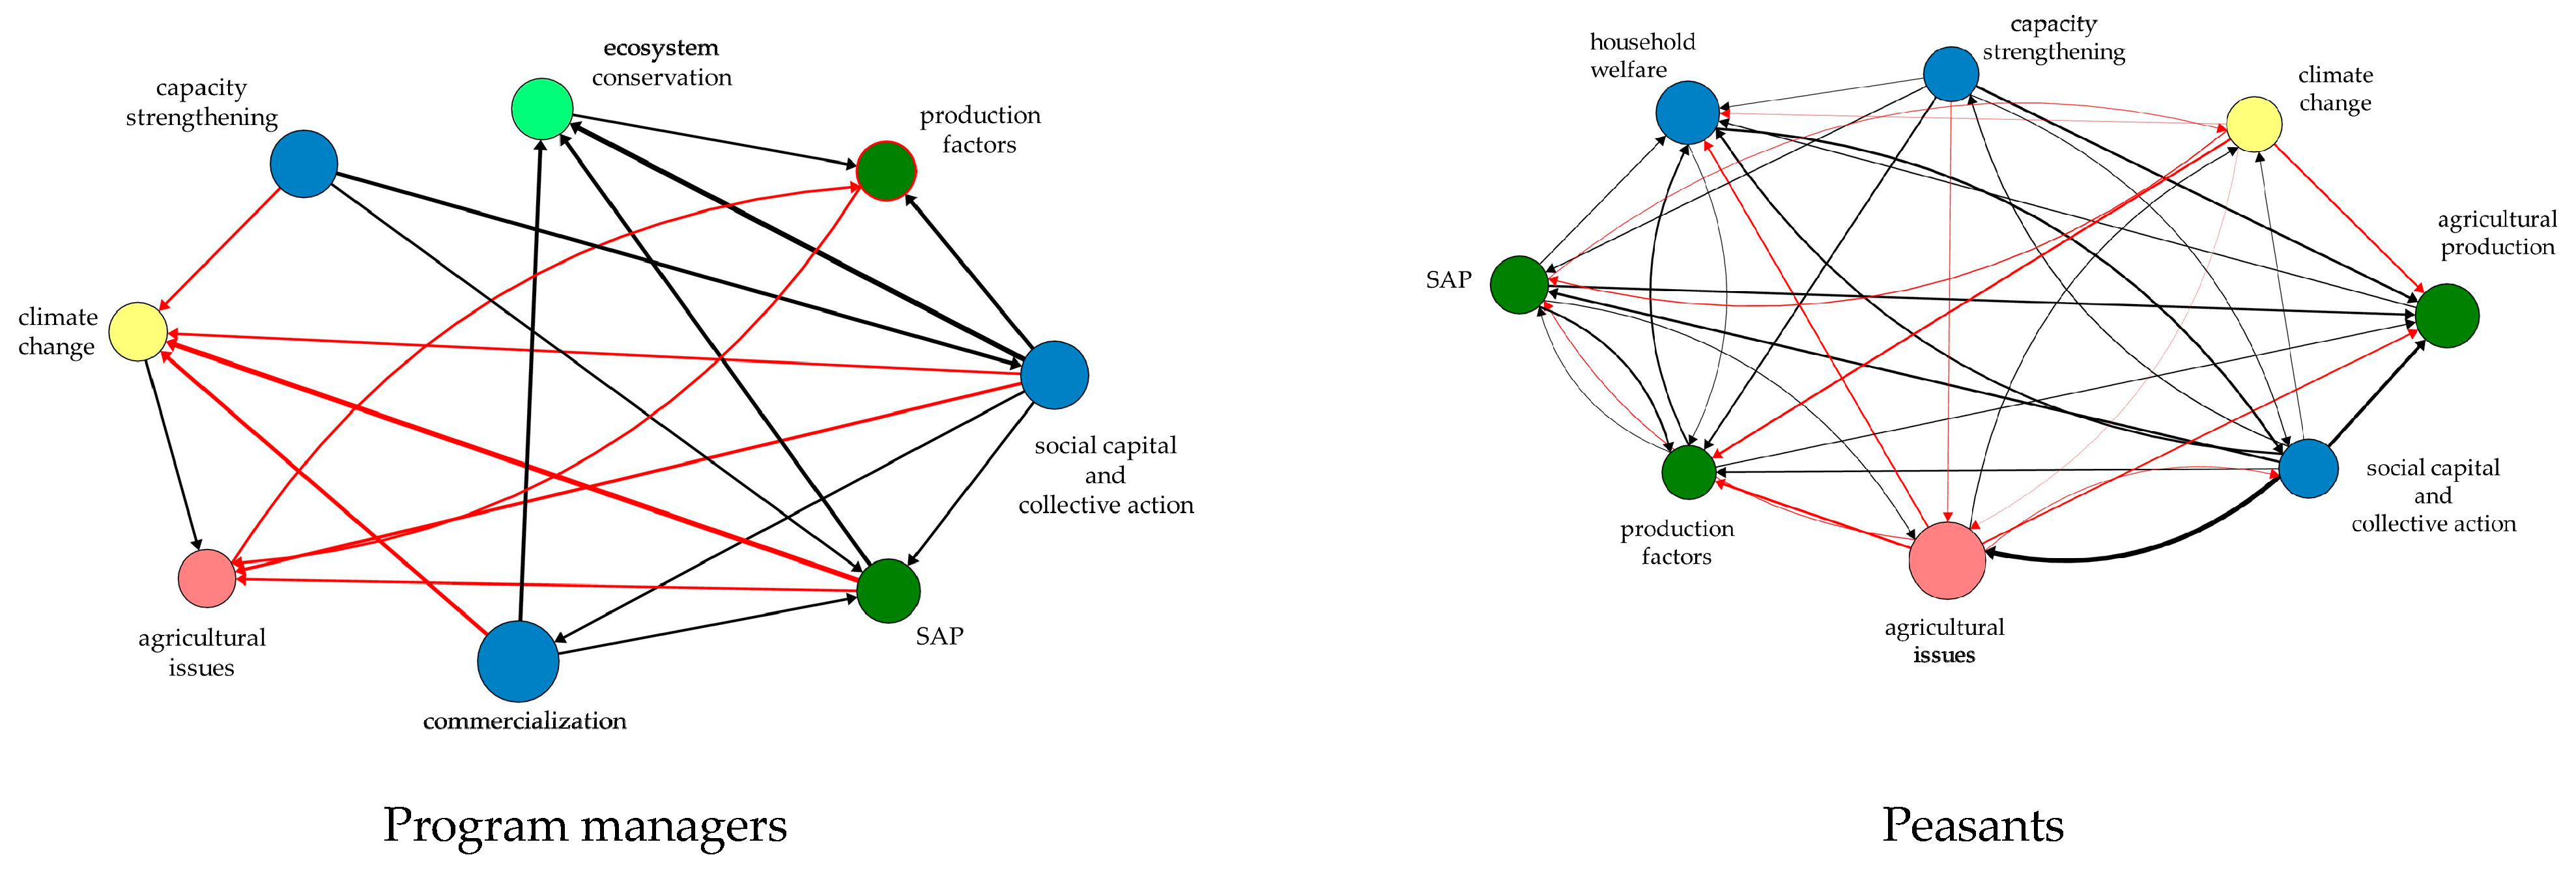
Figure 5 illustrates the connections between the eight most central variables in the managers’ and the peasants’ maps. The most central variable for both groups was social capital and collective action, understood as trust and teamwork [68]. As indicated by both groups, this variable is highly connected to other variables, and is considered a key element in reaching the conservation goals of the program [69]. Indeed, farmers emphasized the importance of this variable during the focus group sessions: “…if the organization among us was good, we could improve production planning, commercialization, and our well-being.”
Another central variable perceived by the managers and peasants was that of SAPs. In a focus group session, one of the peasants said: “…the best way to express love to the Pachamama is by using organic fertilizer.” In this sense, peasants perceived that sustainable practices promote conservation of natural resources and guarantee food supply [70,71,72]. Capacity strengthening affected the SAPs positively in both groups, whereas the household welfare had a negative effect only in peasants group (see the adjacency matrix in Appendix C and Appendix D).
Regarding capacity strengthening, the results show that it was another central variable among both study groups. A peasant indicated that “we thank the training of the project in how to sow, how to make organic fertilizers; however, it is crucial to know the nutritional and medicinal properties of the products and how to be promoted.” This suggests that, although a learning process through educational training was crucial in the program, peasants perceived it as a recurring theme. On the other hand, household welfare was identified among the most central variables in the peasants’ cognitive map. According to map analysis, the local peasants linked welfare with income, animal feed, and mainly emotional stability. A woman peasant said that “there are harmful things which undermine self-esteem, and we cannot work. However, with this program, I became more empowered in my household, and then with the partners of my local community.” As evidenced by the farmers’ perceptions that welfare is an essential factor for active participation in the program, activities in the program could generate empowerment of the participants [73].
Also, within the program managers’ map, commercialization was another central variable. Nevertheless, in the peasants’ map, this variable was not presented within the eight most central variables. One explanation for this could be that the agroecological fairs still presented a gap between the costs of production and sales [74], causing farmers’ dissatisfaction with the net profit perceived. On the other hand, the surplus of production could be another explanation, because farmers mentioned that their current production was not enough to be sold at fairs, contrary to the report of Heifer [75]. In this sense, although some authors pointed out that sustainable agriculture guarantees food supply [70,76], it is not clear to what extent these systems would provide enough food for the population. Moreover, does the price of products guarantee the long-term sustainability of the agricultural system?
On the other hand, peasants paid attention, during the program intervention, to agricultural production and the issues affecting their daily living. Once again, this result shows that the problem in the agriculture sector includes the whole productive chain. In this sense, what is understood as a problem in the agricultural sector by the studied groups? Both study groups agreed that lack of agricultural planning remains a problem, whereas associativity is perceived as part of the solution. As Polan suggests [77], the critical point is organization and rural education. Issues such as access to credit, lack of technification, and irrigation access are perceived as important barriers by farmers, and these issues would be resolved if the organization was strengthened. In this sense, NGOs should continue actions to strengthen associativity, and coordinate work with stakeholders in the local territories.
As expected, ecosystem conservation was also distinguished as a central variable in the managers’ cognitive map, although they mentioned that gender played an essential role in conservation. A project manager said that “the women work in the topics of production landscape, whereas the men work in ecosystem conservation.” This finding is in line with Ahmed [78], who mentioned that the woman is responsible in terms of natural resource management. For this reason, it is advisable that the program continues focusing on access to knowledge and on improving women’s skills to enhance local community development [79]. On the other hand, despite that the ecosystem conservation variable does not appear in the group of most central variables for peasants, farmers have strong concerns related to conservation of the environment. Indeed, a peasant said that “Our soils need feed and care. We have cared for the Pachamama since many years ago.” In this strand, farmers have prioritized agricultural production within the conservation process of natural resources, where their agricultural practices have roots in their culture and traditions. The vast local knowledge about the nature and ecological characteristics of the region that they inhabit [3,4,5] has allowed them to face extreme events [66] and to demonstrate care and respect for the “Pachamama.”
Comparison Assessment of the Program Intervention Using HCA
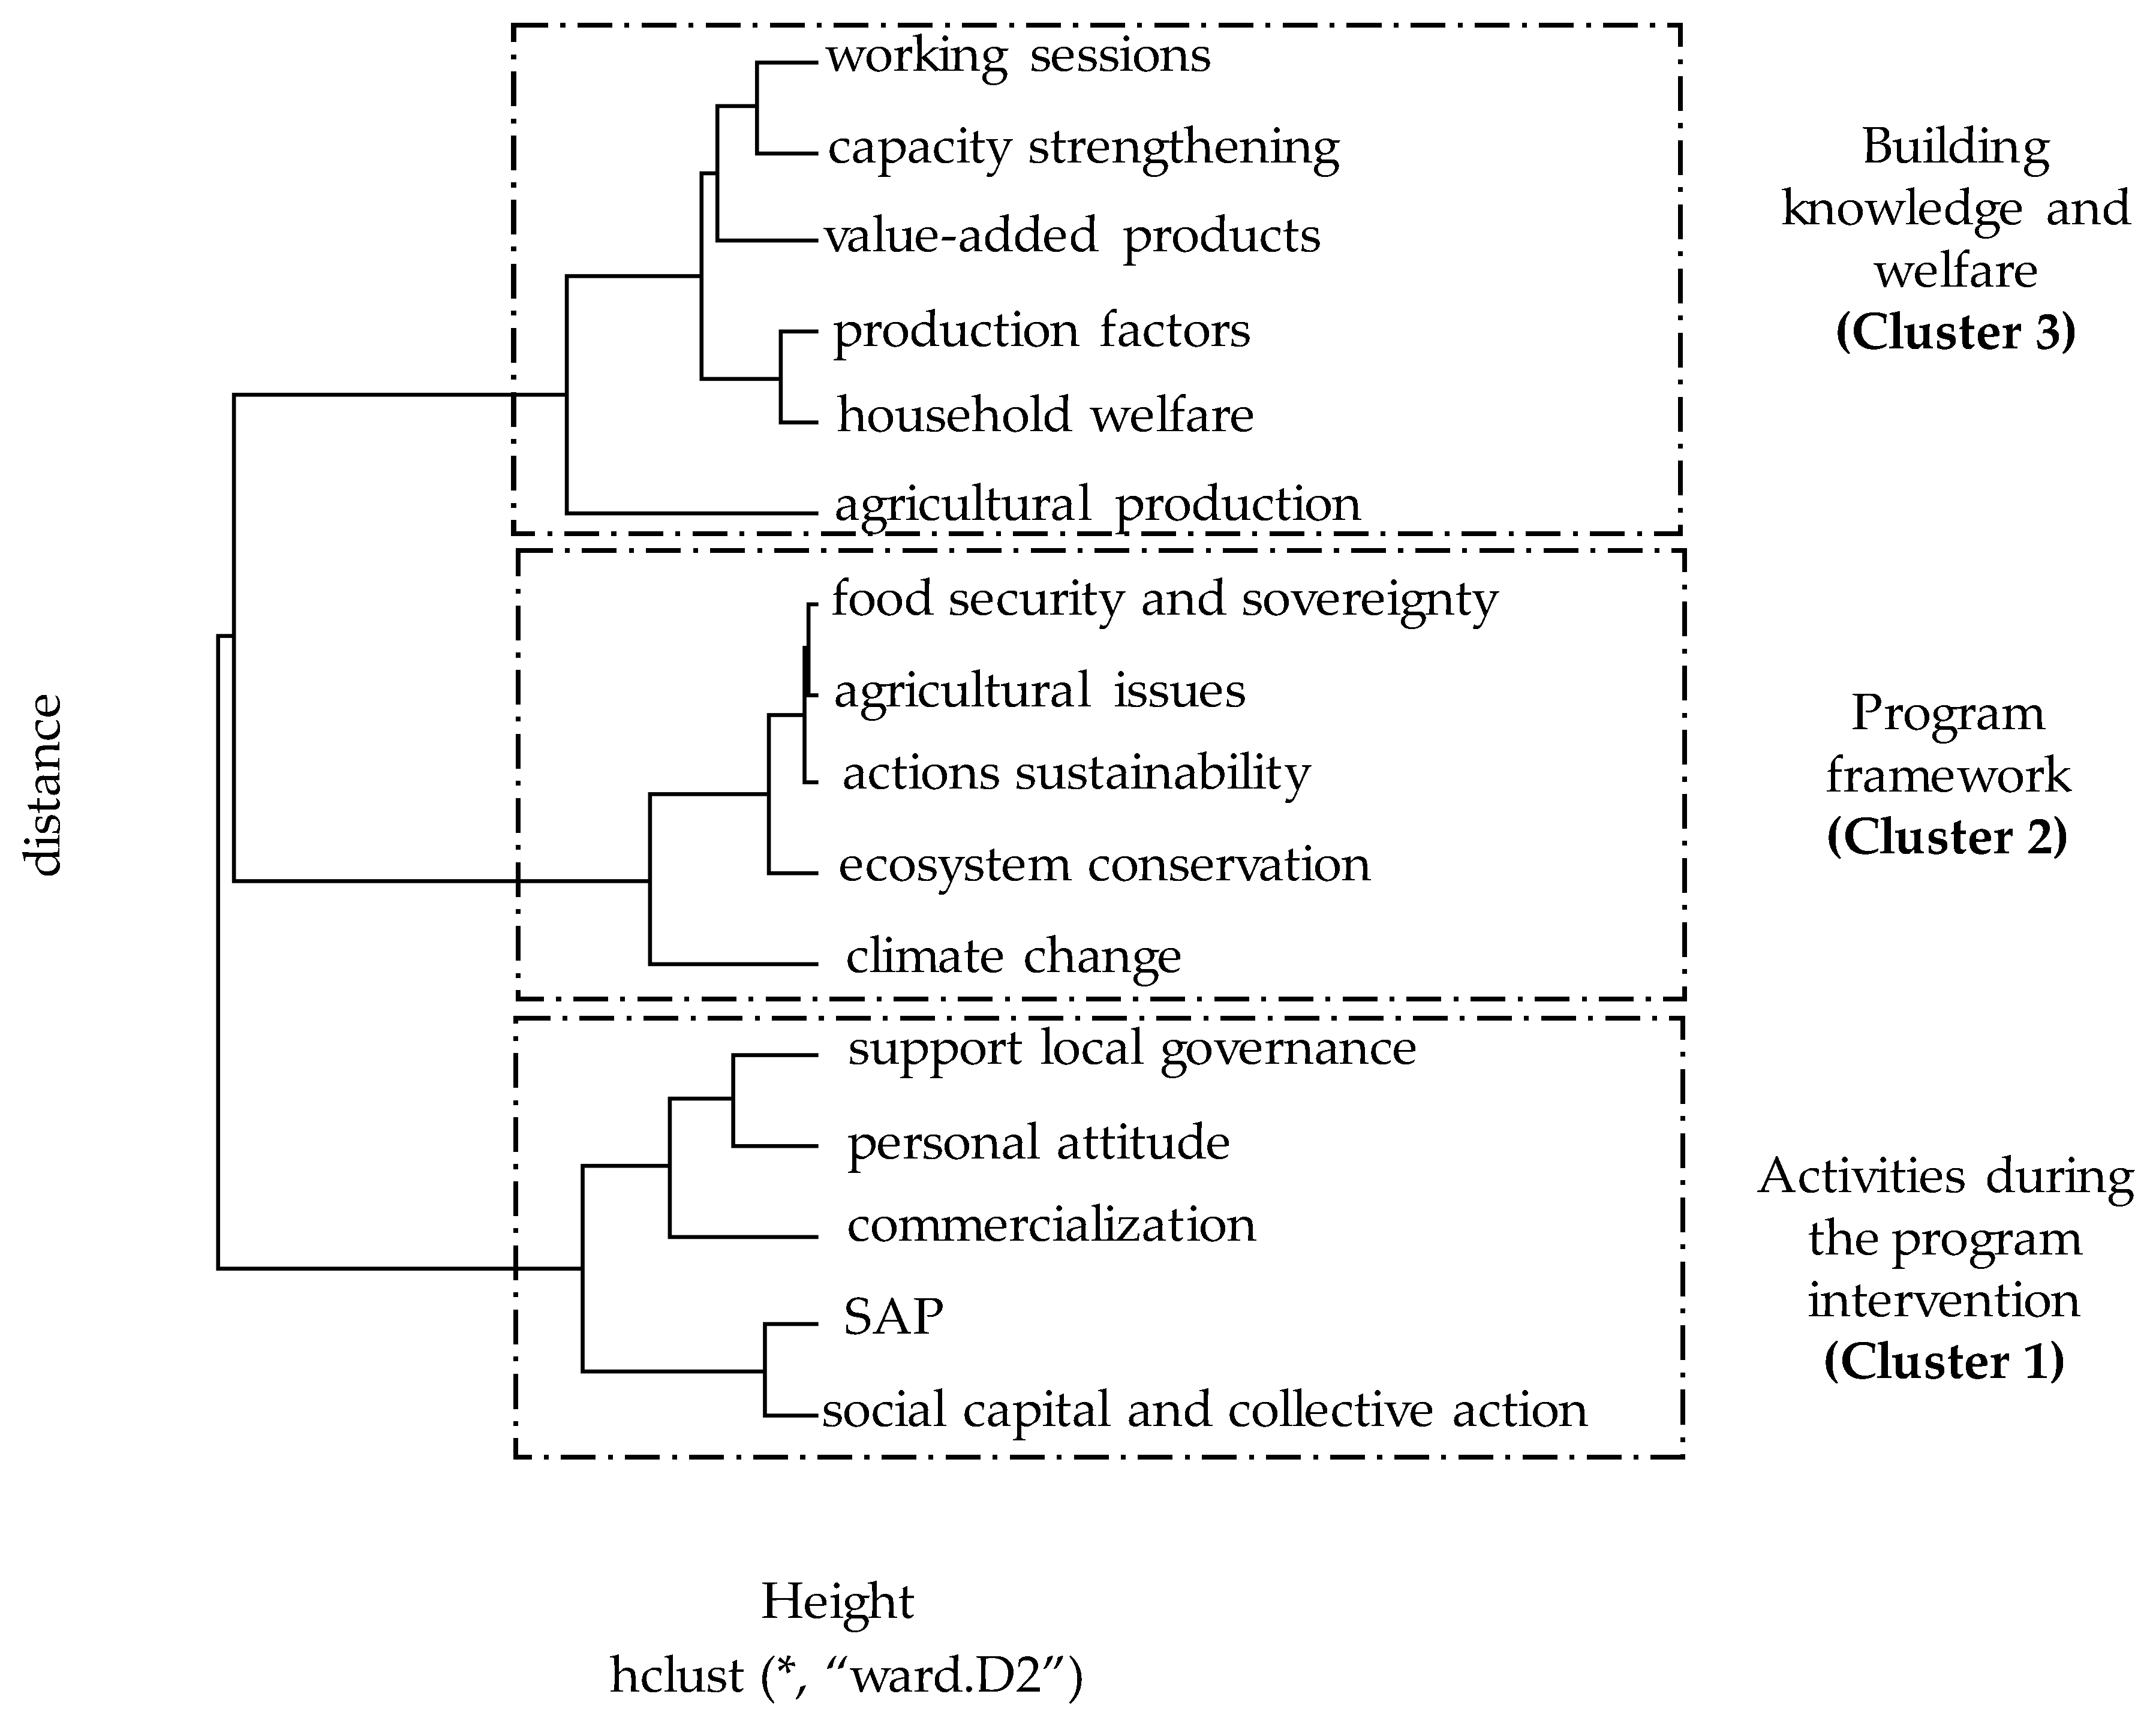
The HCA results are shown in the dendogram in Figure 6. Three clusters were obtained. Cluster 1 was denominated “activities during the program intervention,” considering the core activities explained in the program reports. Cluster 2, “program framework,” containing the objectives pursued by the program. Finally, Cluster 3, “building knowledge and welfare,” characterized by social strategies during the program intervention.
Highly significant differences were found between clusters for the dc variable (p-value was 5.53e-05). This could mean that there is no agreement between project managers and local peasants as to the level of importance of the dimensions identified. On the other hand, our findings reveal no significant differences among both groups on the ds variable due to the dimensions identified being similar. Looking at Figure 7, the findings confirm that program managers believed that Cluster 1 followed by Cluster 2 were the most important dimensions in the “Biocorridors for Living Well” program, whereas local peasants perceived Cluster 3 as a central dimension (representing 60% of the central variables in the peasant FCM).
In the case of the ds variable, a positive sign illustrates an effect variable (driver), whereas a negative sign represents a receiver variable. In this sense, it is possible to show that peasants and program managers understood that the program was focused on enhancing adaptation to climate change, supporting ecosystem conservation and production factors, and trying to overcome agricultural barriers, safeguard the food security and sovereignty, guarantee the long-term sustainability of actions, and improve the livelihood of the local people. Worldwide, local governments and NGOs are working to respond to the existing emergency of food security and poverty challenge through these types of programs [19].
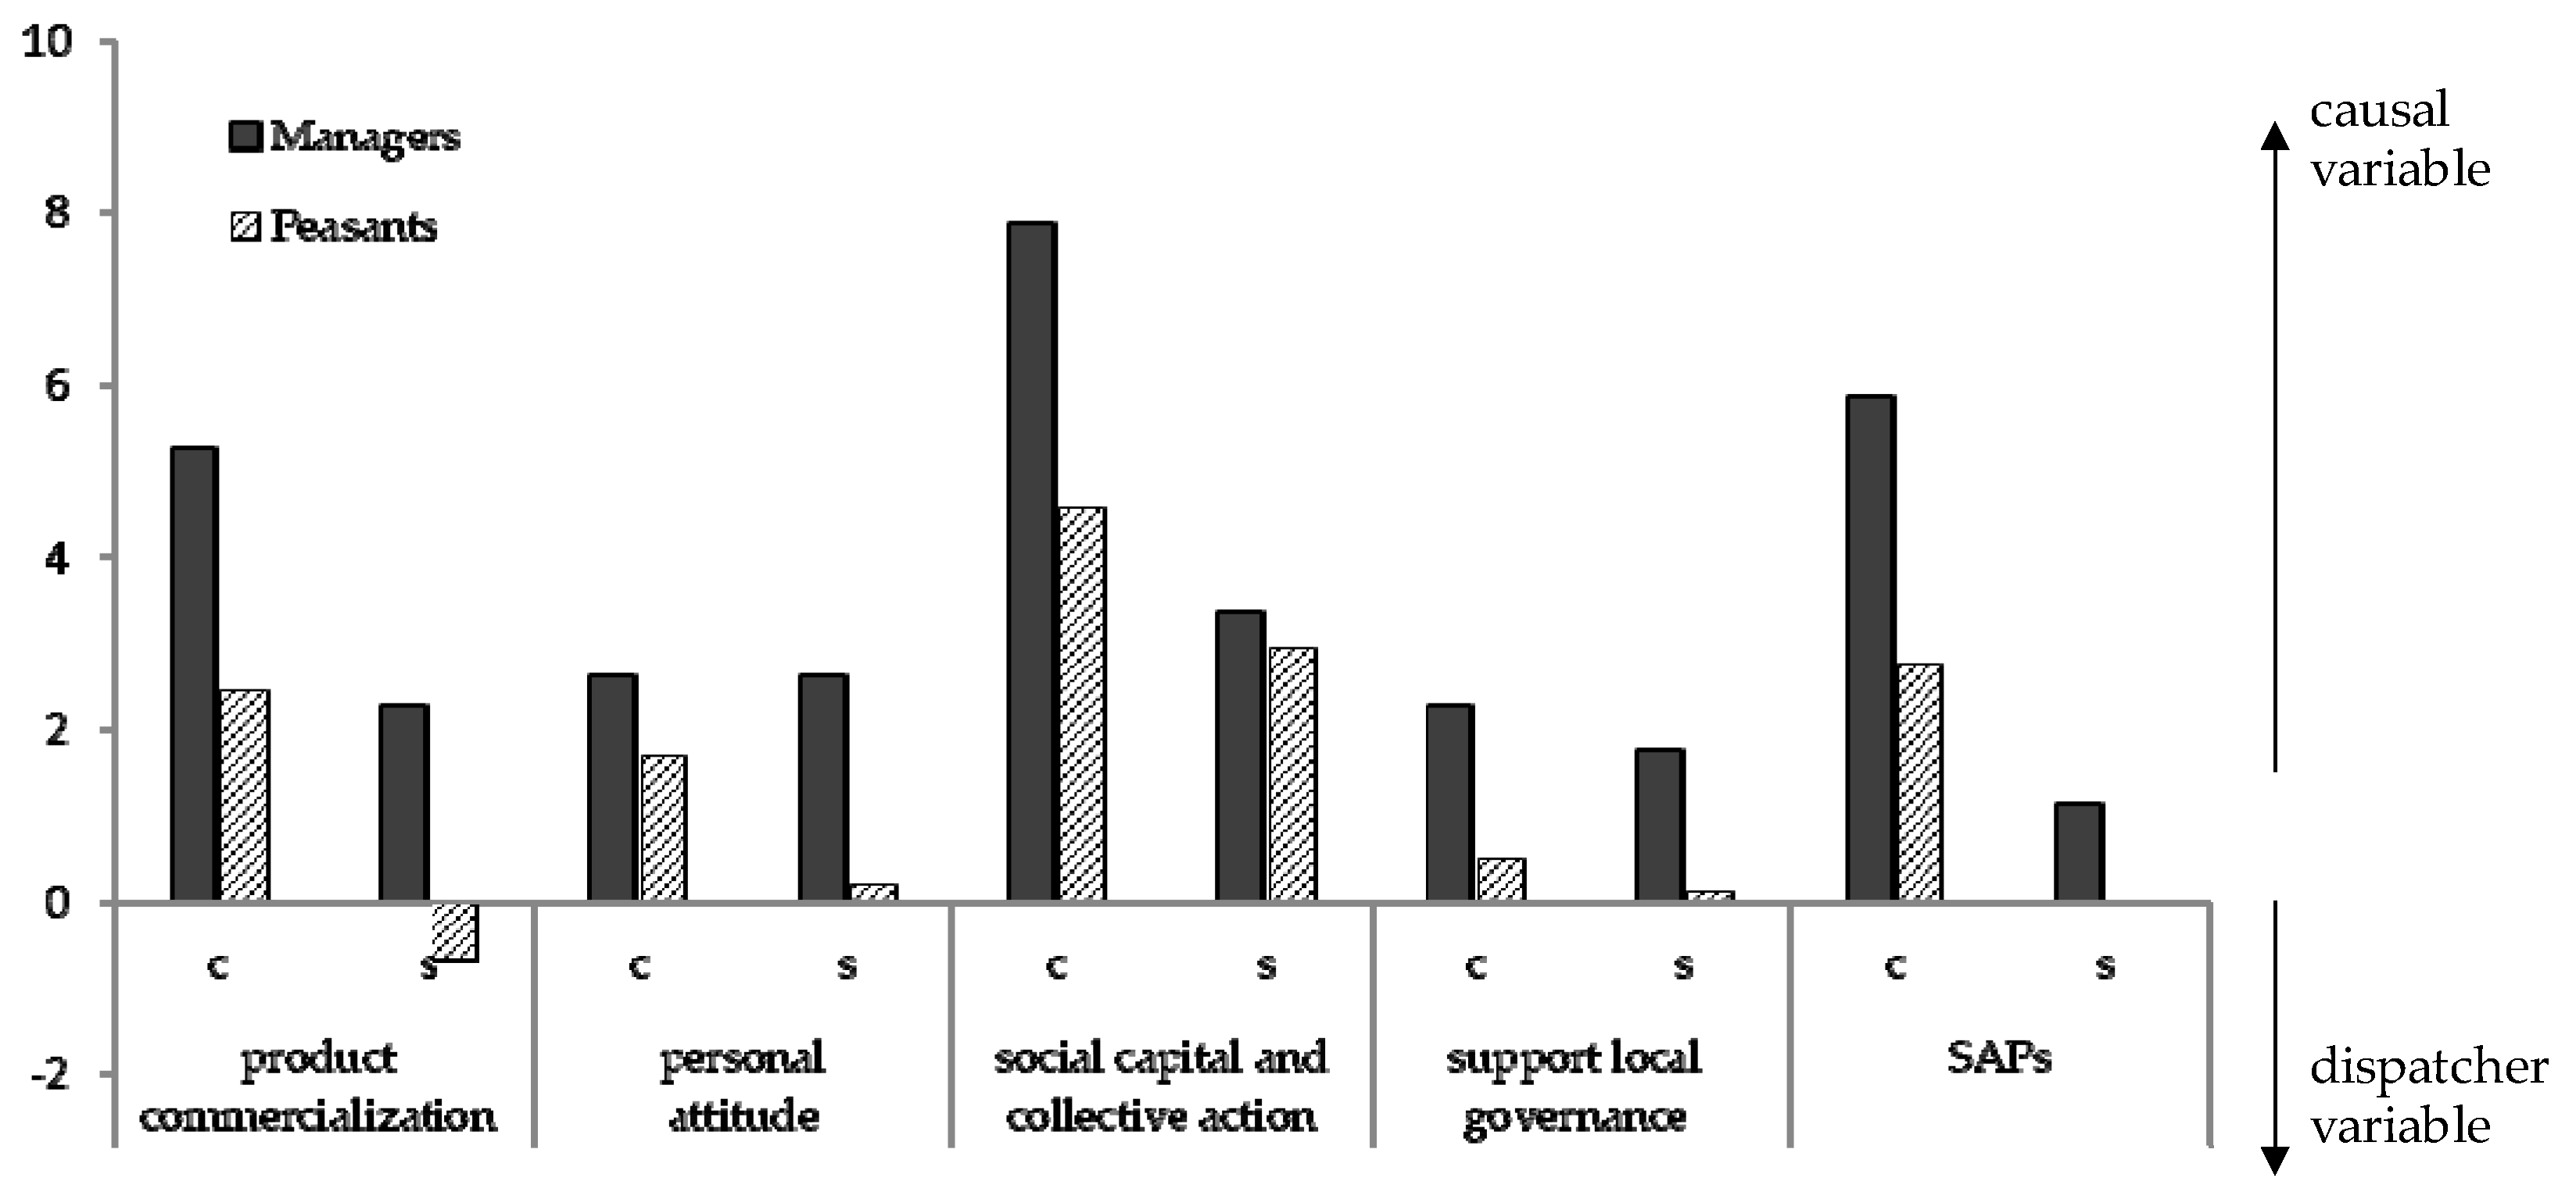
The profile of Cluster 1 (Figure 8) indicates a close agreement between managers and peasants on the "personal attitude" variable regarding the level of importance. Also, both groups considered personal attitude as a causal variable, that is, one that influences participation in the program [80]. Although peasants emphasized the importance of this variable during the focus group sessions, the results show a low score impact of this variable in the whole system. These findings indicate that not all of the participants felt motivated during the development of the activities. On the other hand, as described earlier in Section 2.2.2, both groups considered the “social capital and collective action” variable an important causal force for enhancing the biological biodiversity on farms in the program [67,81].
Our results are also in accordance with the FAO [8], which suggests that agroecology helps to sustain a wide range of production, socio-economic, nutritional, and environmental benefits. Looking at the emphasis on the “SAPs” variable by project managers and peasants shows that the program pays attention to these production systems. Nevertheless, despite the importance given to this variable, there has been no positive effect on peasants’ attitudes, that is, these practices do not seem to have any implications for the involvement of farmers in this program. However, there has been increasing interest from national and international institutions towards bringing technical assistance to sustainable farming practices.
Both groups agreed that commercialization of baskets of agricultural products and agroecological fairs are key variables in the success of the “Biocorridors for Living Well” program. This result is in line with Wollni et al. [21], who see commercialization as an incentive for adopting conservation practices. This suggests that program managers could take strategies for this activity to ensure the long-term sustainability of the program. On the other hand, local peasants saw commercialization as part of the effect group of variables. This finding is based on the fact that local peasants perceived their participation in the fairs as due to their adoption of agroecological systems on their plots.
Regarding the support of the local government during program intervention, the results show that local peasants and managers did not perceive a significant presence of local public institutions. National and local governments must focus on adopting policies that incorporate sustainable development, and mainly invest in human capital. As mentioned by Romero et al. [19], public investment has to leave aside neoliberal dogma, and instead focus on human and social capital to secure long-term sustainable development. However, according to Lalander [82], if economic interests in Ecuador are still prevailing, natural resource management programs will not receive proper attention.
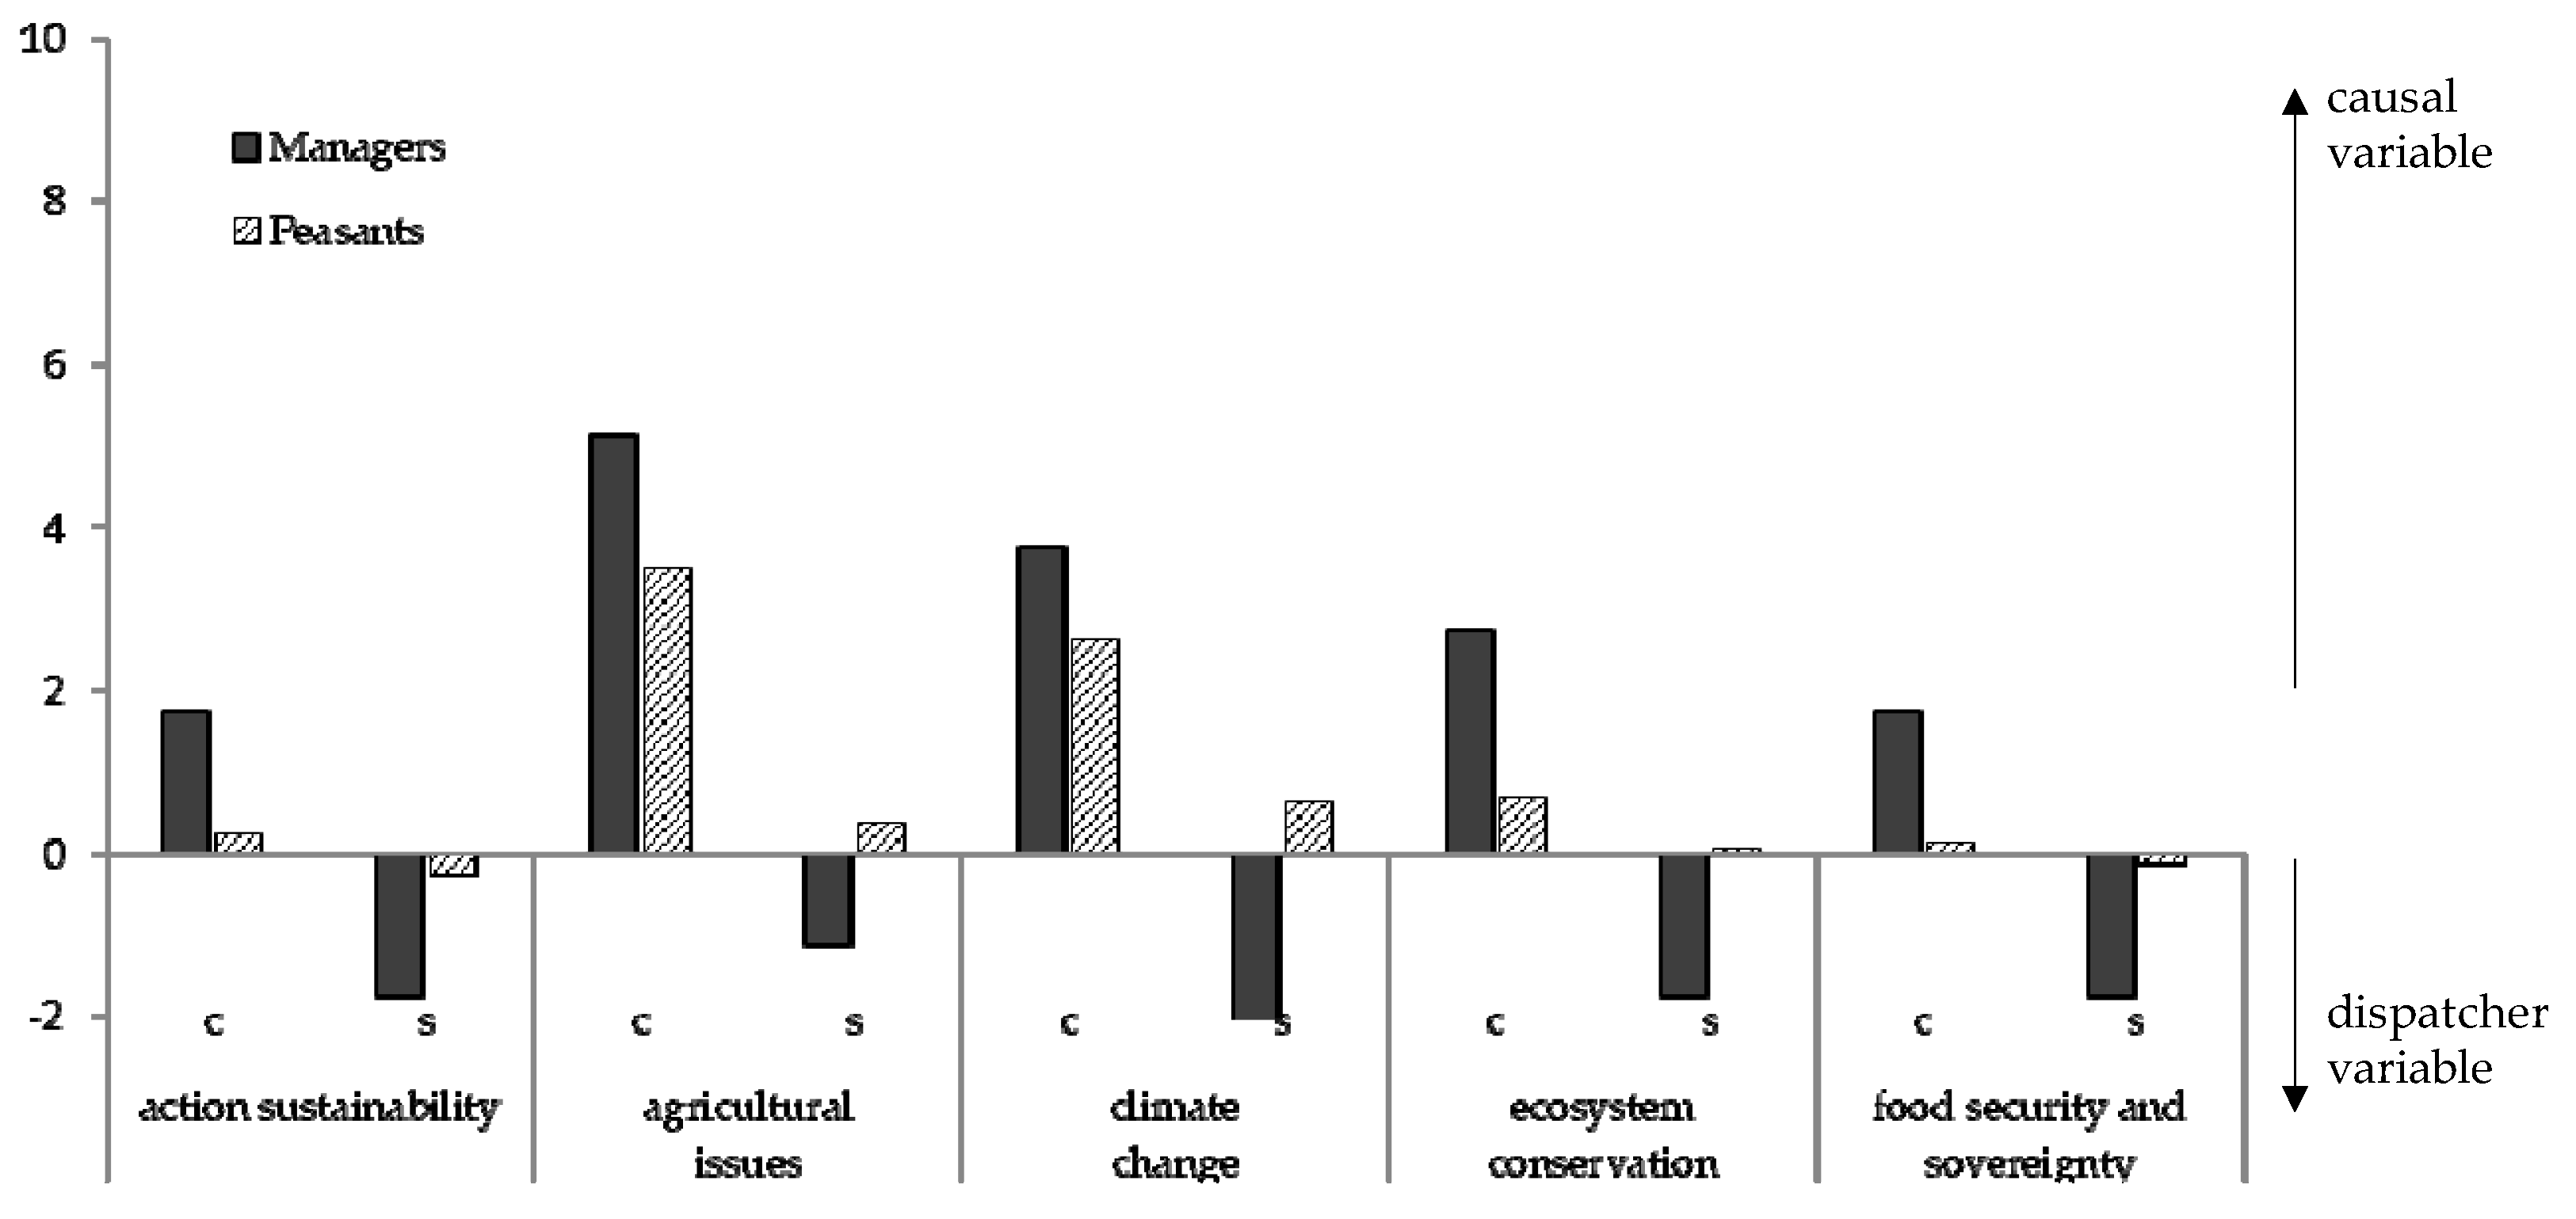
In the case of Cluster 2, as seen in Figure 9, denominated as “program framework,” its main features focus on the concerns of agricultural issues. Managers perceived that the program was focused on not only on ecosystem conservation, but also on integrating solutions for resolving issues of the agricultural sector. In fact, it is not new that the tightening of the link between livelihoods and ecosystem conservation seeks to generate social impacts on local people [17]. However, it is necessary to remember that conservation and poverty alleviation pursue different objectives, although there could be an overlap in the practice from a sustainable approach [83].
On the other hand, both groups also placed the most importance on the “climate change” and “ecosystem conservation” variables. According to the behavior of the s variable, and as expected, these variables were perceived as response variables by project managers. The program had among its main objectives the restoration of ecosystems and the reduction of vulnerability of farmers’ households. On the other hand, the smallholder farmers recognized both variables as driver variables, that is, they were aware of the program objectives. Although farmers gave low scores to these variables, they gave great relevance to environmental conservation and climate change. As mentioned in the FCM section discussion, these variables are perceived by them as social and environmental changes in their territories, where, for a long time, their experience and practice has allowed them to face extreme climatic events [81].
The results also show “actions sustainability” and “food security and sovereignty” within the program framework. Project managers paid attention to these variables. In fact, the “Biocorridors for Living Well” program is aligned with the vision of Ley Orgánica del Régimen de la Soberanía Alimentaria (LORSA in Spanish) [84] and Sumak-Kawasay [42], where attention is focused on the establishment of agrifood public policies to link production, conservation, and livelihood. In this case, the program has totally routed its objectives to the preservation of local products [36]. However, according to the local peasants’ perceptions, further work is still be needed for safeguarding food sovereignty. On the other hand, managers should question what would happen after the program intervention. They should pay attention to program sustainability, which should be considered as another assessment factor of the program’s success. According to the results, both groups believed that the actions developed during the program intervention had direct implications on the likelihood of supporting the actions over time. However, peasants’ perceptions revealed that further efforts are necessary and include new strategies to incentivize SAP adoption by farmers.
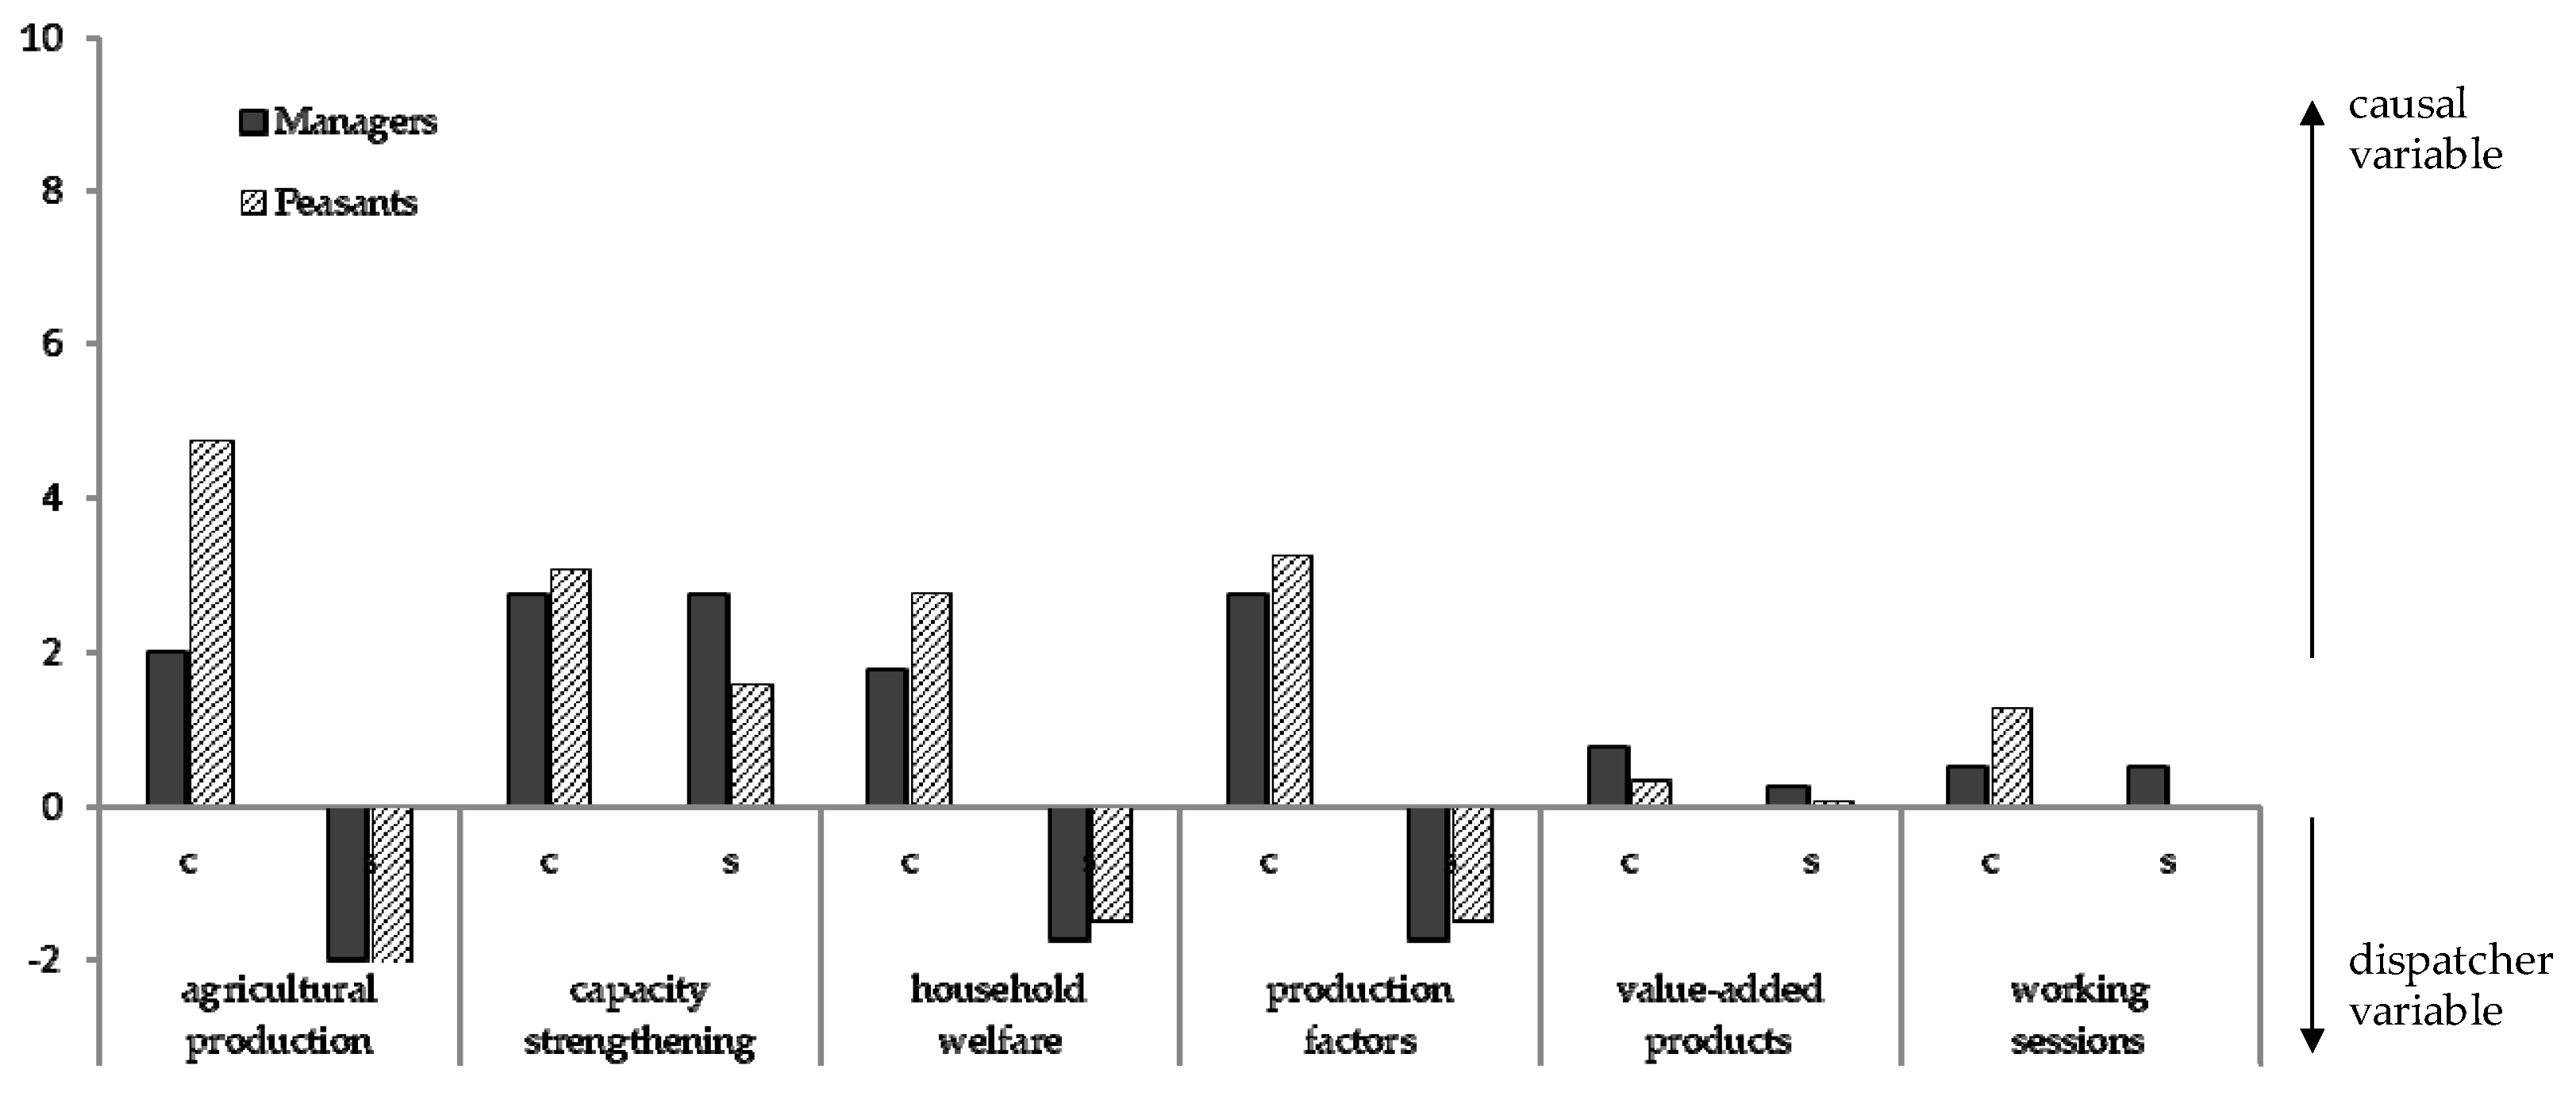
Finally, the main features of Cluster 3 in Figure 10, which was denominated as “building knowledge and welfare,” obtained the highest score by peasants. Figure 7 clearly shows the importance given by peasants to the “agricultural production” and “production factors” variables within the program, where they highlighted care for the “Pachamama,” whereas managers did not mention this variable during the focus group. In fact, these results were expected, due to the close link between these variables and farmers’ livelihoods. However, managers’ perceptions revealed that the program seeks integrative solutions in the agricultural sector, as mentioned above. In addition, both groups characterized these concepts as response variables. Project managers and peasants also placed great importance on the “capacity strengthening” variable and considered it a driver. Here, education and technical assistance played a crucial role in the program, mainly in sustaining conservation actions in the long term [17,85]. However, as discussed in Section 2.2.2, it is necessary to diversify the topics with technical assistance, and consider topics on nutritional quality, marketing strategies, and so on. On the other hand, within the program implementation strategies, we found that the “household welfare” variable had a high centrality score from both groups, particularly farmers. Also, the behavior of the s variable showed that household welfare was an effect variable, which relates to the well-being of the smallholder farmers with the sustainable environment [86].
Regarding the “value-added products” and “training sessions" variables, both groups showed that the program might not have had a significant impact. However, there was an importance grade given by managers and peasants. A plausible explanation is that the value added was an innovation introduced in the Sixth Operational Phase of the program, and there is still work to be done. On the other hand, “mingas” (indigenous tradition of informal collective actions) have allowed the generation of spaces for discussion among stakeholders in the local territories [87]. The results show that peasants perceived that these meetings helped to comply with the activities in the program. Voluntary engagement and social media were also perceived as important in the program implementation.
4. Conclusions
The research findings illustrate the level of complexity in the implementation of environmental management programs, where there is a need to strike a balance between strategies aimed at ecosystem conservation and those aimed at improving livelihoods of communities. The essential aim of this paper was to provide evidence of the SAP adoption response strategies of farmers within the “Biocorridors for Living Well” program and, thus, improve future programs of sustainable agriculture. In order to achieve this objective, we analyzed farmers’ and program managers’ perceptions through focus group sessions, information from which allowed us to propose a concrete approach to the identification of possible strategies to strengthen the link between ecosystem conservation and well-being. The study results revealed that both program managers and peasants perceived capacity building as an approach to enhancing sustainable development in the communities. Nevertheless, it will be necessary to consider aspects like nutritional factors and marketing of agricultural products to establish a holistic educational training approach in the communities. The farmers perceived this to be an incentive that would enable them to actively engage in conservation efforts and, hence, a strategy for improving their livelihood. The study also revealed that farmers recognized the program and trust as key elements to improving the processes of production planning, commercialization, and therefore well-being in the community. Based on the analytical findings of the study, there is clear agreement between managers and peasants on the importance of ecosystem conservation for rural development. It is vital to recognize that the contribution by smallholders to the planet is relevant due to the respect paid to the Pachamama; however, most of the time, it is not valued, as reflected in the results.
On the other hand, the HCA analysis demonstrated the importance given by program managers to the SAPs, where agroecology has become a way to link social and environmental aspects in the local territories. Although agroecology systems could be considered as a robust strategy to integrate agricultural production within ecosystem conservation, this study revealed that the conservation activities involve broader conditions such as awareness level, climate variability, and household welfare [71]. In this context, a question should be posed to the national and international institution of whether to continue to be “business-as-usual”, to continue with duplication of the same program activities, or to devise strategies tailored to the context of the community and to embrace farmers’ perceptions.
The methodology presented an in-depth perception of the current knowledge on ecosystem conservation possessed by local peasants in a face-to-face exchange of information with project managers. It is important to mention that the goal of this study was not to carry out a comparison of the program’s report assessment methodology. Furthermore, the FCM approach as a tool of analysis provided a linkage and an understanding of the complex system of this evaluated environmental management program. Although the results do not show future scenarios, the study describes possible strategies, where the final decision in the next stages of the program is in the hands of the program managers. Nevertheless, it will be necessary to pursue studies about the scope of environmental awareness, and the role of social capital in the adoption of SAPs. Indeed, the combination of FCMs and HCA as semi-quantitative techniques enabled us to understand the dimensions of the program intervention. Local institutions, central governments, and NGOs could adopt the proposed approach during the inception of the integral assessment of ecosystem conservation programs.
Author Contributions
Conception of the paper, all authors; data acquisition, M.S. and E.I.; data analysis and writing of original draft, M.S.; data analysis, and methodological framework, I.E.; supervision, writing—review and editing, and funding acquisition, M.S. and E.I. All authors have read and agree to the published version of the manuscript.
Funding
This research was funded by the National Geographic Society Early Career Grant, #HJ-076ER-17.
Acknowledgments
The authors sincerely thank the National Geographic Society for funding this study as part of the research project, “Social capital in the conservation of biodiversity, climate change and poverty reduction in the rural zones: Case study of Cayambe Coca, Pisque Mojanda San Pablo and Cotacachi Cayapas Biocorridors in Ecuador.” Furthermore, the authors are grateful to Ecopar for the information it provided, and Escuela Politécnica Nacional for support in field work and multimedia equipment. Finally, thanks to David Singaña for supporting the workshop moderators.
Conflicts of Interest
The authors declare no conflicts of interest.
Appendix A

Table A1.
The overview of categories, as taken from the variable aggregation list from peasants.
| Variable | Qualitative aggregation | Sign 1 |
|---|---|---|
| knowledge transfer | exchange of knowledge | + |
| local laws and regulations | local laws and regulations establishment | + |
| laws of community leaders | + | |
| savings bank | banks | + |
| ONGs support | ONGs | + |
| value-added products | added value | + |
| process products | + | |
| ecosystem conservation | nature | + |
| work for nature | + | |
| action sustainability | native crop maintenance for many years | + |
| food security and sovereignty | food security and sovereignty | + |
| social media | use of WhatsApp | + |
| + | ||
| support local government | credit | + |
| low interest rate | + | |
| appropriate grace period | + | |
| working meetings | meetings | + |
| assemblies | + | |
| personal attitude | awareness to take care of the land | + |
| personal interest | + | |
| research | research by academy | + |
| involvement of students | + | |
| agricultural production | agriculture | + |
| livestock | + | |
| Small-scale agricultural production | + | |
| production | + | |
| family farming | + | |
| creation of source of employment | employment | + |
| source of employment | + | |
| work with people | + | |
| unemployment | – | |
| production factors | water | + |
| appropriate technology | + | |
| water needs | + | |
| need of water | + | |
| irrigation access | + | |
| land access | + | |
| Pachamama | + | |
| soil fertility | + | |
| demand of labor hand | + | |
| fertilizer and agricultural chemical | + | |
| transporting of agricultural products | + | |
| machinery | + | |
| commercial seeds | – | |
| irrigation access | + | |
| pogllos use | + | |
| lack of water sources | – | |
| loss of water sources | – | |
| soil | + | |
| bioles production | + | |
| cost of tools | – | |
| commercialization | agroecological fairs | + |
| prices of agroecological products | + | |
| prices of organic products | + | |
| prices of agricultural products | + | |
| challenging process in the market | – | |
| household welfare | household income | + |
| welfare | + | |
| broken houses | – | |
| cooking and animal feeding | + | |
| indebtedness | – | |
| social capital and collective action | participation | + |
| family involvement | + | |
| lack of interest in collaboration | – | |
| willingness to participate | + | |
| self-call | + | |
| lack of team work | – | |
| divide the machinery among neighbors | + | |
| organization and team work | + | |
| interaction between partners | + | |
| organization | + | |
| collective initiatives | + | |
| trust | + | |
| weak linkage of universities | – | |
| lack of organization | – | |
| neighborhood support | + | |
| exclusive organization | + | |
| team work | + | |
| inside the fair organization is necessary | + | |
| water district | + | |
| collaboration | + | |
| agricultural organizations | + | |
| community leaders | + | |
| mingas | + | |
| climate change | precipitation | – |
| drought | + | |
| rain | – | |
| climate | + | |
| summer season | + | |
| climate variation | + | |
| adverse weather conditions | + | |
| act of good | – | |
| climate change | + | |
| effects of greenhouse gases | + | |
| pollution in the environment | + | |
| pollution | + | |
| no rainfall | + | |
| climate variability | + | |
| upper reaches | + | |
| strong wind | + | |
| weather | + | |
| effects of the climate | + | |
| rain | – | |
| freeze | + | |
| process management issues | monitoring and following of the projects | – |
| lack of financial resources | + | |
| political issues | + | |
| malfunction of water reservoirs | + | |
| elevated costs | + | |
| process management strategies | – | |
| issues with local government | + | |
| sustainable agricultural practices (SAPs) | vegetable production | + |
| local seed preserve | + | |
| organic matter | + | |
| local crop sustainability | + | |
| organic fertilizer | + | |
| organic production | + | |
| organic fertilizer | + | |
| building beds for cultivation | + | |
| preservation of local seeds | + | |
| compost use | + | |
| agroforestry | + | |
| seeds | + | |
| native crops | + | |
| lack of local seeds | – | |
| manure of animals | + | |
| agroecological systems | + | |
| agricultural issues | lack of technification | + |
| building structures in rural zones | – | |
| issues with tractor use | + | |
| issues with agricultural hand tools | + | |
| issues with motorized plough use | + | |
| lack of technology | + | |
| lack of reservoirs | + | |
| eucalyptus owners | + | |
| credit access | – | |
| lack of production planning | + | |
| migration | ||
| delay in crops | + | |
| big landowners’ interests | + | |
| lack of environmental management projects | + | |
| lack of irrigation access | + | |
| lack of greenhouses | + | |
| eucalyptuses | + | |
| lack of appropriate technology | + | |
| florist | + | |
| capacity strengthening | training in water use | + |
| water use | + | |
| education | + | |
| water collection | + | |
| capacity strengthening | + | |
| lack of knowledge of the composition and properties of products | – | |
| lack of knowledge of local finances | + | |
| lack of knowledge of promotion and publicity measures | + | |
| storage and utilization of rainwater | – | |
| trainings | – |
1 “+” indicates a positive relationship with the concept aggregated, whereas “–“ indicates otherwise.
Appendix B
Table A2.
The overview of categories, as taken from the variable aggregation list from program managers.
Table A2.
The overview of categories, as taken from the variable aggregation list from program managers.
| Variable | Qualitative aggregation | Sign 1 |
|---|---|---|
| support local government | organization of walks and bicycle routes | + |
| water resource laws | + | |
| capacity strengthening | technical assistance | + |
| capacity strengthening | + | |
| personal attitude | personal interest | + |
| conventional production | conventional production | + |
| indigenous knowledge | indigenous knowledge | + |
| working sessions | working sessions | + |
| concentration of information | concentration of information | + |
| consumer awareness | consumer awareness | + |
| value-added products | value-added products | + |
| social capital and collective action | organization | + |
| team work | + | |
| work at community level | + | |
| commercialization of agricultural products | agroecological fairs | + |
| baskets of agricultural products | + | |
| sustainable agricultural practices (SAPs) | agroforestry | + |
| tubers | + | |
| changes in land use | + | |
| organic production | + | |
| local seeds | + | |
| ecosystem conservation | conservation | + |
| activities of environmental management | + | |
| production factors | irrigation access in vulnerable communities | + |
| land | + | |
| agricultural production | production | + |
| small scale agricultural production | + | |
| household welfare | decrease in household income | – |
| drinking water accesss | + | |
| self consumption | + | |
| actions sustainability | actions in the long term | + |
| food security and sovereignty | food security and sovereignty | + |
| agricultural issues | big landowners’ interest | + |
| flower market participation | + | |
| lack of production planning | + | |
| lack of environmental management projects | + | |
| climate change | frost | + |
| variation of weather conditions | + |
1 “+” indicates a positive relationship with the concept aggregated, whereas “–“ indicates otherwise.
Appendix C
The final adjacency matrix of the local peasants obtained by focus groups using text analysis.

Appendix D
The final adjacency matrix of the program managers obtained by focus groups using text analysis.

References
- Tscharntke, T.; Clough, Y.; Wanger, T.C.; Jackson, L.; Motzke, I.; Perfecto, I.; Vandermeer, J.; Whitbread, A. Global food security, biodiversity conservation and the future of agricultural intensification. Biol. Conserv. 2012, 151, 53–59. [Google Scholar] [CrossRef]
- Becker, C.D.; Ghimire, K. Synergy Between Traditional Ecological Knowledge and Conservation Science Supports Forest Preservation in Ecuador. Conserv. Ecol. 2003, 8. [Google Scholar] [CrossRef]
- Gadgil, M.; Berkes, F.; Folke, C. Indigenous knowledge for biodiversity conservation. AMBIO 1993, 22, 151–156. [Google Scholar]
- Pohle, P.; Gerique, A. Traditional ecological knowledge and biodiversity management in the Andes of southern Ecuador. Geogr. Helv. 2006, 61, 275–285. [Google Scholar] [CrossRef]
- Walshe, R.; Argumedo, A. Ayni, Ayllu, Yanantin and Chanincha: The cultural values enabling adaptation to climate change in communities of the potato park, in the Peruvian Andes. GAIA Ecol. Perspect. Sci. Soc. 2016, 25, 166–173. [Google Scholar] [CrossRef]
- Durán López, M. Sumak Kawsay o Buen Vivir, desde la cosmovisión andina hacia la ética de la sustentabilidad. Pensam. Actual 2010, 10, 51–61. [Google Scholar]
- Hentschel, J.; Waters, W.F. Rural poverty in Ecuador: Assessing local realities for the development of anti-poverty programs. World Dev. 2002, 30, 33–47. [Google Scholar] [CrossRef]
- FAO. The 10 Elements of Agroecology; Food and Agriculture Organization of the United Nations: Rome, Italy, 2019. [Google Scholar]
- Altíeri, M.A.; Yurjevic, A. La Agroecologia Y El Desarrollo Rural Sostenible En America Latina. Agroecol. Y Desarrolo 1991, 1, 25–36. [Google Scholar]
- Aznar-Sánchez, J.A.; Piquer-Rodríguez, M.; Velasco-Muñoz, J.F.; Manzano-Agugliaro, F. Worldwide research trends on sustainable land use in agriculture. Land Use Policy 2019, 87. [Google Scholar] [CrossRef]
- ECLAC. The 2030 Agenda and the Sustainable Development Goals: An Opportunity for Latin America and the Caribbean; ECLAC: Santiago, Spain, 2016. [Google Scholar]
- Gibson, J.; Zeiders, E.; Hall, L.; Martin, J.; Sowell, A.; Célleri, M.; Monar, C.; Escudero, L.; Barrera, V.; Alwang, J.; et al. Investigation of the Promotion and Adoption of Sustainable Natural Resource Management Agricultural Practices in the Chimbo Watershed of Ecuador; Unpublished Research Report; Virginia Tech: Blacksburg, VA, USA, 2009; pp. 6–16. [Google Scholar]
- Mauceri, M.; Alwang, J.; Norton, G.; Barrera, V. Effectiveness of integrated pest management dissemination techniques: A case study of potato farmers in Carchi, Ecuador. J. Agric. Appl. Econ. 2007, 39, 765–780. [Google Scholar] [CrossRef]
- Raes, L.; Speelman, S.; Aguirre, N. Farmers’ Preferences for PES Contracts to Adopt Silvopastoral Systems in Southern Ecuador, Revealed Through a Choice Experiment. Environ. Manag. 2017, 60, 200–215. [Google Scholar] [CrossRef] [PubMed]
- Rice, R.; Bruner, A.; Hardner, J. Conservation Incentive Agreements: An Approach to Linking Conservation and Economic Development on Indigenous Lands in Ecuador. In Proceedings of the International Conference on Rural Livelihoods, Forests and Biodiversity, Bonn, Germany, 19–23 May 2003. [Google Scholar]
- Altieri, M.A. Agroecology: The science of natural resource management for poor farmers in marginal environments. Agric. Ecosyst. Environ. 2002, 93, 1–24. [Google Scholar] [CrossRef]
- Keese, J.R. International NGOs and sustainable agricultural development: A methodological analysis with examples from highland Ecuador. Ecuad. Stud./Estud. Ecuat. 2001, 7–13. [Google Scholar]
- Meyer, C.A. Environmental NGOs in Ecuador: An economic analysis of institutional change. J. Dev. Areas 1993, 27, 191–210. [Google Scholar] [PubMed]
- Romero, C.; Athayde, S.; Collomb, J.-G.; DiGiano, M.; Schmink, M.; Schramski, S.; Seales, L. Conservation and development in Latin America and Southern Africa: Setting the stage. Ecol. Soc. 2012, 17, 1–13. [Google Scholar] [CrossRef] [Green Version]
- Kleijn, D.; Bommarco, R.; Fijen, T.P.; A Garibaldi, L.; Potts, S.G.; Van Der Putten, W.H. Ecological Intensification: Bridging the Gap between Science and Practice. Trends Ecol. Evol. 2019, 34, 154–166. [Google Scholar] [CrossRef] [Green Version]
- Wollni, M.; Lee, D.R.; Thies, J.E. Conservation agriculture, organic marketing, and collective action in the Honduran hillsides. Agric. Econ. 2010, 41, 373–384. [Google Scholar] [CrossRef]
- Martínez, L. La agricultura familiar en el Ecuador. Serie Documentos de Trabajo 2013, 147, 1–37. [Google Scholar]
- Van Dam, A.A.; Kipkemboi, J.; Rahman, M.; Gettel, G.M. Linking hydrology, ecosystem function, and livelihood outcomes in African papyrus wetlands using a Bayesian Network model. Wetlands 2013, 33, 381–397. [Google Scholar] [CrossRef]
- Özesmi, U.; Özesmi, S. A participatory approach to ecosystem conservation: Fuzzy cognitive maps and stakeholder group analysis in Uluabat Lake, Turkey. Environ. Manag. 2003, 31, 0518–0531. [Google Scholar] [CrossRef]
- Gray, S.; Gagnon, A.; Gray, S.; O’Dwyer, B.; O’Mahony, C.; Muir, D.; Devoy, R.; Falaleeva, M.; Gault, J. Are coastal managers detecting the problem? Assessing stakeholder perception of climate vulnerability using Fuzzy Cognitive Mapping. Ocean Coast. Manag. 2014, 94, 74–89. [Google Scholar] [CrossRef]
- Halbrendt, J.; Gray, S.A.; Crow, S.; Radovich, T.; Kimura, A.H.; Tamang, B.B. Differences in farmer and expert beliefs and the perceived impacts of conservation agriculture. Glob. Environ. Chang. 2014, 28, 50–62. [Google Scholar] [CrossRef]
- Bennett, A.F. Linkages in the Landscape: The Role of Corridors and Connectivity in Wildlife Conservation; IUCN: Gland, Switzerland, 2003. [Google Scholar]
- Bennett, G.; Mulongoy, K.J. Review of Experience with Ecological Networks, Corridors and Buffer Zones; Secretariat of the Convention on Biological Diversity: Montreal, QC, Canada, 2006. [Google Scholar]
- Dirzo, R.; Raven, P.H. Global state of biodiversity and loss. Annu. Rev. Environ. Resour. 2003, 28, 137–167. [Google Scholar] [CrossRef] [Green Version]
- PPD. Nuestro Biocorredores Para El Buen Vivir; PPD: Quito, Ecuador, 2012. [Google Scholar]
- Camacho, M. Los páramos ecuatorianos: Caracterización y consideraciones para su conservación y aprovechamiento sostenible. Rev. An. 2014, 1, 77–92. [Google Scholar] [CrossRef]
- Ulloa, R. Biocorredores: Una Estrategia Para la Conservación de la Biodiversidad, el Ordenamiento Territorial y el Desarrollo Sustentable en la Zona de Planificación 1; Esmeraldas y Sucumbíos: Carchi, Ecuador, 2013. [Google Scholar]
- Kremen, C.; Miles, A. Ecosystem Services in Biologically Diversified versus Conventional Farming Systems. Ecol. Soc. 2012, 17. [Google Scholar] [CrossRef]
- Tilman, D.; Fargione, J.; Wolff, B.; D’Antonio, C.; Dobson, A.; Howarth, R.; Schindler, D.; Schlesinger, W.H.; Simberloff, D.; Swackhamer, D. Forecasting agriculturally driven global environmental change. Science 2001, 292, 281–284. [Google Scholar] [CrossRef] [Green Version]
- Tscharntke, T.; Klein, A.M.; Kruess, A.; Steffan-Dewenter, I.; Thies, C. Landscape perspectives on agricultural intensification and biodiversity—Ecosystem service management. Ecol. Lett. 2005, 8, 857–874. [Google Scholar] [CrossRef]
- Ecopar. Hacia la Construcción de Biocorredores en la Sierra Norte del Ecuador; Ecopar: Quito, Ecuador, 2015. [Google Scholar]
- Pichincha, G.A.D. Actualización Del Plan De Desarrollo Y Ordenamiento Territorial Del Gobierno Provincial de Pichincha; Pichincha: Quito, Ecuador, 2015. [Google Scholar]
- Ecopar. Fortalecimiento de Enfoque de Conectividad de los Biocorredores a Través de la Carcaterización Cartográfica y la Georreferenciación de los Logros de la FO5 y FO6; Ecopar: Quito, Ecuador, 2018. [Google Scholar]
- Gad, P.M. Plan de Ordenamiento y Desarrollo Cantonal del Cantón Pedro Moncayo, Actualización 2015–2025; Pichincha: Tabacundo, Ecuador, 2015. [Google Scholar]
- Mae. GUIA_PARQUES_2014.pdf. 2014. Available online: http://suia.ambiente.gob.ec (accessed on 1 September 2019).
- Martínez Valle, L.; Agraria, R. Territorios campesinos y reforma agraria: El caso de las cooperativas indígenas de la sierra ecuatoriana Rural territories and land reform: The case of indigenous cooperatives of the Ecuadorian sierra PALABRAS CLAVE. Mundo Agrar. 2016, 17, 19. [Google Scholar]
- Programme, G.E.F.S.G. Annual Monitoring Report; West Berkshire Council: Newbury, UK, 2014.
- Senplades, S. Plan Nacional de Desarrollo 2017–2021 Toda una Vida. Plan Nacional de Desarrollo 2017–2021 Toda una Vida 2017, 64–69. [Google Scholar]
- Inec, I. Instituto Nacional de Estadísticas y Censos. 2010. Available online: https://www.ecuadorencifras.gob.ec/estadisticas (accessed on 1 July 2019).
- Kitzinger, J. Qualitative Research: Introducing focus groups. BMJ 1995, 311, 299. [Google Scholar] [CrossRef] [Green Version]
- Gray, S.; Chan, A.; Clark, D.; Jordan, R. Modeling the integration of stakeholder knowledge in social–ecological decision-making: Benefits and limitations to knowledge diversity. Ecol. Model. 2012, 229, 88–96. [Google Scholar] [CrossRef]
- Carley, K.; Palmquist, M. Extracting, Representing, and Analyzing Mental Models. Soc. Forces 2011, 70, 601–636. [Google Scholar] [CrossRef]
- Jetter, A.J.; Kok, K. Fuzzy Cognitive Maps for futures studies-A methodological assessment of concepts and methods. Futures 2014, 61, 45–57. [Google Scholar] [CrossRef]
- Gray, S.A.; Gray, S.; de Kok, J.L.; Helfgott, A.E.R.; O’Dwyer, B.; Jordan, R.; Nyaki, A. Using fuzzy cognitive mapping as a participatory approach to analyze change, preferred states, and perceived resilience of social-ecological systems. Ecol. Soc. 2015, 20. [Google Scholar] [CrossRef]
- Van Vliet, M.; Kok, K.; Veldkamp, T. Linking stakeholders and modellers in scenario studies: The use of Fuzzy Cognitive Maps as a communication and learning tool. Futures 2010, 42, 1–14. [Google Scholar] [CrossRef]
- Kosko, B. Fuzzy cognitive maps. Int. J. Man Mach. Stud. 1986, 24, 65–75. [Google Scholar] [CrossRef]
- Axelrod, R.M. Conflict of Interest: A Theory of Divergent Goals with Applications to Politics; Markham Publishing Company: Chicago, IL, USA, 1970. [Google Scholar]
- Dodouras, S.; James, P. Examining the Sustainability Impacts of Mega-Sports Events: Fuzzy Mapping as a New Integrated Appraisal System. In Proceedings of the 4th International Postgraduate Research Conference in the Built and Human Environment, Salford, UK, 29 March–2 April 2004. [Google Scholar]
- Langfield-Smith, K.; Wirth, A. Measuring differences between cognitive maps. J. Oper. Res. Soc. 1992, 43, 1135–1150. [Google Scholar] [CrossRef]
- Novak, J.D.; Cañas, A.J. The Theory Underlying Concept Maps and How to Construct and Use Them. IHMC Cmaptools 2008, 1–36. [Google Scholar]
- Özesmi, U.; Özesmi, S.L. Ecological models based on people’s knowledge: A multi-step fuzzy cognitive mapping approach. Ecol. Model. 2004, 176, 43–64. [Google Scholar] [CrossRef] [Green Version]
- Gray, C.L.; Bilsborrow, R.E. Consequences of out-migration for land use in rural Ecuador. Land Use Policy 2014, 36, 182–191. [Google Scholar] [CrossRef] [Green Version]
- Gray, S.; Gray, S.; Zanre, E. Fuzzy Cognitive Map as representation of mental models and group beliefs: Theoretical and technical issues. Fuzzy Cogn. Maps Appl. Sci. Eng. 2014, 54, 29–48. [Google Scholar]
- Bougon, M.; Weick, K.; Binkhorst, D. Cognition in Organizations: An Analysis of the Utrecht Jazz Orchestra. Adm. Sci. Q. 1977, 22, 606–639. [Google Scholar] [CrossRef]
- Eden, C. Analyzing cognitive maps to help structure issues or problems. Eur. J. Oper. Res. 2004, 159, 673–686. [Google Scholar] [CrossRef]
- Papageorgiou, E.I.; Salmeron, J.L. A review of fuzzy cognitive maps research during the last decade. IEEE Trans. Fuzzy Syst. 2012, 21, 66–79. [Google Scholar] [CrossRef]
- Murtagh, F.; Legendre, P. Ward’s hierarchical agglomerative clustering method: Which algorithms implement Ward’s criterion? J. Classif. 2014, 31, 274–295. [Google Scholar] [CrossRef] [Green Version]
- Alizadeh, S.; Ghazanfari, M.; Fathian, M. Using Data Mining for Learning and Clustering. World Acad. Sci. Eng. Technol. 2008, 2, 792–799. [Google Scholar]
- Romesburg, C. Cluster Analysis for Researchers; Lulu Press: Morrisville, NC, USA, 2004. [Google Scholar]
- Kassambara, A.; Mundt, F. Package ‘factoextra’. Extr. Vis. Results Multivar. Data Anal. 2017, 76, 25–32. [Google Scholar]
- Hobbs, B.F.; Ludsin, S.A.; Knight, R.L.; Ryan, P.A.; Ciborowski, J.J.H. Fuzzy Cognitive Mapping as a Tool to Define Management Objectives for Complex Ecosystems Fuzzy Cognitive Mapping as a Tool to Define Management. America 2011, 12, 1548–1565. [Google Scholar]
- Vasslides, J.M.; Jensen, O.P. Fuzzy cognitive mapping in support of integrated ecosystem assessments: Developing a shared conceptual model among stakeholders. J. Environ. Manag. 2016, 166, 348–356. [Google Scholar] [CrossRef]
- Ostrom, E. The Evolution of Institutions for Collective Action; Edición En Español; Fondo de Cultura Económica: Mexico City, Mexico, 1990; Volume 1, pp. 109–129. [Google Scholar]
- Woolcock, M.; Narayan, D. Social capital: Implications for development theory, research, and policy. World Bank Res. Obs. 2000, 15, 225–249. [Google Scholar] [CrossRef] [Green Version]
- Mehrabi, Z.; Ellis, E.C.; Ramankutty, N. The challenge of feeding the world while conserving half the planet. Nat. Sustain. 2018, 1, 409–412. [Google Scholar] [CrossRef] [Green Version]
- Salafsky, N.; Wollenberg, E. Linking Livelihoods and Conservation: A Conceptual Framework and Scale for Assessing the Integration of Human Needs and Biodiversity. World Dev. 2000, 28, 1421–1438. [Google Scholar] [CrossRef]
- Council, F. Sustainable Development and Natural Resources Management. Sustain. Dev. 2014. [Google Scholar] [CrossRef]
- Ryff, C.D. Happiness is everything, or is it? Explorations on the meaning of psychological well-being. J. Personal. Soc. Psychol. 1989, 57, 1069–1081. [Google Scholar] [CrossRef]
- Loconto, A.M.; Jimenez, A.; Vandecandelaere, E. Constructing Markets for Agroecology—An Analysis of Diverse Options for Marketing Products from Agroecology; Food and Agriculture Organization of the United Nations: Rome, Italy, 2018. [Google Scholar]
- Heifer. La Agroecología Está Presente, Mapeo de Productores Agroecologicos y del Estado de la Agroecología en la Sierra y Costa Ecuatoriana; Food and Agriculture Organization of the United Nations: Rome, Italy, 2014. [Google Scholar]
- Altieri, M.A.; Rosset, P.; Thrupp, L.A. The Potential of Agroecology to Combat Hunger in the Developing World; Food and Agriculture Organization of the United Nations: Rome, Italy, 1998. [Google Scholar]
- Polan, L. Diagnósticos equivocados y soluciones demagógicas están “paralizando” las iniciativas de los productores rurales. Revista MVZ Córdoba 2005, 10, 507–511. [Google Scholar]
- Ahmed, S. Empowering rural women? Policies, institutions, and gendered outcomes in natural resources management. Dev. Pract. 2001, 11, 535–537. [Google Scholar] [CrossRef]
- Seferiadis, A.A.; Cummings, S.; Maas, J.; Bunders, J.F.G.; Zweekhorst, M.B.M. A dynamic framework for strengthening women’s social capital: Strategies for community development in rural Bangladesh. Community Dev. J. 2017, 1–20. [Google Scholar] [CrossRef]
- Ahnström, J.; Höckert, J.; Bergeå, H.L.; Francis, C.A.; Skelton, P.; Hallgren, L. Farmers and nature conservation: What is known about attitudes, context factors and actions affecting conservation? Renew. Agric. Food Syst. 2009, 24, 38–47. [Google Scholar] [CrossRef] [Green Version]
- Pretty, J.; Smith, D. Social capital in biodiversity conservation and management. Conserv. Biol. 2004, 18, 631–638. [Google Scholar] [CrossRef]
- Lalander, R. The Ecuadorian resource dilemma: Sumak kawsay or development? Crit. Sociol. 2016, 42, 623–642. [Google Scholar] [CrossRef]
- Adams, W.M.; Aveling, R.; Brockington, D.; Dickson, B.; Elliott, J.; Hutton, J.; Roe, D.; Vira, B.; Wolmer, W. Biodiversity conservation and the eradication of poverty. Science 2004, 306, 1146–1149. [Google Scholar] [CrossRef] [PubMed] [Green Version]
- Del Ecuador, G. Ley Orgánica del Régimen de la Soberanía Alimentaria. Ecuador; Asamblea Nacional: Caracas, Venezuela, 2009.
- Saltiel, J.; Bauder, J.W.; Palakovich, S. Adoption of Sustainable Agricultural Practices: Diffusion, Farm Structure, and Profitability 1. Rural Sociol. 1994, 59, 333–349. [Google Scholar] [CrossRef]
- Rieckmann, M.; Adomßent, M.; Härdtle, W.; Aguirre, P. Sustainable Development and Conservation of Biodiversity Hotspots in Latin America: The Case of Ecuador; Springer: Berlin/Heidelberg, Germany, 2011; pp. 435–452. [Google Scholar]
- Hoogesteger, J. Social Capital in Water User Organizations of the Ecuadorian Highlands. Hum. Organ. 2013, 26, 60–74. [Google Scholar] [CrossRef]
Figure 1.
Image of the zone of study.

Figure 2.
Map of the Cayambe Coca and Pisque Mojanda San Pablo biocorridors.

Figure 3.
Methodological design.

Figure 4.
Focus group sessions with the peasants.

Figure 5.
Visual representation of a subset of managers’ and peasants’ maps, showing the eight variables with high centrality. Black lines represent positive connections, and red lines negative connections. Circles represent the variables of the system, and the colors refer to the program sector (green for agriculture, light green for conservation, blue for socioeconomic aspects, red for issues, and yellow for climate). SAP, sustainable agricultural practice.

Figure 6.
Dendrogram of the clusters of the program intervention. SAP, sustainable agricultural practice.
Figure 6.
Dendrogram of the clusters of the program intervention. SAP, sustainable agricultural practice.

Figure 7.
Comparison assessment between managers and peasants. Clustering nodes by FCM indices. Mean value of performance variables in the three established clusters. Dc, differences in the centrality variable between the study groups; ds, differences in the s variable between the study groups.
Figure 7.
Comparison assessment between managers and peasants. Clustering nodes by FCM indices. Mean value of performance variables in the three established clusters. Dc, differences in the centrality variable between the study groups; ds, differences in the s variable between the study groups.

Figure 8.
Cluster 1 variations of the variables c (centrality variable) and s (difference between the outdegree and indegree variables).
Figure 8.
Cluster 1 variations of the variables c (centrality variable) and s (difference between the outdegree and indegree variables).

Figure 9.
Cluster 2 variations of the variables c (centrality variable) and s (difference between outdegree and indegree variables).
Figure 9.
Cluster 2 variations of the variables c (centrality variable) and s (difference between outdegree and indegree variables).

Figure 10.
Cluster 3 variations of the variables c (centrality variable) and s (difference between outdegree and indegree variables).
Figure 10.
Cluster 3 variations of the variables c (centrality variable) and s (difference between outdegree and indegree variables).

Table 1.
Socio-economic and biophysical characteristics of the study areas.
| Detail | Pisque Mojanda San Pablo | Cayambe Coca |
|---|---|---|
| Population in the intervention area | 37,078 | 42,730 |
| % Indigenous people | 62 | 59 |
| % People living in poverty (<USD 84.82 per month) | 39 | 41 |
| % People living in extreme poverty (<USD 47.80 per month) | 7 | 14 |
| Funding for the First to the Fifth Operative Phase (USD) | 508,297.10 | 1,952,567.15 |
| Funding for the Sixth Operative Phase (USD) | 81,914 | 92,234 |
Table 2.
The mean and standard deviation of the fuzzy cognitive mapping (FCM) indices by organization group.
Table 2.
The mean and standard deviation of the fuzzy cognitive mapping (FCM) indices by organization group.
| Index 1 | Agricultural Organizations | Peasants | Managers |
|---|---|---|---|
| Number of maps | 4 | 1 | 1 |
| Number of participants | 20 | 20 | 4 |
| Number of variables (N) | 17.25 ± 1.71 | 24 | 20 |
| Number of connections (C) | 48 ± 6.38 | 106 | 54 |
| C/N | 2.13 ± 0.19 | 4.42 | 2.70 |
| Density | 0.16 ± 0.03 | 0.18 | 0.14 |
| Number of transmitter variables (T) | 3.25 ± 1.70 | 3 | 4 |
| Number of receiver variables (R) | 2.5 ± 1 | 3 | 5 |
| Number of ordinary variables | 11.5 ± 2.08 | 18 | 11 |
| Complexity (R/T) | 1.17± 1.23 | 1.00 | 1.25 |
| Hierarchy index, h | 0.06 ± 0.03 | 0.01 | 0.05 |
1 Except for the number of maps and the number of participants, all values are mean and standard deviation of the indices.
© 2020 by the authors. Licensee MDPI, Basel, Switzerland. This article is an open access article distributed under the terms and conditions of the Creative Commons Attribution (CC BY) license (http://creativecommons.org/licenses/by/4.0/).
Share and Cite
MDPI and ACS Style
Satama, M.; Iglesias, E. Fuzzy Cognitive Map Clustering to Assess Local Knowledge of Ecosystem Conservation in Ecuador. Sustainability 2020, 12, 2550. https://0-doi-org.brum.beds.ac.uk/10.3390/su12062550
AMA Style
Satama M, Iglesias E. Fuzzy Cognitive Map Clustering to Assess Local Knowledge of Ecosystem Conservation in Ecuador. Sustainability. 2020; 12(6):2550. https://0-doi-org.brum.beds.ac.uk/10.3390/su12062550
Chicago/Turabian StyleSatama, Maritza, and Eva Iglesias. 2020. "Fuzzy Cognitive Map Clustering to Assess Local Knowledge of Ecosystem Conservation in Ecuador" Sustainability 12, no. 6: 2550. https://0-doi-org.brum.beds.ac.uk/10.3390/su12062550
Note that from the first issue of 2016, this journal uses article numbers instead of page numbers. See further details here.