Article

District Heating Energy Consumption of the Building Sector in the Jing-Jin-Ji urban Agglomeration: Decomposition and Decoupling Analysis

1
Key Laboratory of Industrial Ecology and Environmental Engineering (MOE), School of Environmental Science and Technology, Dalian University of Technology, Dalian 116024, China
2
Department of Engineering Technology, Purdue University, 610 Purdue Mall, West Lafayette, IN 47907, USA
*
Author to whom correspondence should be addressed.
Sustainability 2020, 12(6), 2555; https://0-doi-org.brum.beds.ac.uk/10.3390/su12062555
Submission received: 1 March 2020 / Revised: 15 March 2020 / Accepted: 16 March 2020 / Published: 24 March 2020
(This article belongs to the Section Energy Sustainability)

Abstract

:
China’s rapid urbanization has caused dramatically increasing energy consumption in the district heating systems of the building sector in the Jing-Jin-Ji urban agglomeration, and this change has led to enormous air pollution issues in this region. However, the drivers and the sustainable development process of the district heating system of the building sector have not been investigated to understand the management of energy conservation and emissions reduction in the Jing-Jin-Ji urban agglomeration. This study investigates the drivers of the district heating energy consumption of the building sector (DHEB) in the Jing-Jin-Ji urban agglomeration between 2004 and 2016 by developing a decomposition framework. The decoupling status between the DHEB and gross domestic product (GDP) is then analyzed based on the Tapio decoupling index. The results show that a weak decoupling effect is mainly found between the DHEB and GDP in the Jing-Jin-Ji urban agglomeration from 2004 to 2016. The increase in the DHEB in 2004–2016 is largely driven by the growth of the district heating area and population, while the heating energy intensity negatively contributes to the increase. Significant differences in the effects of the share of the energy mix and share of heat production technology were found between subregions in response to government policy, which impacted levels in Beijing, Tianjin, and Hebei in decreasing order.

1. Introduction

The ambition to limit global warming to 2 °C requires transformation to an efficient energy system by national efforts. In particular, implementation of efficient and clean district heating systems can significantly mitigate climate change, air pollution, and improve thermal comfort and cost benefits in the building sector [1]. China has the largest district heating system in the world, whose networks have surpassed 200,000 kilometers and can provide heat to nearly 9 billion square meters of building space [1]. In 2015, China’s district heating system accounted for 40% energy consumption of the building sector [2], the energy consumption of which experienced a significant increase of 96% from 2004 to 2015 (Table A1).
As one of the economic centers and the most urbanized areas in China, Jing-Jin-Ji urban agglomeration experienced a dramatic increase of 120% (Table A1) in the district heating energy consumption of the building sector (DHEB) from 2004 to 2016 due to the rapid urbanization in population and building area (Table A2). Moreover, the Jing-Jin-Ji urban agglomeration is challenged by severe air pollution, especially in winter, when the pollution is caused by huge heating fuel combustion [3]. To address this problem, the Ministry of Environmental Protection launched the “Issuance of the Action Plan for the Control of Air Pollution” [4] and a series of actions that aimed to curb air pollution in the Jing-Jin-Ji urban agglomeration [5]. Efforts have vigorously been made to promote clean energy generation and efficiency heating systems in the Jing-Jin-Ji urban agglomeration [6], and their effectiveness has been proved [7]. Thus, it is necessary to quantitatively evaluate the influential drivers and sustainable development process of the DHEB in the Jing-Jin-Ji urban agglomeration, as this information is crucial for understanding the management of energy conservation and emissions reduction, as well as the influence of urbanization and mitigation policy.
A number of studies have analyzed the driving factors of the changes in heating energy consumption and carbon emissions. In particular, some studies have analyzed the impact factors from an econometric-based view. For example, Bissiri et al. [8] used a nonparametric model to analyze the impact factors of residential heating energy consumption in terms of price, income and heating degree days (HDD). The results indicated that domestic heating energy consumption was highly responsive to HDD and price elasticities. In contrast, there are also studies that used index decomposition analysis to provide a complete understanding of underlying drivers [9] of residential building energy consumption, which is the largest share of energy consumption represented by space heating in many regions, such as Europe [10] and China [11]. For instance, attempts have been made to investigate the effects of residential building energy consumption and carbon emissions in terms of price and expenditure [12], end-use structure [11], residential consumption structure [13], urbanization [14], standard of living [15] and climate [16], the results of which can provide energy-saving policy implications for space heating.
Moreover, previous studies utilized a combined decomposition and decoupling analysis to assess the drivers and the decoupling status between economic growth and energy consumption, which allows to provide key indicators for sustainable development [17]. For the building sector, Liang et al. [18] investigated the driving factors of the carbon dioxide intensity in China’s residential building sector by combining a decoupling approach, and further identified their relationships of weak decoupling with economic development. Ma et al. [19] assessed whether carbon dioxide intensity of the commercial building sector decoupled from the economic growth in China via a combined decomposition and decoupling approach. Results showed that the nationwide decoupling status shifted from weak decoupling in 2001–2005 to strong decoupling in 2006–2015, and the Jing-Jin-Ji urban agglomeration was found with larger decoupling effect due to the rapid development of energy conservation projects.
Although these studies contribute to understanding the drivers and decoupling effect of building energy consumption and revealing potential implications for the domestic heating sector, several limitations have been identified in these existing studies: (1) to the best of our knowledge, very few studies have studied driving factors of the changes in the DHEB in terms of the effect of the share of the energy mix, the effect of the share of heat production technology, and other effects from the results of urbanization with the logarithmic mean Divisia index (LMDI) decomposition framework, along with their decoupling effects on the economic growth; (2) most previous decomposition studies targeting China’s residential building sector used energy data from the “Energy Balance Table” in the China Energy Statistical Yearbook, and this dataset cannot directly provide energy consumption data for the district heating systems of the building sector; (3) the driving factors of the changes in the DHEB and their decoupling status for the Jing-Jin-Ji urban agglomeration have not been explored.
The objectives of this study are to quantitatively evaluate the driving factors of the changes in the DHEB of the Jing-Jin-Ji urban agglomeration and its decoupling status from economic growth. Specifically, this study made several contributions. First, we concentrated on the effects of the share of energy mix, the share of heat production technology, heating energy intensity, population and district heating area by deploying decomposition analysis. Second, we acquired the DHEB data from the “China Urban–Rural Construction Statistical Yearbook” (CURCSY) [20], which can provide complete, transparent and consistent data for the district heating system in contrast to other existing data. Third, we conducted the study in the Jing-Jin-Ji urban agglomeration, which is a region experiencing rapid urbanization and clean energy actions in China.
The remainder of this paper is organized as follows. Section 2 describes the methodology and data. Section 3 provides the results of decomposition and decoupling. Section 4 provides the empirical discussions. Section 5 summarizes the main findings and conclusions.

2. Materials and Methods

2.1. Decomposition Analysis

Decomposition analysis methods have been extensively used to identify the contribution of a set of drivers on target variables. Two decomposition methods are commonly used: index decomposition analysis (IDA) and structure decomposition analysis (SDA). Based on the consideration of time-series sector detailed data, the IDA is more suitable for investigating the drivers behind decoupling and can be easily applied at any level of aggregation [21], while the SDA needs a complete input-out table [22,23]. Among various IDA methodologies, the logarithmic mean Divisia index (LMDI) method is the most popular method for studying energy and emission decomposition due to its path independence and consistency in aggregation [24].
In this study, we decomposed the DHEB in the Jing-Jin-Ji urban agglomeration by developing a decomposition framework based on LMDI approach as follows:
H E = i j H E i j = i j H E i j H E j × H E j H E × H E S × S P × P
H E = i j S i j × T j × I × A × P
where i and j represent, respectively, different fuel types (where i = 1, 2, 3 represents coal, natural gas and oil, respectively) and different heat production technology (where j = 1, 2 represents combined heat and power (CHP) and heating boilers, respectively); HE represents the DHEB; H E i j represents the DHEB generated from heat production technology j by fuel type i; H E j represents the DHEB generated by heat production technology j; and S and P represent the total district heating area and population, respectively.
S i j = H E i j / H E j is the proportion of the DHEB generated by fuel type i by heat production technology j in district heating systems, which represents the energy mix effect, and it is subdivided into the effect of the shares of coal, oil and gas in the entire DHEB; T j = H E j / H E is the proportion of the DHEB generated by technology type j and represents the heat production technology structure effect, which is subdivided into the effect of the shares of CHP and heating boilers; I = H E / S is the effect of the heating energy intensity and measures the district heating energy consumption per unit square meter of a building (kgce/m2), which indicates the energy efficiency; A = S / P represents the effect of the district heating area and measures floor area per person (m2/person) equipped with a district heating system; and P represents the effect of population growth.
Thus, the changes of the DHEB can be further decomposed as follows:
H E = H E t H E t 1
H E = S i j t × T j t × I t × A t × P t S i j t 1 × T j t 1 × I t 1 × A t 1 × P t 1 = H E S + H E T + H E I + H E A + H E P
H E S = H E coal + H E gas + H E oil
H E T = H E CHP + H E Boiler
H E = H E coal + H E gas + H E oil + H E CHP + H E Boiler + H E I + H E A + H E P        = j 2 L ( w 1 j t , w i j t 1 ) l n ( S 1 j t S 1 j t 1 )        + j 2 L ( w 2 j t , w 2 j t 1 ) l n ( S 2 j t S 2 j t 1 ) + j 2 L ( w 3 j t , w 3 j t 1 ) l n ( S 3 j t S 3 j t 1 )        + i 3 L ( w 1 i t , w 1 i t 1 ) l n ( T 1 t T 1 t 1 ) + i 3 L ( w 2 i t , w 2 i t 1 ) l n ( T 2 t T 2 t 1 )        + i 3 j 2 L ( w i j t , w i j t 1 ) l n ( I j t I j t 1 ) + i 3 j 2 L ( w i j t , w i j t 1 ) 1 n ( A j t A j t 1 )        + i 3 j 2 L ( w i j t , w i j t 1 ) l n ( P j t P j t 1 )
where L ( w i j t , w i j t 1 ) = ( H E i j t H E i j t 1 ) / ( l n ( H E i j t ) l n ( H E i j t 1 ) ) is the logarithmic mean weight. ΔHEcoal, ΔHEgas, ΔHEoil are the changes of the DHEB owing to shifts in the proportion of coal, gas and coal; ΔHECHP and ΔHEBoiler are the changes of the DHEB owing to shifts in the proportion of CHP and heating boilers, respectively; ΔHEI, ΔHEA and ΔHEP are the changes of the DHEB owing to energy intensity changes, district heating area growth and population variation, respectively. t is the number of the specific year.
In this study, as there is no heating fuel information in the CURCSY data, we used heating fuel data from the China Energy Balance Table to estimate the heating fuel mix of the DHEB. This is because the heating fuel mix is determined at the heat production phase where the fuel source is completely transformed into heat before allocating to each end-use sector. In addition, we considered the heating fuel mix to be the same in the CHP and heating boilers. Therefore, the energy mix effect Si,j can be represented as follows:
S i j = H E i j H E j = H E i ~ H E ~
where H E i ~ represents the total district heating energy consumption by fuel type i with the data from the China Energy Balance Table; H E ~ represents the total district heating energy consumption with the data from China Energy Balance Table. The data for district heating fuel mix are obtained from “China Energy Balance Table” [25].

2.2. Decoupling Analysis

The Tapio decoupling model [26] is used to build the judgement standard for decoupling the DHEB from GDP in China. The decoupling indicator is expressed as Equation (9).
φ H E , G D P = H E 0 T / H E 0 G D P 0 T / G D P 0
where φ HE , GDP is the decoupling level of the DHEB from GDP in China; H E 0 and G D P 0 represent the values of the DHEB and GDP in the base-year, respectively; and H E 0 T and G D P 0 T represent the changes of the DHEB and GDP over a period of ΔT, respectively. Table 1 shows the judgement standard of the decoupling status.
According to Equations (7) and (9), the extended decoupling model based on decomposition is expressed in Equation (10).
φ H E , G D P = H E 0 T / H E 0 G D P 0 T / G D P 0 = ( H E coal 0 T + H E gas 0 T + H E oil 0 T + H E CHP 0 T + H E Boiler 0 T + H E I 0 T + H E A 0 T + H E P 0 T ) / H E 0 G D P 0 T / G D P 0 = H E coal 0 T / H E 0 G D P 0 T / G D P 0 + H E gas 0 T / H E 0 G D P 0 T / G D P 0 + H E oil 0 T / H E 0 G D P 0 T / G D P 0 + H E CHP 0 T / H E 0 G D P 0 T / G D P 0 + H E Boiler 0 T / H E 0 G D P 0 T / G D P 0 + H E I 0 T / H E 0 G D P 0 T / G D P 0 + H E A 0 T / H E 0 G D P 0 T / G D P 0 + H E P 0 T / H E 0 G D P 0 T / G D P 0 = φ coal + φ gas + φ oil + φ CHP + φ Boiler + φ I + φ A + φ P
where the decoupling indicator φHE,GDP of the DHEB from GDP can be decomposed into eight sub-indicators, which are the share of coal indicator (φcoal), the share of gas indicator (φgas), the share of oil indicator (φoil), the share of CHP indicator (φCHP), the share of heating boilers indicator (φBoiler), the energy intensity indicator (φI), the heating area indicator (φA), and the population indicator (φP).

2.3. Data

Jing-Jin-Ji urban agglomeration is the biggest urbanized region in Northern China, with two centrally and directly controlled municipalities (Beijing and Tianjin) and Hebei province (Figure A1). In this study, the accounting scope of the DHEB in the Jing-Jin-Ji urban agglomeration is the summed value of Beijing, Tianjin, and Hebei. Data describing the DHEB in 2004–2016 were obtained from the China Urban–Rural Construction Statistical Yearbook (CURCSY). In contrast to the “Energy Balance Table” of China Energy Statistical Yearbook and other statistics, the CURCSY database provides three advantages to account for the DHEB. (a) The district heating energy data from the CURCSY targets the building sector, including public buildings and residential buildings, which can provide an explicit and integral accounting scope for the building sector, rather than data classified by service activities (e.g., primary industry, secondary industry, tertiary industry, living sector). (b) The accounting scope for the district heating energy data in China Energy Balance Table is incomplete, and data only focus on large-scale heating enterprises (a main income larger than 20 million yuan or annual comprehensive energy consumption of more than 10,000 tons of standard coal). In contrast, CURCSY provides complete information for the district heating energy generators, which includes both the CHP and heating boilers (heating capacity both larger or less than 7 MW). (c) CURCSY simultaneously provides the district heating area of buildings, which parallels the DHEB data. In addition, the GDP values of Jing-Jin-Ji urban agglomeration are derived from “China Statistical Yearbooks 2005–2017” [27]. To eliminate the price inflation, the GDP values were completely adjusted to the constant price in 2004.

3. Results

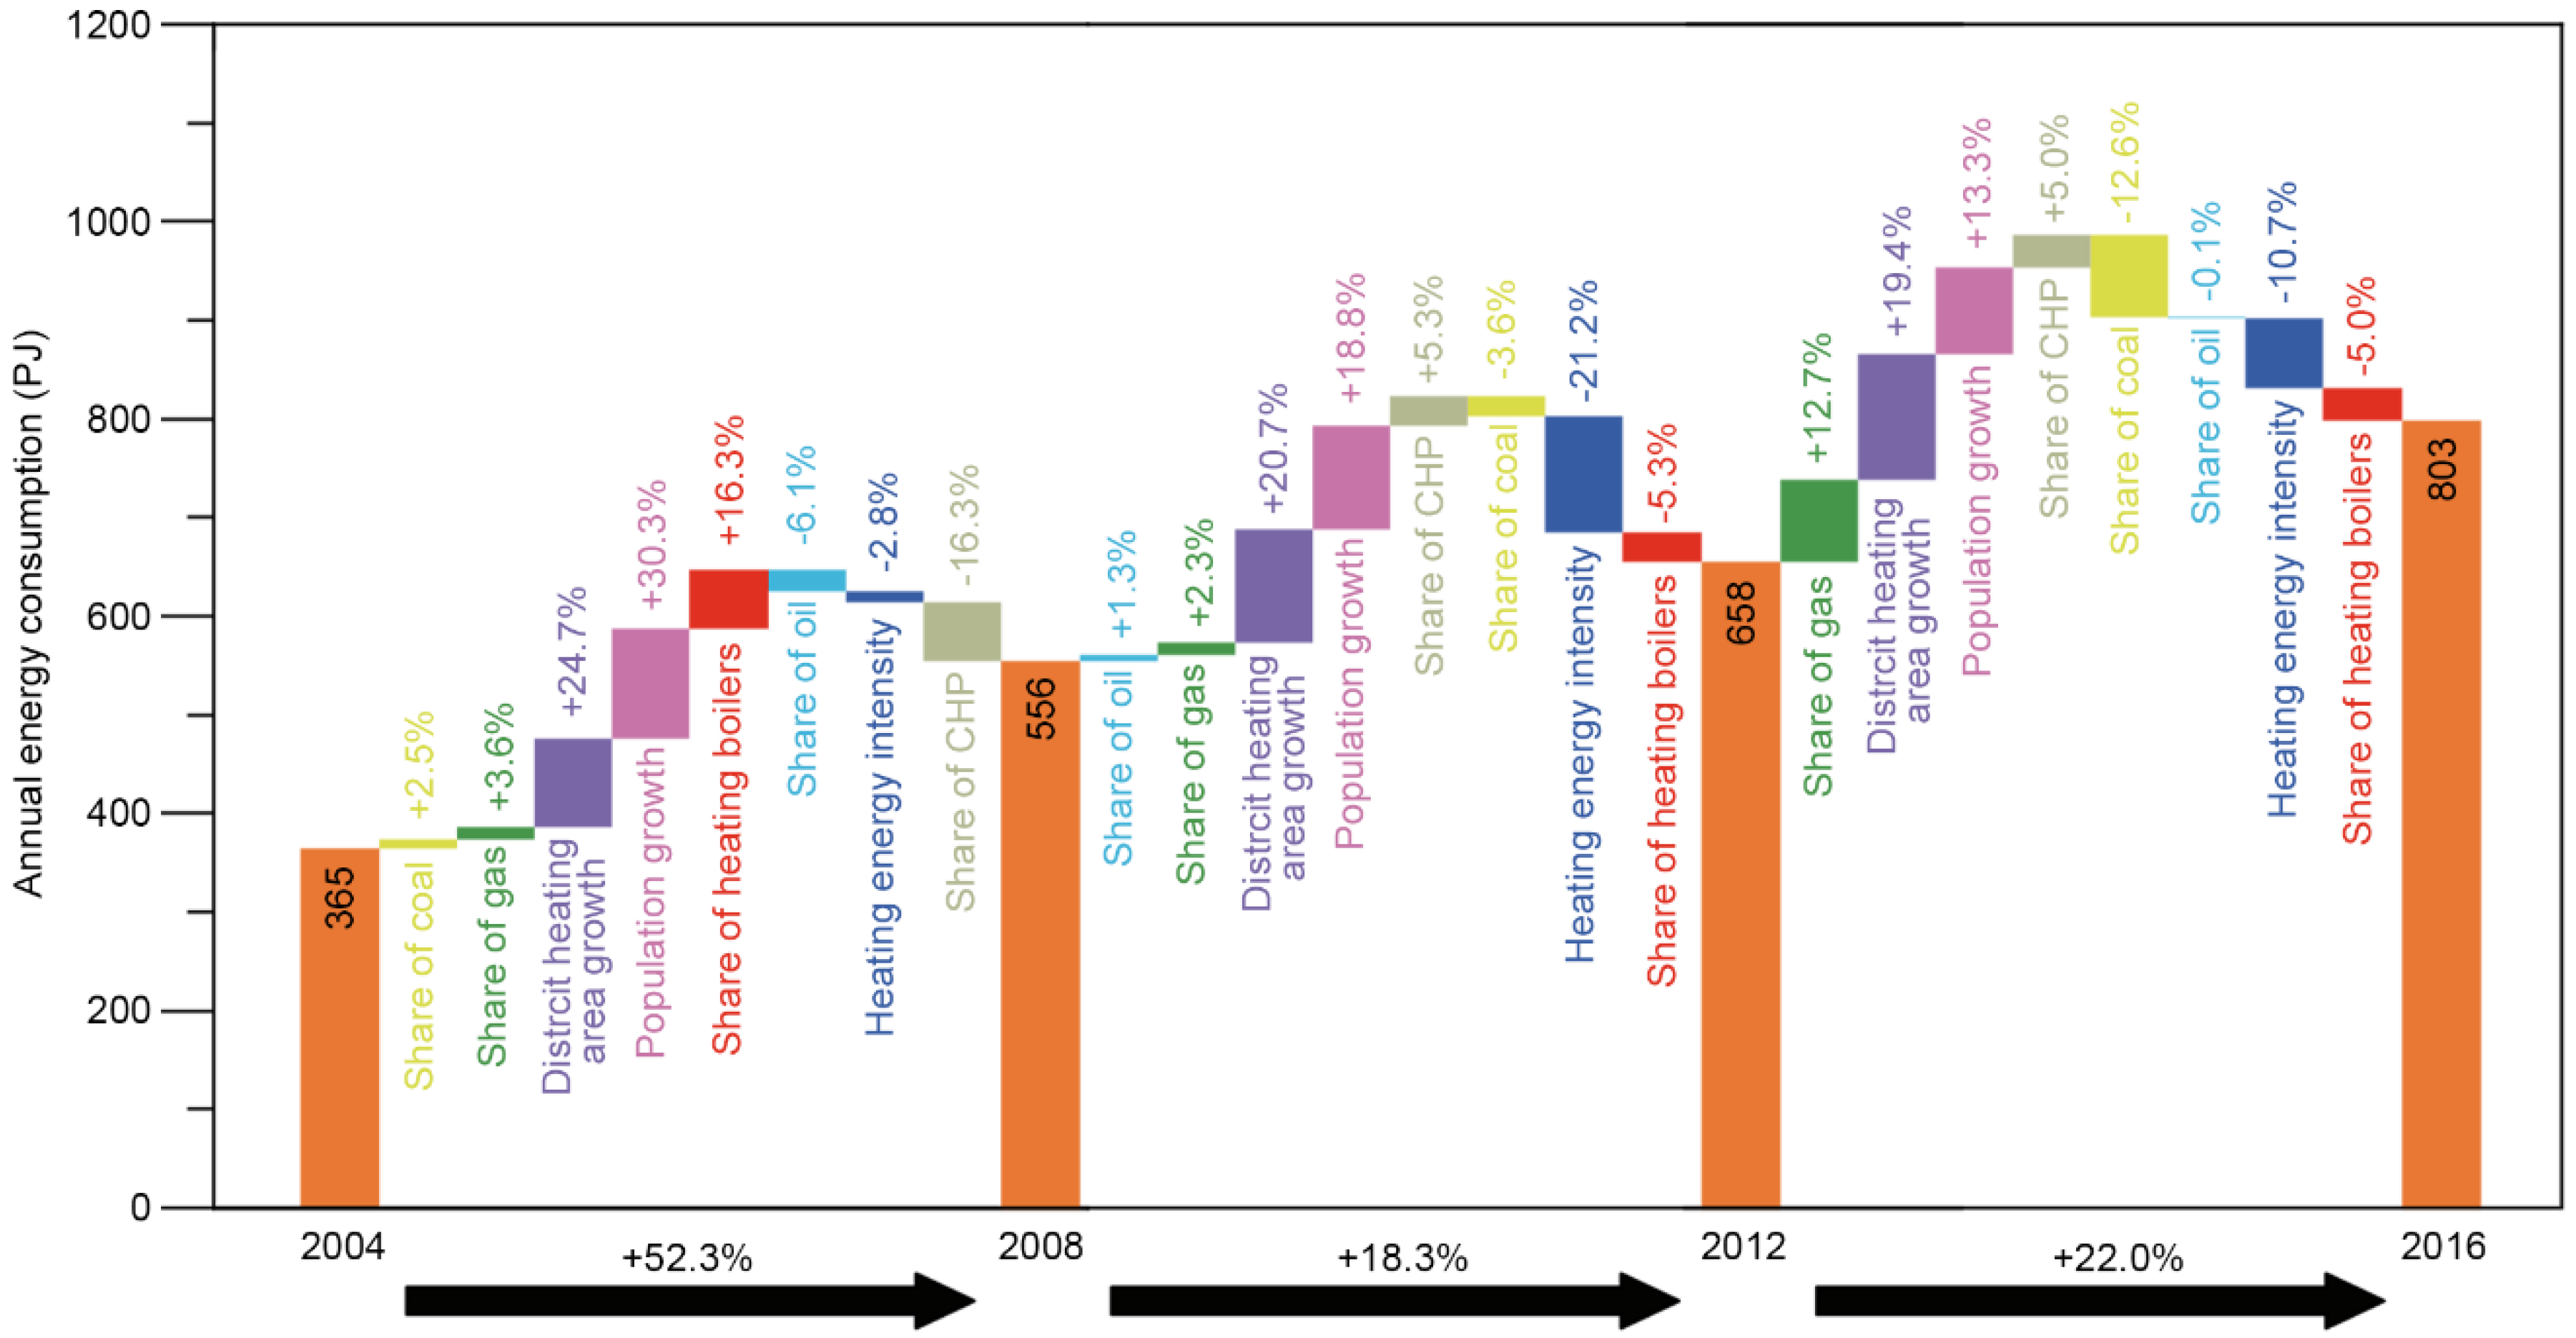
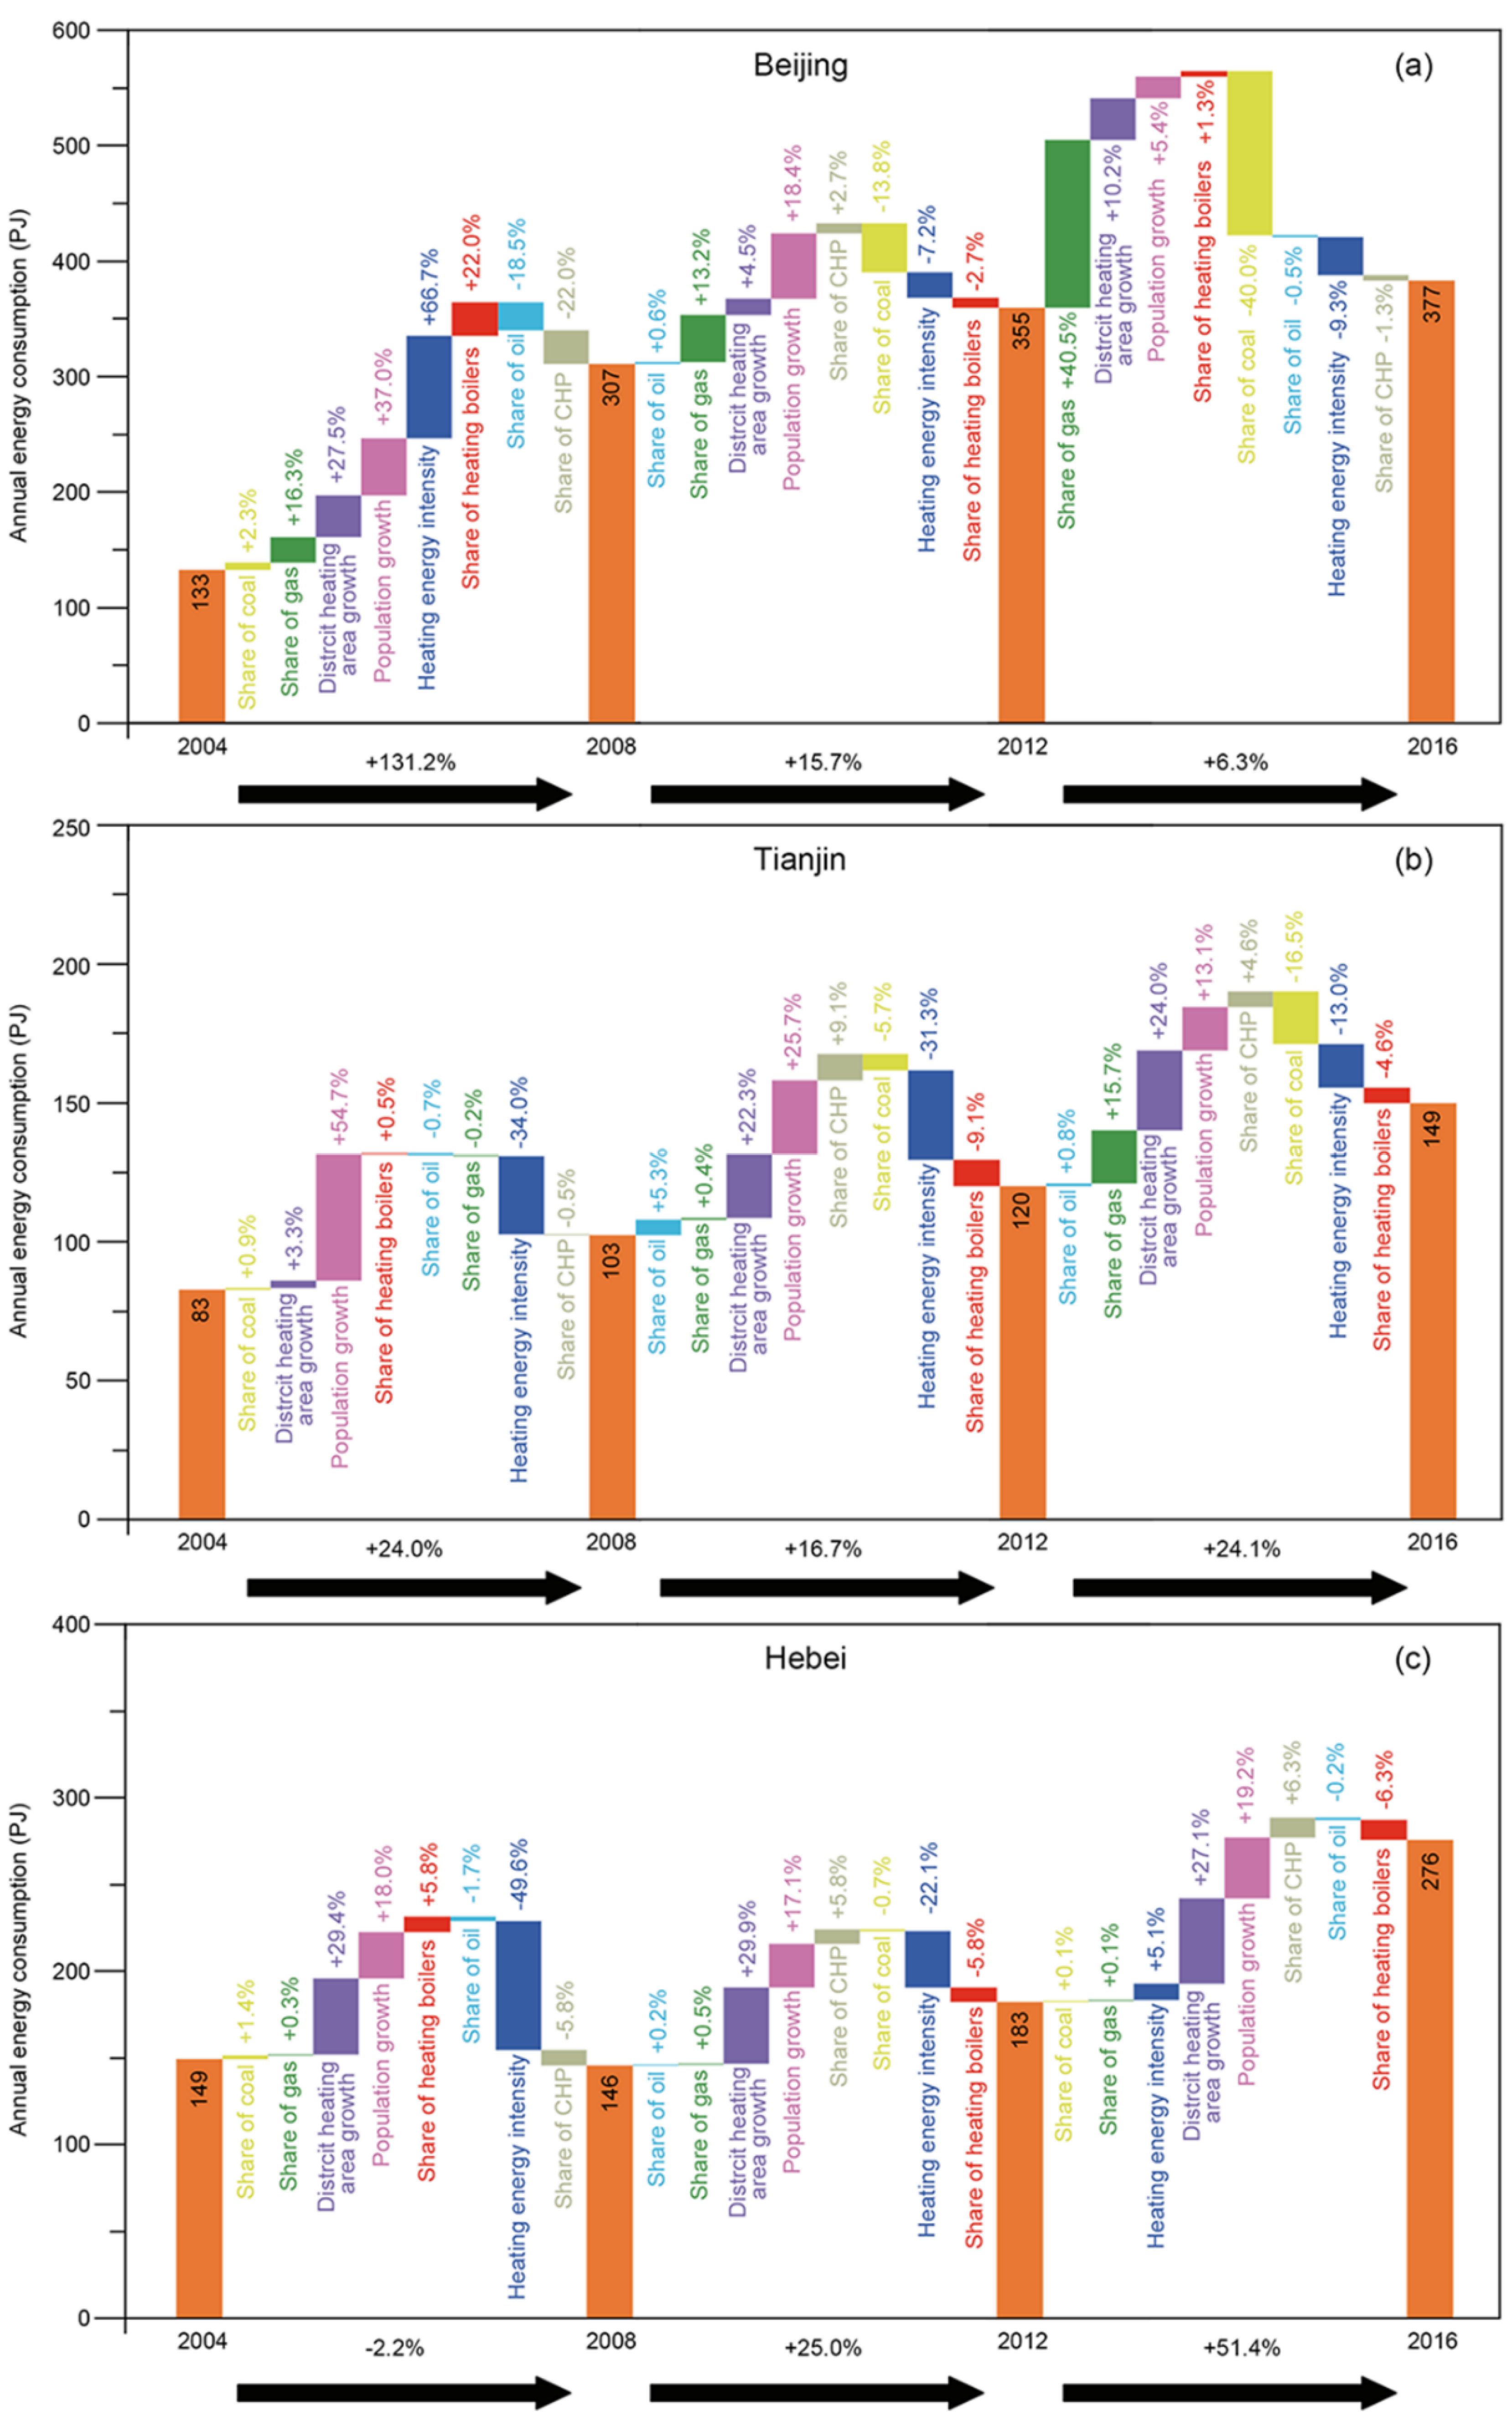
3.1. Decomposition Analysis Results

Figure 1 illustrates the decomposition results for the changes in the DHEB in the Jing-Jin-Ji urban agglomeration from 2004 to 2016. The total DHEB of the Jing-Jin-Ji urban agglomeration experienced significant growth of 120% from 2004 to 2016, and it reached 52.3%, 18.3% and 22.0% during 2004–2008, 2008–2012 and 2012–2016, respectively. An increasing trend was also found in each subregion in 2004–2016, with growth rates of 184%, 80% and 85% in Beijing, Tianjin and Hebei, respectively (Figure 2). These increases reflect rapid development of district energy systems during urbanization in the Jing-Jin-Ji urban agglomeration in the past decade.
Regarding the indicators with positive contributions to the changes in the DHEB, the effects of district heating area and population always positively contributed to the increase in the DHEB of the Jing-Jin-Ji urban agglomeration during 2004–2016, as well as for each subperiod and subregion. The contribution of the heating area effect to the changes in the DHEB of the Jing-Jin-Ji urban agglomeration reached 24.7%, 20.7% and 19.4% during 2004–2008, 2008–2012 and 2012–2016, respectively, while that for the population effect was 30.3%, 18.8% and 13.3% during the same horizon, respectively (Figure 1). The effects of district heating area and population of Beijing, Tianjin and Hebei are shown as Figure 2.
Regarding the indicators with negative contributions to the changes in the DHEB, the effect of heating energy intensity always decreased the total DHEB of the Jing-Jin-Ji urban agglomeration during 2004–2016, which contributions reached −2.8%, −21.2% and −10.7% during 2004–2008, 2008–2012 and 2012–2016, respectively (Figure 1). Nonetheless, the effect of heating energy intensity appeared to positively contribute to the increase in the DHEB at the sub-regional level in Beijing (66.7% during 2004–2008) (Figure 2a) and Hebei (5.1% during 2012–2016) (Figure 2c).
The energy mix effect is described as a subdivision of the effects of the share of coal, oil and gas, which aims to illustrate the effect originating from the proportion of energy mix changed in the district heating system. Regarding the 2004–2008 period, the effect of the share of coal and the share of gas contributed 2.5% and 3.6% to the increase of the DHEB of Jing-Jin-Ji urban agglomeration, respectively, while the effect of the share of oil played a negative role with −6.1% (Figure 1). For the three subregions, effects of the share of coal, oil and gas of Beijing and Hebei had the same effect trend as that of the Jing-Jin-Ji urban agglomeration in 2004–2008, while the effect of share of gas had a negative effect on the increase in the DHEB in Tianjin. For the 2008–2012 period, the effect of the share of coal shifted to significantly decrease the DHEB of the Jing-Jin-Ji urban agglomeration, while the effect of the shares of oil and gas caused an increase. Regarding the 2012–2016 period, the effect of the share of coal played a more negative role in the increase of the DHEB of the Jing-Jin-Ji urban agglomeration (−12.6%), while the effect of the share of gas accelerated the increase in the DHEB (12.7%) (Figure 1). A similar effect trend was found in Beijing and Tianjin in 2012–2016, but it did not have a significant effect on Hebei’s DHEB.
The heat production technology structure effect is subdivided into the effect of the share of CHP and the effect of the share of heating boilers. Regarding the 2004–2008 period, the effect of the share of boilers caused 16.3% of the increase in the DHEB of the Jing-Jin-Ji urban agglomeration, while the effect of the share of CHP contributed a negative figure (−16.3%). Regarding the 2008–2012 and 2012–2016 periods, the effect of the share of CHP had a positive effect, with values of 5.3% and 5.0%, respectively, while the effect of the share of heating boilers had a negative effect on the DHEB changes (Figure 1). In addition, both Tianjin and Hebei shared similar effect trends as that of the Jing-Jin-Ji region. However, the effect of the share of CHP negatively contributed to the increase in the DHEB in Beijing during the 2012–2016 period, which appeared to express a balanced state of installed capacity of CHP in the regional scale.

3.2. Decoupling Analysis Results

Table 2 indicates the decoupling status between the DHEB and GDP in the Jing-Jin-Ji urban agglomeration, and that for each subregion in 2004–2016, as well as the contribution of each subfactor. The total decoupling status between the DHEB and GDP in the Jing-Jin-Ji urban agglomeration mainly represents weak decoupling. Regarding each subperiod, the total decoupling status was gradually degraded from 2004–2008 (φHE,GDP = 0.852) to 2012–2016 (φHE,GDP = 0.454). The decoupling statuses of each subregion in three subperiods are shown as Table 2.
The total decoupling elasticity can be decomposed into a series of subfactors (φcoal, φoil, φgas, φCHP, φBoiler, φI, φA, and φP). The sum of the values of three decoupling elasticity traces (φcoal, φoil, φgas) nearly equaled zero between 2004 and 2016 (Table 2). Specifically, the decoupling status of φcoal experienced a transition from weak decoupling in 2004–2008 to strong decoupling in 2008–2016. Moreover, the decoupling status of φgas showed weak decoupling between 2004 and 2016, and the decoupling status of φoil showed strong decoupling (2004–2008 and 2012–2016) and weak decoupling (2008–2012).
The sum of the values of φCHP and φBoiler nearly equaled zero during the time period of 2004-2016 (Table 2). The decoupling status of φBoiler was found to shift from weak decoupling (2004–2008) to strong decoupling (2008–2012 and 2012-2016), while the decoupling status of φCHP shifted from strong decoupling (2004–2008) to weak decoupling (2008–2012 and 2012–2016).
The decoupling status of φI showed strong decoupling (average value of −0.214) in 2004–2016, which was the most significant factor promoting the overall decoupling. The strongest decoupling status of φI was found during the period of 2008–2012, with value of −0.374. Furthermore, the decoupling statuses of φA (average value of 0.389) and φP (average value of 0.367) consistently showed weak decoupling in 2004–2016 (Table 2). The decoupling statuses of each subfactor in each subregion in three subperiods are shown as Table 2.

4. Discussion

Section 3 presents the decomposition and decoupling results of the Jing-Jin-Ji urban agglomeration and each subregion in 2004–2016, and the major findings are then discussed below. The results showed that the increase in the DHEB of the Jing-Jin-Ji urban agglomeration was consistently driven by the growth of the district heating area and population in 2004–2016, while the decrease in heating energy intensity negatively contributed to the increase during this period. Similar effect trends were identified in each subregion and subperiod, excluding Beijing in 2004–2008 and Hebei in 2012–2016 (Figure 2). Regarding the factor of the effect of population growth, its positive contribution was consistent with IDA studies that targeted industrial and residential sectors [16,28,29]. Moreover, the significant, negative effect of the heating energy intensity acted as the key driver in reducing the DHEB. A significant, negative effect of energy intensity has also been found in other sectors by IDA studies, such as the productive sector [28] and electricity power sector [30].
The novel features for analyzing the effects of the share of the energy mix and share of heat production technology used in this paper have produced more detailed insights into the underlying drivers of the DHEB in the Jing-Jin-Ji urban agglomeration. The results showed that the driving effect of share of energy mix had significantly different features between the periods of 2004–2008 and 2008–2016 (Figure 1). This difference mainly was due to the transition of the heating energy mix in the Jing-Jin-Ji urban agglomeration put in place by Chinese government policy. For example, the Ministry of Environmental Protection launched the milestone policy of the “Issuance of the Action Plan for the Control of Air Pollution” (referred to as “Atmosphere Ten Plans”) in 2013, which aims to curb coal combustion and improve air quality [4]. In the same year, the “Detailed Rules for the Implementation of the Air Pollution Prevention and Control Action Plan in Jing-Jin-Ji Region and Surrounding Areas“ [5] was issued in response to the “Atmosphere Ten Plans”, which depended on a joint prevention and control method to mitigate air pollution in the Jing-Jin-Ji region. Such related policies led to significant changes in the heating energy mix and, thus, generated a great driving effect on the share of coal and share of gas to the changes of the DHEB in 2008–2016. Moreover, shifts between the positive and negative occurred regarding the effects of the share of CHP and the share of boilers in different subperiods. The significant shifts between positive and negative effects were largely associated with the implementation of the “elimination of old boilers” pushed by the Chinese government.
However, via the analysis in Section 3, at the subregion scale, we observed that the effects of the share of the energy mix and the share of the heat production technology were significantly different among regions. Thus, when interpreting the results, we must consider the different features in terms of policy and resource orientation between subregions. The different impact levels of the driving factors of the effects of the share of the energy mix and the share of the heat production technology of each subregion are further discussed in the following sections. Furthermore, considering the weak decoupling effect mainly found in the Jing-Jin-Ji urban agglomeration, it is suggested that the development of the district heating system of the building sector is no longer occurring at the expense of fast growth in energy consumption. The different impact levels of driving factors and decoupling modes of each subregion are also discussed in the following sections.

4.1. Beijing

For Beijing, the effects of the share of coal and the share of gas significantly affected the changes in the DHEB. For example, in 2012–2016, the effect of the share of coal contributed to −40.0% in the DHEB of Beijing (−0.1% of Hebei and −16.5% of Tianjin), while the effect of the share of gas caused a 40.5% increase in Beijing (0.1% of Hebei and 15.7% of Tianjin) (Figure 2). This result suggests that Beijing experienced the most advanced upgrading of the heating energy mix within the Jing-Jin-Ji urban agglomeration. In particular, the start of the transition of the heating energy mix in Beijing could be traced back to 2003 [31]. Coal combustion was gradually abandoned in Beijing’s core urban area and was replaced by clean energy, such as gas and electricity. Nonetheless, an acceleration of “coal to gas” has been seen since 2013, as the Beijing government started to implement the detailed rules of the “Atmosphere Ten Plans”. In 2014, the Beijing Environmental Protection Bureau designated a "coal abandoned area" in the whole urban area, and by the end of 2020, six districts in the city will be classified as being fully "coal abandoned" [32]. Our decomposition results, that the effect of share of gas contributes to the increase in the DHEB in Beijing in 2012–2016, proves the effect of the policy orientation.
However, regarding the effects of the share of CHP and the share of boilers, their effects on the changes in the DHEB tended to gradually decrease from 2004 to 2016 in Beijing. For example, the effect of the share of boilers reached 22.0% in 2004–2008, while it was only of 1.3% in 2012–2016 (Figure 2a). This result suggests that the change in the DHEB in Beijing has become increasingly irrelevant to the transition in the share of heat production technology over time. This mainly is due to a large proportion that was represented by the coal-fired CHP before 2010 but was replaced by gas-fired units after 2010 in Beijing’s district heating energy system. Unexpectedly, the traces of the effects of the share of CHP and the share of boilers in Beijing are different from that of Tianjin and Hebei, where the effects of the share of CHP and the share of boilers in 2008–2012 and 2012–2016 are significantly larger than those in 2004–2008 (Figure 2a).
Based on the decoupling results, we found that Beijing experienced expansive negative decoupling in 2004–2008 and then shifted to weak decoupling in 2008–2016. The expansive negative decoupling was due to the unexpected increase in the statistical data of the DHEB in the year of 2008. The decoupling status of the share of the energy mix (φcoal, φoil, and φgas) and the share of heat production technology (φCHP and φBoiler) fluctuated over time, and the sum of the values nearly equaled zero during the time period of 2004–2016. Specifically, the decoupling status of φgas showed an expansive negative decoupling in 2012–2016 (Table 2), which suggested that the development of Beijing’s district heating system of the building sector was highly dependent on the use of gas in this period. In contrast, the role of coal was strongly decoupled in 2012-2016 (φcoal = −1.521).

4.2. Tianjin

For Tianjin, the effects of the share of coal and the share of gas played an important role in the changes in the DHEB of Tianjin; however, their impact levels were much smaller than those of Beijing. Regarding the 2012–2016 period, the effects of the share of coal and share of gas were −16.5% and 15.7% in Tianjin (Figure 2b), and −40.0% and 40.5% for that in Beijing, respectively. This finding suggests that although a transition from coal to gas in the energy mix was experienced in Tianjin in 2012–2016 in response to the “Atmosphere Ten Plans”, there is still enough space for further implementation of gas in the urban district heating systems compared to the upgraded level of Beijing. Furthermore, the effect of the share of CHP in Tianjin appeared to positively contribute to the increase in the DHEB in 2008–2016. This finding suggested that the newly built CHP represented a greater proportion of energy in the district heating systems of Tianjin in 2008–2016.
The decoupling status of Tianjin mainly showed a weak decoupling during 2004–2016. In contrast to Beijing, the fluctuation of the decoupling status of Tianjin was slight. For example, regarding the period of 2012–2016, the decoupling status of Beijing experienced a shift from strong decoupling to weak decoupling and was then gradually reinforced, while that of Tianjin remained at the shallow levels of weak decoupling (0.304–0.387), excluding 2013–2014 (Table A3). This finding suggests that although the district heating system of Tianjin appears to represent weak decoupling, it still lacks sufficient drivers for decoupling compared to that of Beijing.

4.3. Hebei

For Hebei, lower impact levels were identified for the effects of the share of coal, share of oil, and share of gas on the changes in the DHEB in 2004–2016 compared to those in Beijing and Tianjin. This finding suggests that limited promotion has been achieved for the energy mix in Hebei’s district heating systems. As an important part of Jing-Jin-Ji, both the energy mix and the heat production technology structure need to be upgraded in response to the “Atmosphere Ten Plans”. However, the upgrading of the energy mix is not significant in the urban district heating systems of Hebei (Figure 2c). This result could mainly be due to the urgent priority to carry out “coal replacement” in rural households to mitigate air pollution in Hebei during this period [33], rather than for the urban district heating system. Thus, it is necessary to accelerate the optimization of the primary fuel mix in Hebei’s urban district heating system in the future. Furthermore, the effect of the share of CHP of Hebei appears to represent a similar development trend as that of Tianjin, which showed a positive contribution to the increase in the DHEB in 2008-2016. The decoupling status of Hebei also had a similar trend as that of the Jing-Jin-Ji urban agglomeration, which mainly showed weak decoupling during 2004–2016, although the decoupling status of each subsector fluctuated between strong decoupling and weak decoupling.

5. Conclusions

In this study, a novel decomposition framework was developed to analyze the driving factors of the district heating energy consumption of the building sector (DHEB) in the Jing-Jin-Ji urban agglomeration in 2004–2016. The drivers include the effects of the shares of coal, gas and oil, the effects of the shares of combined heat and power (CHP) and heating boilers, the heating area effect, the heating energy intensity effect, and the population effect. Then, the Tapio decoupling model was used to investigate the decoupling states between the DHEB and GDP of the Jing-Jin-Ji urban agglomeration, along with the decoupling effect of each subsector. A significant effect of the shares of the energy mix and the shares of heating production technology was identified in the Jing-Jin-Ji urban agglomeration in 2004–2016 in response to government policy. However, different features in terms of policy and resource orientation were also found between Beijing, Tianjin, and Hebei in the Jing-Jin-Ji urban agglomeration in 2004–2016 in response to government policy. The main conclusions are as follows:
(1) The main decoupling status between the DHEB and economic growth of the Jing-Jin-Ji urban agglomeration showed weak decoupling in 2004–2016. The increase in the DHEB of the Jing-Jin-Ji urban agglomeration was consistently driven by the growth of the district heating area and population in 2004–2016, while the heating energy intensity played a negative role. The effect of the share of coal experienced a transition from a positive effect in increasing DHEB in 2004–2008 to a negative effect in 2008–2016, while the effect of the share of gas consistently played a positive role in 2004–2016. The effect of the share of CHP negatively contributed to the increase in the DHEB in 2004–2008 and had a significant, positive effect in 2008–2016. In contrast, the effect of the share of heating boilers had an adverse effect on the DHEB changes during the same period.
(2) Beijing experienced expansive negative decoupling 2004–2008 and then shifted to weak decoupling in 2008–2016. The effects of the share of coal and the share of gas significantly affected the changes in the DHEB. Beijing has the most advanced upgrades of the heating energy mix within the Jing-Jin-Ji urban agglomeration. However, the effects of the share of CHP and the share of boilers tended to degrade over time due to the large share of CHP in history.
(3) The fluctuation of the decoupling status of Tianjin was very slight and showed weak decoupling during 2004–2016. A significant transition from coal to gas in the energy mix was experienced in Tianjin in 2012–2016 in response to the “Atmosphere Ten Plans”, but the level was much smaller than that of Beijing. CHP appeared to represent a greater proportion of energy in the district heating systems of Tianjin over time.
(4) The decoupling status of Hebei mainly showed weak decoupling during 2004–2016. Limited promotion has been achieved for transitioning from coal to gas in the energy mix in Hebei’s district heating systems compared to that seen in Beijing and Tianjin, which occurs in response to the “Atmosphere Ten Plans”. Furthermore, the effect of the share of CHP in Hebei positively contributed to the increase in the DHEB in 2008–2016.

Author Contributions

Conceptualization, L.Z.; methodology, L.Z.; software, L.Z.; validation, X.M.; writing—original draft preparation, L.Z.; writing—review and editing, X.M. and S.Z.; supervision, S.Z. All authors have read and agreed to the published version of the manuscript.

Funding

This work was supported by the Program of Introducing Talents of Discipline to University (B13012).

Conflicts of Interest

The authors declare no conflicts of interest.

Appendix A

Figure A1. Map of Jing-Jin-Ji urban agglomeration.
Sustainability 12 02555 g0a1
Table A1. The energy consumption and growth rate of district heating systems of the building sector in China and Jing-Jin-Ji urban agglomeration from 2004 to 2016.
2004200520062007200820092010201120122013201420152016
DHEB (PJ) (China)1738187319792070233624292685263827863020312934003545
GR (%) (C)-814193440545260748096104
DHEB (PJ) (JJJ)365408428406556613640645658702728756803
GR (%) (JJJ)-12171152687577809299107120
Note: Data of DHEB is originated from the China Urban–Rural Construction Statistical Yearbook [20]. The DHEB represents the district heating energy consumption of the building sector; GR represents the growth rate of DHEB in a specific year compared to 2004; JJJ is the abbreviation of Jing-Jin-Ji urban agglomeration.
Table A2. The district heating area and population in the Jing-Jin-Ji urban agglomeration from 2004 to 2016.
2004200520062007200820092010201120122013201420152016
Area (million m2) (JJJ)5686436917608859541094120012721377143315491710
Area (million m2) (BJ)282317350372425442467508526546568585611
Area (million m2) (TJ)114140151169192206240272300329342377418
Area (million m2) (HB)172186189219267306387420447502523588681
Pop (million) (JJJ)42474851535659616366677072
Pop (million) (BJ)12131414151617171818191919
Pop (million) (TJ)688991010111212121313
Pop (million) (HB)24262728293132333435363840
Note: Data of district heating area originated from the China Urban–Rural Construction Statistical Yearbook [20]. Data of population originated from the China Statistical Yearbook [27]. JJJ is the abbreviation of Jing-Jin-Ji urban agglomeration; BJ is the abbreviation of Beijing; TJ is the abbreviation of Tianjin; HB is the abbreviation of Hebei; Pop is the abbreviation of population.
Table A3. Total decoupling status between district heating energy consumption of the building sector and economic growth in the Jing-Jin-Ji urban agglomeration.
PeriodφHE,GDP (Jing-Jin-Ji)φHE,GDP (Beijing)φHE,GDP (Tianjin)φHE,GDP (Hebei)
2004–20050.9071.6151.0210.281
2005–20060.3660.0070.2970.715
2006–2007−0.368−0.435−0.016−0.531
2007–20082.5909.2880.1740.553
2008–20090.8492.6820.245−0.236
2009–20100.333−0.0170.2320.658
2010–20110.063−0.131−0.2410.480
2011–20120.150−0.2470.3850.161
2012–20130.547−0.6140.3041.648
2013–20140.3460.581−0.0960.606
2014–20150.3570.2380.2980.480
2015–20160.5490.7020.3870.546

References

  1. Building Energy Conservation Research Center (BECRC) & International Energy Agency (IEA). District Energy Systems in China: Options for Optimization and Diversification; International Energy Agency (IEA): Paris, France, 2017. [Google Scholar]
  2. Building Energy Conservation Research Center (BECRC), Tsinghua University. Annual Report on China Building Energy Efficiency 2017; Architecture & Building Press: Beijing, China, 2017. [Google Scholar]
  3. Lu, Z.; Huang, L.; Liu, J.; Zhou, Y.; Chen, M.; Hu, J. Carbon Dioxide Mitigation co-Benefit Analysis of Energy-Related Measures in the Air Pollution Prevention and Control Action Plan in the Jing-Jin-Ji Region of China. In Resources, Conservation & Recycling; Spring: Berlin/Heidelberg, Germany, 2019. [Google Scholar]
  4. Ministry of Environmental Protection. Issuance of the Action Plan for the Control of Air Pollution; Ministry of Environmental Protection: Beijing, China, 2013.
  5. Ministry of Environmental Protection. Detailed Rules for the Implementation of the Air Pollution Prevention and Control Action Plan in Jing-Jin-Ji Region and Surrounding Areas; Ministry of Environmental Protection: Beijing, China, 2013.
  6. Song, Y.; Li, Z.; Yang, T.; Xia, Q. Does the expansion of the joint prevention and control area improve the air quality?—Evidence from China’s Jing-Jin-Ji region and surrounding areas. Sci. Total Environ. 2020, 706, 136034. [Google Scholar] [CrossRef] [PubMed]
  7. Feng, Y.; Ning, M.; Lei, Y.; Sun, Y.; Liu, W.; Wang, J. Defending blue sky in China: Effectiveness of the “Air Pollution Prevention and Control Action Plan” on air quality improvements from 2013 to 2017. J. Environ. Manag. 2019, 252, 109603. [Google Scholar] [CrossRef] [PubMed]
  8. Bissiri, M.; Reis, I.F.G.; Figueiredo, N.C.; Pereira da Silva, P. An econometric analysis of the drivers for residential heating consumption in the UK and Germany. J. Clean. Prod. 2019, 228, 557–569. [Google Scholar] [CrossRef]
  9. Sandu, S.; Yang, M.; Mahlia, T.M.I.; Wongsapai, W.; Ong, H.C.; Putra, N.; Rahman, S.M.A. Energy-Related CO2 Emissions Growth in ASEAN Countries: Trends, Drivers and Policy Implications. Energies 2019, 12, 4650. [Google Scholar] [CrossRef] [Green Version]
  10. Thomas, S.; Rosenow, J. Drivers of increasing energy consumption in Europe and policy implications. Energy Policy 2020, 137, 111108. [Google Scholar] [CrossRef]
  11. Fan, J.-L.; Liao, H.; Liang, Q.-M.; Tatano, H.; Liu, C.-F.; Wei, Y.-M. Residential carbon emission evolutions in urban–rural divided China: An end-use and behavior analysis. Appl. Energy 2013, 101, 323–332. [Google Scholar] [CrossRef]
  12. Liu, Z.; Zhao, T. Contribution of price/expenditure factors of residential energy consumption in China from 1993 to 2011: A decomposition analysis. Energy Convers. Manag. 2015, 98, 401–410. [Google Scholar] [CrossRef]
  13. Yan, Y.; Pan, A.; Wu, C.; Gui, S. Factors Influencing Indirect Carbon Emission of Residential Consumption in China: A Case of Liaoning Province. Sustainability 2019, 11, 4414. [Google Scholar] [CrossRef] [Green Version]
  14. Fan, J.-L.; Zhang, Y.-J.; Wang, B. The impact of urbanization on residential energy consumption in China: An aggregated and disaggregated analysis. Renew. Sustain. Energy Rev. 2017, 75, 220–233. [Google Scholar] [CrossRef]
  15. Román-Collado, R.; Colinet, M.J. Are labour productivity and residential living standards drivers of the energy consumption changes? Energy Econ. 2018, 74, 746–756. [Google Scholar] [CrossRef]
  16. Nie, H.; Kemp, R.; Xu, J.; Vasseur, V.; Fan, Y. Drivers of urban and rural residential energy consumption in China from the perspectives of climate and economic effects. J. Clean. Prod. 2018, 172, 2954–2963. [Google Scholar] [CrossRef]
  17. Fan, W.; Meng, M.; Lu, J.; Dong, X.; Wei, H.; Wang, X.; Zhang, Q. Decoupling Elasticity and Driving Factors of Energy Consumption and Economic Development in the Qinghai-Tibet Plateau. Sustainability 2020, 12, 1326. [Google Scholar] [CrossRef] [Green Version]
  18. Liang, Y.; Cai, W.; Ma, M. Carbon dioxide intensity and income level in the Chinese megacities’ residential building sector: Decomposition and decoupling analyses. Sci. Total Environ. 2019, 677, 315–327. [Google Scholar] [CrossRef]
  19. Ma, M.; Cai, W.; Cai, W.; Dong, L. Whether carbon intensity in the commercial building sector decouples from economic development in the service industry? Empirical evidence from the top five urban agglomerations in China. J. Clean. Prod. 2019, 222, 193–205. [Google Scholar] [CrossRef]
  20. Ministry of Housing and Urban-Rural Development of the People’s Republic of China (MOHURD). China Urban-Rural Construction Statistical Yearbook 2005–2017; China Planning Press: Beijing, China, 2018. [Google Scholar]
  21. Zhao, X.; Zhang, X.; Li, N.; Shao, S.; Geng, Y. Decoupling economic growth from carbon dioxide emissions in China: A sectoral factor decomposition analysis. J. Clean. Prod. 2017, 142, 3500–3516. [Google Scholar] [CrossRef]
  22. Ang, B.W. Decomposition analysis for policymaking in energy: Which is the preferred method? Energy Policy 2004, 32, 1131–1139. [Google Scholar] [CrossRef]
  23. Ang, B.W. The LMDI approach to decomposition analysis: A practical guide. Energy Policy 2005, 33, 867–871. [Google Scholar] [CrossRef]
  24. Guan, D.; Meng, J.; Reiner, D.M.; Zhang, N.; Shan, Y.; Mi, Z.; Shao, S.; Liu, Z.; Zhang, Q.; Davis, S.J. Structural decline in China’s CO2 emissions through transitions in industry and energy systems. Nat. Geosci. 2018, 11, 551–555. [Google Scholar] [CrossRef]
  25. National Bureau of Statistics. China Energy Statistical Yearbook 2005–2017; China Statistics Press: Beijing, China, 2005–2017.
  26. Tapio, P. Towards a theory of decoupling: Degrees of decoupling in the EU and the case of road traffic in Finland between 1970 and 2001. Transp. Policy 2005, 12, 137–151. [Google Scholar] [CrossRef] [Green Version]
  27. National Bureau of Statistics of China (NBS). China Statistical Year Book 2005–2017; China Statistical Press: Beijing, China, 2017.
  28. Hardt, L.; Owen, A.; Brockway, P.; Heun, M.K.; Barrett, J.; Taylor, P.G.; Foxon, T.J. Untangling the drivers of energy reduction in the UK productive sectors: Efficiency or offshoring? Appl. Energy 2018, 223, 124–133. [Google Scholar] [CrossRef]
  29. Ou, J.; Meng, J.; Shan, Y.; Zheng, H.; Mi, Z.; Guan, D. Initial Declines in China’s Provincial Energy Consumption and Their Drivers. Joule 2019, 3, 1163–1168. [Google Scholar] [CrossRef]
  30. Zhang, C.; Su, B.; Zhou, K.; Yang, S. Analysis of electricity consumption in China (1990–2016) using index decomposition and decoupling approach. J. Clean. Prod. 2019, 209, 224–235. [Google Scholar] [CrossRef]
  31. Sohu. 2017. Available online: https://www.sohu.com/a/132589065_697078 (accessed on 30 June 2019).
  32. Beijing Environmental Protection Bureau. Delimitation Plan of Heavy Pollution Fuel Forbidden Zone of Beijing; Beijing Environmental Protection Bureau: Beijing, China, 2014. (In Chinese)
  33. Sohu. 2018. Available online: https://www.sohu.com/a/242328750_774804 (accessed on 30 June 2019). (In Chinese).
Figure 1. Contribution of drivers to the changes in district heating energy consumption of the building sector in the Jing-Jin-Ji urban agglomeration. Abbreviations: CHP (combined heat and power).
Sustainability 12 02555 g001
Figure 2. Contribution of drivers to the changes in district heating energy consumption of the building sector in three subregions of the Jing-Jin-Ji urban agglomeration. Abbreviations: CHP (combined heat and power).
Sustainability 12 02555 g002
Table 1. Decoupling states and classification by the Tapio model.
State ΔHE/HEΔGDP/GDPφHE,GDP
Negative decouplingExpansive negative decoupling>0>0(1.2, +∞)
Strong negative decoupling>0<0(−∞, 0)
Weak negative decoupling<0<0[0, 0.8)
DecouplingWeak decoupling>0>0[0, 0.8)
Strong decoupling<0>0(−∞, 0)
Recessive decoupling<0<0(1.2, +∞)
CouplingExpansive coupling>0>0[0.8, 1.2]
Recessive coupling<0<0[0.8, 1.2]
Table 2. Decoupling statuses between district heating energy consumption of the building sector and economic growth in the Jing-Jin-Ji urban agglomeration in three subperiods.
PeriodIndicatorJing-Jin-JiBeijingTianjinHebei
2004–2008φHE,GDP0.8522.3540.315−0.038
φcoal0.0410.0410.0120.024
φoil−0.099−0.332−0.009−0.029
φgas0.0590.292−0.0030.005
φI−0.0461.197−0.446−0.831
φA0.4030.4930.0440.492
φP0.4950.6640.7170.302
φCHP−0.267−0.395−0.007−0.097
φBoiler0.2670.3950.0070.097
2008–2012φHE,GDP0.3230.5600.1450.303
φcoal−0.064−0.495−0.049−0.008
φoil0.0220.0220.0460.002
φgas0.0410.4730.0030.006
φI−0.374−0.256−0.271−0.267
φA0.3650.1600.1930.363
φP0.3320.6570.2230.207
φCHP0.0940.0980.0790.070
φBoiler−0.094−0.098−0.079−0.070
2012–2016φHE,GDP0.4540.2380.2290.831
φcoal−0.259−1.521−0.1580.001
φoil−0.002−0.0190.008−0.002
φgas0.2611.5400.1500.001
φI−0.221−0.355−0.1240.082
φA0.4000.3880.2290.438
φP0.2740.2050.1250.311
φCHP0.103−0.0510.0440.102
φBoiler−0.1030.051−0.044−0.102

