A Method to Estimate URT Passenger Spatial-Temporal Trajectory with Smart Card Data and Train Schedules


School of Traffic and Transportation, Beijing Jiaotong University, Beijing 100044, China
*
Author to whom correspondence should be addressed.
Sustainability 2020, 12(6), 2574; https://0-doi-org.brum.beds.ac.uk/10.3390/su12062574
Submission received: 18 February 2020
/
Revised: 16 March 2020
/
Accepted: 18 March 2020
/
Published: 24 March 2020
(This article belongs to the Collection Sustainable Rail and Metro Systems)
Abstract
:Precise estimation of passenger spatial-temporal trajectory is the basis for urban rail transit (URT) passenger flow assignment and ticket fare clearing. Inspired by the correlation between passenger tap-in/out time and train schedules, we present a method to estimate URT passenger spatial-temporal trajectory. First, we classify passengers into four types according to the number of their routes and transfers. Subsequently, based on the characteristic that passengers tap-out in batches at each station, the K-means algorithm is used to assign passengers to trains. Then, we acquire passenger access, egress, and transfer time distribution, which are used to give a probability estimation of passenger trajectories. Finally, in a multi-route case of the Beijing Subway, this method presents an estimation result with 91.2% of the passengers choosing the same route in two consecutive days, and the difference of route choice ratio in these two days is 3.8%. Our method has high accuracy and provides a new method for passenger microcosmic behavior research.
1. Introduction
Urban rail transit (URT) passenger route choice behavior is the core of passenger flow assignment and ticket fare clearing [1]. Under the condition of network operation and seamless transfer, passengers have plenty of routes to choose, which makes the estimation of route choice behavior difficult. Factors such as the design of the station, transfer convenience, and station service influence passenger behavior, making the estimation of passenger behavior very difficult. With the continuous growth of passenger volume, URT operation needs more precise estimation of passenger flow distribution. The precise estimation of passenger spatial-temporal trajectory is of great significance to station operation and train scheduling.
Traditional research adopts expected utility theory (EUT) to describe passenger route choice behavior. The EUT-based approach analyzes the factors considered by passengers when choosing a route such as the travel motivation, travel time, and transfer convenience [2]. By considering all these factors, an EUT-based model can predict the route choice behavior of passengers. This approach estimates passenger route choice result but ignores the spatial-temporal details of passengers in URT system. The EUT method has limitations when passenger flow distribution and evolution in smaller time granularity is needed. Smart card data collected by Passenger Automated Fare Collection System (AFC) provides a new idea for estimating passenger spatial-temporal trajectory. Compared with the EUT-based approach, the AFC data-based approach analyzes the passenger choice result rather than predicting passenger choice. And the result of data-based approach could in turn calibrate the parameters of the EUT-based model. Passenger trajectory estimation based on smart card data has attracted the attention of researchers in recent years [3]. It has the following advantages:
- Large data volume and easy access. The AFC system records millions of passenger travel data every day, which has lower cost to obtain comparing to traditional manual surveys.
- Provides actual RP data. Smart card data are all actual RP (Revealed Preference) data, which have higher authenticity than SP (Stated Preference) survey.
- Provides abundant hidden information. Each single smart card data only records simple information such as tap-in, tap-out time and station number, but large-scale smart card data can provide abundant hidden information, especially when combined with the train schedule data.
However, the existing methods for estimating passenger trajectory using smart card and train operation data still have some shortcomings. For example, statistical analysis methods from a macro perspective can hardly describe the travel behavior of individual passengers, while the methods from a micro perspective usually neglect the implicit information of passenger groups. How to mine passenger travel information from AFC data set and train schedules as much as possible become an important issue. In this paper, we cluster passenger tap-in and tap-out time with trains to estimate the distribution of passenger access, egress, and transfer time based on smart card data and train schedules. Then, we present a probabilistic method for estimating passenger spatial-temporal trajectory.
The paper is structured as follows. Section 2 reviews the earlier literature of passenger trajectory estimation. Section 3 is the backbone of this paper: first, we introduce the data set and passenger type classification; then, an estimation method for passenger access, egress and transfer time distribution is presented; finally, we present the passenger spatial-temporal trajectory estimation method. Section 4 delivers a case study of this method in Beijing Subway.
2. Literature Review
The passenger route choice problem is the core of the passenger flow assignment and ticket fare clearing. As the URT system usually adopts seamless transfer, the passenger travel information recorded by the AFC system cannot reflect the passenger choice behavior. To cope with this problem, researchers have devoted significant effort to passenger behavior modeling. An important modeling idea is to use the expected utility theory to describe the passenger choice behavior, assuming that passengers choose the route with the highest utility [4,5,6]. However, different from the urban road system, the increase of passenger flow in an URT route does not significantly affect the travel time on this route. Therefore, the route choice model based on utility maximization may cause the result of passenger flow assignment deviate from the truth. Compared with the deterministic utility theory (DUT), the random utility theory (RUT) is an expansion under the framework of the EUT. The RUT-based models can make up for the defect of DUT-based models by introducing a random error. A typical RUT-based model is the Logit model [7,8,9,10], which assumes that the utility random term is independent and obeys the Gumbel distribution. Because the Logit model assumes that the options are independent and has IIA characteristics, this assumption cannot be satisfied when the alternative route contains overlapping sections. With the deepening of research, the defects of the Logit model are improved in its application. To solve this problem, one solution is to introduce the Nested Logit model [11]. As the Nested Logit model may cause lots of parameters to be estimated and result in a heavy calculation burden, researchers try to make the alternative routes as independent as possible by simplifying the relationship between overlapping routes. The Path Size Logit (PSL) model built by Ben-Akiva [12], the Path Size Correction Logit (PSCL) model built by Bliemer [13], and the Recursive Logit (RL) model built by Nassir [2] adopt the above idea. In order to improve the EUT-based model, methods for fast route search are also applied [14].
Even though the EUT-based approach can describe the choice behavior of passengers, the precise spatial-temporal trajectories of passengers cannot be deduced by the EUT-based methods. On the other hand, the EUT-based methods need a large number of passenger choice results to calibrate parameters. Traditional passenger behavior research collects passenger travel details by Stated Preference (SP) or Revealed Preference (RP) survey, which is not only costly but also limited in data volume. Smart card data provides a new means for travel information collection. The methods for passenger route choice estimation based on smart card data can be divided into two categories—the aggregate method and the disaggregate method.
2.1. The Aggregate Method
The idea of the aggregate method is to mine effective information from large-scale smart card data by statistical analysis. One strategy is to study the relationship between passenger volume and individual behavior. Through analyzing historical smart card data, Silva et al. [15] proposed a method to predict passenger demand during transit disruption. Similarly, a method for estimating the number of passengers with different behaviors in a disruption event based on large scale smart card data was proposed by Sun et al. [16]. Chen et al. [17] proposed a method to analyze metro passenger travel distance by using smart card data. Further, Yu et al. [18] analyzed the space-time variation of passenger flow and commuting characteristics of residents using smart card data from the Nanjing metro.
Another strategy is to mine information hidden in passenger travel time. Sun et al. [19] used a Bayesian approach to estimate parameters such as link travel time, transfer time, and route choice ratio. The core idea of this approach is to mine the correlation between the travel time data set and those parameters. Lee et al. [3] constructed a Gaussian mixture model to analyze passenger travel time and estimated route choice ratio according to travel time distributions. Li et al. [20] adopted a Synchronous clustering algorithm to analyze travel time data trimmed by train schedules, and each cluster represents an effective route. In addition to the above statistical methods, scholars have introduced data fusion technology to estimate passenger route choice behavior. Kusakabe et al. [21] proposed a data fusion technology based on a naive Bayesian method, which fuses the SP survey and smart card data. This approach makes up for the shortcoming of smart card data which lack of personal information of passengers. In summary, the aggregate methods are applicable to the macroscopic study of passenger behavior because they analyze the aggregated characteristics of passenger groups and ignore individual behaviors.
2.2. The Disaggregate Method
The disaggregate method uses the data of typical passengers as a reference to accurately analyze behaviors of other passengers and is usually combined with train schedules. The difficulty of passenger trajectory estimation is that the traveling process in URT may include many links, such as entry walking, waiting a train, riding in train, transfer walking, and exit walking. Except for the fixed time of riding in train, all these link travel times are difficult to estimate due to passenger individual difference. Researchers had supplemented data through manual surveys. Zhu et al. [22] investigated the access and egress walking distance of each station and proposed a probabilistic Passenger-to-Train Assignment Model based on smart card data and train schedules. Although this model has strongly interpretation ability, it has weakness that the manual survey could not reflect the distribution of real passenger flow due to congestion in rush hours.
To solve these problems, a solution strategy is to simplify passenger behavior by putting forward reasonable assumptions. Under the assumption that passengers will choose the train which has minimum waiting time, Kusakabe et al. [23] took advantage of the difference between suburban railway trains, and estimated passengers’ train choice behavior. Zhou et al. [24] limited access and egress time to a certain range and assumed that the waiting time at each station are very close. Similarly, Sun et al. [25] assumed that passengers have the same fail to board (FtB) probability at the same station during a short period of time. According to this assumption, the passenger trajectories could be estimated by the timetable. All these methods can easily provide passenger trajectories, but due to the idealized assumptions, their estimation results may differ from actual behaviors of passengers.
Another strategy is to mine information from some typical passengers and carry out the estimation rely on their travel information. Sun et al. [26] noticed that the smart card data contains “typical passengers” who have the shortest travel time between the same OD pairs and inferred that these typical passengers’ waiting time were zero. Using the travel time of such typical passengers and the train schedules, the access and egress time of each station, and then the trajectories of passengers can be inferred. This approach was expanded to transfer passengers by Zhang et al. [27], Zhao et al. [28], and Zhao et al. [29]. Hong et al. [30] and Kim et al. [31] found that the tap-out time of passengers were concentrated in a short time after train arrival, which caused passenger arrival waves at fare gates. According to this characteristic, they proposed the concept of the “reference passenger” and estimated passenger trajectory by building a relationship between passengers and the trains. Hörcher et al. [32] classified passengers according to the number of their routes and transfers, and the route choice behavior of passengers can be deduced by using passengers who have a relatively simple trip as a reference.
In summary, the core idea of disaggregate methods is to mine typical passenger behaviors. By combining typical passenger information with train schedules, researchers can provide precise estimation of passenger trajectories. Compared with aggregate methods, disaggregate methods are applicable to the microscopic study of passenger behavior. The estimation accuracy of the disaggregate methods rely on typical passengers. However, due to the complexity of URT passenger behavior, the estimation based on passenger individuals may cause errors.
In this paper, we propose an approach combining the advantages of aggregate methods and disaggregate methods. We utilize the hidden information of passenger group and also give precise microscopic trajectory estimation.
3. Data and Methodology
3.1. Data and Assumptions
The smart card data and train schedules used in this paper were provided by Beijing Subway, the urban rail operator of Beijing. Smart card number, tap-in time, tap-in station, tap-out time, and tap-out station were completely recorded in the AFC system. The train schedules recorded the arrival and departure time of trains at each station.
This paper uses the access, egress, and transfer time distribution of each station to estimate passenger travel trajectory. However, those time distributions of each station will be different in each period. In order to simplify the problem, we think those distributions of the same station remain unchanged in a short period of time (for example, 30 min). Then, we have the following reasonable assumptions:
- Passengers riding to the same direction in the same station have the same access time distribution.
- Passengers arriving from the same direction in the same station have the same egress time distribution.
- Passengers transfer to the same direction in the same transfer station have the same transfer time distribution.
3.2. Passenger Classification
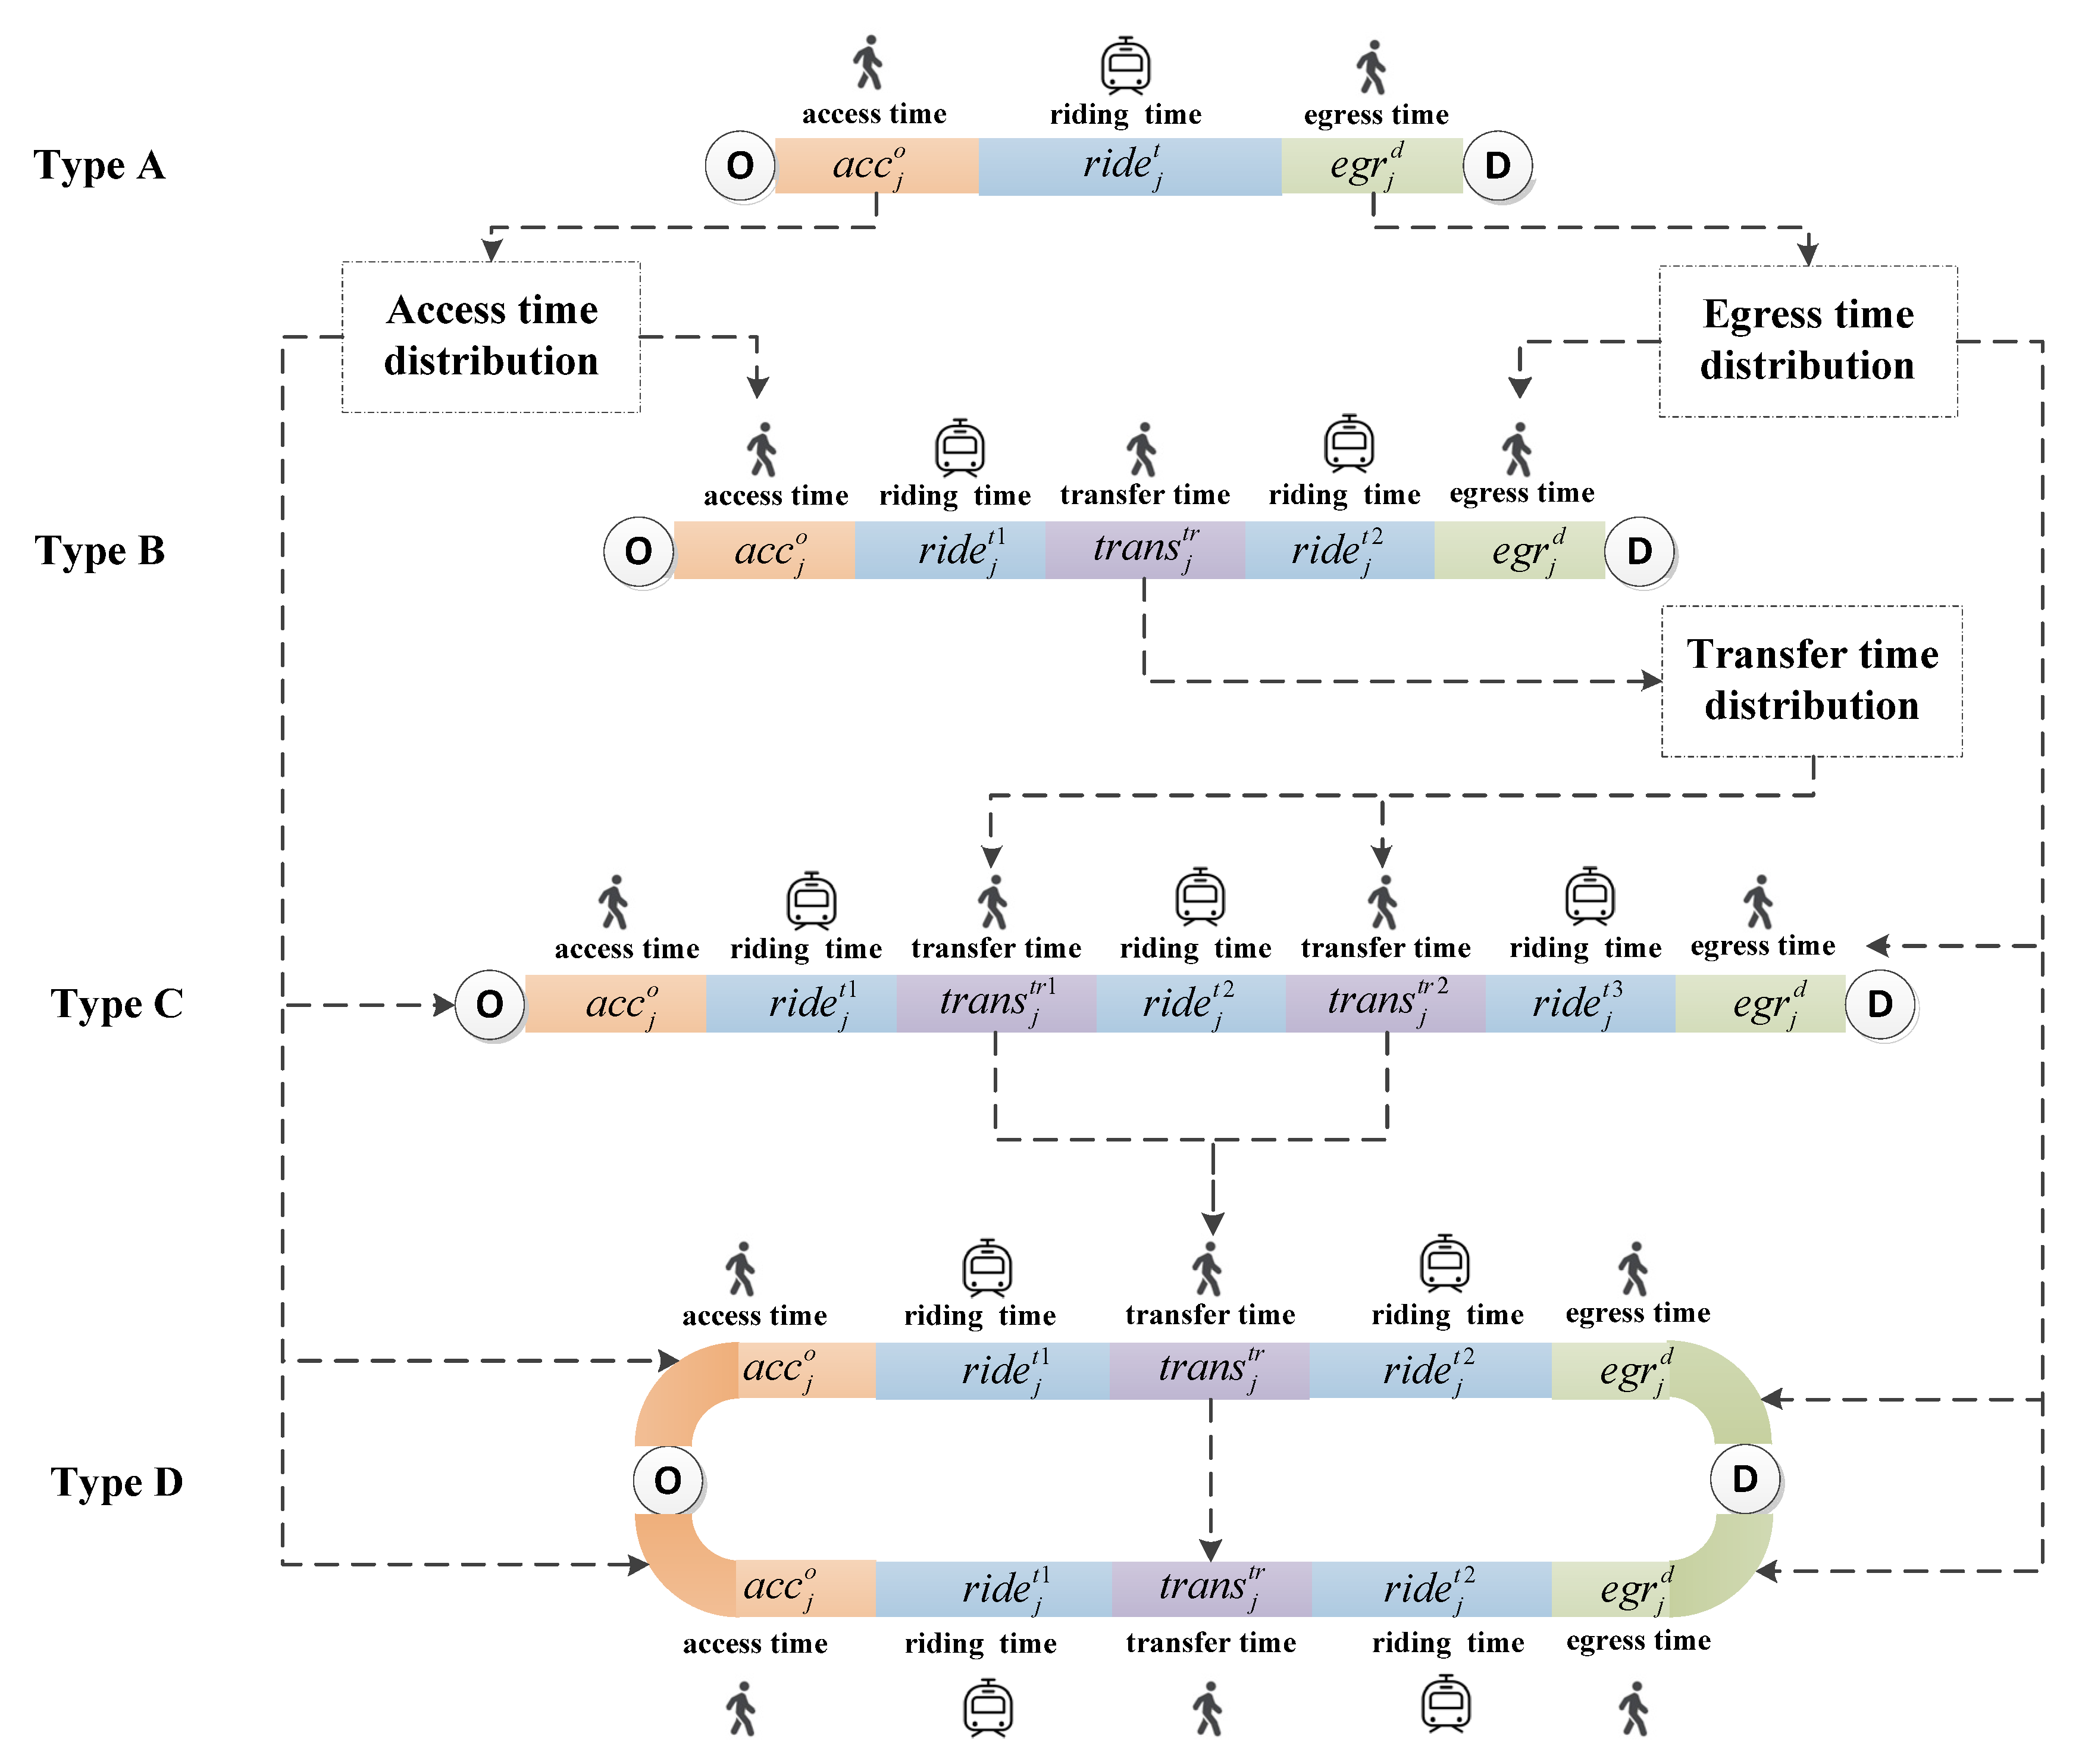
With the expansion of URT network, there are massive routes for the same OD trip. But some obviously unreasonable routes will not be considered by passengers. We call the "effective route" a route that passengers might consider. In order to balance the computational complexity and the number of alternative routes, we use 1.5 times the shortest route travel time as the effective route threshold [32], that is, only the routes with travel time less than 1.5 times the shortest route will be considered by passengers. According to the number of effective routes and the transfer number of a route, we classify passengers into the following four classes, and their travel process is shown in Figure 1.
- ▪
- Type A passengers have a single effective route and no transfer in the route;
- ▪
- Type B passengers have a single effective route and one transfer in the route;
- ▪
- Type C passengers have a single effective route and two or more transfer in the route;
- ▪
- Type D passengers have multiple effective route.
The purpose of passenger classification is to select passengers whose routes are unambiguous, and we use their trip information to estimate the choice of other passengers whose routes are ambiguous. Hörcher et al. [32] classified passengers into seven classes; they selected passengers with unique spatial-temporal trajectory as a reference to estimate passenger walking time distribution. However, according to Zhu et al. [22], passengers with unique spatial-temporal trajectory always have higher walking speed than other passengers. Taking these passengers as a reference may cause errors. Therefore, this paper presents an unbiased sampling method to obtain reference passengers and uses their trip information to estimate passenger walking time distribution.
3.3. Passenger Spatial-Temporal Trajectory Estimation
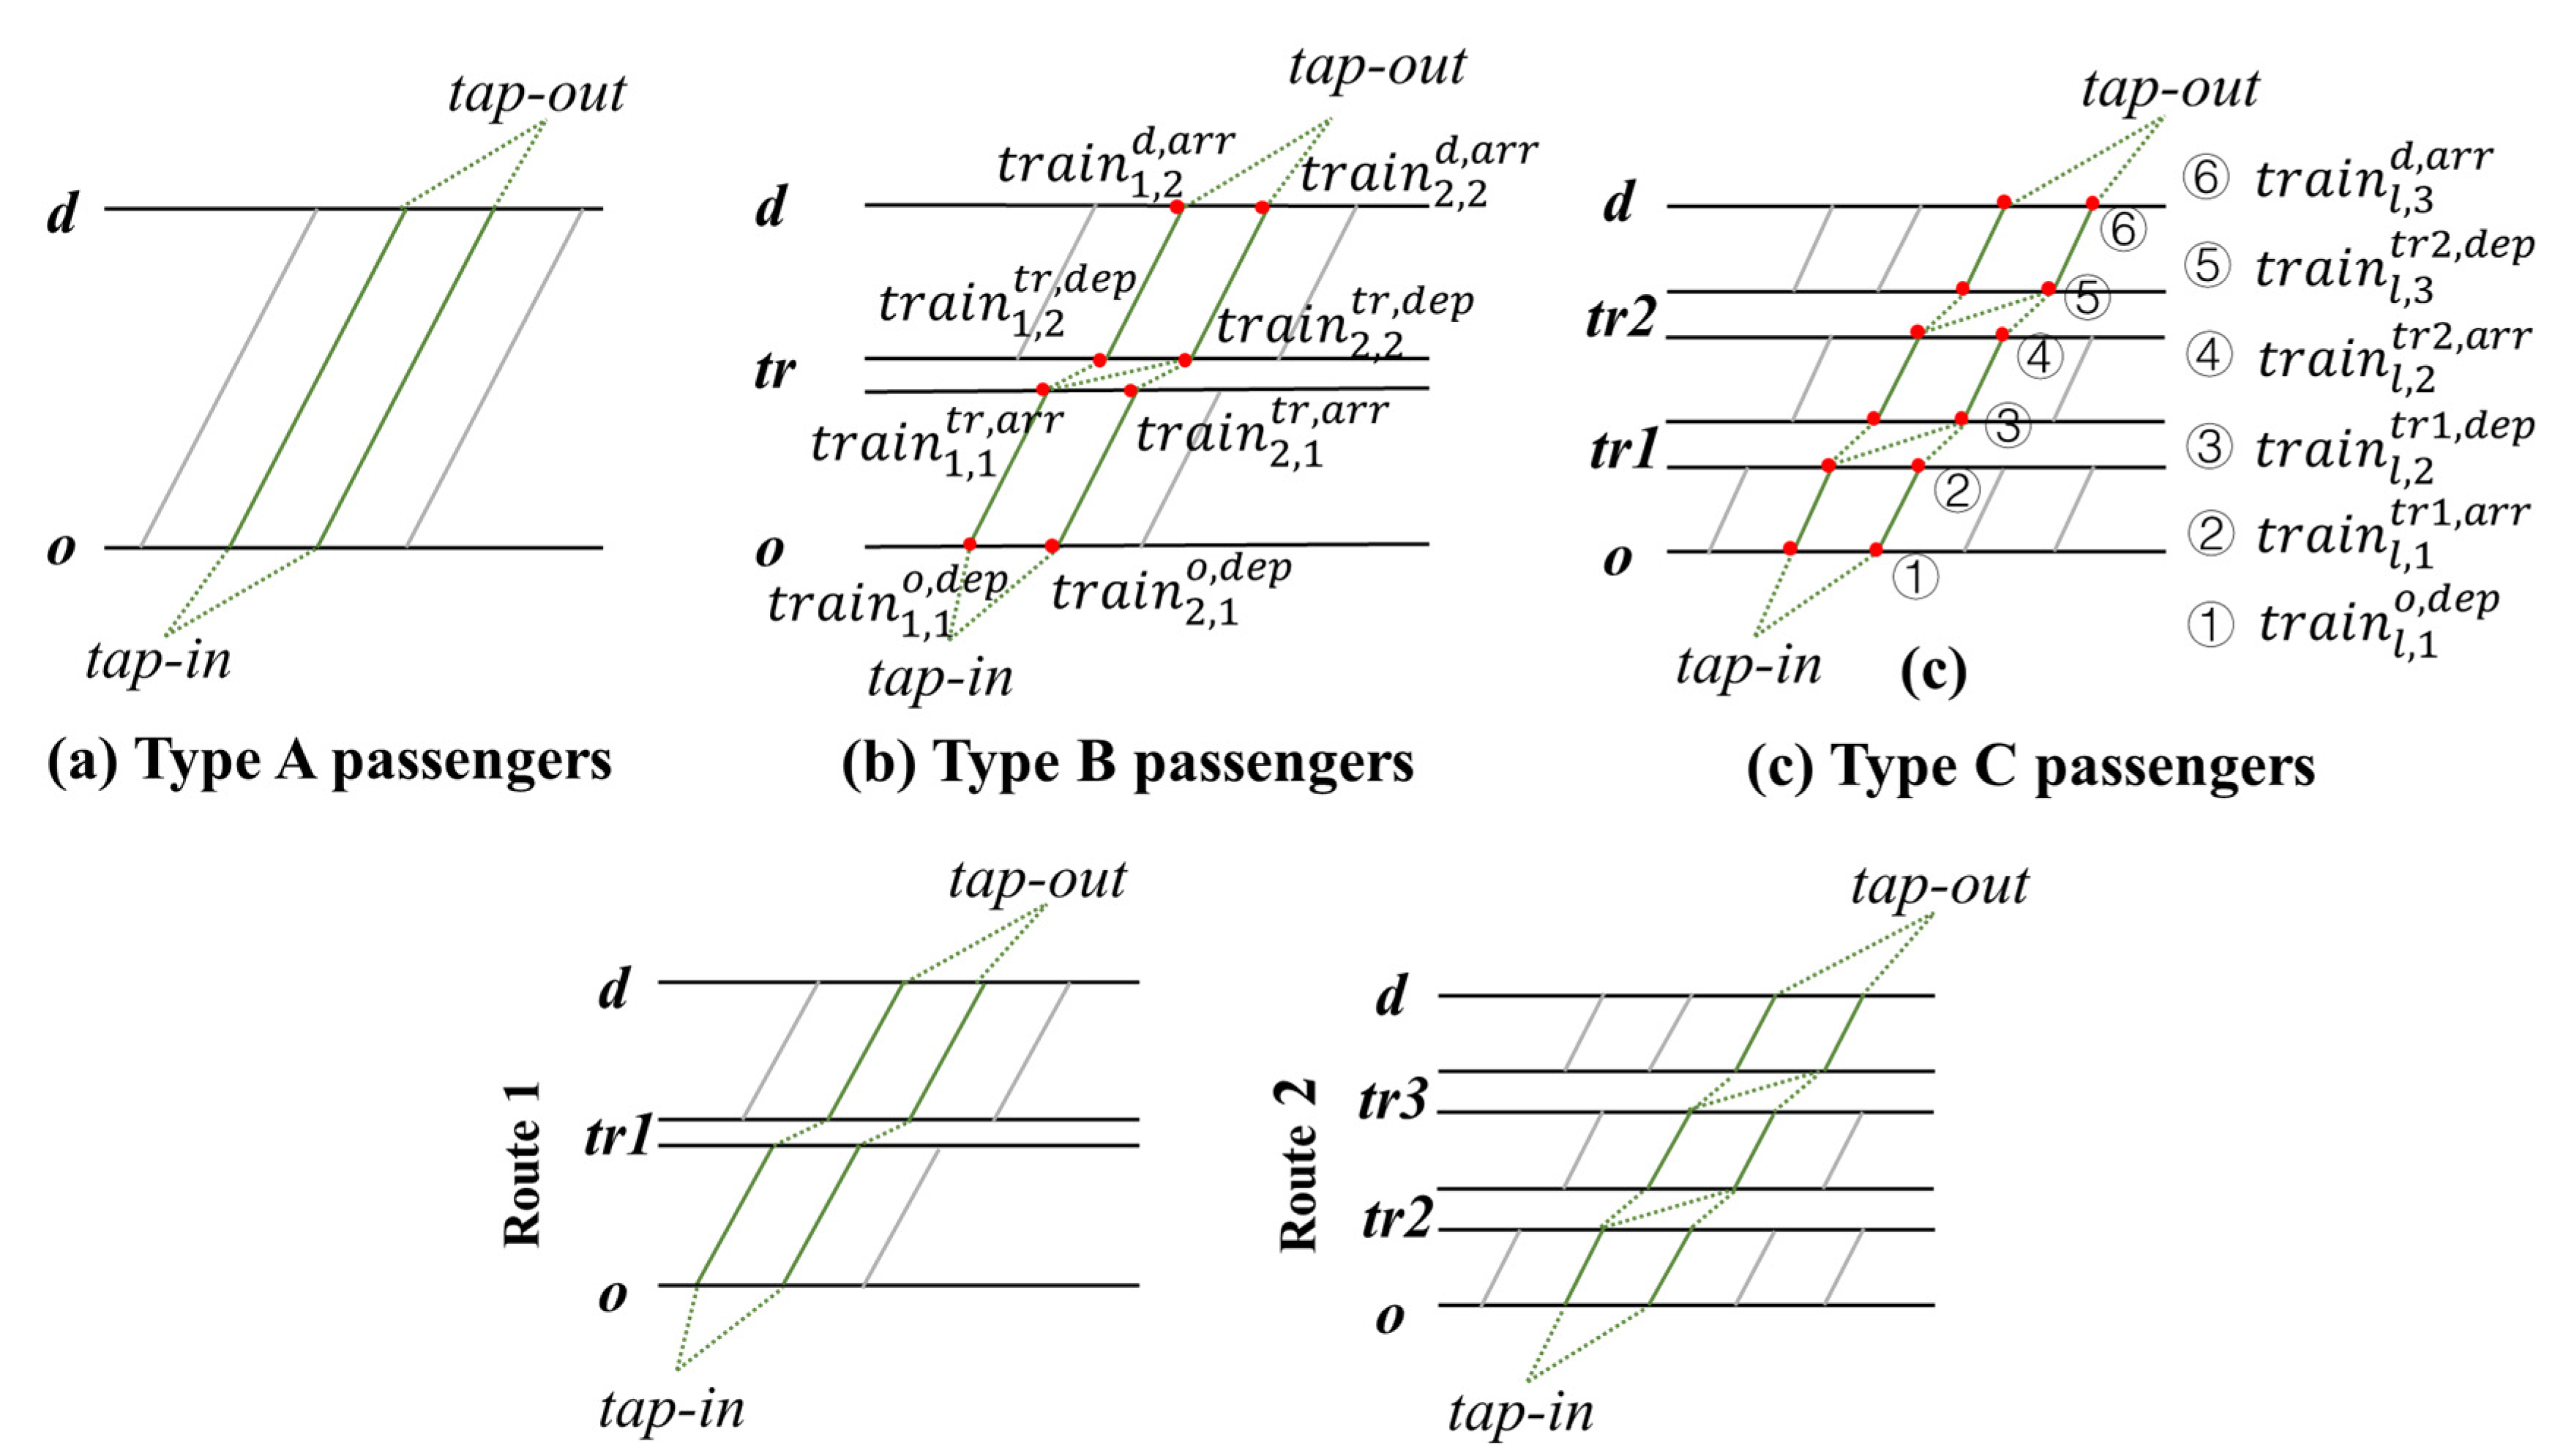
The spatial-temporal trajectory candidates of each type passengers are shown in Figure 2. In this section, we provide a method to find the true trajectory for each type of passengers. We propose a clustering-based approach to estimate the spatial-temporal trajectory of Type A passengers. We then use the access and egress time distribution acquired from the Type A passengers to estimate the spatial-temporal trajectory of Type B, C, and D passengers. The estimation process is shown in Figure 1.
3.3.1. Type A Passenger
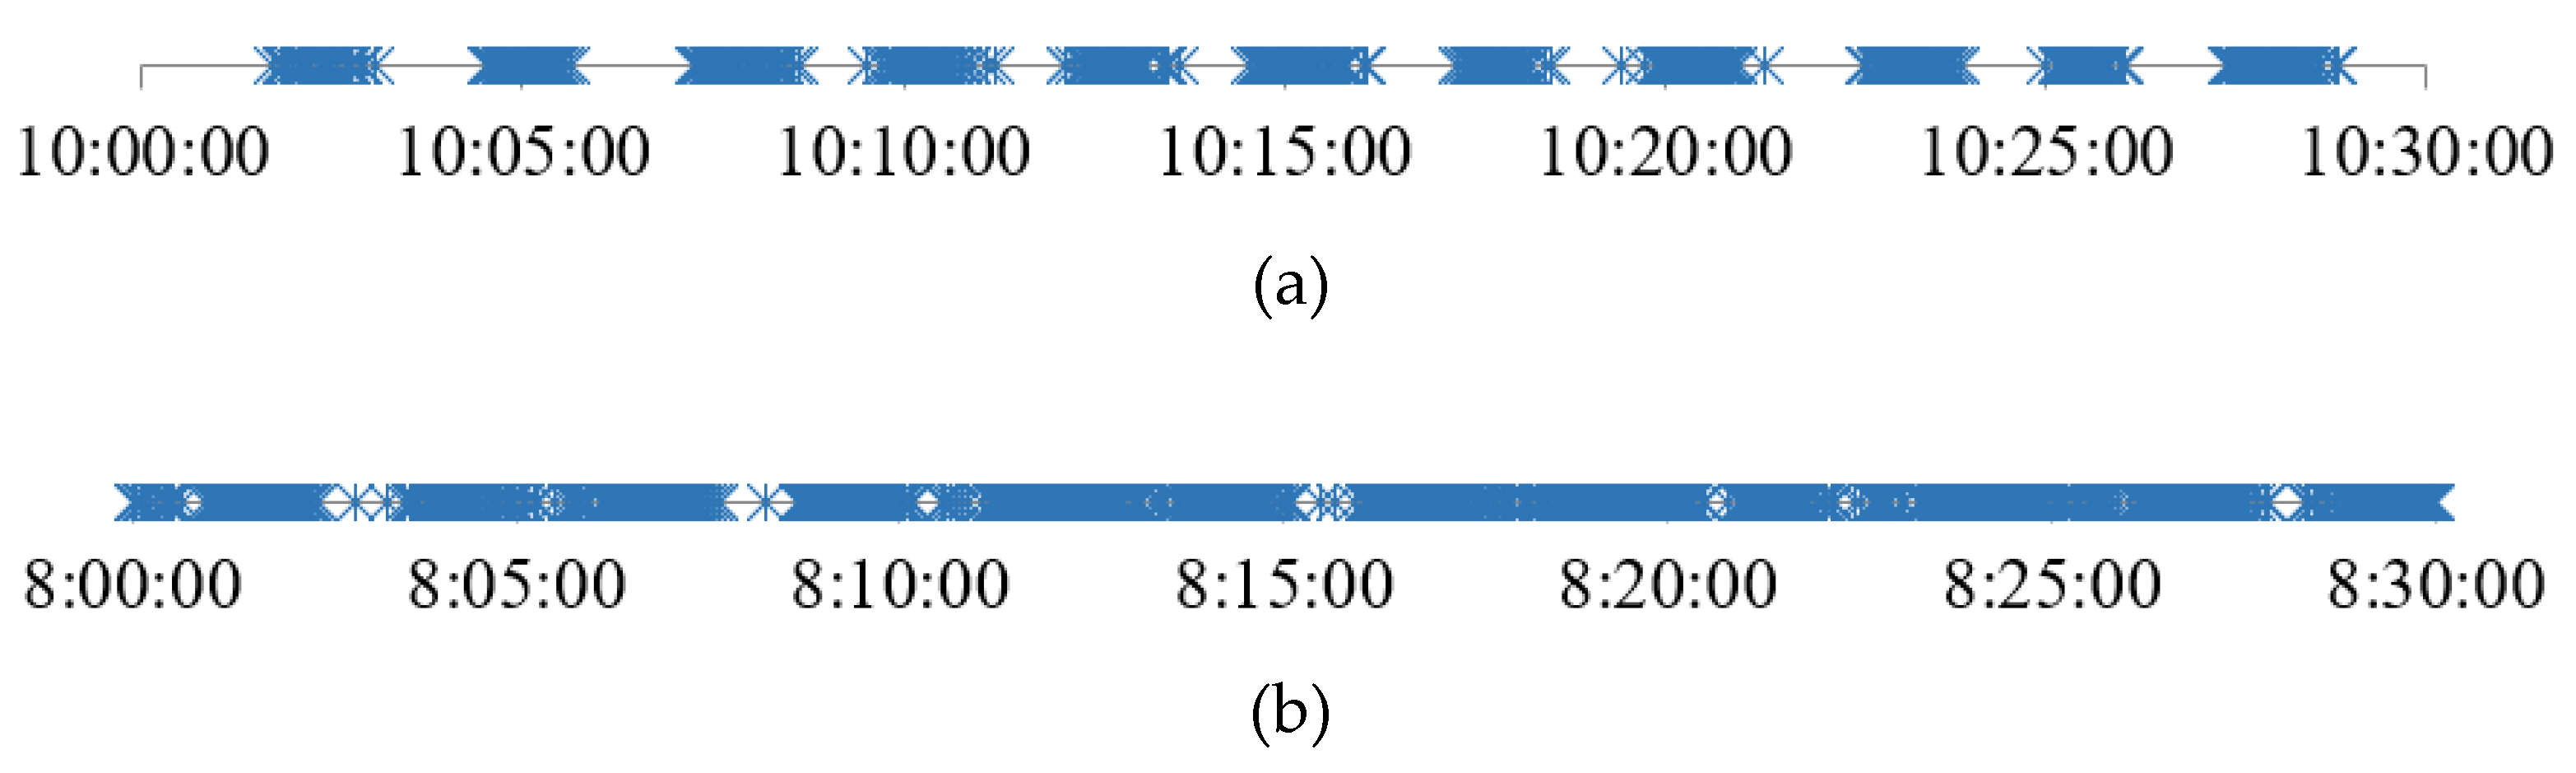
The Type A passenger has the simplest travel process and unambiguous route. Therefore, we estimate the access and egress time distribution based on smart card data of Type A passengers and train schedules. We show the passenger tap-out time of Beijing Subway Xierqi station in Figure 3. We can see passenger clustering is significant during off-peak hours (Figure 3a). Inspired by this characteristic, Zhang et al. [27], Zhao et al. [28], and Zhao et al. [29] chose the first tapping-out passengers from each cluster as a reference. Hong et al. [30] put forward the concept “alighting and boarding time intervals” based on tapping-out passenger clusters and used these time intervals to assign passengers to trains. As shown in Figure 3b, during peak hours, the tapping-out passenger clusters may overlap each other due to higher passenger volume and lower train interval. This makes it difficult to identify passenger clusters only by observation. In this paper, we present a clustering approach taking both passenger tap-in and tap-out time into account to directly estimate which train the Type A passengers rode.
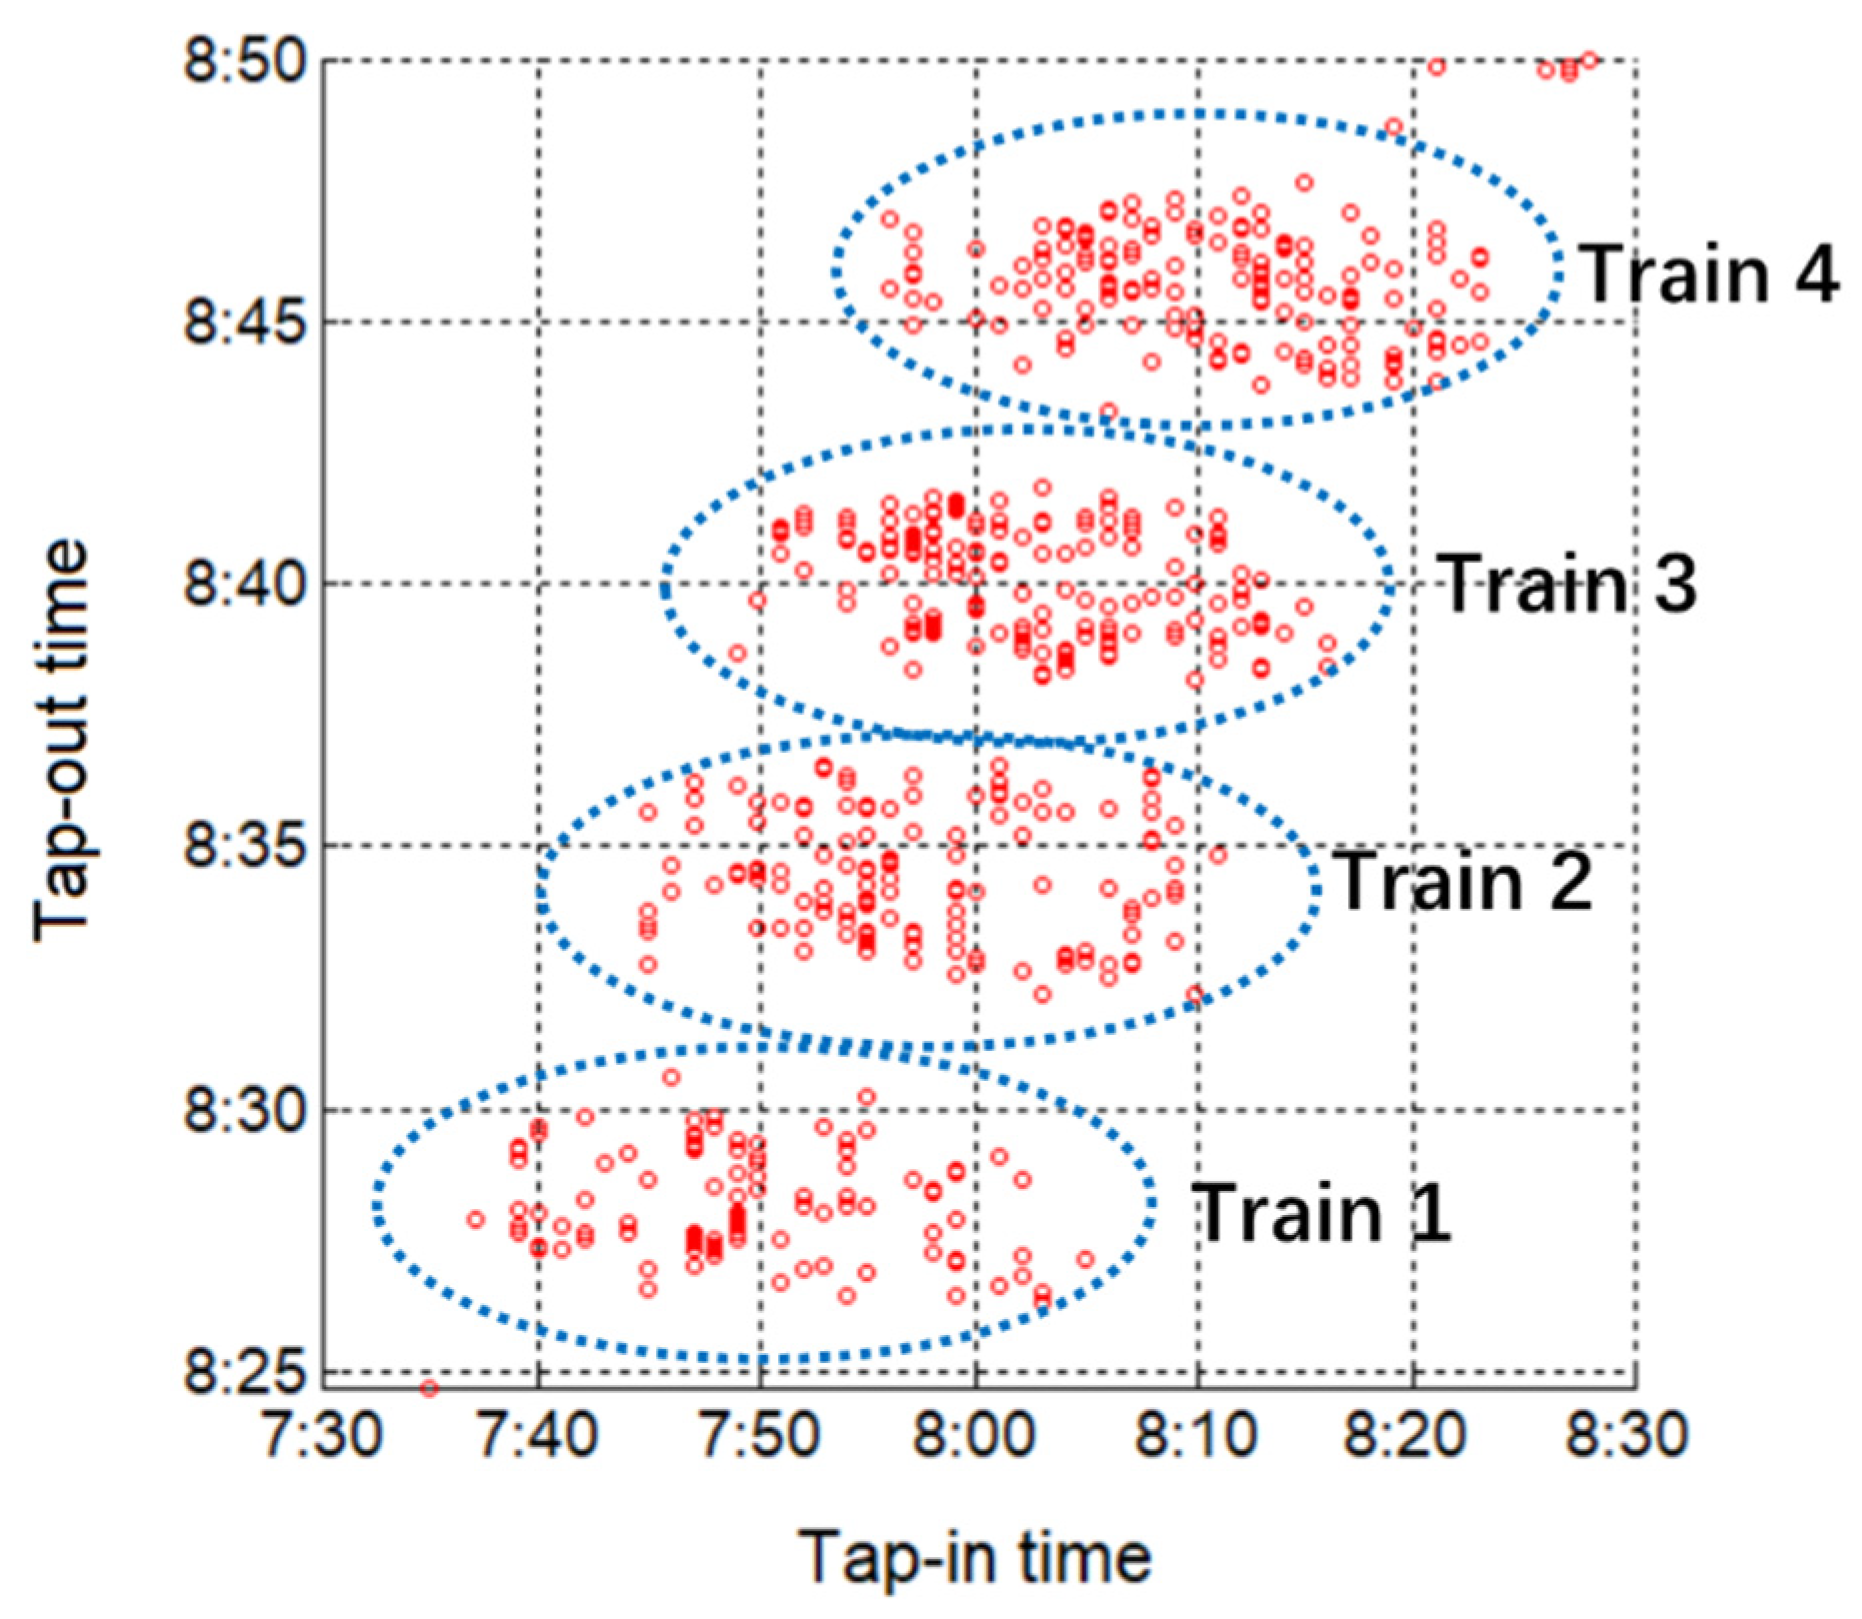
The tap-in and tap-out time distribution of passengers riding from Shahe station to Xierqi station on Beijing Subway Line Changping is shown in Figure 4. We can see notable clusters of passengers, and each cluster corresponds to a train which the passengers rode. We find that passengers with longer egress time also have longer access time than others. This consistent with the fact that passenger walking speed is stable during the whole trip. Therefore, by taking both the tap-in and tap-out time of Type A passengers into account, the passenger overlapping problem could be solved to a certain extent.
In this paper, we use the K-means clustering algorithm [33] to cluster passengers according to their tap-in and tap-out time. The K-means algorithm has the advantages of convenient and fast calculation. This algorithm iteratively updates the clustering center until the result no longer changes. The K-means algorithm has a disadvantage in that the number of clusters k needs to be given in advance. However, as the train schedules are known, the number of clusters k is equal to the number of trains running between these two stations. The access time contains access walking and waiting time and is far longer than the egress time due to failing to board in peak hours. Therefore, using Euclidean distance to directly calculate the distance between each sample data and cluster centers may overestimate the effect of access time. We present a scaling factor to zoom out the tap-in time of passengers. The distance between sample data and cluster center is calculated as
where is the data set of Type A passengers; is the number of trains/clusters, are the tap-in and tap-out time of passenger ; are the coordinate of the th cluster center; is the scaling factor between 0 and 1 which depends on the degree of “fail to board” and the headway of trains. For example, if a passenger fails to board one train due to the limit of train capacity, his access time will add an extra headway time. The more passengers fail to board or the higher the headway time is, the closer the value of is to 0. Conversely, the value of is closer to 1.
According to the clustering algorithm, each passenger from station O to station D will be assigned to a certain train . The access time and egress time of passenger could then be deduced by train schedules. By collecting the and of station o and d in the same period of time we can obtain the access time distribution of station o and the egress time distribution of station d.
3.3.2. Type B Passenger
The trip of Type B passengers contains one transfer. As shown in Figure 2b, a Type B passenger may have several spatial-temporal trajectory candidates in his available trajectory set . The diversity of the trajectories makes it difficult to estimate the true one directly through clustering. So, we present a probabilistic approach to estimate the trajectory of the Type B passengers based on the access and egress time distribution and .
First, we build an available spatial-temporal trajectory set for all according to these basic constraints:
where , , and are the access time at station , the egress time at station , and the transfer time at station of the th trajectory respectively. And , , , are shown in Figure 2b.
According to assumption 2 and 3 in Section 3.1, passengers who departure from station to station and transfer at station will have access time and egress time obeying the distribution and . The probability that being the true trajectory could be calculated by
We choose the trajectory with maximum probability as the estimation result, and the transfer time of passenger will be stored in the data set of transfer station to estimate the transfer time distribution .
3.3.3. Type C Passenger
The trip of Type C passenger contains multiple transfers. We use the access, egress, and transfer time distribution obtained from Type A and B passengers to estimate the trajectory of Type C passengers. The transfer stations in the trajectory of Type C passengers are denoted by . Like the Type B passengers, the available trajectory set of the Type C passengers is shown in Figure 2c. The probability that being the true trajectory can be calculated by
Then, we choose the trajectory with maximum probability as the estimation result.
3.3.4. Type D Passenger
The trip of Type D passenger contains multiple routes, and this makes it difficult to estimate their trajectories. To estimate the trajectory of a Type D passenger, we need to calculate the probability of all his available trajectories in the set (as shown in Figure 2d). For each alternative trajectory, its probability could be calculated by formula (5) or (6) according to the number of transfers. Finally, the trajectory with maximum probability is estimated as the true one.
4. Case Study
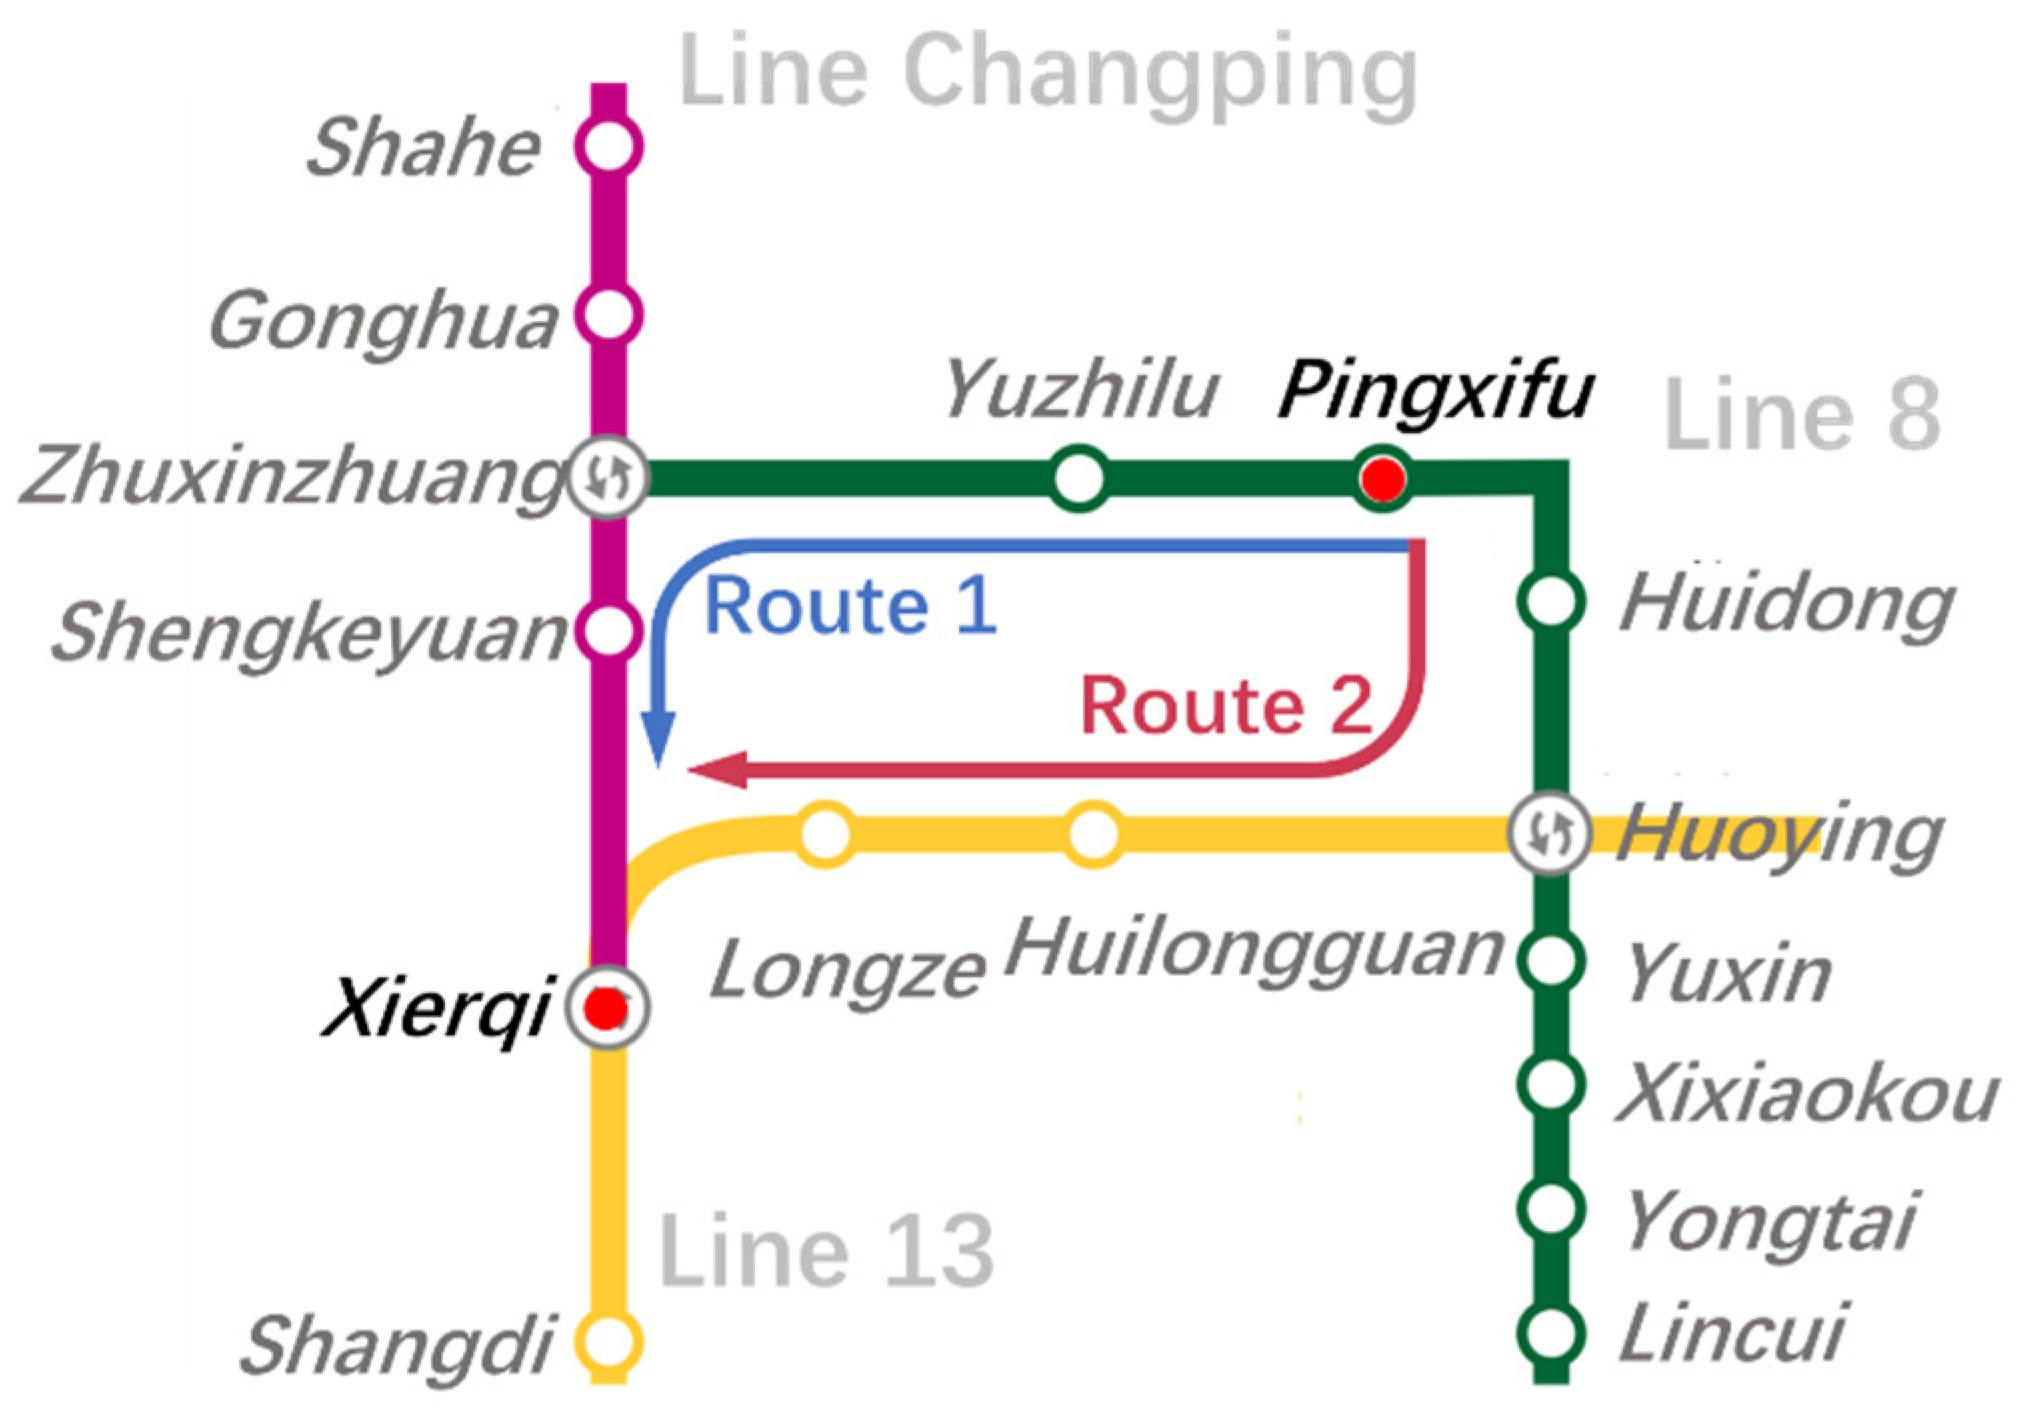
We take a typical OD pair (Pingxifu to Xierqi) in the morning rush hours (07:30–09:30) of two consecutive days (21–22 December 2016) in the Beijing Subway as an example to show the estimation process of our method. There were 207 and 199 passengers traveled between Pingxifu and Xierqi during this same period in these two days separately. Only 159 of them traveled both the consecutive days. As these two days are weekdays, we can think of these passengers as commuters and their choice behavior is relatively stable. Beijing Subway operates 19 metro lines with 345 stations, which forms a complex network by the end of January 2017. Passengers from Pingxifu to Xierqi station have two effective routes and belong to the Type D passenger. As shown in Figure 5, we choose this OD pair because the travel time of these two routes are extremely close. According to the train schedule, riding time of route 1 and route 2 are separately 15 minutes 33 seconds and 15 minutes 29 seconds, and both the two routes have one transfer. Obviously, it is difficult to identify the actual routes by using the EUT based methods or AFC based aggregate methods.
4.1. Access and Egress Time Estimation
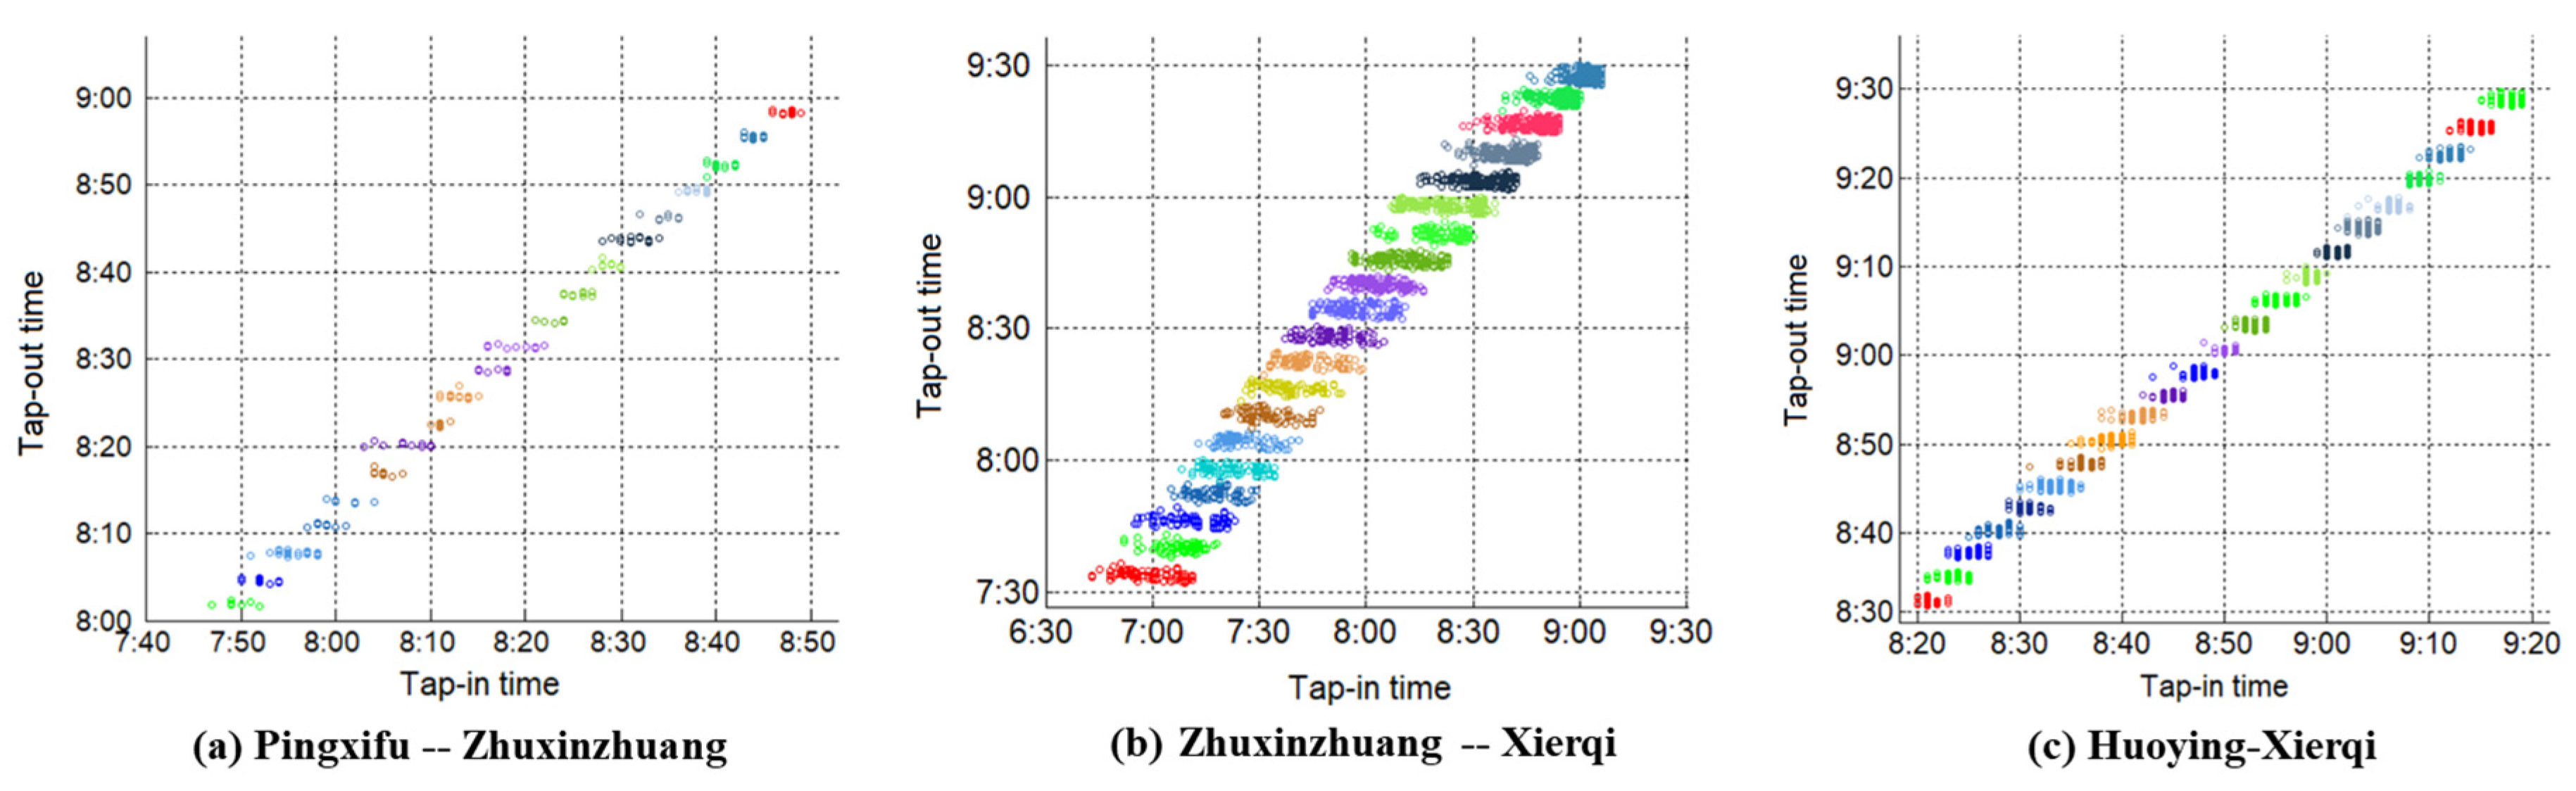
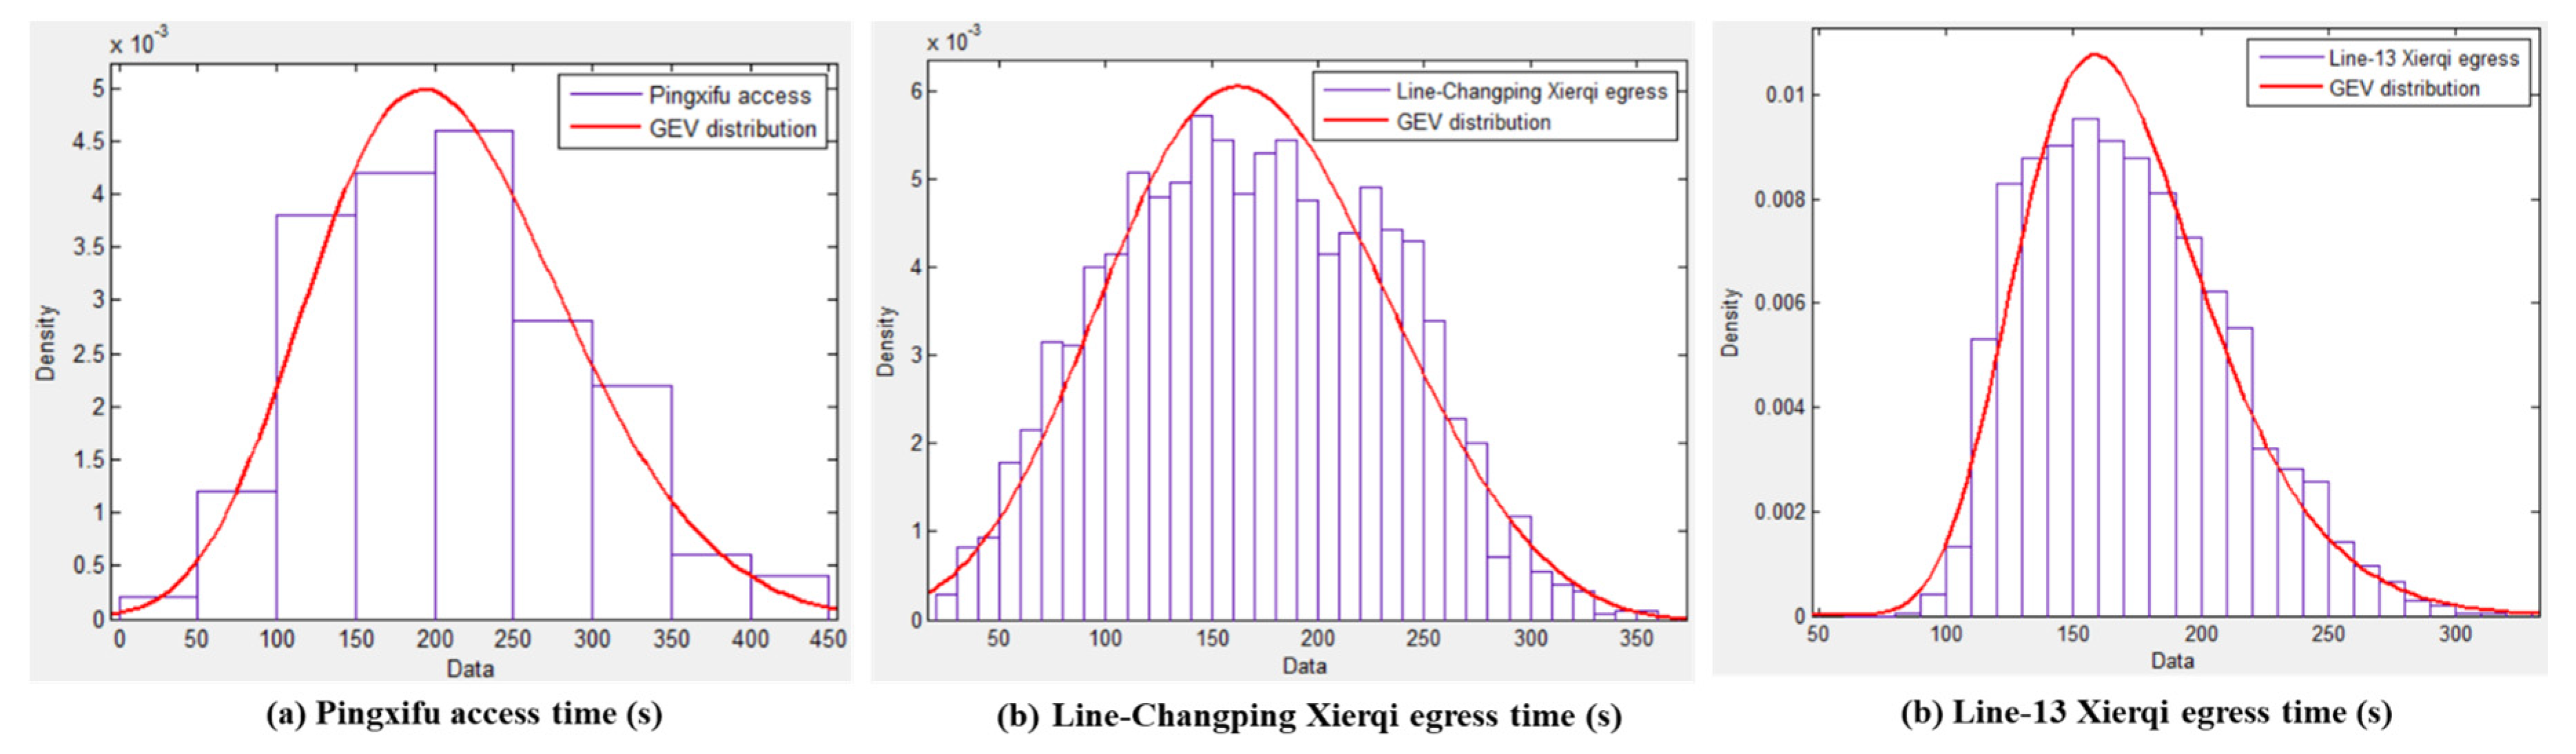
First, we carried out the clustering procedure introduced in Section 3.3.1 to estimate the trajectories of Type A passengers between OD pairs of Pingxifu–Zhuxinzhuang, Zhuxinzhuang–Xierqi, and Huoying–Xierqi. Due to the congestion in morning rush hours, we set the scaling factor to 0.15 to avoid overestimate the role of tap-in time in clustering. Clustering result of passengers are shown in Figure 6. We can obtain the access time of Pingxifu station by the clustering of Pingxifu–Zhuxinzhuang and obtain the egress time of line Changping and line 13 Xierqi station by the clustering of Zhuxinzhuang–Xierqi and Huoying–Xierqi respectively. The access time distribution of Pingxifu station and egress time distribution of Xierqi station are shown in Figure 7. Similar to the conclusion of Hong et al. [30], the generalized extreme value distribution fits the access time and egress time better than the normal distribution.
4.2. Transfer Time Estimation
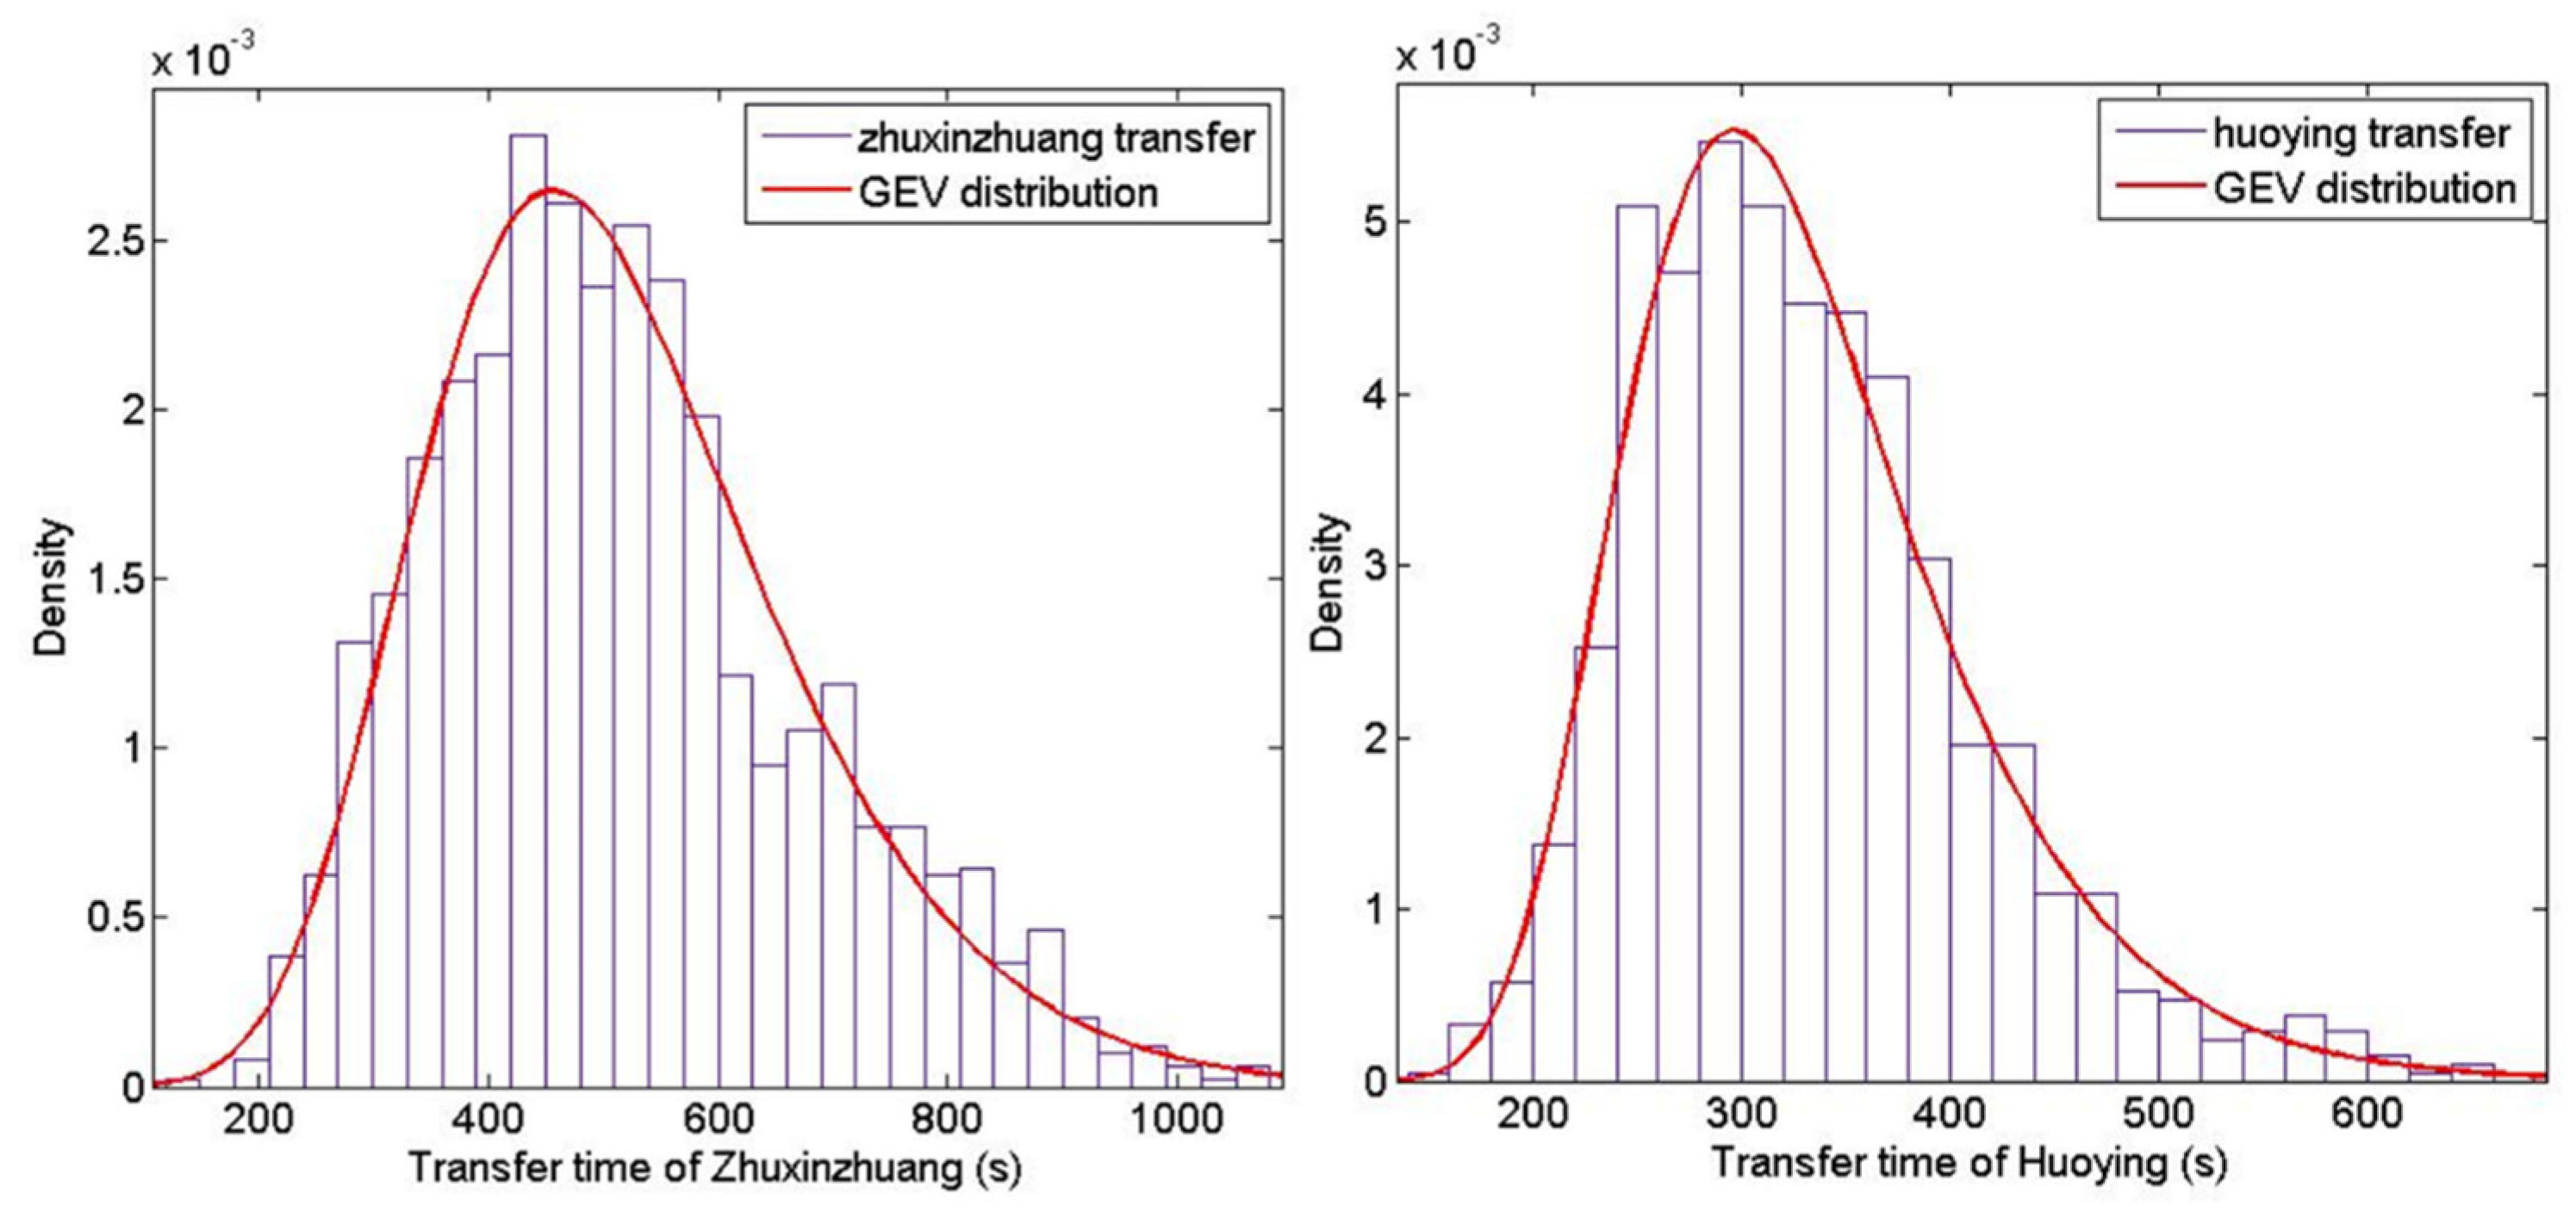
In order to obtain the transfer time distributions, we estimate the trajectories of Type B passengers between OD pairs of Yuzhilu–Xierqi and Huidong–Xierqi based on the method introduced in Section 3.3.2. The transfer time distribution of Zhuxinzhuang and Huoying station is shown in Figure 8. Similar to the access and egress time distribution, the generalized extreme value distribution fits the transfer time better than the normal distribution.
4.3. Passenger Spatial-Temporal Trajectory Estimation
As introduced in Section 3.3.3, we use the depth-first algorithm to search the feasible spatial-temporal trajectories of Pingxifu–Xierqi passengers under the constraints of Equations (2)–(4). By calculating Equation (5), we get the probability of each spatial-temporal trajectories for each passenger. The trajectory with highest probability for a passenger is considered to be the true one.
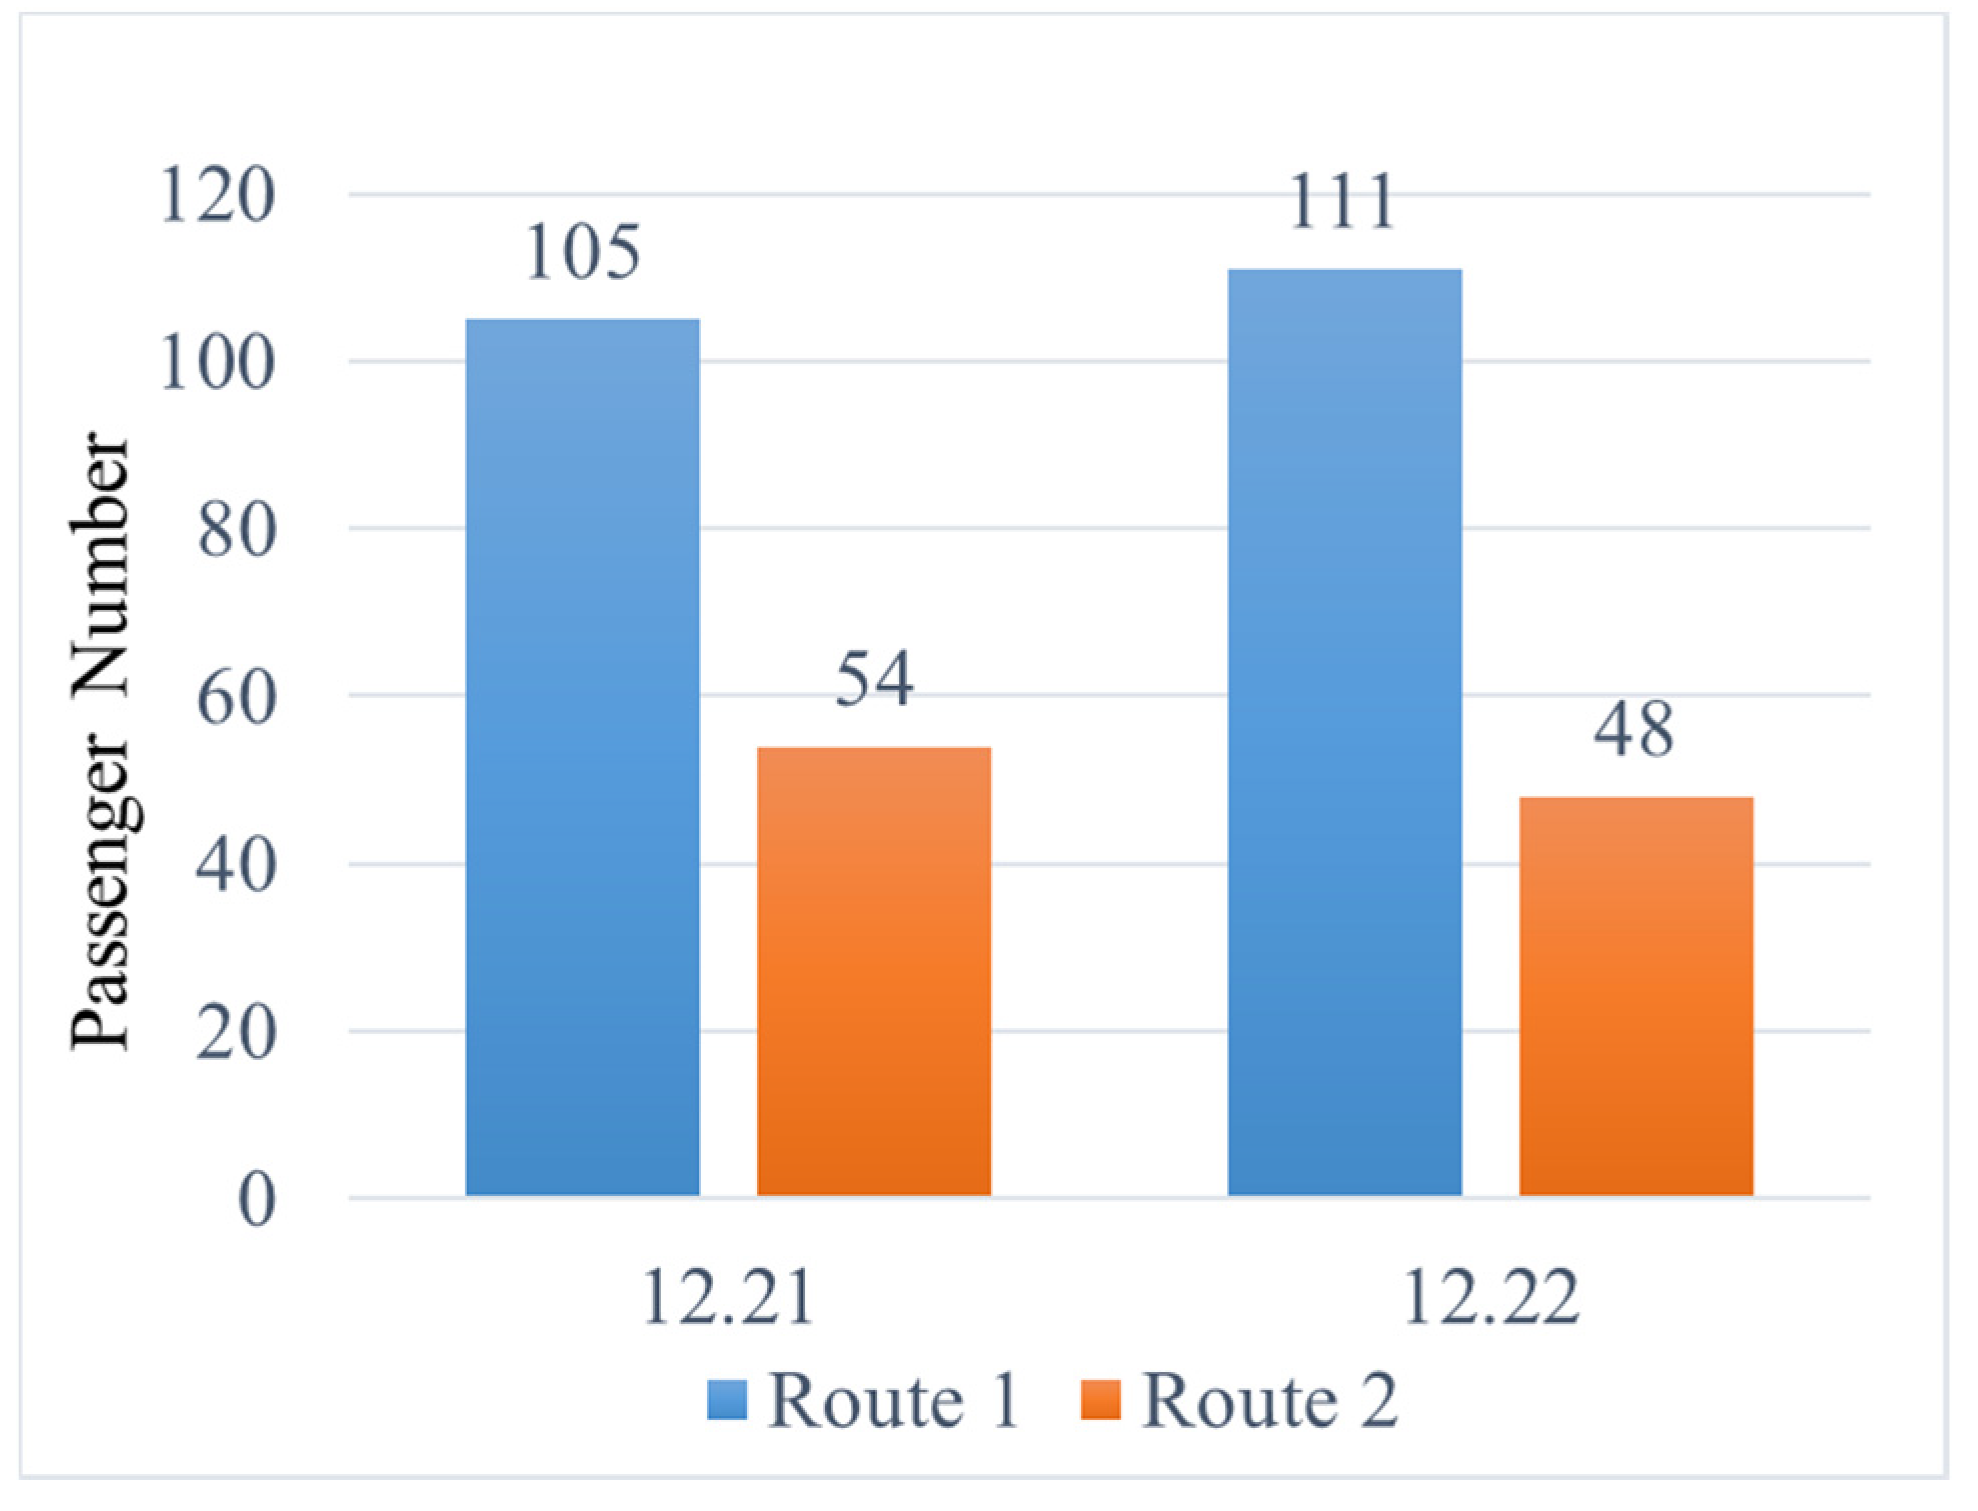
To verify the accuracy of this method, 159 passengers who traveled from Pingxifu to Xierqi in the same period (07:30–9:30) of two consecutive days (21–22 December 2016) were selected to compare their route choice in these two days. In most cases, commuters tend to choose a fixed route every day. Even if some commuters change their route choice in two consecutive days, the route choice ratio of the same OD pair is usually stable. In our case, 145 of the 159 passengers choose the same route in two consecutive days, accounting for 91.2%. Route 1 had a higher chosen ratio, which were 66.0% and 69.8% in these two days with a difference of 3.8% (Figure 9). The reason for this difference may be related to the day-to-day route choice behavior of passengers. Generally speaking, the route choice proportion estimated by this method is relatively stable, which verifies the accuracy of our method.
We also analyzed the reason for the higher chosen proportion of Route 1. In our case, these two routes have extremely close travel time and the same transfer number, but Route 2 has a longer transfer walking time (3 min) than Route 1 (1.5 min). Although Route 1 needs to transfer to Line Changping, which has a higher headway (5 min) than Line 13 of Route 2 (3.5 min), more passengers prefer the route with shorter walking distance when the total travel time are extremely close. Some other factors such as the congestion degree inside the train, the environment inside the train, and even the personal choice preference may affect the route choice results. All these reasons need further research for quantitative analysis; in this paper, we only present the method to estimate the true spatial-temporal trajectory of passengers, which may be useful for further research.
5. Conclusions
This paper presents a method for estimating URT passenger spatial-temporal trajectory by using smart card data and train schedules. On the basis of passenger classification, we use the K-means algorithm to cluster passengers with relatively simple trip and then acquired their access, egress, and transfer time distribution. To estimate passenger actual spatial-temporal trajectory, we proposed a probability approach based on aforementioned time distribution. Finally, a case study of the Beijing Subway was carried out to verify the reliability of this method. Using our method to estimate passenger route choice behavior between two similar routes, we found that 91.2% of the passengers choose the same route in two consecutive days, and the difference of route choice ratio in these two days is 3.8%.
Our method can be applied to URT passenger flow assignment and ticket fare clearing and serve as a basis for deeper research on passenger behavior. This method could be applied in other transit systems that have high frequency and seamless transfer. In future research, we will explore the influence of failing to board, in-vehicle crowding, and other factors on passenger route choice behavior. By introducing further trip chain analysis of URT passengers or multimodal travelers, this method may provide more detailed travel behavior analysis such as commuting and tourism passenger analysis, the influence of crowding degree on passenger choice behavior, the day-to-day choice behavior of passengers, etc. Other studies on passenger microscopic behavior can also carried out using our method.
Author Contributions
Formal analysis, P.Z.; Methodology, T.Y.; Software, T.Y.; Writing—original draft, T.Y.; Writing—review and editing, X.Y. All authors have read and agreed to the published version of the manuscript.
Funding
This research was funded by the National Key Research and Development Program of China grant number 2018YFB1201500.
Conflicts of Interest
The authors declare no conflict of interest.
References
- Gentile, G.; Nguyen, S.; Pallottino, S. Route choice on transit networks with online information at stops. Transp. Sci. 2005, 39, 289–297. [Google Scholar] [CrossRef]
- Nassir, N.; Hickman, M.; Ma, Z.L. A strategy-based recursive path choice model for public transit smart card data. Transp. Res. Part B Methodol. 2019, 126, 528–548. [Google Scholar] [CrossRef]
- Lee, M.; Sohn, K. Inferring the route-use patterns of metro passengers based only on travel-time data within a Bayesian framework using a reversible-jump Markov chain Monte Carlo (MCMC) simulation. Transp. Res. Part B Methodol. 2015, 81, 1–17. [Google Scholar] [CrossRef]
- Spiess, H.; Florian, M. Optimal strategies: A new assignment model for transit networks. Transp. Res. Part B Methodol. 1989, 23, 83–102. [Google Scholar] [CrossRef]
- Jansson, K.; Ridderstolpe, B. A method for the route-choice problem in public transport systems. Transp. Sci. 1992, 26, 246–251. [Google Scholar] [CrossRef]
- Poon, M.H.; Wong, S.C.; Tong, C.O. A dynamic schedule-based model for congested transit networks. Transp. Res. Part B Methodol. 2004, 38, 343–368. [Google Scholar] [CrossRef]
- Lam, W.H.K.; Gao, Z.Y.; Chan, K.S.; Yang, H. A stochastic user equilibrium assignment model for congested transit networks. Transp. Res. Part B Methodol. 1999, 33, 351–368. [Google Scholar] [CrossRef]
- Friedrich, M.; Hofsaess, I.; Wekeck, S. Timetable-based transit assignment using branch and bound techniques. Transp. Res. Rec. 2001, 1752, 100–107. [Google Scholar] [CrossRef]
- Tian, Q.; Huang, H.J.; Yang, H. Equilibrium properties of the morning peak-period commuting in a many-to-one mass transit system. Transp. Res. Part B Methodol. 2007, 41, 616–631. [Google Scholar] [CrossRef]
- Schmöcker, J.D.; Bell, M.G.H.; Kurauchi, F. A quasi-dynamic capacity constrained frequency-based transit assignment model. Transp. Res. Part B Methodol. 2008, 42, 925–945. [Google Scholar] [CrossRef]
- Mai, T.; Fosgerau, M.; Frejinger, E. A nested recursive logit model for route choice analysis. Transp. Res. Part B Methodol. 2015, 75, 100–112. [Google Scholar] [CrossRef] [Green Version]
- Ben-Akiva, M.; Bierlaire, M. Discrete Choice Methods and their Applications to Short Term Travel Decisions. In Handbook of Transportation Science; Springer: Boston, MA, USA, 1999; pp. 5–33. [Google Scholar]
- Bliemer, M.; Bovy, P. Impact of route choice set on route choice probabilities. Transp. Res. Rec. 2008, 2076, 10–19. [Google Scholar] [CrossRef]
- Katona, G.; Lénárt, B.; Juhász, J. Parallel Ant Colony Algorithm for Shortest Path Problem. Period. Polytech. Civ. Eng. 2019, 63, 243–254. [Google Scholar] [CrossRef]
- Silva, R.; Kang, S.M.; Airoldi, E.M. Predicting traffic volumes and estimating the effects of shocks in massive transportation systems. Proc. Natl. Acad. Sci. USA 2015, 112, 5643–5648. [Google Scholar] [CrossRef] [PubMed] [Green Version]
- Sun, H.; Wu, J.; Wu, L.; Gao, Z. Estimating the influence of common disruptions on urban rail transit networks. Transp. Res. Part A Policy Pract. 2016, 94, 62–75. [Google Scholar] [CrossRef]
- Chen, E.; Ye, Z.; Bi, H. Incorporating Smart Card Data in Spatio-Temporal Analysis of Metro Travel Distances. Sustainability 2019, 11, 7069. [Google Scholar] [CrossRef] [Green Version]
- Yu, W.; Bai, H.; Chen, J.; Yan, X. Analysis of Space-Time Variation of Passenger Flow and Commuting Characteristics of Residents Using Smart Card Data of Nanjing Metro. Sustainability 2019, 11, 4989. [Google Scholar] [CrossRef] [Green Version]
- Sun, L.; Lu, Y.; Jin, J.; Lee, D.; Axhausen, K. An integrated Bayesian approach for passenger flow assignment in metro networks. Transp. Res. Part C Emerg. Technol. 2015, 52, 116–131. [Google Scholar] [CrossRef]
- Li, W.; Luo, Q.; Cai, Q.; Zhang, X. Using Smart Card Data Trimmed by Train Schedule to Analyze Metro Passenger Route Choice with Synchronous Clustering. J. Adv. Transp. 2018, 2018. [Google Scholar] [CrossRef]
- Kusakabe, T.; Asakura, Y. Behavioural data mining of transit smart card data: A data fusion approach. Transp. Res. Part C Emerg. Technol. 2014, 46, 179–191. [Google Scholar] [CrossRef]
- Zhu, Y.; Koutsopoulos, H.N.; Wilson, N.H.M. A probabilistic Passenger-to-Train Assignment Model based on automated data. Transp. Res. Part B Methodol. 2017, 104, 522–542. [Google Scholar] [CrossRef]
- Kusakabe, T.; Iryo, T.; Asakura, Y. Estimation method for railway passengers’ train choice behavior with smart card transaction data. Transportation 2010, 37, 731–749. [Google Scholar] [CrossRef]
- Zhou, F.; Xu, R. Model of passenger flow assignment for urban rail transit based on entry and exit time constraints. Transp. Res. Rec. 2012, 2284, 57–61. [Google Scholar] [CrossRef]
- Sun, Y.; Schonfeld, P.M. Schedule-based rail transit path-choice estimation using automatic fare collection data. J. Transp. Eng. 2016, 142, 04015037. [Google Scholar] [CrossRef]
- Sun, L.; Lee, D.H.; Erath, A.; Huang, X. Using smart card data to extract passenger’s spatio-temporal density and train’s trajectory of MRT system. In Proceedings of the ACM SIGKDD International Workshop on Urban Computing, Beijing, China, 12–16 August 2012; pp. 142–148. [Google Scholar]
- Zhang, F.; Zhao, J.; Tian, C.; Xu, C.; Liu, X.; Rao, L. Spatiotemporal segmentation of metro trips using smart card data. IEEE Trans. Veh. Technol. 2015, 65, 1137–1149. [Google Scholar] [CrossRef]
- Zhao, J.; Zhang, F.; Tu, L.; Xu, C.; Shen, D.; Tian, C.; Li, Z. Estimation of passenger route choice pattern using smart card data for complex metro systems. IEEE Trans. Intell. Transp. Syst. 2016, 18, 790–801. [Google Scholar] [CrossRef]
- Zhao, J.; Qu, Q.; Zhang, F.; Xu, C.; Liu, S. Spatio-temporal analysis of passenger travel patterns in massive smart card data. IEEE Trans. Intell. Transp. Syst. 2017, 18, 3135–3146. [Google Scholar] [CrossRef]
- Hong, S.P.; Min, Y.H.; Park, M.J.; Kim, K.M.; Oh, S.M. Precise estimation of connections of metro passengers from Smart Card data. Transportation 2016, 43, 749–769. [Google Scholar] [CrossRef]
- Kim, K.M.; Hong, S.P.; Ko, S.J.; Kim, D. Does crowding affect the path choice of metro passengers? Transp. Res. Part A Policy Pract. 2015, 77, 292–304. [Google Scholar] [CrossRef]
- Hörcher, D.; Graham, D.J.; Anderson, R.J. Crowding cost estimation with large scale smart card and vehicle location data. Transp. Res. Part B Methodol. 2017, 95, 105–125. [Google Scholar] [CrossRef]
- MacQueen, J. Some methods for classification and analysis of multivariate observations. In Proceedings of the Fifth Berkeley Symposium on Mathematical Statistics and Probability; University of California Press: Berkeley, CA, USA, 1967; Volume 1, pp. 281–297. [Google Scholar]
Figure 1.
Urban rail transit passenger travel process.

Figure 2.
Spatial-temporal trajectory candidates of each type passengers.

Figure 3.
Tap-out time of Xierqi station in Beijing Subway. (a) Tap-out time during off-peak hours; (b) tap-out time during peak hours.
Figure 3.
Tap-out time of Xierqi station in Beijing Subway. (a) Tap-out time during off-peak hours; (b) tap-out time during peak hours.

Figure 4.
Tap-in/out time distribution of passengers from Shahe to Xierqi.

Figure 5.
The routes between Pingxifu and Xierqi stations of the Beijing Subway.

Figure 6.
Clustering result of the Type A passengers.

Figure 7.
Access and egress time distributions.

Figure 8.
Transfer time distribution of Zhuxinzhuang and Huoying station.

Figure 9.
Route choice ratio in two consecutive days.

© 2020 by the authors. Licensee MDPI, Basel, Switzerland. This article is an open access article distributed under the terms and conditions of the Creative Commons Attribution (CC BY) license (http://creativecommons.org/licenses/by/4.0/).
Share and Cite
MDPI and ACS Style
Yang, T.; Zhao, P.; Yao, X. A Method to Estimate URT Passenger Spatial-Temporal Trajectory with Smart Card Data and Train Schedules. Sustainability 2020, 12, 2574. https://0-doi-org.brum.beds.ac.uk/10.3390/su12062574
AMA Style
Yang T, Zhao P, Yao X. A Method to Estimate URT Passenger Spatial-Temporal Trajectory with Smart Card Data and Train Schedules. Sustainability. 2020; 12(6):2574. https://0-doi-org.brum.beds.ac.uk/10.3390/su12062574
Chicago/Turabian StyleYang, Taoyuan, Peng Zhao, and Xiangming Yao. 2020. "A Method to Estimate URT Passenger Spatial-Temporal Trajectory with Smart Card Data and Train Schedules" Sustainability 12, no. 6: 2574. https://0-doi-org.brum.beds.ac.uk/10.3390/su12062574
Note that from the first issue of 2016, this journal uses article numbers instead of page numbers. See further details here.