Smart City-Ranking of Major Australian Cities to Achieve a Smarter Future
by
 , , and
Muhammad Atiq Ur Rehman Tariq
1,* ,
,
Alavaiola Faumatu
1, 
Maha Hussein
1 ,
,
Muhammad Laiq Ur Rahman Shahid
2 and
and
Nitin Muttil
1,*
1
College of Engineering and Science, Victoria University, Melbourne VIC 8001, Australia
2
Department of Electronic Engineering, University of Engineering and Technology Taxila, Rawalpindi 46000, Pakistan
*
Authors to whom correspondence should be addressed.
Sustainability 2020, 12(7), 2797; https://0-doi-org.brum.beds.ac.uk/10.3390/su12072797
Submission received: 13 March 2020
/
Revised: 25 March 2020
/
Accepted: 29 March 2020
/
Published: 1 April 2020
(This article belongs to the Special Issue Smart Cities, City Dashboards, Planning and Evaluation of Urban Performances)
Abstract
:A Smart City is a solution to the problems caused by increasing urbanization. Australia has demonstrated a strong determination for the development of Smart Cities. However, the country has experienced uneven growth in its urban development. The purpose of this study is to compare and identify the smartness of major Australian cities to the level of development in multi-dimensions. Eventually, the research introduces the openings to make cities smarter by identifying the focused priority areas. To ensure comprehensive coverage of all aspects of the smart city’s performance, 90 indicators were selected to represent 26 factors and six components. The results of the assessment endorse the impacts of recent government actions taken in different urban areas towards building smarter cities. The research has pointed out the areas of deficiencies for underperforming major cities in Australia. Following the results, appropriate recommendations for Australian cities are provided to improve the city’s smartness.
1. Introduction
1.1. Background
As per the World Urbanization Prospects (WUP), the world’s urban population exceeded its rural population in 2007 [1]. Since then, the WUP 2018 revision recorded that 55% of the world’s population is living in urban areas, and this is expected to increase to 66% by 2050 [2]. Population growth may seem random, but the importance of urban space management is reflected in the need for enhancing the performance of urban services such as energy, transportation, health, housing, and utilities experienced in major parts of the world. Currently, there are 18 mega cities that have a population greater than 10 million in the world. The world’s urban population will continue to increase, and the energy, transportation, health, and other requirements to serve this increase needs to be meet [3,4].
With growing urbanization, the transformation of existing cities into Smart Cities is bound to happen. Massive migration to urban areas severely affects the livability standard of existing cities [5]. Smart Cities not only apply the latest technology in an integrated way, but they also have the ability to identify the areas for improvement [6,7]. The integration of technology, however, must be carefully coupled to human dimensions [8]. Sims [9] explains that retrofitting is directly related to the transition of an existing city into a Smart City. Like bridges and overpasses, these structures are retrofitted with reinforcement to allow for additional external loading. In the same way, Smart Cities can be made by integrating smart systems into existing areas. However, that would be a costly and an inefficient way. The concept of smart city has been a potential solution to solve the problems concerning urbanization [10,11,12] as the aspects that a smart city covers, ensure a sustainable urban development by comprehending economy, mobility, environment, people, living, and governance. These dimensions are connected to each other and attracts people [13,14,15]. By an accurate measurement of a city’s “Smartness”, a city can be assessed for its progress in all main sectors to enhance the competitiveness [16,17]. In addition, as cities invest major efforts and capital expenditures to gain competitive advantage, it is equally significant to quantify, measure, compare, and rank cities based on their performance [7,18].
1.2. The Concept of Smart City
Although, the concept of Smart City gained momentum in last two decades, the Smart City idea is not a recent development [19]. It made its first occurrence in the mid-1800s in the American West self-governing cities [20]. By the 21st century, smart cities began to gain a “serious interest” by governments across the world [21], mainly due to the new innovative technologies [13,22]. A total of 27 cities are considered to be Smart Cities around the world, with Melbourne being amongst them [23,24]. Each city aims to improve by implementing innovative projects that will improve its smartness. The performance of each city is reliable on the success of these projects and ensuring that the public cooperates with these plans. London, Singapore, Barcelona, and New York are few more examples of worlds Smart Cities.
Although the concept of the Smart City is still in evolving stages and there exists no universally accepted definition [25,26,27], there are many aspects of a city that make a city “smart”. Some Smart Cities might be smarter than others while some might fall below. The idea of creating smarter cities is relatively a “new concept” utilized for optimizing the delivery of key factors including but limited to, energy, water, transportation, public health and safety, and other key services [28]. The general concept of Smart Cities seems to be a simple one, however it is far from the actual definition [29]. The term “smart” is commonly used for marketing purposes to associate devices with terms like user-friendly and user perspective-centered [25,30,31]. While the idea of a Smart City may seem to have “outlived its usefulness”, the idea is still up for discussion [32]. A challenge that comes with Smart Cities seems to be the economic return, as it will always be priority is modern society [33]. The Smart City concept has experienced much debate as there are many ways to interpret a Smart City [34]. Although the roots of the concept of Smart Cities are from “information cities”, “digital cities”, and “intelligent cities”, today, the concept is far beyond the communication and technologies-based ideas [10,35]. It covers a smart economy, smart mobility, a smart environment, smart people, smart living, and smart governance [36,37,38,39]. The same are chosen for the rankings in presented research. The concept is in need for a unified theoretical structure that can determine the success criteria for an urbanized area so that it can have an effective impact on future developments.
1.3. Research Objectives
The measurement of smartness gives the cities a unique outlook in identifying problematic areas. The Smart City is more than the improvement within a single aspect of a city’s performance. Unfortunately, cities can self-proclaim themselves as smart whilst having only improved in one area (for example, higher internet speeds and a broader range of connectivity). This is the outcome when cities have not understood the definition correctly.
There are a number of Smart City rating systems in place measuring the performance of major cities in different ways. The comparison of cities may seem beneficial for tourism; however, this isn’t the case for all included cities without an accurate consideration of each city’s differences. Consequently, cities only utilize results in favor for their city and disregard any data that suggests otherwise. Since a ranking system applied to cities spread around the world is commonly accepted by highly ranked cities only, a comparative study of cities that exist only within the same country or continent can be more useful to each city. The results would be more relevant, and the solutions can therefore be more realistic. It is important that cities strive to make improvements in all areas of their performance. For cities to develop into smarter cities, it is essential that a unified framework be defined, one which allows for an unbiased measurement of performance from which practical solutions and strategies can be extracted and implemented.
Australia is suffering from the concentration of population in the major cities Sydney and Melbourne. In spite of multiple steps, incentives, and measures, the population growth rate in other regions are still not satisfactory [40,41,42,43,44,45]. Australian Federal State and Local Governments have since launched multiple Smart City initiatives from the 2016 Smart Cities Plan to the Smart Cities Collaboration Platform (SCCP) launched in 2017 and relaunched in 2018 [46,47]. Barns et al. [48] also indicated the wide range adoption of Smart Cities by the Australian Government. To sustain their economic prosperity, Australia must develop Smarter Cities as these cities are the “engine rooms for Australian industry” [49]. According to the global SDG index, Australia has fallen from 26th to 37th in the global ranking, primarily due to poor performance in addressing inequality, tackling climate change, and housing affordability [50,51].
Attaining valid results that can produce alternative solutions to improve the overall quality of life is the significance of this research. The purpose of this research is to compare the performance of Australian major cities in different sectors and identify the areas of improvement for underperforming cities to make these further smarter. The above-mentioned factors lead into the crux of this research, describing how the Smart City framework can provide guidelines to improve a city’s overall performance.
2. Literature Review
Various attempts have been made to rank the cities on different parameters. The most famous rankings conducted are global cities, nice cities, knowledge cities, intelligent cities, creative cities, livable cities, eco cities, etc. [52,53,54,55,56]. One of the most famous and currently regularly conducted rankings is the most livable cities by Economist Intelligence Unit (EIU). EIU publishes every year list of the “most livable cities” based on EIU’s Global Livability Ranking system. The ranking system is based on urban quality of life based on assessments of their stability, healthcare, culture, environment, education, and infrastructure [57]. The EIU also publishes a Worldwide Cost of Living Survey that compares the cost of living in a range of global cities [58]. Salah El-Shakhs [59] did a comparison of city size distribution and socioeconomic development to investigate a relationship between the twos. A similar approach to rank various cities on knowledge-based development was performed by Grant and Chuang [18]. Phillis et al. [60] developed the sustainability ranking with introducing fuzzy evaluation. Giffinger et al. [33] performed the ranking of 600 medium sized European cities to compare the health conditions. In a follow up attempt, he developed a rating for medium-sized cities in Europe.
Cugurullo, F. [61] showed a realistic perspective among the experimental models of improved urban spaces by investigating the extent to which the Smart Cities are developed in a controlled and systematic manner as their developers claim. Through the two most diffused typologies of experimental urban projects, “smart” and “eco-city”, he compared the performance of existing cities by introducing the individual component of a smart city and divided the smart city into smart and city parts [62]. The smart part is built of structure, function, focus, and semiotics, whereas the city is represented by the stakeholders and the outcomes. These components were further divided into different factors to cover the overall performance of a Smart City. Similar division of Smart City functions are done by Bholey [63], Konkana [64], and G. Dall’o [65] introduced a common theme where the results are based on the available information databases. The adopted methodologies were targeting the medium-sized cities, specifically within the east Milan area. Similar rankings have been done by The Economist for 120 cities and by Wu for Chinese cities [66,67].
Results of a ranking systems can be unreliable when comparing cities that exist within different countries, as their people may exist under different laws, religious beliefs, and cultures. A portion of this research is attributed to ensuring cities facilitate a sustainable future by raising awareness regarding the importance of components and factors that are the integral part of a smart city. These issues demand viable solutions to create a more sustainable future.
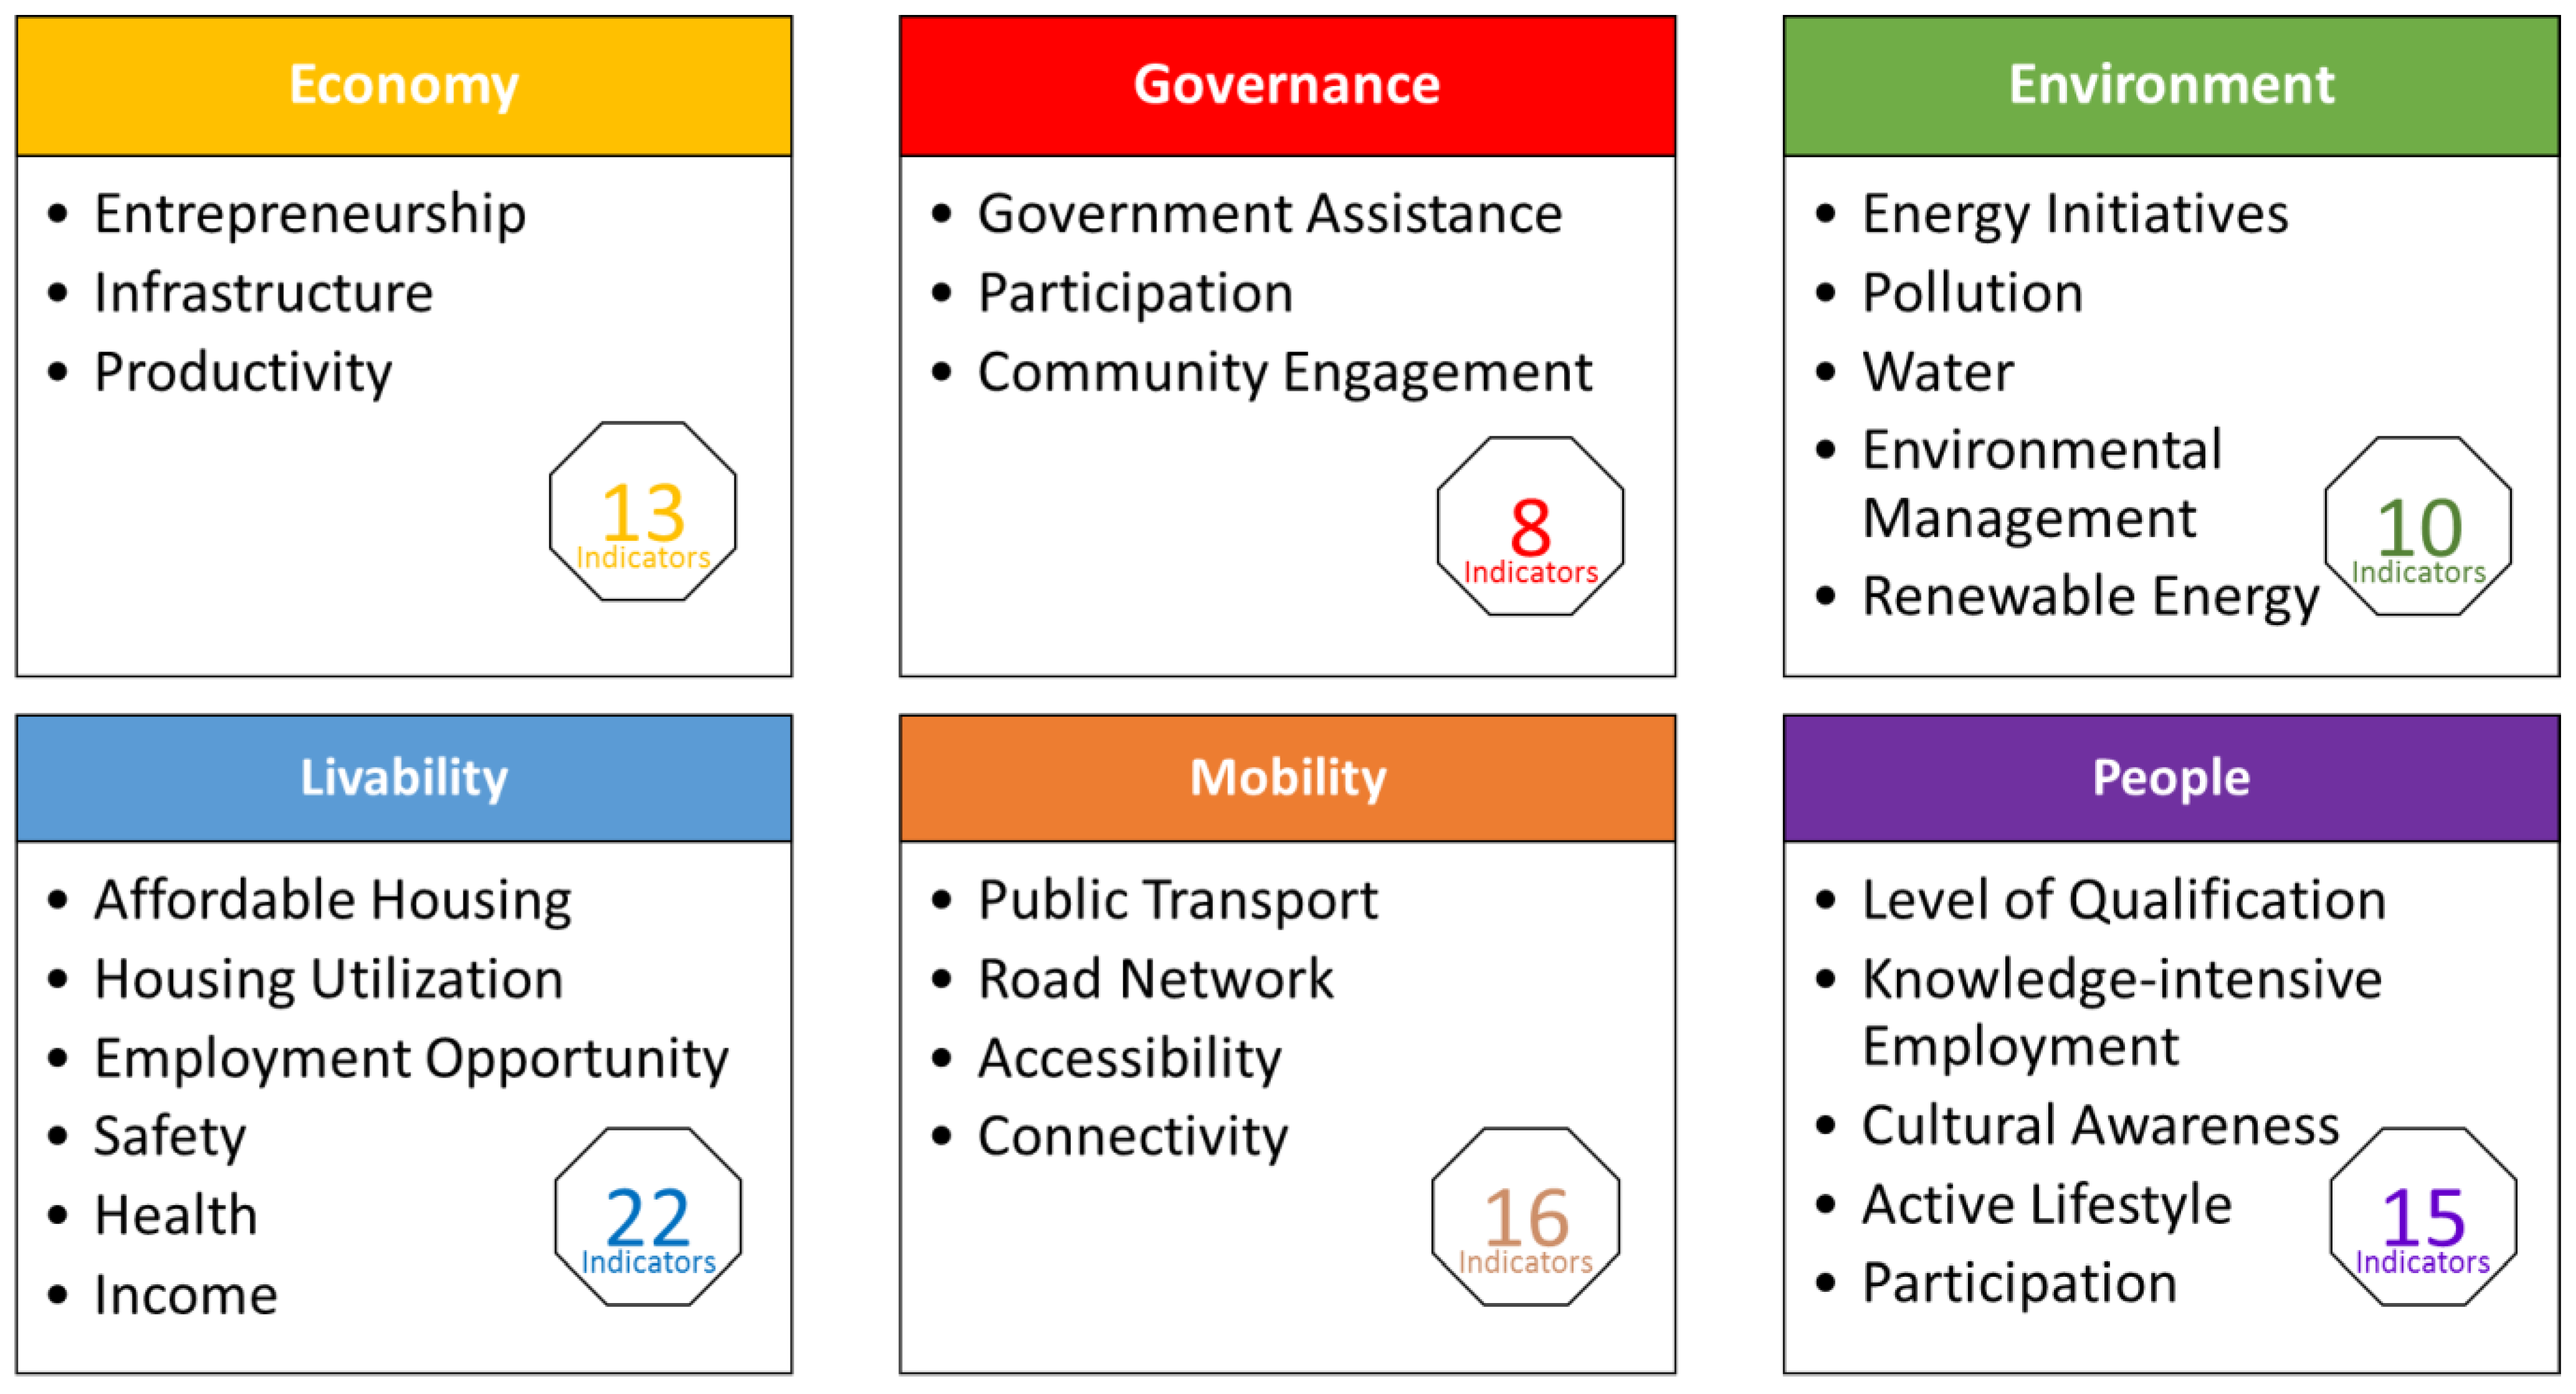
The selection of appropriate components to evaluate the smartness of a city remain a point of discussion in the absense of a concrete definition of Smart City concept. However, studies [25,63,68,69,70,71,72] shows the technology, culture, governance, sustainability, citizen-centred, economy, environment, liveability, transportation, communication, energy, water, culture, and education are main areas of attentions for a Smart City. Allam and Dhunny [68] recommend the assessment of smartness based on key dimensions of culture, metabolism, and governance. This research focuses on ranking the Australian major cities by considering the performance of key components of smart economy, smart mobility, a smart environment, smart people, smart living, and smart governance following the concept developed by Giffinger [73]. These components are further represented by 26 factors. The representative factors were chosen in a way to make sure that major aspects of sustainability (supported with technological fronts) are covered in the assessment process [74]. To rank each factor, it was required to evaluate each factor being represented by measurable indicators. These indicators are chosen based on their suitability and relevance to smart city concept based on extensive literature and the availability of data [75,76,77,78,79]. The performance assessment of each factor was made on three or more indicators to avoid the biasness and to ensure thoroughness of the process.
3. Methodology
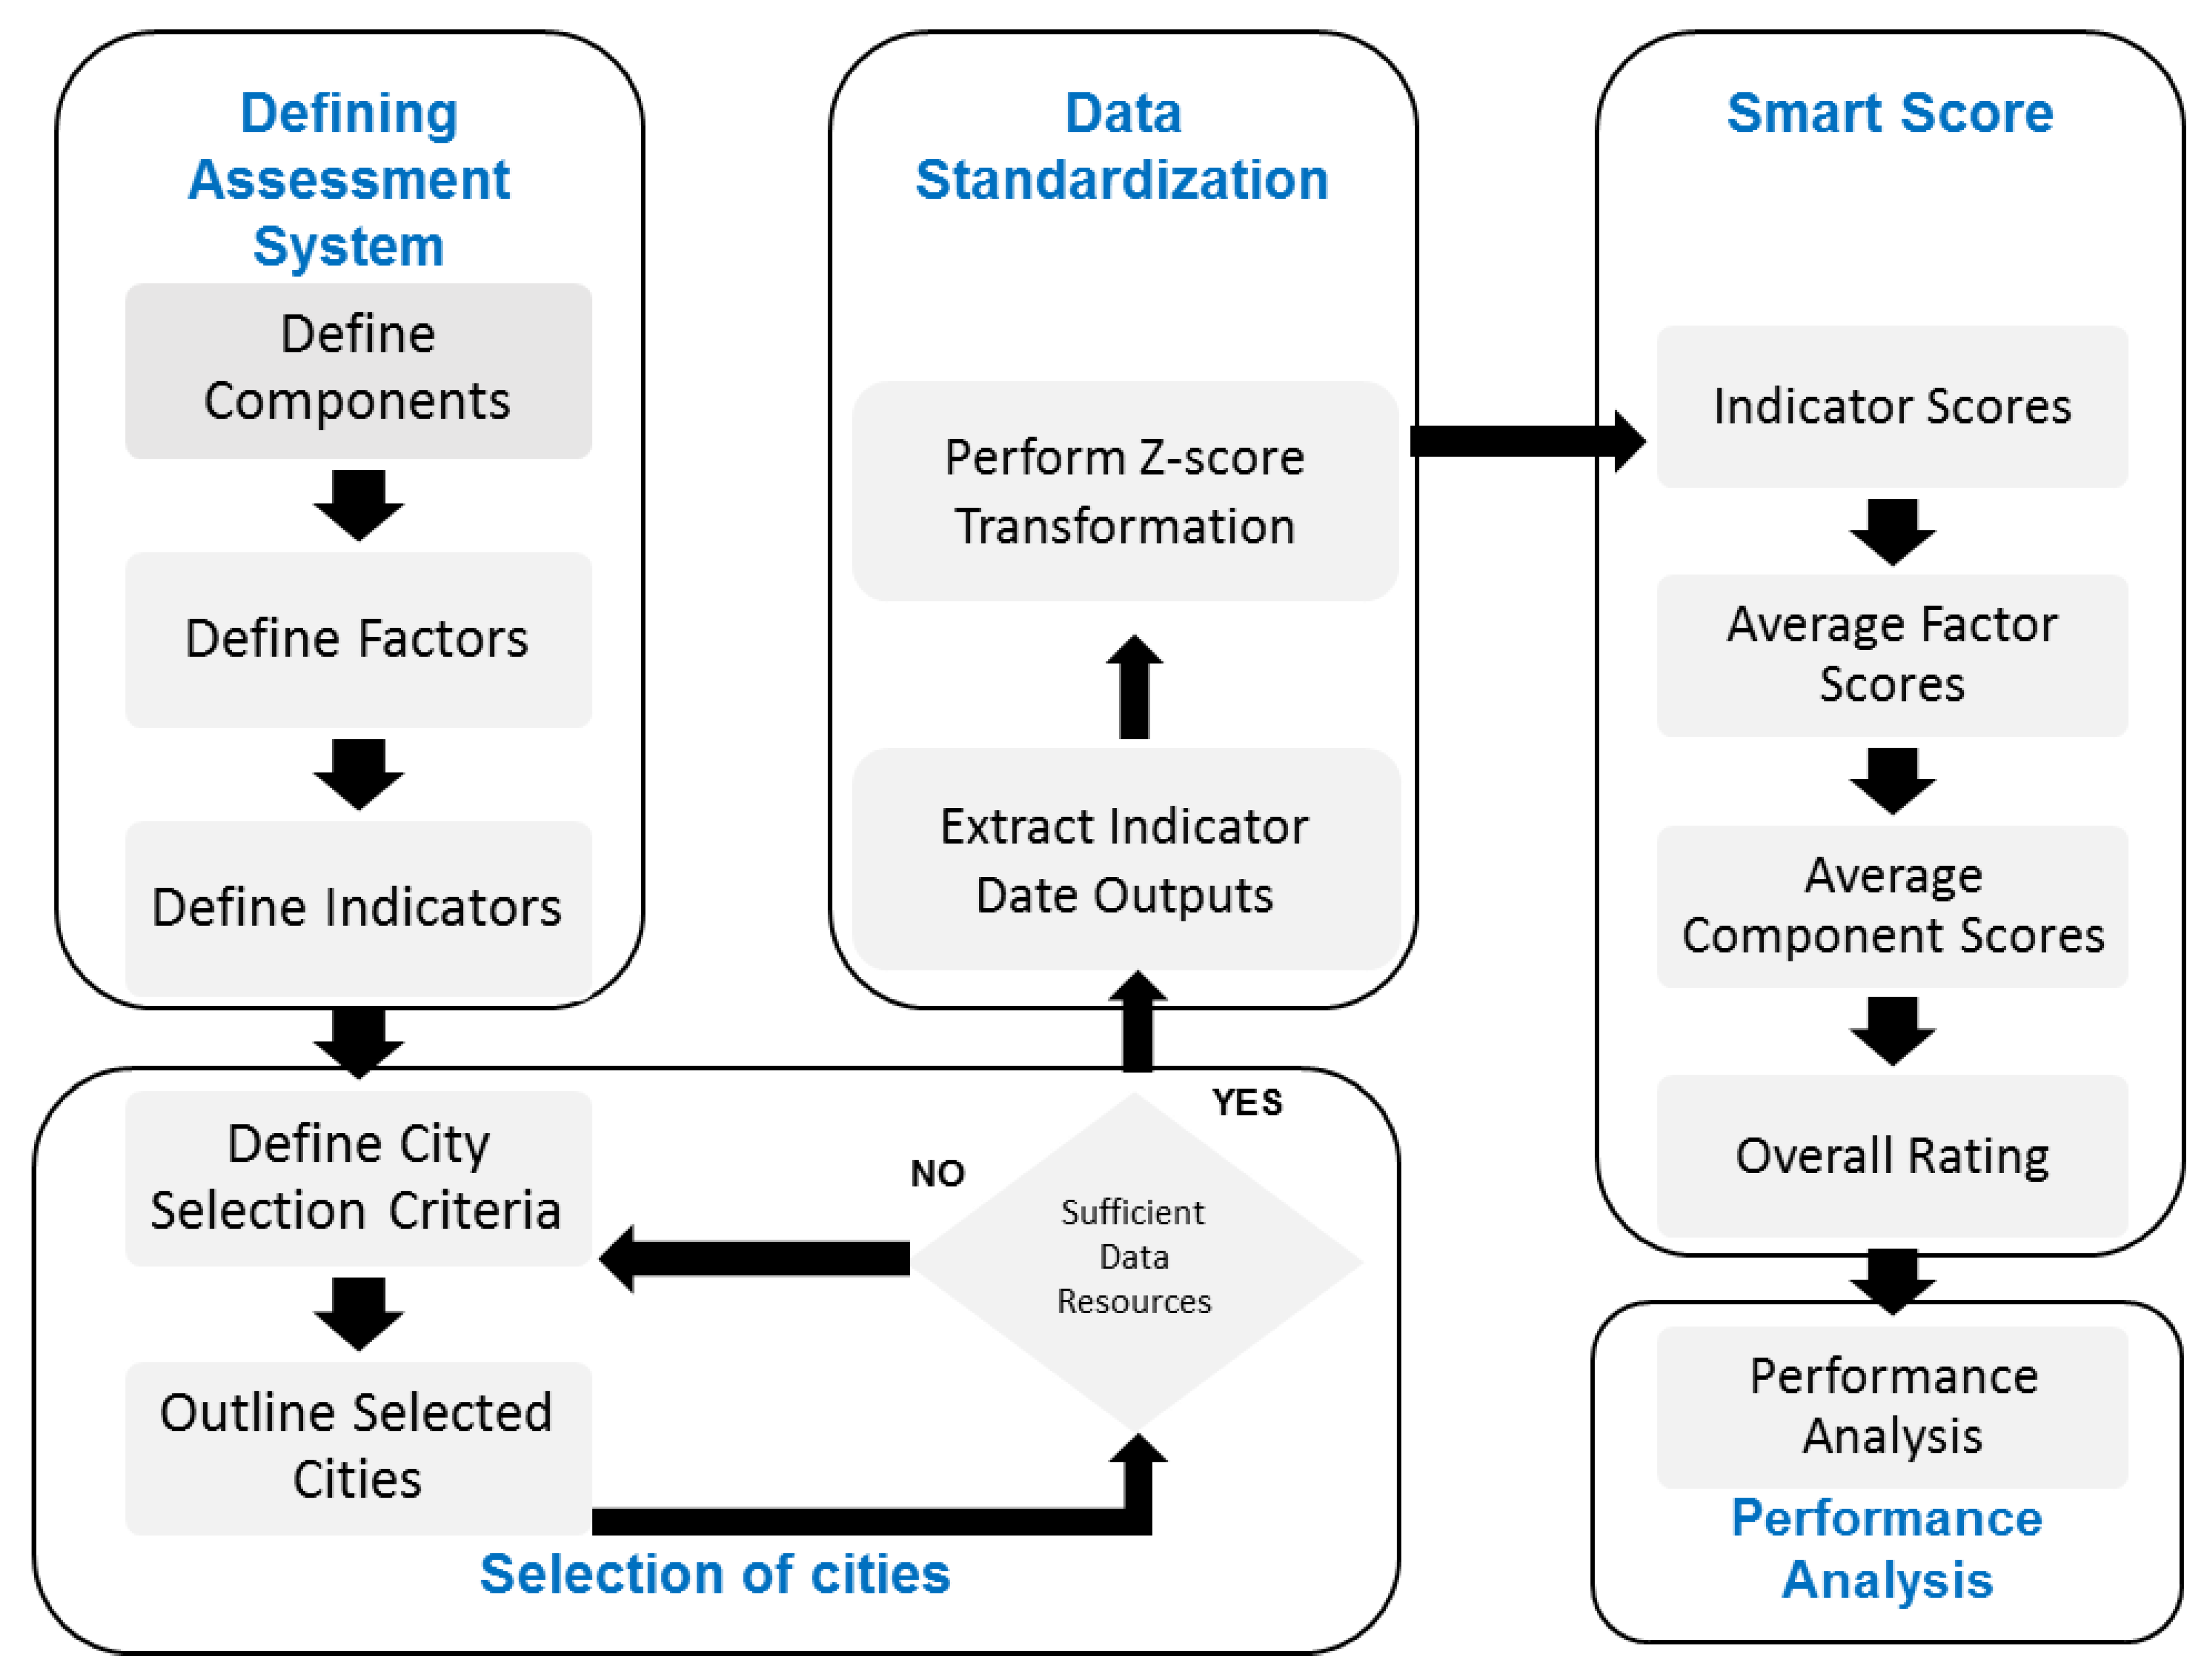
Concluding the discussions in the above paragraphs, a methodology is developed in this study to ensure to cover as many indicators as possible to ensure wholistic coverage and to avoid partial assessment considering the available data. The methodology is developed in a way to avoid the over emphasizing of few components and ignoring others. It was assured that the results should themselves be provocation for the areas of improvements for cities under study. The following sections discuss the logical connections and rationales for methodology developed for this study. The adopted methodology can be mainly divided into the following parts:
- Defining assessment system
- Cities selection
- Data standardization
- Smart score calculations
- Performance analysis
The flow of processes is shown in Figure 1. The details of methodology can be found in forthcoming sections.
3.1. Defining Assessment System
Following the discussion in Section 2, Literature review, the main components of a Smart City were chosen as: economy, governance, environment, livability, mobility, and people. Each component covers three or more factors to satisfactorily cover the main aspects of an urban life as shown in Figure 2. The number of indicators for a factor and factors for a component is selected based on its relevancy as well as the availability of data. To assure a comprehensive ranking and avoiding a partial ranking [71,80], 90 indicators were selected to represent 26 factors and six components (Refer Figure 2 and detailed indicators list is attached as Appendix A). The figure also shows a color-coding system, wherein each component is associated with a specific color (orange for Economy, red for Governance, green for Environment, and so on). The same color-coding system is used in the subsequent figures in this paper. The selection and suitability of indicators were decided based on the following criteria [81,82,83,84,85]: The data must be as follows:
- Quantitative to facilitate calculations
- Publicly available for cross-checking purposes
- Independent of external influence to assure its unbiasedness
- Free or of minimal cost as the project funding is limited
- Collected at least annually to ensure its regular updating
- Available for selected cities under study to fully compare all cities
- Uniformly managed at the national level to avoid discrepancies
- Cover all aspects of a Smart City to avoid partial assessment
Furthermore, it should be noted that no weightages are assigned for the calculation purposes to avoid the over emphasizing or underrating of various aspects of a Smart City. Data standardization is also opted to overcome the issue of handling a vast range of values for various indicators and to account for the situations where all necessary data are not available.
3.2. Selection of Cities
The selected Australian cities are assessed based on the analysis of relevant data used. The performance is also assessed on the level of each indicator, factor, and component. Table 1 shows the criteria used in selecting and categorizing each city referencing data as per Australian Bureau of Statistics. Table 2 refers to the information sources referenced in calculating the smart scores per indicator.
3.3. Data Collection
The data used for the calculation process was not older than five years. The most recent and authentic data for all 90 indicators were collected to perform assessment. Table 2 shows the various sources of data used for the ranking purposes in presented research work.
3.4. Data Standardization
Due to a range of values for different indicators, the standardization was unavoidable. All indicators’ values are standardized according to their most recent values. This method involves standardizing indicator values with an average of 0 and a standard deviation 1 as conditions of normal distribution. Equation (1) shows the formula used to transform each indicator into a score that allows for analysis despite metric information. It should be noted in the case of negative indicators, such as crime and unemployment rates, a negative z-score is considered.
where z = Smart Score
= Output
= Mean
= Standard Deviation
Equation (1): Standardization of Indicators Using Z-Score
3.5. Smart Score Calculations
As mentioned previously, the calculations are performed in a way to overcome the issues of handling the range of values and to handle the missing indicators’ data. Each indicator is assigned a z-value (smart score) based on Equation (1) for every city. Based on indicators’ z-values, average factor scores and consequently average component score are calculated. The final score of a city is a sum of all components.
3.6. Performance Analysis
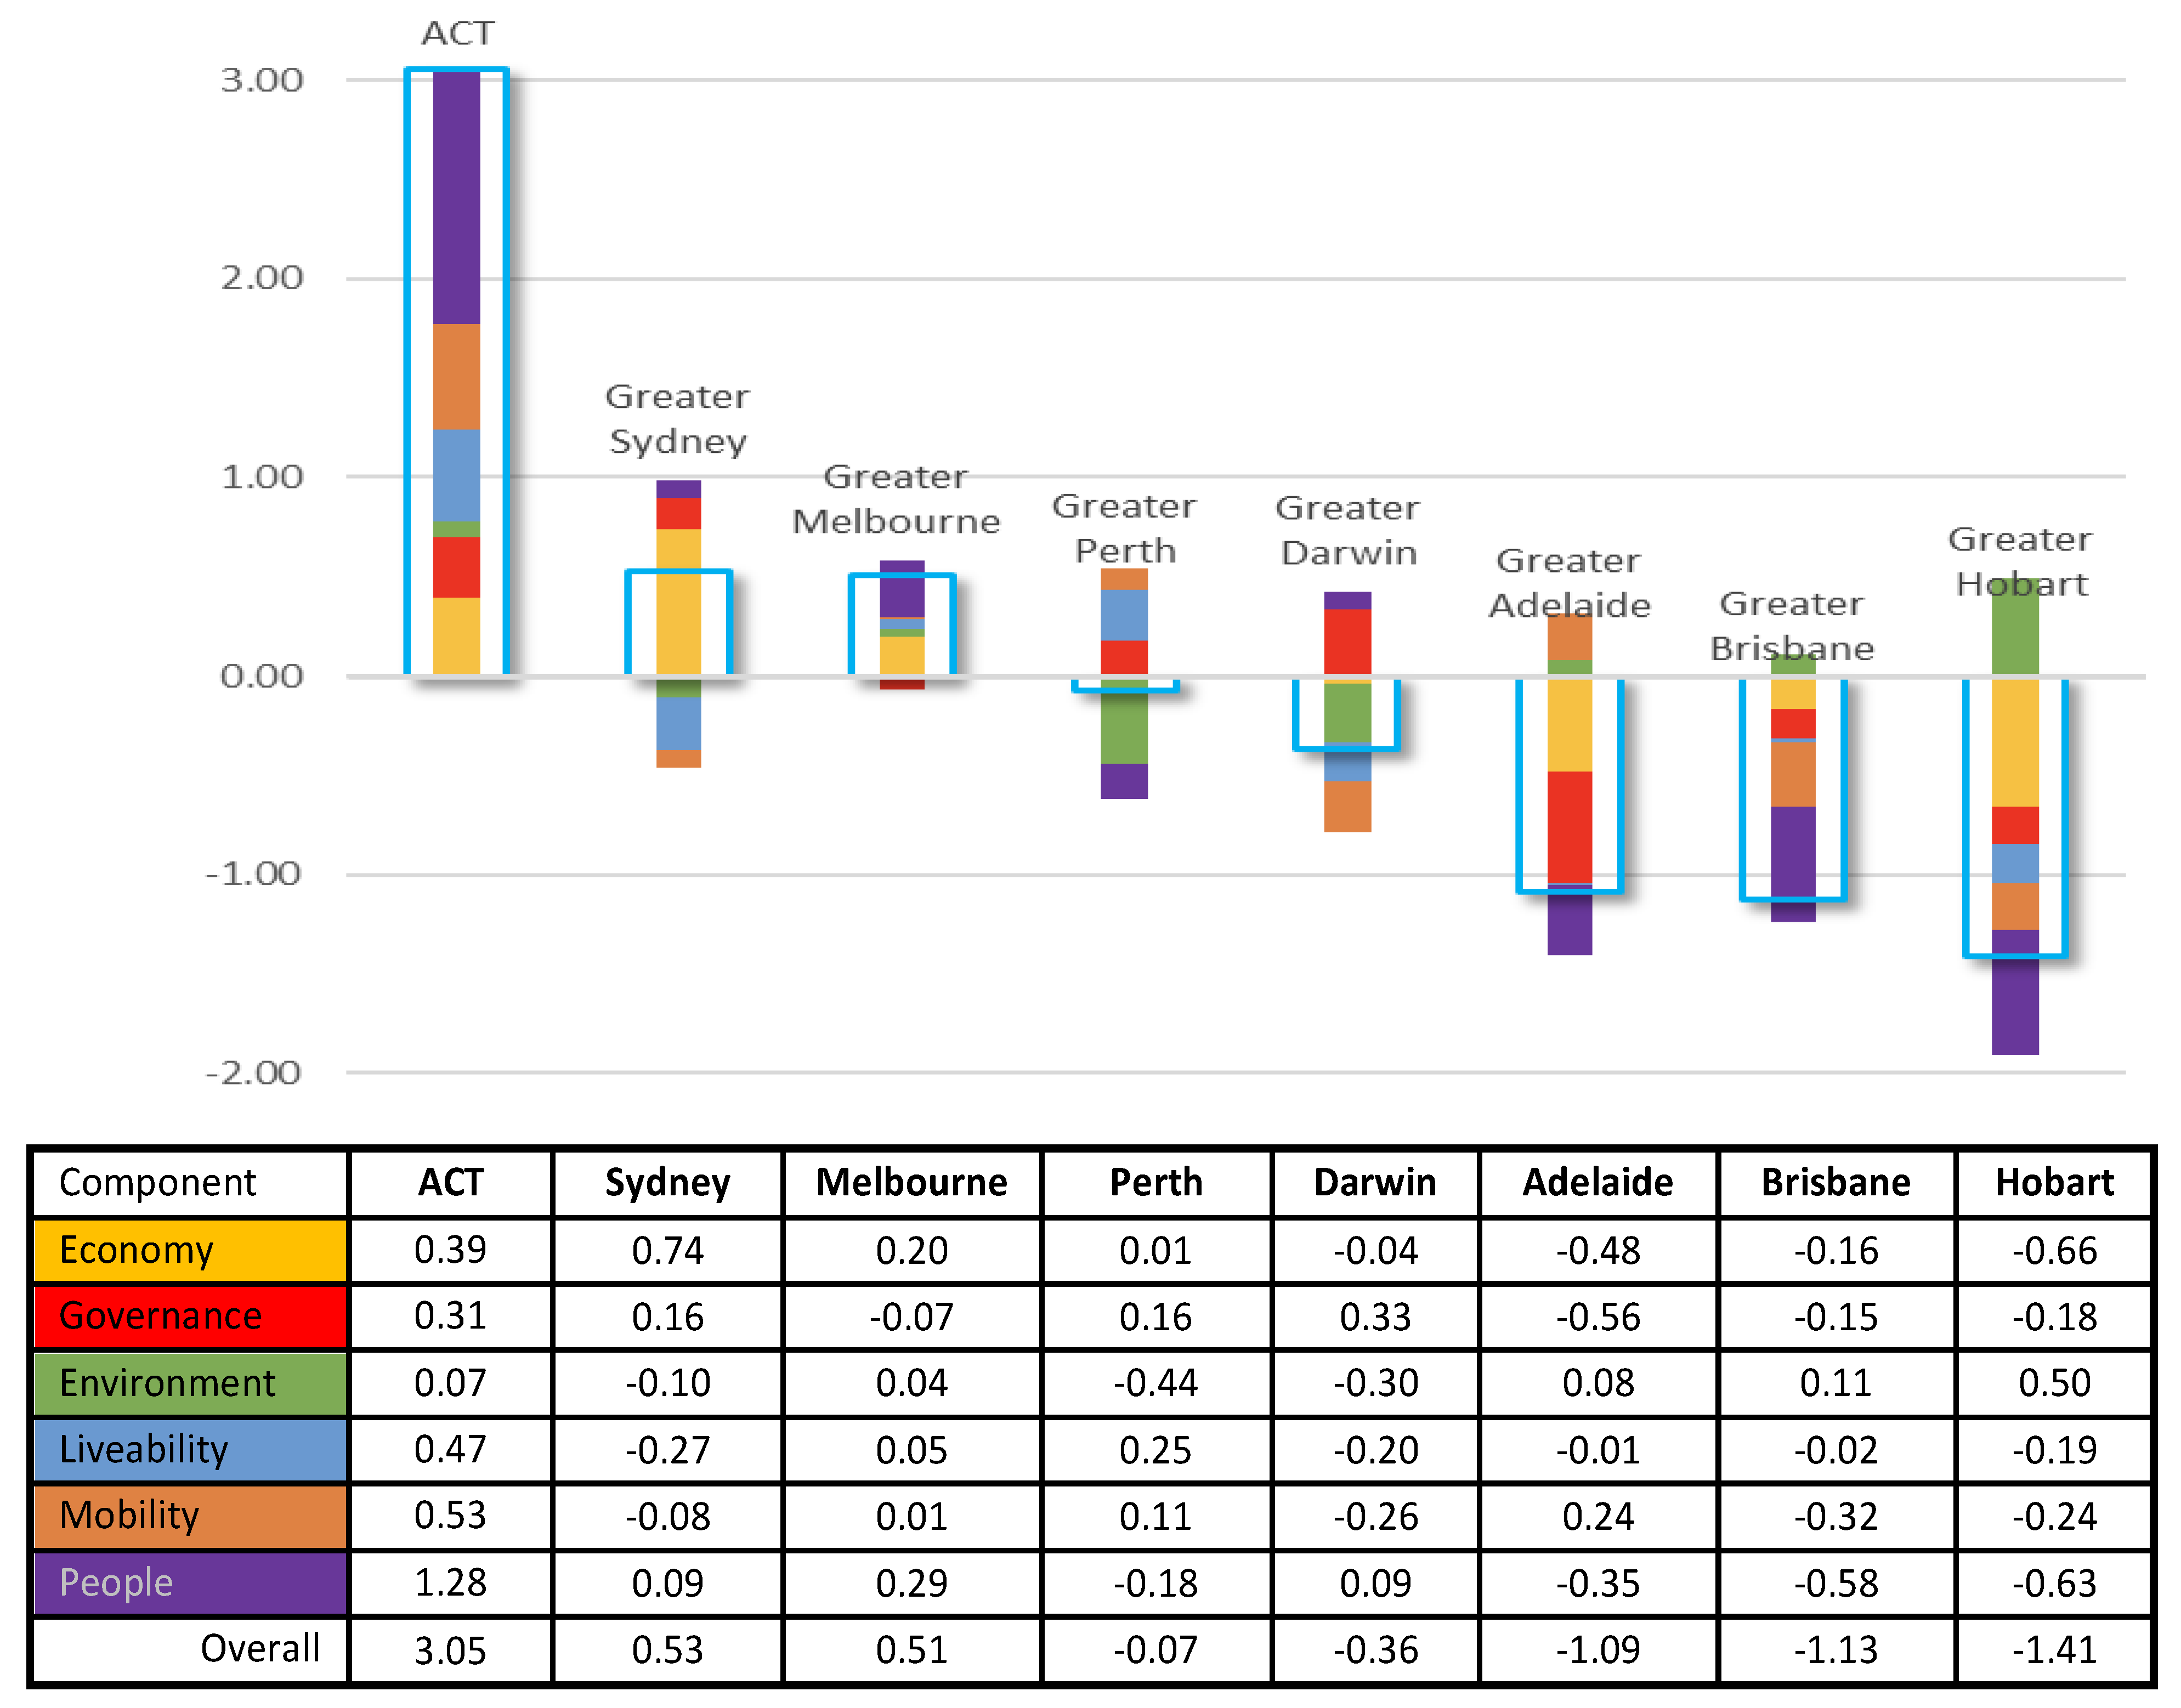
In the final overall rating, ACT ranked highest followed by a close tie between Sydney and Melbourne. Perth and Darwin are close to the overall average, while Adelaide, Brisbane, and Hobart were rated lowest overall respectively. To compare cities, regarding their overall component and factor scores, an in-depth analysis explains these results by using a more descriptive illustration of the results in next section.
4. Results and Discussions
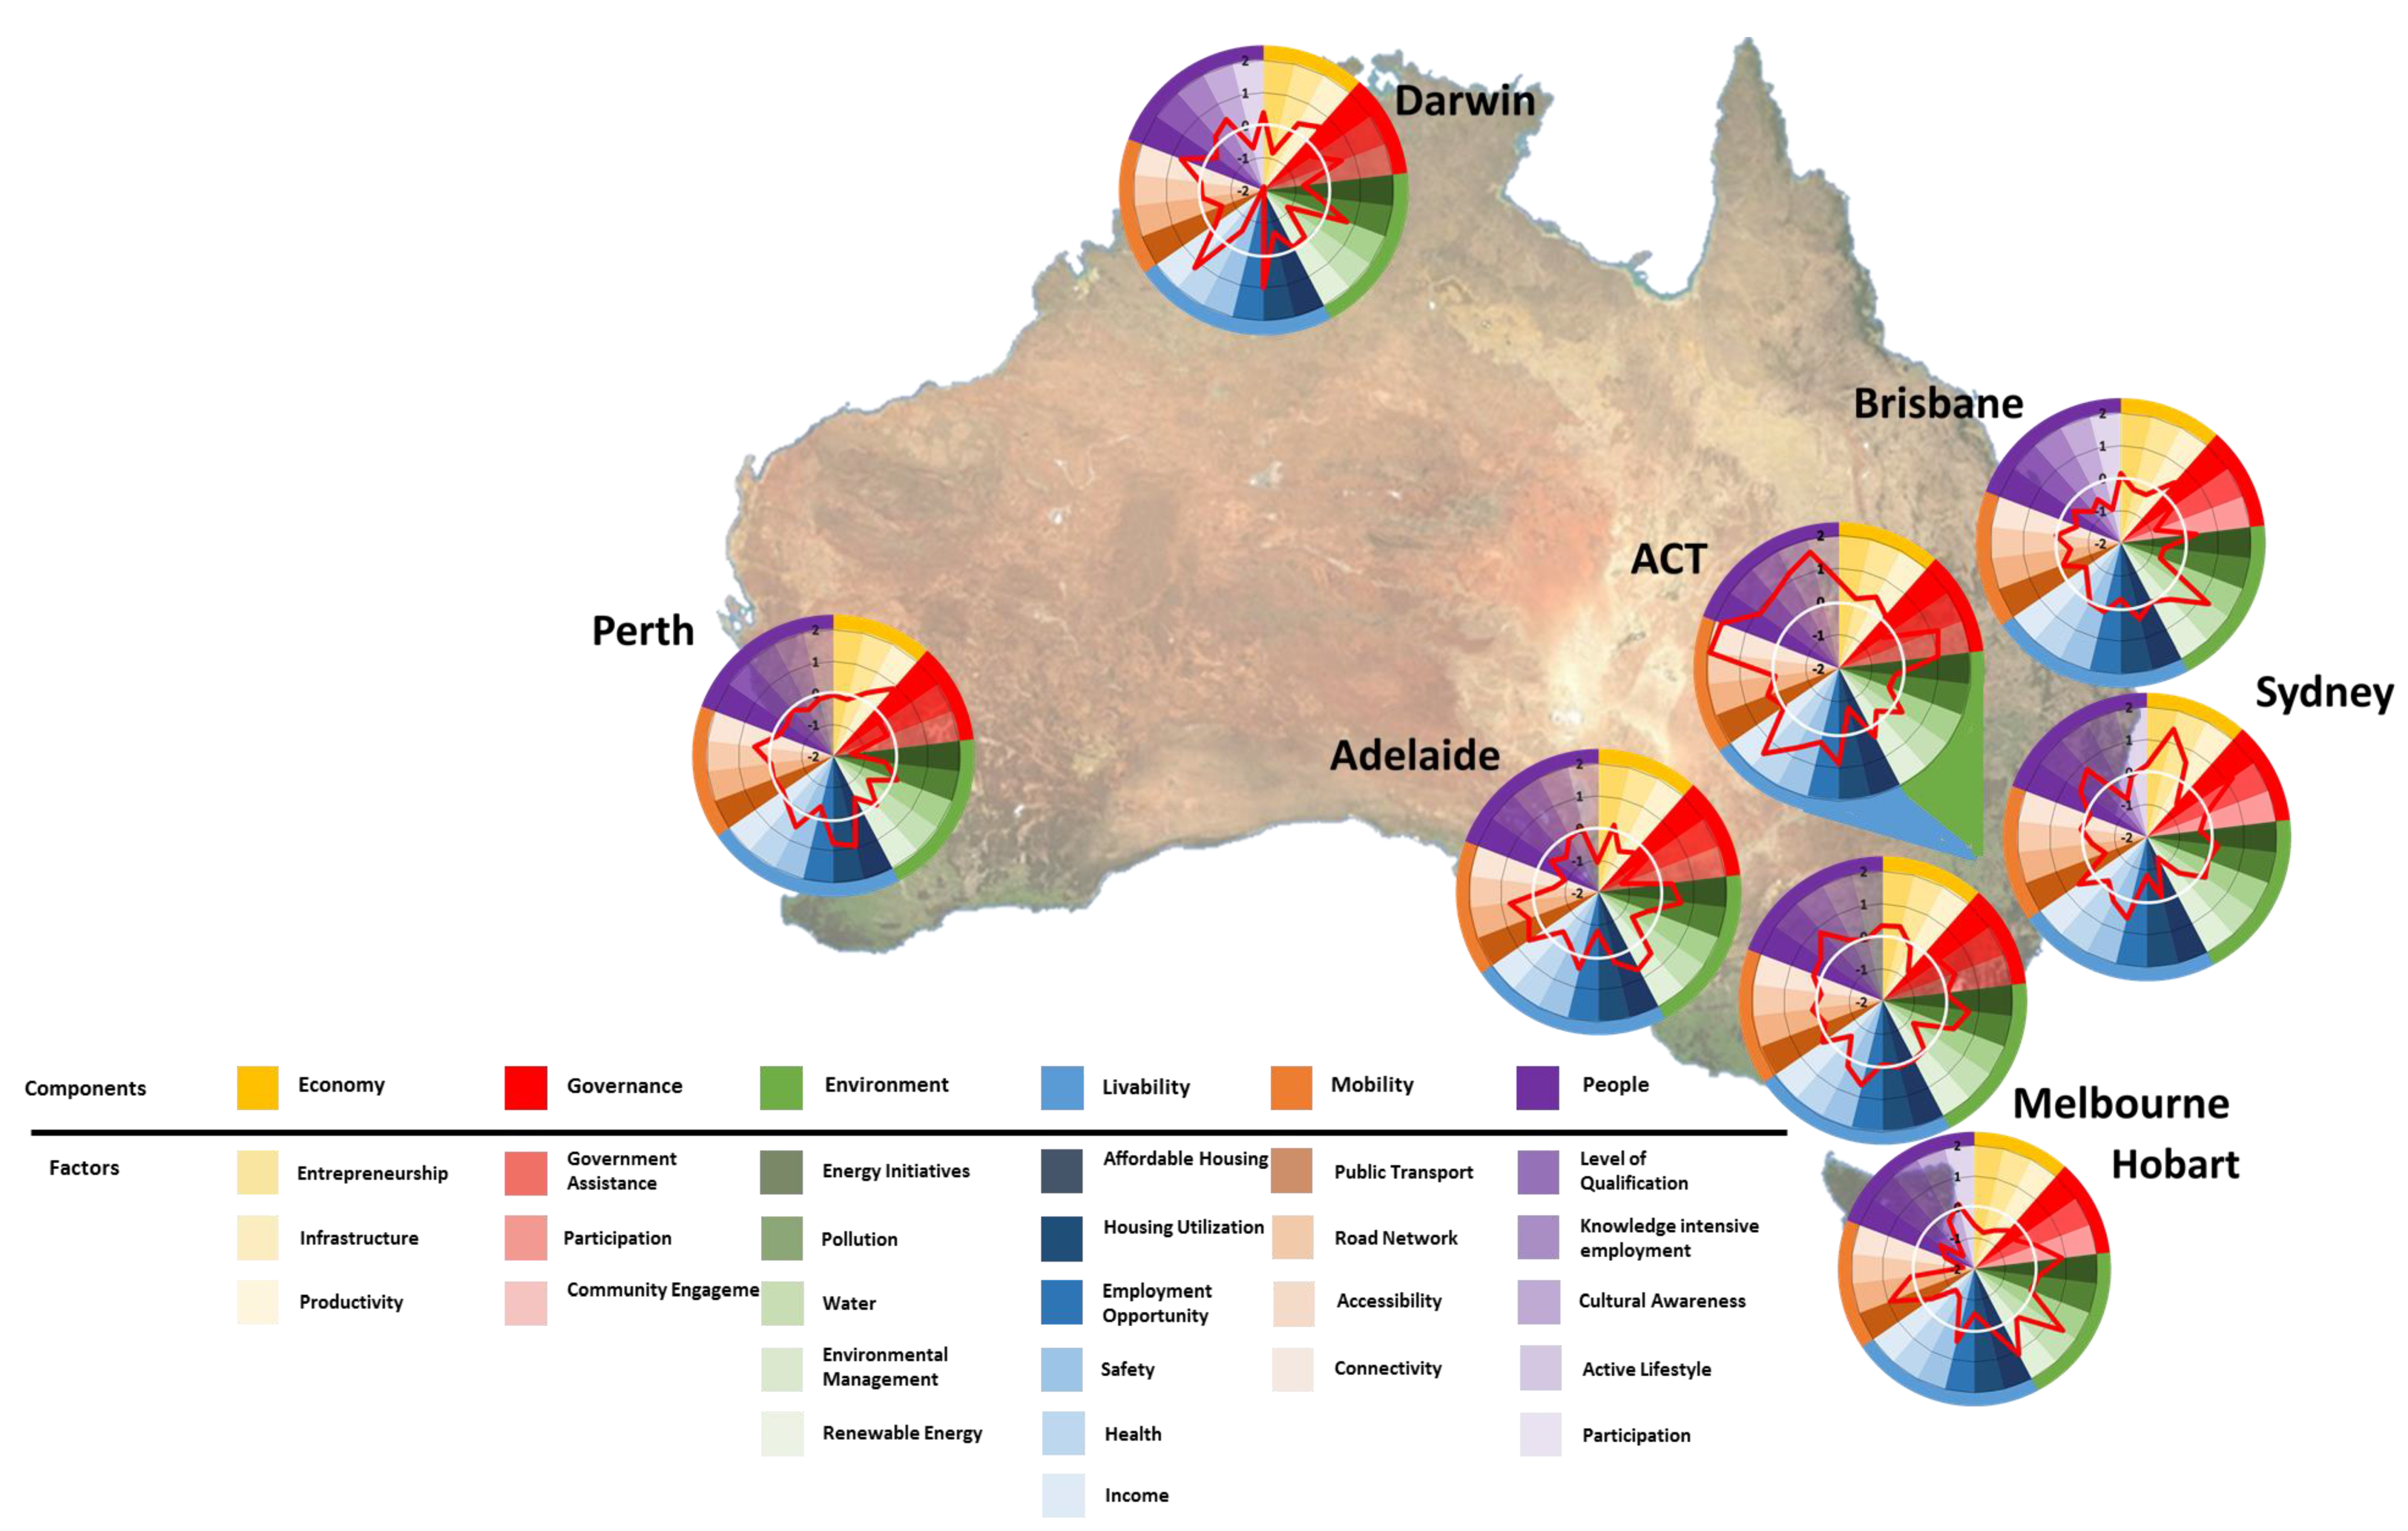
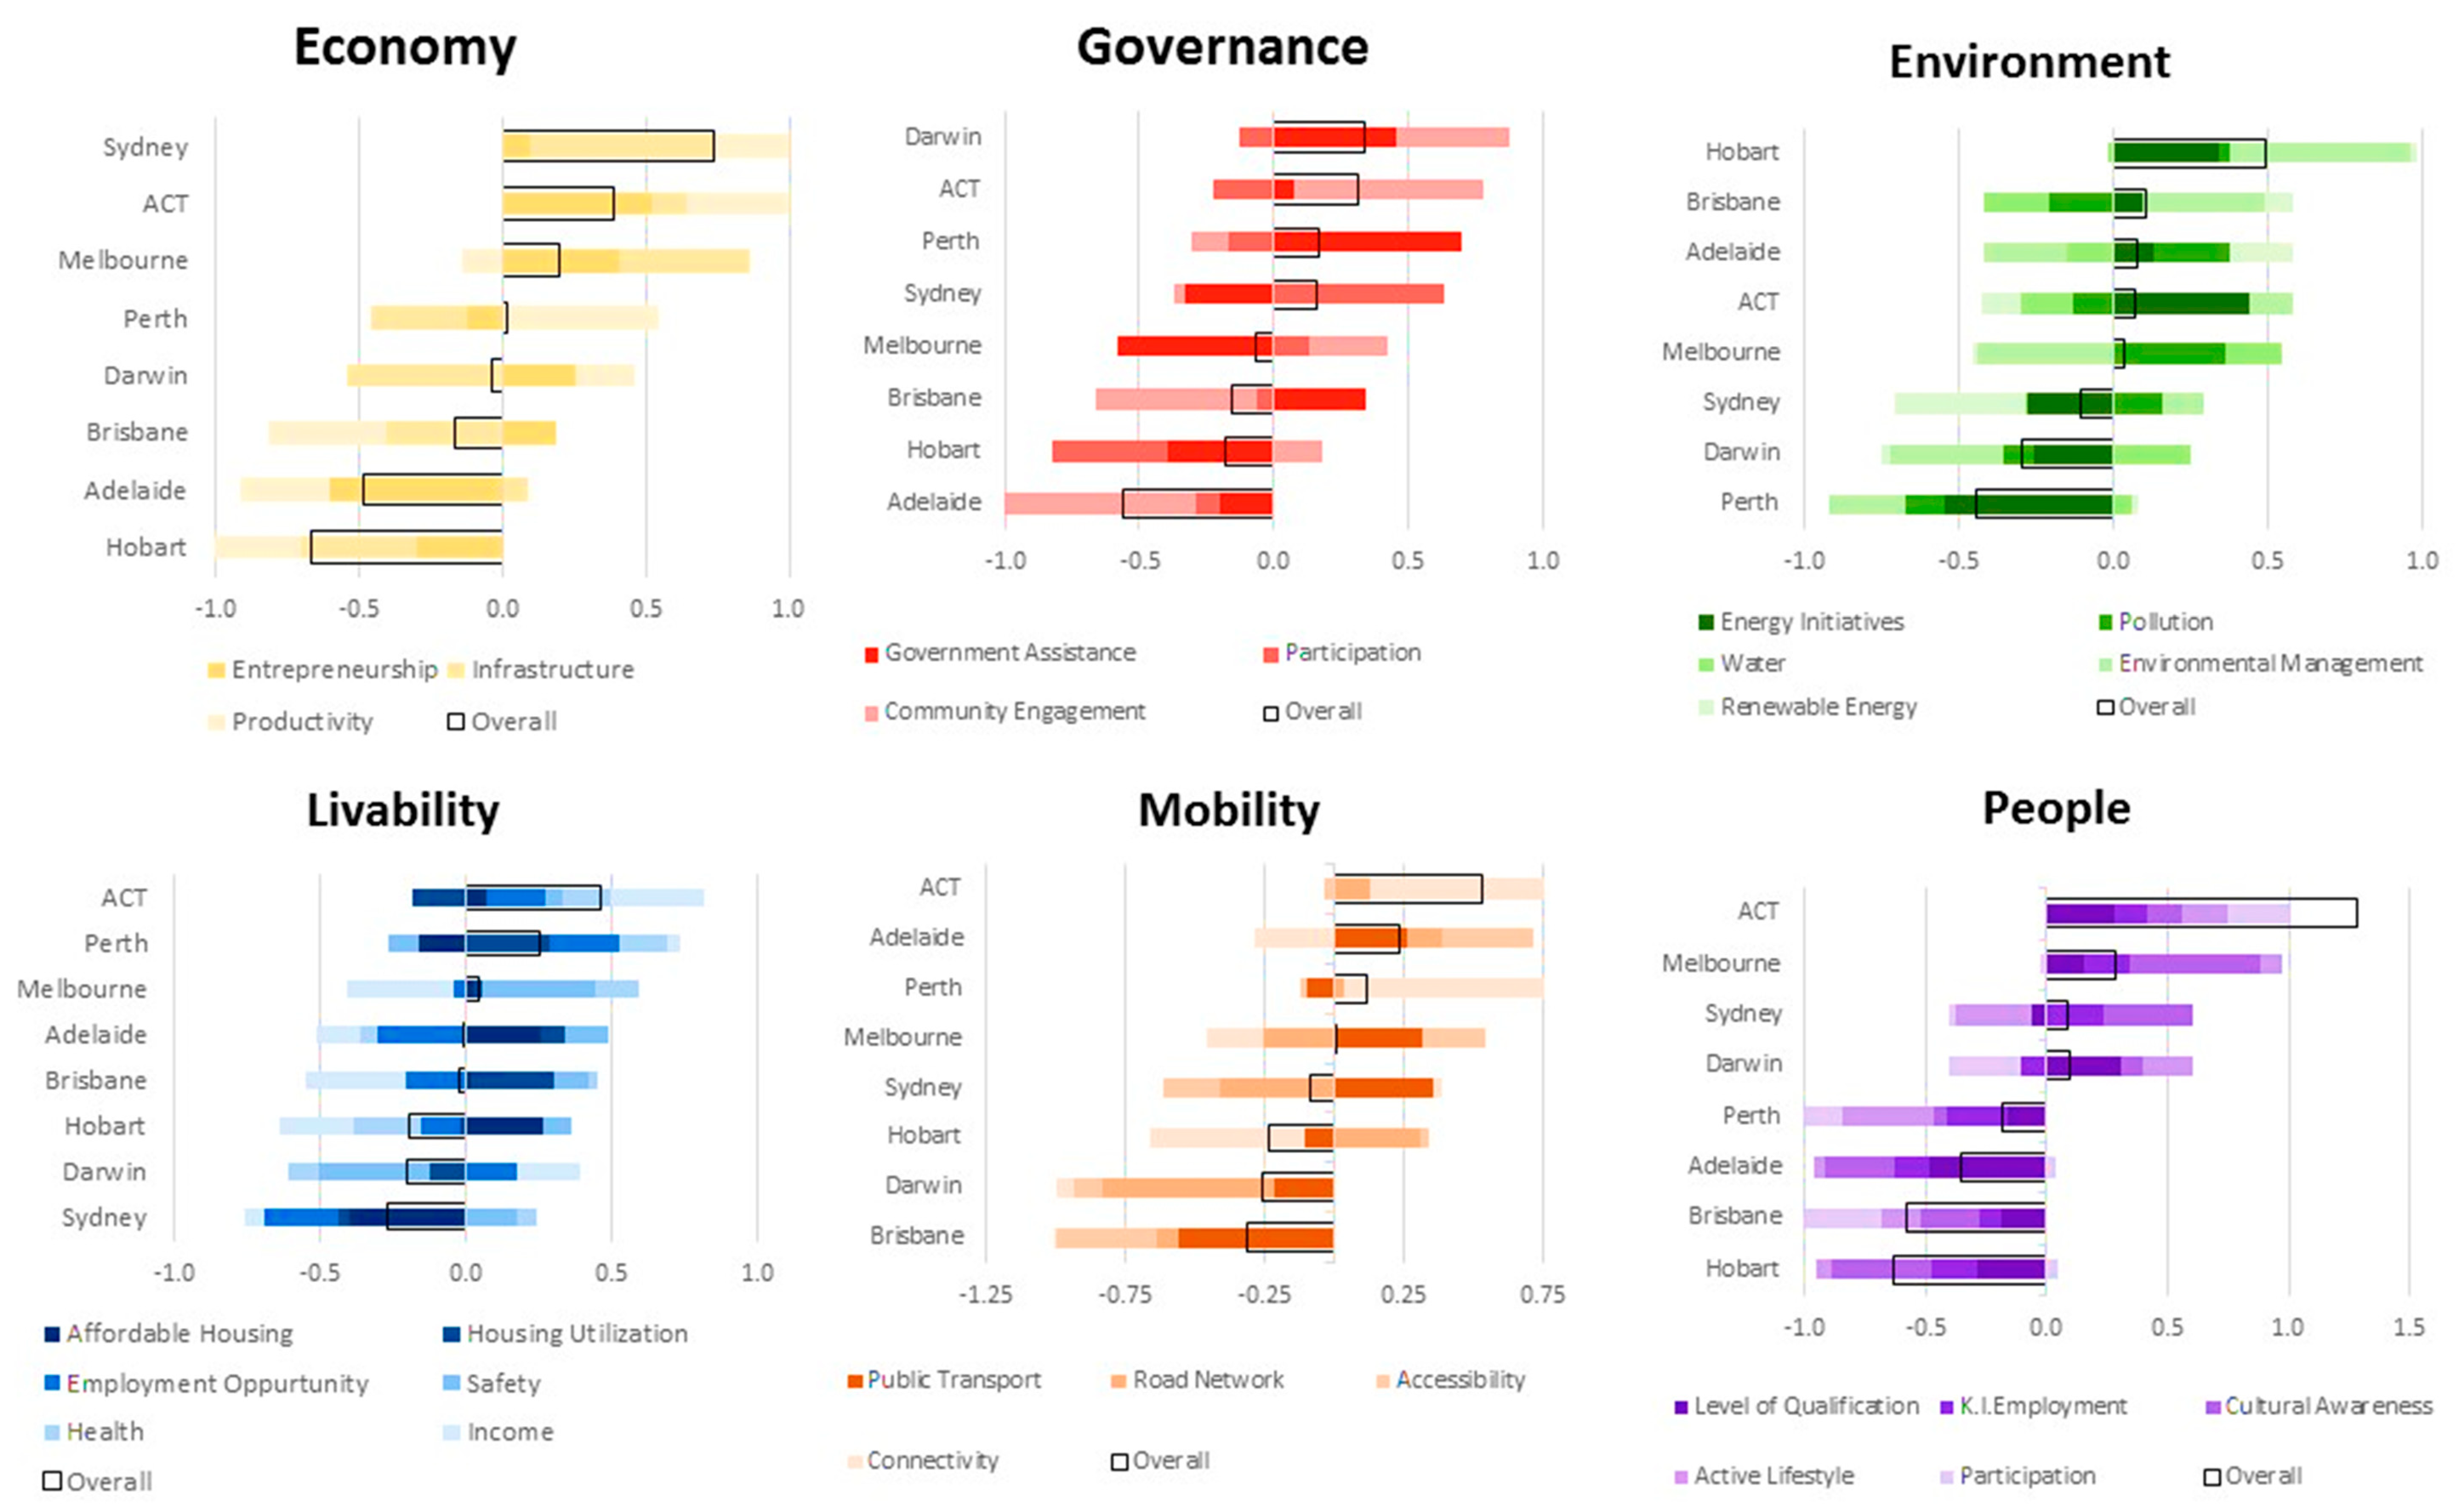
The overall scores for each city with regards to each factor have been illustrated graphically in Figure 3. These results allow the comparison of each city in terms of their strengths and weaknesses at the factors/indicators level. The results of performance at the factor level are slightly different from the overall performance at the component level due to different number of factors for every component.
4.1. Cities’ Profiles
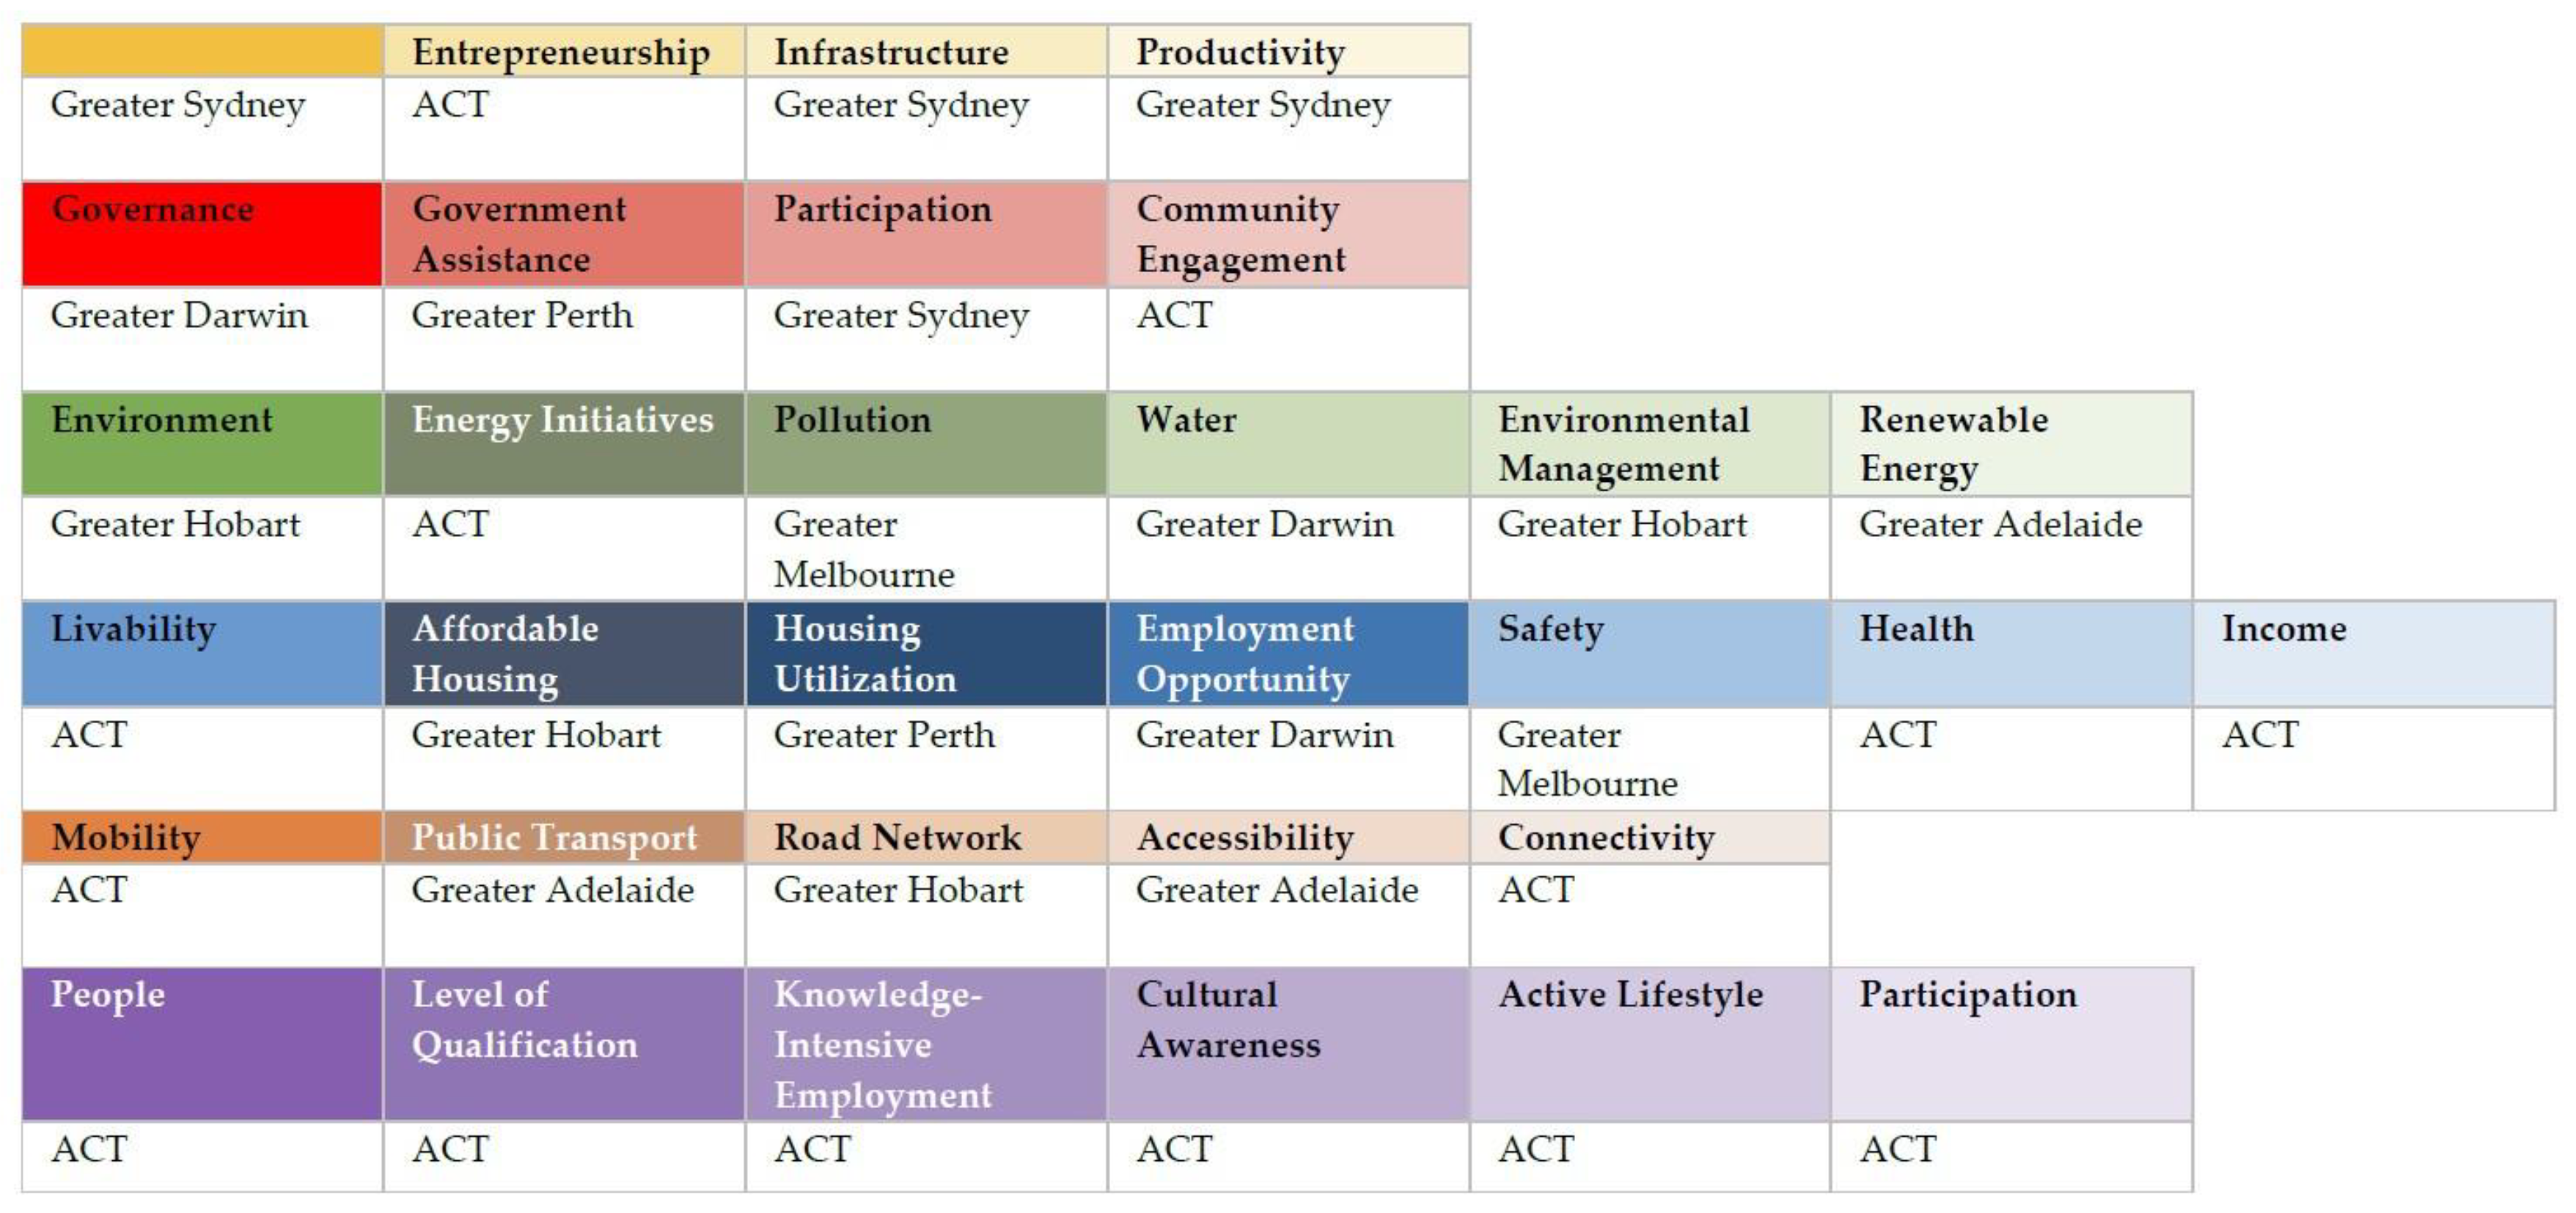
While Figure 3 shows the average smart scores for each city at the indicator/factor level, Figure 4 shows the highest rated cities per smart component and overall level. The individual performance of each city is discussed in following sections (Refer Section 4.1.1, Section 4.1.2, Section 4.1.3, Section 4.1.4, Section 4.1.5, Section 4.1.6, Section 4.1.7 and Section 4.1.8,).
4.1.1. ACT
ACT achieved the highest rating for Smart City in Australia. ACT performed outstanding in the components People, Mobility, Livability, and Governance, respectively, and is the second best in Economy following Sydney. ACT has an outstanding performance in post graduate literacy of people, Art and Museum visits, organized sport, and Managers indicators that made the city the best performing in People. The Active lifestyle of ACT contributed to the high rated component of people, as 3.4% of people visited a public library and 2.7% visited a museum or art gallery in the year 2015, compared to the national averages of 2.0% and 1.9%, respectively. Another factor which contributed the high rating was Participation as 34.7% of ACT’s people have participated in organized sport, where the national average was recorded at 24.4%. In addition to above, ACT achieving the highest amongst all cities in Australia in the factors Energy Initiatives, Income, Connectivity, Level of Qualification, and Participation. However, the performance of ACT was the worst in environment due to its poor performance in water development, solar installations, and suburbs with more than 50% solar installations, where its performance was as poor as the performances of Greater Darwin and Greater Hobart. The main components that need to be developed in order to improve ACT performance are Environment and Economy.
4.1.2. Sydney
Sydney is ranked the second-best city in Australia, scoring its highest in Economy. Sydney’s highest indicator ratings are in New businesses/total, Dwelling Worth, House Worth/Dwelling, votes for house of representatives, votes for Senate, Net Zero emissions by 2050, Assault, Utilization to work/study, Train-Tram to Work, Science/Technical Services, and Languages Spoken. Despite performing best in several indicators, the rating of Sydney dropped because of its poor performance in Livability due to its worst rating in affordable housing factor amongst all cities. For Sydney to achieve a top Smart City rating, it is recommended that it improves its performance in the factors Renewable Energy, Affordable housing, Employment Opportunity, Road Network, and Active Lifestyle.
4.1.3. Melbourne
Melbourne achieved the third highest rating for Smart City in Australia. Melbourne performed its best in the component people after ACT, as it performed its best amongst all cities for the Technicians indicator. It performed its second best in Economy due to a high ranking in self-employed indicator. Among all cities, Melbourne was the only city to not achieve a low average rating in any component. Although Melbourne performed above average in most indicators, its performance was dropped due to a negative ranking in Governance, which occurred due to its only lowest ranking factor Government Assistance. The main indicators that need to be developed in order to improve Melbourne’s performance are bus to work%, expenditure per capita, and bus network.
4.1.4. Perth
Perth’s performance was on fourth when compared to all other cities. It performed with consistency in all components, with its best in Livability, which was also the second best when compared amongst all cities after ACT. Perth performed its worst in Environment due its only lowest factor ranking, Energy Initiatives. An overall improvement in all indicators, especially in Train Network, Greenhouse Gas Emi, and Mortgage <30% Income can bring the ratings of this city higher.
4.1.5. Darwin
Along with Perth’s performance, Darwin’s performance was also average (fifth overall) when compared to the other cities, as it wasn’t ranked the worst in any components. Its best performing components was Governance due to no low-ranking results in any Governance factors. Its lowest performance was in Environment due to low performance in Renewable Energy. Darwin scored the second lowest in Livability component due to extremely low ranking for safety factor. According to the 2014 ABS Social Survey, 10.8% people in Greater Darwin feel unsafe at home alone at night, and 21.7% feel unsafe walking alone at night. The national average recorded 3.1% and 6.3%, respectively.
However, Darwin performed the best in Employment Opportunity and Water factors amongst all cities. The main components that need to be developed to improve Darwin’s performance are Environment, Mobility, and Livability.
4.1.6. Adelaide
Along with Perth’s performance, Adelaide’s performance was also average (fourth overall) when compared to the other cities, as it wasn’t ranked best or worst in any components. Adelaide performs its best in Mobility due to an outstanding performance in Taxi and second best in train network after Greater Melbourne. Another best performance was shared with greater Perth in Air Quality. However, Adelaide performed its worst in Rainwater Use, Mortgage, and Post-School Qualification. For Adelaide to improve its performance, developments need to be made in the components of People and Economy.
4.1.7. Brisbane
Brisbane performed below average compared to other cities in Australia. Its best performing component was Environment, second when compared with all cities. Brisbane’s worst component was People due to low performance in Organized Sport and Cultural Tolerance. In addition, Brisbane performed its worst in Aquatic Biota Index. Brisbane’s economy ranking is at the lower end, as the 2022 New World City Action Plan (NWCAP) [84] found that Brisbane relies too heavily upon locally generated revenues. The main components that need to be developed in order to improve Brisbane’s performance are Mobility and People.
4.1.8. Hobart
Hobart performed as the worst Smart City in Australia. Its lowest scoring component is economy and people due to its poor performance in almost all the indicators in both of the components. Hobart’s component ratings were all negative, apart from Environment, which was the best among all cities due to high raking in the environment management factor. In addition, Hobart performed the best amongst all cities in the factors Affordable Housing and Road Network. For Hobart to develop into a Smart City, major development needs to be made in all components, starting from the most important components: Economy, People, and Livability.
4.1.9. Performance Discussion
Each component is composed of different number of factors. If the analysis of each component is analyzed, informative and interesting results are obtained as shown in Figure 5. The Economy component somehow shows the leading role of Sydney, ACT, and Melbourne. Although, the Governance component demonstrates the different pattern where Darwin is leading. The results might be different since each government must prioritize its policies with respect its city’s needs. To improve Sydney’s livability, the Australian government has launched a huge plan to create Smart Cities–City Deals [85]. This new city will be home to its own airport, aerotropolis, university, and metropolis centers. To improve the Affordable Housing factor, a $150 million Livability Program will support planning systems that deliver new and improved affordable housing and help fund communities and their local projects in their quest in developing a sustainable environment.
Mobility is the only component where the difference of performance is not large between the cities, whereas people component is the one that shows exceptional performance of ACT. Further details of each cities’ best performance in each factor is shown in Figure 6.
5. Conclusions and Recommendations
This methodology allowed for an effective comparison between major cities, which proves it is applicable to both medium-sized and major locations within a country. The rating provides more information along with the results that can be utilized to improve the performance of cities regardless of overall rank. Several connections are explored during the analysis that suggest information on either cause or effect. The following recommendations were made from this research:
Lower-rated cities like Hobart, Brisbane, and Adelaide should invest in the improvement of their infrastructure to see a better economic presence regarding entrepreneurship and productivity. The same is recommended by the Department of Infrastructure and Regional Development [31]. At the same time, these cities should implement strategies to enhance the community participation and engagement to provide their governments with the insight to produce strategies to improve the performance of cities. For these cities to enhance their Smart Environment scores, it is recommended that they commit to the targets that other major cities have. The state governments should encourage smaller cities to implement smart energy and environment initiatives. Cities that require economic growth should focus on up-skilling their people to encourage knowledge-intensive industries, a typical strength of dense cities like Sydney, ACT, and Melbourne. Mobility in all cities are comparable, however, cities like Hobart, Darwin, and Brisbane may implement public transport initiatives via infrastructure to encourage the use and efficiency of public transportation. Implementing dedicated infrastructure such as in-land rail and private bus lanes can reduce road network congestion.
Cities with a low-rated livability should implement initiatives like that of ACT, where they are committed to a Smart City deal that will promote affordable housing and provide job opportunities for its people to attain a better standard of living.
The implementation of Smart People key drivers like that of ACT can encourage a healthier lifestyle. It is recommended that cities with a low rating for Smart People promote free access to museums, infrastructure to encourage cyclists, and an increase in sporting fields to incentivize team sports.
The results recommend that cities lacking in their Smart Environment rating commit to improving Net Zero Emission and Renewable Electricity Energy Targets to stimulate renewable energy innovations and regulate carbon emissions.
A city’s growth and development can be guided towards a smarter future utilizing available data to determine how to provide an existing city with a better quality of life. The goal is to achieve a better overall rating and performance, which cannot be achieved solely based on a single indicator.
The developed approach not only provided the results that are not surprising, which happens in most of the ranking systems, but also indicated the areas of attention to improve the performance of cities. The method also provides a reliable way to rank cities where data for all indicators are not available. However, considering all components and factors equally important is an assumption that need further scientific exploration. A weightage system can be included at indicators, factors, and component levels to further improve the effectiveness of the methodology. Some further investigation is recommended to do a thorough assessment of impacts on rating when some of the data is not available to perform the assessments where weightage is applied. This is a comparative ranking. An absolute ranking is required to benchmark the status of smartness for cities within a country. Components can be redefined to facilitate the governments to identify the priority areas. For example, the improvement in infrastructure will improve the component of Livability, Mobility, and People simultaneously.
The proposed model can be used in other regions/countries. However, the choice of indicators would follow the availability of data and their relevancy to the smart vision of the country. A follow up study is undergoing for the assessment of medium and small cities of Australia.
Author Contributions
Conceptualization, M.A.U.R.T., A.F. and N.M. Data curation, A.F.; Formal analysis, M.A.U.R.T., A.F. and M.L.U.R.S.; Investigation, M.A.U.R.T., A.F. and N.M.; Methodology, M.A.U.R.T., A.F. and M.H.; Project administration, M.A.U.R.T. and N.M.; Software, M.A.U.R.T. and M.H.; Supervision, M.A.U.R.T. and N.M.; Visualization, M.A.U.R.T., M.H. and M.L.U.R.S.; Writing—original draft, M.A.U.R.T. and A.F.; Writing—review & editing, M.A.U.R.T., M.H., M.L.U.R.S. and N.M. All authors have read and agreed to the published version of the manuscript.
Funding
This research received no external funding.
Acknowledgments
The authors are thankful to Farzad Khosrowshahi, Stephen Gray, and Sam Fragomeni for their administrative and management support.
Conflicts of Interest
The author declares no conflict of interest.
Appendix A. Detailed List of the Indicators used for Evaluation Process

References
- United Nations Department of Economic and Social Affairs. World Urbanization; Department of Economic and Social Affairs, Population Division: New York, NY, USA, 2019. [Google Scholar]
- Sun, Y.; Song, H.; Jara, A.J.; Bie, R. Internet of Things and Big Data Analytics for Smart and Connected Communities. IEEE Access 2016, 4, 766–773. [Google Scholar] [CrossRef]
- Battarra, R. The City: A Complex, Dynamic, Energy-Intensive System. In Smart Energy in the Smart City; Rocco Papa, R.F., Ed.; Springer: Basel, Switzerland, 2016; pp. 2–4. [Google Scholar]
- Worldometers.info. China Population—Worldometers. 2018. Available online: www.worldometers.info/world-population/china-population/ (accessed on 26 May 2018).
- Allam, Z.; Dhunny, A.; Siew, G.; Jones, D. Towards Smart Urban Regeneration: Findings of an Urban Footprint Survey in Port Louis, Mauritius. Smart Cities 2018, 1, 121–133. [Google Scholar] [CrossRef] [Green Version]
- Hollands, R.G. Will the real smart city please stand up? Intelligent, progressive or entrepreneurial? City 2008, 12, 303–320. [Google Scholar] [CrossRef]
- Olshanetsky, T. How Governments can Streamline the Adoption of Smart City Technologies. 2019. Available online: https://gcn.com/articles/2019/12/02/smart-city-proof-of-concept.aspx (accessed on 6 March 2020).
- Allam, Z. Contextualising the Smart City for Sustainability and Inclusivity. New Des. Ideas 2018, 2, 124–127. [Google Scholar]
- Sims, B. Siesmic Shifts and Retrofits. In Retrofitting Cities; Taylor and Francis Group: New York, NY, USA, 2016; pp. 124–210. [Google Scholar]
- de Jong, M.; Joss, S.; Schraven, D.; Zhan, C.; Weijnen, M. Sustainable-smart-resilient-low carbon-eco-knowledge cities; Making sense of a multitude of concepts promoting sustainable urbanization. J. Clean. Prod. 2015, 109, 25–38. [Google Scholar] [CrossRef] [Green Version]
- Wey, W.-M.; Ching, C.-H. The Application of Innovation and Catapult Research Techniques to Future Smart Cities Assessment Framework. In Proceedings of the International Conference on System Science and Engineering, Taipei, Taiwan, 28–30 June 2018. [Google Scholar]
- Liotine, M.; Ramaprasad, A.; Syn, T. Managing a Smart City’s resilience to Ebola: An ontological framework. In Proceedings of the 49th Hawaii International Conference on System Sciences, Koloa, HI, USA, 5–8 January 2016. [Google Scholar]
- Allam, Z. Achieving Neuroplasticity in Artificial Neural Networks through Smart Cities. Smart Cities 2019, 2, 118–134. [Google Scholar] [CrossRef] [Green Version]
- Allam, Z.; Tegally, H.; Thondoo, M. Redefining the Use of Big Data in Urban Health for Increased Liveability in Smart Cities. Smart Cities 2019, 2, 259–268. [Google Scholar] [CrossRef] [Green Version]
- ARCADIS. Chasing Urban Mobility; ARCADIS Design and Consultancy: Brisbane, Australia, 2017. [Google Scholar]
- Benamrou, B.; Mohamed, B.; Bernoussi, A.-S.; Mustapha, O. Ranking Models of Smart Cities; IEEE: Piscataway, NJ, USA, 2016. [Google Scholar]
- Liu, F.; Shi, Y.; Chen, Z. Smart City Ranking Reliability Analysis. In Proceedings of the International Conference on Computational Science and Computational Intelligence, Las Vegas, NV, USA, 13–15 December 2018. [Google Scholar]
- Grant, K.A.; Chuang, S. An aggregating approach to ranking cities for knowledge-based development. Int. J. Knowl.-Based Dev. 2012, 3, 17–34. [Google Scholar] [CrossRef]
- Palmisano, S.J. A Smarter Planet: The Next Leadership Agenda; IBM: Istanbul, Turkey, 2008. [Google Scholar]
- Yigitcanlar, T.; Kamruzzaman, M.; Buys, L.; Ioppolo, G.; Sabatini-Marques, J.; da Costa, E.M.; Yun, J.J. Understanding ‘Smart Cities’: Intertwining Development Drivers with Desired Outcomes in a Multidimensional Framework; Elsevier Ltd.: Amsterdam, The Netherlands, 2018. [Google Scholar]
- Macke, J.; Casagrande, R.M.; Sarate, J.A.R.; Silva, K.A. Smart City and Quality of Life: Citizens’ Perception in a Brazilian Case Study; Elsevier Ltd.: Amsterdam, The Netherlands, 2018. [Google Scholar]
- Angelidou, M. Smart Cities: A Conjuncture of Four Forces; Elsevier Ltd.: Amsterdam, The Netherlands, 2015. [Google Scholar]
- Cristea, C.V.; Alexandru, D.; Suleski, D.; Birsan, A. Copenhagen as a Smart City; Elsevier Ltd.: Bucharest, Romania, 2015. [Google Scholar]
- Batten, J. Sustainable Cities Index 2015; Arcadis: Amsterdam, The Netherlands, 2015. [Google Scholar]
- Allam, Z.; Newman, P. Redefining the Smart City: Culture, Metabolism and Governance. Smart Cities 2018, 1, 4–25. [Google Scholar] [CrossRef] [Green Version]
- Prakash, A. Smart Cities Mission in India: Some definitions and considerations. Smart Sustain. Built Environ. 2019. [Google Scholar] [CrossRef]
- Kuru, K.; Ansell, D. TCitySmartF: A Comprehensive Systematic Framework for Transforming Cities into Smart Cities. IEEE Access 2020, 8, 18615–18644. [Google Scholar] [CrossRef]
- Grid Solutions, Smart City. 2015. Available online: http://www.gegridsolutions.com/alstomenergy/grid/microsites/grid/products-andservices/ (accessed on 5 May 2018).
- Guerra, M. What exactly is a smart city? Electron. Des. 2017, 19, 20. [Google Scholar]
- Pardo, N. Conceptualizing Smart City with Dimension of Technology, People and Institutions. In Proceedings of the 12th Annual International Conference on Digital Government Research, College Park, MD, USA, 12–15 June 2011. [Google Scholar]
- Albino, V.; Beradi, U.; Dangelico, R. Smart Cities: Definitions, dimensions, performance, and initiatives. Urban Technol. 2015, 22, 3–21. [Google Scholar] [CrossRef]
- Poole, S. The Guardian. 18 December 2014. Available online: https://www.theguardian.com/cities/2014/dec/17/truth-smart-city-destroy-democracy-urban-thinkers-buzzphrase (accessed on 30 April 2018).
- Giffinger, R.; Fertner, C.; Kramar, H.; Kalasek, R.; Pichler-Milanovic, N. Smart Cities. Ranking of European Medium-Sized Cities, Final Report; Centre of Regional Science: Vienna, Austria, 2007. [Google Scholar]
- Isaac, O.B.-A.; Capeluto, G. Assessing the green potetial of existing buildings towards smart cities and districts. Indoor Built Environ. 2015, 25, 1124–1135. [Google Scholar]
- Murgante, B. Cities and Smartness: The True Challenge. Agric. Environ. Inf. Syst. 2015, 6, 5. [Google Scholar]
- Giffinger, R.; Gudrun, H. Smart cities ranking: An effective instrument for the positioning of cities? ACE Archit. City Environ. 2010, 4, 7–25. [Google Scholar]
- Lee, J.H.; Phaal, R.; Lee, S.-H. An integrated service-device-technology roadmap for smart city development. Technol. Forecast. Soc. Chang. 2013, 80, 286–306. [Google Scholar] [CrossRef]
- Herrschel, T. Competitiveness and Sustainability: Can ‘Smart City Regionalism’ Square the Circle; Sage Publications: New York, NY, USA, 2013. [Google Scholar]
- Mohanty, S.; Choppali, U.; Kougianos, E. Everything You Wanted to Know about Smart Cities; IEEE: Piscataway, NJ, USA, 2016. [Google Scholar]
- Australian Bureau of Statistics. Regional Population Growth, Australia, 2016–2017. 2019. Available online: https://www.abs.gov.au/ausstats/[email protected]/Lookup/3218.0main+features952016-17 (accessed on 11 February 2020).
- Hugo, G. Changing Patterns of Population Distribution in Australia. J. Popul. Res. 2002, 2001, 1–21. [Google Scholar]
- Australian Bureau of Statistics. Main Features—State Stories, Australia. 2017. Available online: https://www.abs.gov.au/ausstats/[email protected]/Lookup/by%20Subject/2071.0~2016~Main%20Features~Snapshot%20of%20Australia,%202016~2 (accessed on 14 October 2018).
- Australian Bureau of Statistics. 3218.0 Regional Population Growth, Australia. 2017. Available online: http://www.abs.gov.au/AUSSTATS/[email protected]/allprimarymainfeatures/7B33A7E366915C49CA258291001DFE75?opendocument (accessed on 14 October 2018).
- Australian Bureau of Statistics. Australian Demographic Statistics, June 2016. 2017. Available online: http://www.abs.gov.au/AUSSTATS/[email protected]/Lookup/3101.0Main+Features1Jun%202016?OpenDocument (accessed on 1 September 2018).
- O’brien, J. 5 Australian Cities Battle for ‘Smart City’ Glory. CIO, 4 September 2018. Available online: https://www.cio.com.au/article/646152/5-australian-cities-battle-smart-city-glory/ (accessed on 30 October 2018).
- The Department of the Prime Minister and Cabinet. Smart Cities Plan; The Department of the Prime Minister and Cabinet: Canberra, Australia, 2016. [Google Scholar]
- DFAT. 2030 Agenda for Sustainable Development. 2018. Available online: https://dfat.gov.au/aid/topics/development-issues/2030-agenda/Pages/sustainable-development-goals.aspx (accessed on 30 October 2018).
- Barns, S.; Cosgrave, E.; Acuto, M.; Mcneill, D. Digital Infrastructures and Urban Governance. Urban Policy Res. 2016, 35, 20–31. [Google Scholar] [CrossRef]
- Department of Infrastructure and Regional Development Cities. 27 September 2018. Available online: https://infrastructure.gov.au/cities/ (accessed on 10 October 2018).
- Sustainable Development Solutions Network. A New Report Tracks Australia’s Progress on the SDGs; Sustainable Development Solutions Network (SDSN): New York, NY, USA, 2019; Available online: http://ap-unsdsn.org/a-new-report-tracks-australias-progress-on-the-sdgs/ (accessed on 11 February 2019).
- Thwaites, T.K.J. Australia Falls Further in Rankings on Progress towards UN Sustainable Develeopment Goals the Conversation. 11 July 2018. Available online: http://theconversation.com/australia-falls-further-in-rankings-on-progress-towards-un-sustainable-development-goals-99737 (accessed on 30 October 2018).
- Kaneva, N. Nation Branding: Toward an Agenda for Critical Research. Int. J. Commun. 2011, 5, 117–141. [Google Scholar]
- Sassen, S. The Global City: New York, London, Tokyo, 2nd ed.; Princeton, N.J., Ed.; Princeton University Press: Oxford, UK, 2001. [Google Scholar]
- Register, R. Ecocities: Rebuilding Cities in Balance with Nature; New Society: Gabriola Island, BC, Canada, 2006. [Google Scholar]
- Albino, V.; Berardi, U.; Dangelico, R.M. Smart cities: Definitions, dimensions and performance. Semant. Sch. 2013, 2013, 1723–1738. [Google Scholar] [CrossRef]
- Grydehøj, A.; Kelman, I. Island Smart Eco-Cities: Innovation secessionary enclaves, and the selling of sustainability. Urban Isl. Stud. 2016, 2, 1–24. [Google Scholar] [CrossRef]
- Unit, E.I. The Global Liveability Index. 2019. Available online: http://www.eiu.com/topic/liveability (accessed on 2 January 2019).
- Unit, E.I.; Worldwide Cost of Living 2019. Economist Intelligence Unit. 1 January 2019. Available online: http://www.eiu.com/topic/worldwide-cost-of-living (accessed on 2 January 2019).
- El-Shakhs, S. Development, Primacy, and Systems of Cities. J. Dev. Areas 1972, 7, 11–36. [Google Scholar] [PubMed]
- Phillis, Y.A.; Kouikoglou, V.S.; Verdugo, C. Urban sustainability assessment and ranking of cities. Comput. Environ. Urban Syst. 2017, 64, 254–265. [Google Scholar] [CrossRef]
- Cugurullo, F. Exposing smart cities and eco-cities: Frankenstein urbanism and the sustainability challenges of the experimental city. Environ. Plan. Econ. Space 2017, 1, 83–92. [Google Scholar] [CrossRef]
- Ramaprasad, A.; Sánchez-Ortiz, A.; Syn, T. A Unified Definition of a Smart City. In Electronic Government EGOV 2017, Lecture Notes in Computer Science; Springer: Cham, Switzerland, 2017. [Google Scholar]
- Bholey, M. Smart Cities and Sustainable Urbanism: A study from policy and design perspective. Sch. Int. J. Multidiscip. Allied Stud. 2017, 4, 36–49. [Google Scholar] [CrossRef]
- Khaund, K. Smart Cities: From Concept to Reality; Frost and Sulivan: Mountain View, CA, USA, 2013. [Google Scholar]
- Bruni, E.; Panza, A.; Sarto, L.; Khayatian, F. Evaluation of cities’ smartness by means of indicators for small and medium cities and communities: A methodology for Northern Italy. Sustain. Cities Soc. 2017, 34, 193–202. [Google Scholar]
- Wu, Z. Intelligent City Evaluation System; Springer: Singapore, 2018. [Google Scholar]
- The Economist. Hotspot 2025, Benchmarking of the Future Competiveness of Cities; The economist Intelligence Unit Limited: London, UK, 2013. [Google Scholar]
- Allam, Z.; Dhunny, Z.A. On big data, artificial intelligence and smart cities. Cities 2019, 89, 80–91. [Google Scholar] [CrossRef]
- Di Giuda, G.M.; Villa, V.; Piantanida, P.; Tagliabue, L.C.; Rinaldi, S.; De Angelis, E.; Ciribini, A.L.C. Progressive energy retrofit for the educational building stock in a smart city. In Proceedings of the 2016 IEEE International Smart Cities Conference (ISC2), Trento, Italy, 12–15 September 2016. [Google Scholar]
- Joss, M.A. Theeco-city as urban technology: Perspectives on Caofeidian international eco-city. J. Urban Technol. 2013, 20, 115–137. [Google Scholar] [CrossRef]
- Dopazo, E.; Martinez-Cespedes, M. Rank aggregation methods dealing with incomplete information applied to Smart Cities. In Proceedings of the 2015 IEEE International Conference on Fuzzy Systems, Istanbul, Turkey, 2–5 August 2015. [Google Scholar]
- Rickwood, P.; Giurco, D.; Glazebrook, G.; Kazaglis, A.; Thomas, L.; Zeibots, M.; Boydell, S.; White, S.; Caprarelli, G.; McDougal, J. Integrating Population, Land Use, Transport, Water and Energy-use Models to Improve the Sustainability of Urban Systems; University of Technology Sydney: Sydney, Australia, 2007. [Google Scholar]
- Giffinger, R.; Fertner, C.; Kramar, H.; Meijers, E. City-ranking of European medium-sized cities. Cent. Reg. Sci. 2007, 1, 12. [Google Scholar]
- Yigitcanlar, T.; Lee, S.H. Korean ubiquitous-eco city: A smart-sustainable urban form or a hoax? Technol. Forecast. Soc. Chang. 2014, 89, 100–114. [Google Scholar] [CrossRef] [Green Version]
- Munier, N. Methodology to Select a Set of Urban Sustainability Indicators to Measure the State of the City, and Performance Assessment; Elsevier Ltd.: Amsterdam, The Netherlands, 2011. [Google Scholar]
- Klopp, J.M.; Petretta, D.L. The Urban sustainable Development Goal: Indicators, Complexity and the Politics of Measuring Cities; Elsevier Ltd.: Amsterdam, The Netherlands, 2017. [Google Scholar]
- Dias, D.; Amorim, J.H.; Sá, E.; Borrego, C.; Fontes, T.; Fernandes, P.; Pereira, S.R.; Bandeira, J.; Coelho, M.C.; Tchepel, O. Assessing the Importance of Transportation Activity Data for Urban Emission Inventories; Elsevier Ltd.: Amsterdam, The Netherlands, 2018. [Google Scholar]
- Agyeman, J.; Evans, T. Toward Just Sustainability in Urban Communities: Building Equity Rights with Sustainable Solutions; Sage Publications: New York, NY, USA, 2003. [Google Scholar]
- Dizdaroglu, D. Developing Micro-Level Urban Ecosystem Indicators for Sustainability Assessment; Elsevier Inc.: Amsterdam, The Netherlands, 2015. [Google Scholar]
- Onnom, W.; Tripathi, N.; Nitivattanonon, V.; Ninsawat, S. Development of a Liveable City Index (LCI) Using Multi Criteria Geospatial Modelling for Medium Class Cities in Developing Countries. Sustainability 2018, 10, 520. [Google Scholar] [CrossRef] [Green Version]
- Jackson, M.R.; Kabwasa-Green, F.; Herranz, J. Cultural Vitality in Communities: Interpretation and Indicators; The Urban Institute: Washington, DC, USA, 2006. [Google Scholar]
- Kitchin, R.; Lauriault, T.P.; McArdle, G. Knowing and governing cities through urban indicators, city benchmarking and real-time dashboards. Reg. Stud. Reg. Sci. 2015, 2, 6–28. [Google Scholar] [CrossRef] [Green Version]
- Okulicz-Kozaryn, A. City Life: Rankings (Livability) Versus Perceptions (Satisfaction). Soc. Indic. Res. 2013, 110, 433–451. [Google Scholar] [CrossRef]
- Bell, M.L.; Cifuentes, L.A.; Davis, D.L.; Cushing, E.; Telles, A.G.; Gouveia, N. Environmental Health Indicators and a Case Study of Air Pollution in Latin American Cities; Academic Press: Cambridge, MA, USA, 2011; Volume 111, pp. 57–66. [Google Scholar]
- Escolar, S.; Villanueva, F.J.; Santofimia, M.J.; Villa, D.; Toro, X.d.; López, J.C. A Multiple-Attribute Decision Making-based approach for smart city rankings design. Technol. Forecast. Soc. Chang. 2019, 142, 42–55. [Google Scholar] [CrossRef]
Figure 1.
Schematic layout of defined methodology.

Figure 2.
Selected component and factors for the evaluation purpose.

Figure 3.
Performance of Australian cities at the factor level.

Figure 4.
Overall city-ranking for major Australian cities.

Figure 5.
Performance of each city in different components.

Figure 6.
Best performing cities at components and factors levels.


Table 1.
Selection criteria for the comparison of major Australian cities.
| Criteria | Description | Range |
|---|---|---|
| 1 | Population total | >500,000 |
| 2 | Population growth rate | >2% |
| 3 | Population density | >500 persons/km2 |
| 4 | At least one university | To exclude cities with a weak knowledge basis |
Table 2.
Data sources for analysis.
| Type of Data | Coverage Level |
|---|---|
| Greater Capital City Statistics | Regional |
| 41590 Social Survey | State |
| 41020 Australian Social Trends | State |
| 13700 Measures of Australia’s Progress | State |
| ATTA–Transport | State |
| Climate Council | State |
| Other | Regional |
© 2020 by the authors. Licensee MDPI, Basel, Switzerland. This article is an open access article distributed under the terms and conditions of the Creative Commons Attribution (CC BY) license (http://creativecommons.org/licenses/by/4.0/).
Share and Cite
MDPI and ACS Style
Tariq, M.A.U.R.; Faumatu, A.; Hussein, M.; Shahid, M.L.U.R.; Muttil, N. Smart City-Ranking of Major Australian Cities to Achieve a Smarter Future. Sustainability 2020, 12, 2797. https://0-doi-org.brum.beds.ac.uk/10.3390/su12072797
AMA Style
Tariq MAUR, Faumatu A, Hussein M, Shahid MLUR, Muttil N. Smart City-Ranking of Major Australian Cities to Achieve a Smarter Future. Sustainability. 2020; 12(7):2797. https://0-doi-org.brum.beds.ac.uk/10.3390/su12072797
Chicago/Turabian StyleTariq, Muhammad Atiq Ur Rehman, Alavaiola Faumatu, Maha Hussein, Muhammad Laiq Ur Rahman Shahid, and Nitin Muttil. 2020. "Smart City-Ranking of Major Australian Cities to Achieve a Smarter Future" Sustainability 12, no. 7: 2797. https://0-doi-org.brum.beds.ac.uk/10.3390/su12072797
Note that from the first issue of 2016, this journal uses article numbers instead of page numbers. See further details here.