Circular Economy Concept in the Context of Economic Development in EU Countries


Faculty of Tourism and Hospitality Management, University of Rijeka, Primorska 42, 51410 Opatija, Croatia
*
Author to whom correspondence should be addressed.
Sustainability 2020, 12(7), 3060; https://0-doi-org.brum.beds.ac.uk/10.3390/su12073060
Submission received: 11 February 2020
/
Revised: 25 March 2020
/
Accepted: 2 April 2020
/
Published: 10 April 2020
(This article belongs to the Section Economic and Business Aspects of Sustainability)
Abstract
:The need has arisen to implement a circular economic model that enables economic growth and prosperity in accordance with environmental protection and sustainable development because of the current unsustainable linear means of production in the economy. The aim of this paper is to determine the application of the circular economy concept in member countries of the European Union from 2008 to 2016. The purpose is to analyse whether economic development measured by GDP (gross domestic product) affects the analysed circular economy variables. Based on the hypotheses set, an econometric model was formed where GDP was identified as an independent variable, while the dependent variables were the production of municipal waste per capita, the recycling rate of municipal waste, the recycling rate of packaging waste by type of packaging, the recycling of bio-waste, and the recycling rate of e-waste. The first part of the statistical analysis conducted using the Stata software package shows the Pearson correlation between the abovestated variables, while the second part explores the univariate regression model. The results point towards the conclusion that the application of the circular economy concept can ensure economic growth and GDP growth while reducing the use of natural resources and ensuring greater environmental protection.
1. Introduction
In a circular economy, waste generation is minimized through the careful design of new products and an industrial process in which materials constantly circulate in a “closed-loop system” [1]. Waste has become extremely present across the whole planet, and raw materials are in demand more than ever. It is estimated that around 80% of all materials and consumer goods are disposed of and that upon entering the food supply chain, over 30% of processed food is thrown away [2]. Applying the circular economy concept encourages environmental protection and social prosperity [3], while enabling economic growth in line with sustainable development. A circular economy can reduce environmental devastation in the whole system, as well as increase the generation of new added value. The European Commission has assessed that transitioning to a circular economy would mean an additional 600 billion euros in annual economic gains for the European Union (EU) manufacturing sector [4]. The current linear production method uses energy in all production phases; it is based on the “extract-produce-use-dump” model and represents an unsustainable production model. On the other hand, a circular economy enables an economic system in which raw materials circulate and are transformed from one form into another, resulting in no or minimal waste generation. The idea behind the circular economy concept has been developing as a consequence of realising the negative environmental impact of the linear production method. In this paper, we determine the application of the circular economy concept in the context of contemporary economic development on two levels. The first level encompasses the theoretical consideration of a circular economy as needed by contemporary economies worldwide to achieve resource and economic sustainability. The second is the applied level that explores the economic development impact of members of the European Union in relation to the implementation of a circular economy, as well as achieving the sustainable development of the economy. By using the Eurostat indicators, we researched the relationships between the gross domestic product and waste generation per capita in particular member countries of the European Union, and we have determined a correlation between the use of secondary raw materials in relation to the production of municipal waste per capita/year, and have also identified to what extent the number of patents in a circular economy generates a higher gross domestic product. Considering the fact that estimates of circularity on the national or micro level are very rare and that analyses of the impact of GDP (gross domestic product) on the implementation of a circular economy are very insufficient, this paper represents a contribution in that field.
The paper is organised as follows—after the introduction, the second section describes the available literature. The third section describes the research methodology and statistical analysis. The fourth section presents the research results and the discussion, and the final section is the conclusion. The final chapter also presents the limitations of this research but also provides guidelines for future research.
2. Literature Review
The term circular economy has been studied since the 1970s. Pearce and Turner, who studied the impact of natural resources on economic systems and impact for linear and open-ended perspectives, have provided significant contributions [5]. Bouding (1966) has also influenced such a line of thinking because he studied the Earth as a closed circular system with a limited assimilative capacity and concluded that the economy and environment should coexist in balance [6]. Stahel and Reday stated specific features of a circular economy with a focus on an industrial economy [6]. They envisioned the economy as a closed loop with materials circulating, thus preventing the generation of waste, creating new jobs, achieving resource efficiency and the dematerialization of the industrial economy. Stahel argued that using the term ‘consumption’ instead of ‘ownership’ of goods is the most relevant sustainable business model for a circular economy, thus enabling the industry to profit without the need for external costs and risk regarding waste [6]. In the beginning, the circular economy concept was based on the 3R principle (reduce, reuse, recycle), while more recently it has turned into the 6R principle (reuse, recycle, redesign, remanufacture, reduce, recover) [3]. The implementation of a circular economy has appeared as a response to the need to challenge the flaws of the current linear economic system. Contrary to linear production methods, circular economy systems retain added value from products for as long as possible with the aim of eliminating the generation of waste.
A circular economy ensures multiple mechanisms of generating new value that are separate from the exploitation of limited natural resources. A circular economy can be defined in different ways. Here are some of the most cited definitions of a circular economy. “The centre of a circular economy is the circular (closed) flow of raw materials and energy consumption in multiple phases” [7]. Another definition is that it is “an economy based on a spiral loop, i.e., a system that minimizes matter, energy flow and environmental deterioration without limiting economic growth or social and technical advancement” [8]. The Ellen MacArthur Foundation [9] presents a circular economy as “a regenerative industrial economy by design or purposes.” Webster [10] states that “the purpose of a circular economy is to create products, components and materials with the highest service value over time.“ “Waste is food” is among the leading principles of circular economies, enabling all expended materials or products, as well as those nearing or at the end of their life cycles to be used once again as input for manufacturing the next generation of products [11,12].
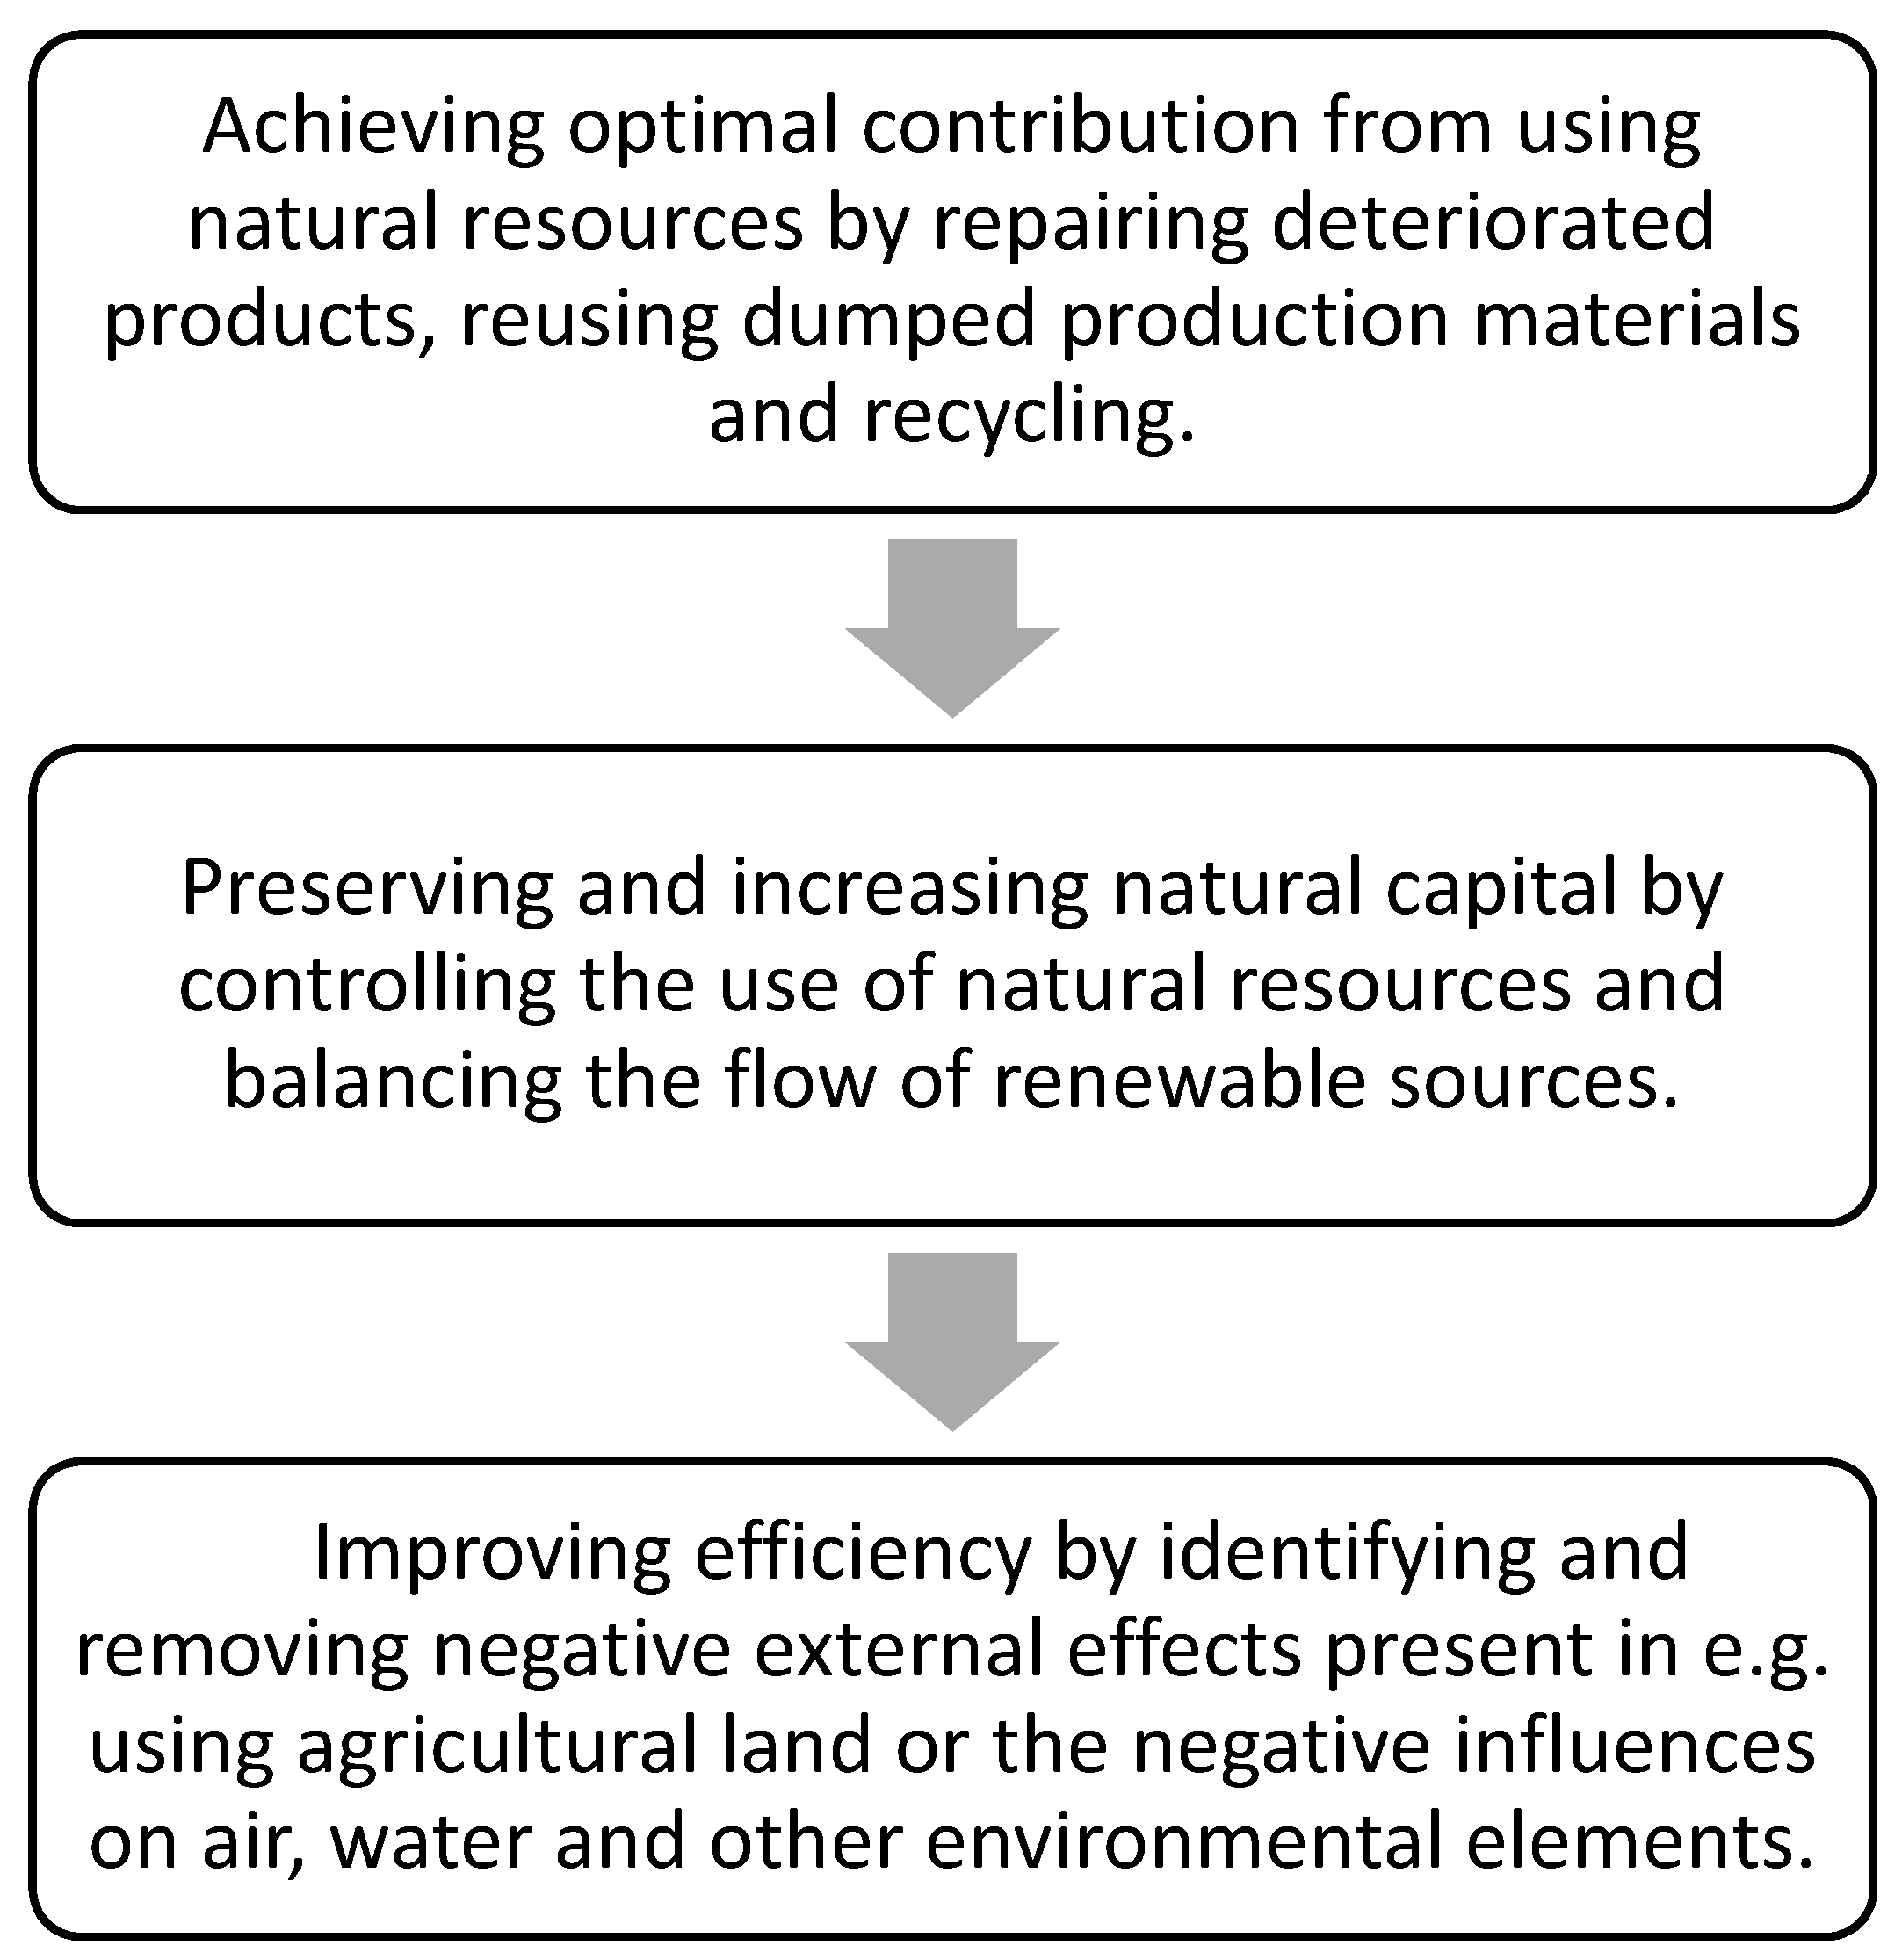
A circular economy is based on three main principles, as shown in Figure 1.
Consumer involvement plays a major role in the implementation circular economy [14], except that the circular economy concept encompasses systemic changes based on innovations and using new technological systems, as well as by changing how policies, society, business models, and funding methods are perceived and managed [15]. The main goal is to build a system that enables the regeneration of materials, product components and products in such a way that their highest value is preserved for the longest possible duration. Simultaneously, resources should be able to be reshaped and reintegrated into the economic system or utilized as nutrients for nature [10]. The benefits connected with new business models are truly numerous. Meyer [16] assessed that increasing the efficiency in resource consumption can save 17%–24% of raw materials, as well as 630 million euros in costs in Europe. Based on product-based modelling, it has been assessed that applying the circular economy concept could increase the European Union’s GDP by 3.9% by 2030 [17].
Even though the idea of implementing the circular economy concept is widely used in EU documents and legislation, improvement evaluations differ by author [18,19,20,21,22]. Most research on the status of the implementation of the circular economy concept focused on particular products or parts of the manufacturing process, so opinions on the possibility of improvement were formed in line with that [23]. The knowledge base has truly increased in recent years for some elements of the manufacturing cycle [24,25,26,27,28], as well as for the possibility of implementing the circular economy concept in a particular company or industry [29,30]. All-encompassing assessments of circularity on the national or macro level, however, are very rare [31,32,33]. There are authors looking into strategies and innovations for business models in circular economies sparked by start-ups aiming to add to the known theory about sustainable innovations. Additionally, this also contributes to possibilities to operationalize circular business models through already established frameworks [34]. A concept has also appeared known as the Circularity Deck, described by Konietzko et al. It presents a tool, much like a deck od cards, in order to assist companies with analyzing, forming ideas and developing their business into a circular ecosystem full of potential innovations [35].
The European Union continuously invests effort into transforming its economy into a circular economy to achieve better sustainability. The European Commission has adopted a number of measures pertaining to a circular economy such as banning the use of single-use plastic, improved legislation on preventing waste and critical raw material generation (European Commission), better monitoring of circular economy indicators in EU28 (all 28 members of the European Union) [36]. With the aim of a more successful implementation of the circular economy in the European economy, in 2015 the European Union adopted the ‘Circular Economy Strategy and Action Plan’ [6]. This Strategy and Action Plan contains measures which should be undertaken in order to realise the plans for the recycling and disposal of waste in the European Union, and all with the aim of the application of the concept of the circular economy. Apart from this, measures are stated for effectively “closing the circle” in a circular economy and for the handling with a product through all phases of the life cycle of the product, from production and consumption to the management of waste. The package of European regulations has the aim of reducing the creation and the higher-quality management of waste, the saving of energy, and reduction of the consumption of resources by 2030. With this Strategy, the EU has adopted a new legal framework through which investment encourages the transition of the economy into a circular economy in order to strengthen the economy, increase competitiveness, and ensure economic growth in the future. The strategy ensures that developed economies increasingly move away from models of a linear economy that is based on the principle of take–produce–dispose. In this way, far fewer amounts of waste are created, and, simultaneously, the use of natural resources in the process of production itself is avoided [37]. Harley, however, has pinpointed extensive standards regarding procurement, relief, taxation, production and expansion of circular products. Additionally, Harley recognized that waste trading was liberalized, in the sense that it can better be facilitated through virtual means, and that it can be used as support in campaigns that raise awareness and for the purpose of establishing eco-industrial parks [38]. Elements of revised proposal on waste management in EU are putted in Table 1.
Even though the topic of the circular economy is still relatively new, unfortunately, the Croatian legislative framework does not yet have an implied model of it. Ribić et al. [41] discussed waste management methods in the Croatian capital, as well as the need to implement the circular economy concept. Car and Jelavić [42] discussed the need to switch from a linear to a circular economy. Runko Luttemberger et al. [43] stated that the circular economy is one of the means of achieving resource efficiency. Andabaka [44] stressed the possible advantages of applying the principles of the circular economy for the Croatian economy, as well as existing limitations when transitioning to such an economic model. Drljača [45] pointed out the importance of transitioning from a linear to a circular economy. In addition, Škrlec analysed the topic of the circular economy and used a popular method to explain the application and benefits of implementing such a manufacturing and waste management model [46]. Šverko Grdić et al. [47] researched which funds can be used to realise the circular economy concept on the level of the European Union, including Croatia. Apart from the scientific community, this concept has also attracted attention among lawmakers and decision-makers who can, therefore, exert influence on governments and international agencies on the local, regional, national, and international levels to promote the new economic concept [48,49].
The research question of this work is the determining of the level of the use of the concepts of a circular economy and their connectivity with economic growth in member countries of the European Union from 2008 to 2016. Further on, we analyse the connectivity of the indicators of a circular economy and economic growth.
3. Analysis of Circular Economy Indicators and Indicators of Economic Development in the EU
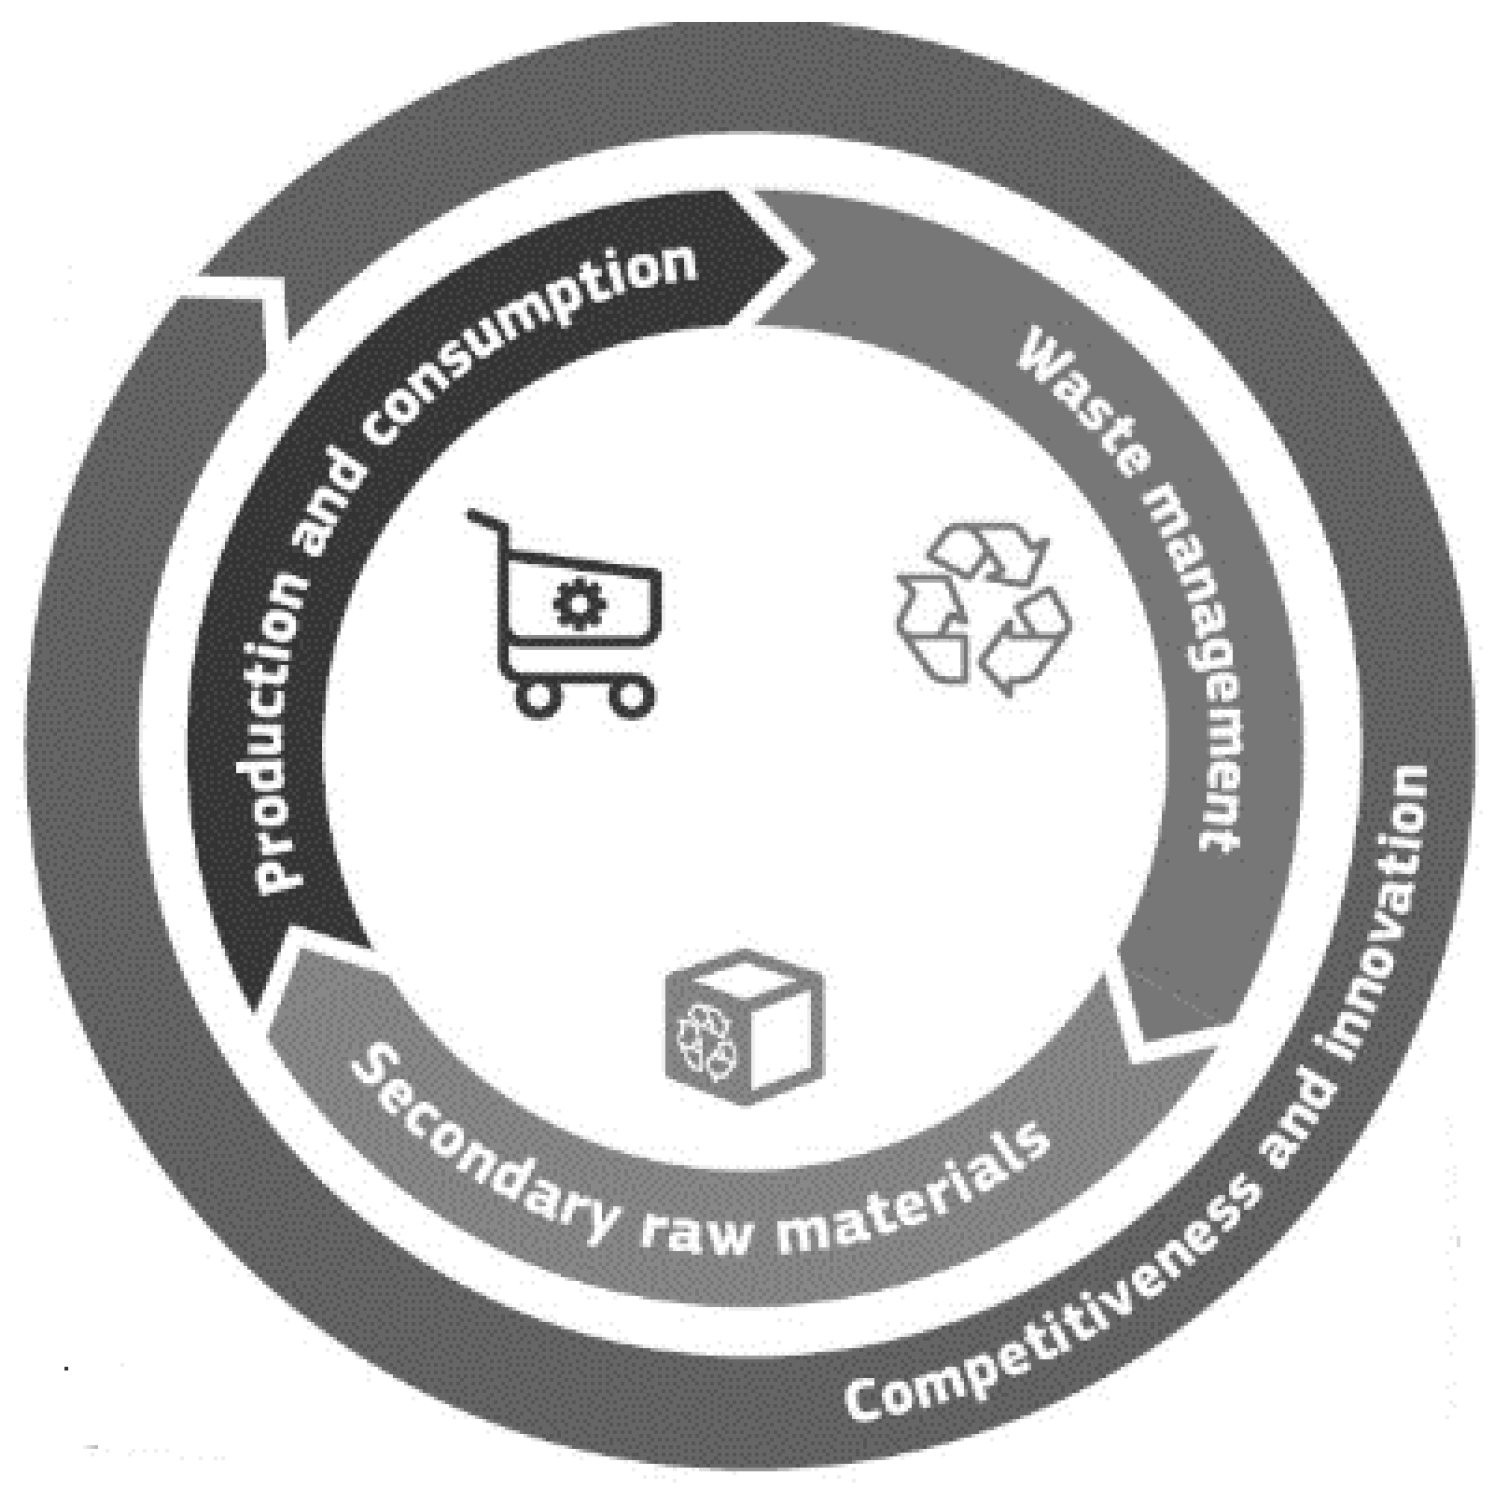
For the purpose of analysing a circular economy and economic development, for this research, the authors used Eurostat indicators where an indicator is defined as “a quantitative or qualitative factor or variable that provides a simple and reliable means of measuring achievement.” Eurostat uses indicators grouped as follows: production and consumption, waste management, secondary raw materials, competitiveness, and innovation, as shown in Figure 2. These groups of indicators are further divided into individual indicators calculated for the entire EU, as well as independently for member countries.
The European Union, China, and Japan hold the leading position when it comes to implementing sustainable development and sustainable resource consumption policies, but it is also one of the greatest resource consumers and sources of greenhouse gas emissions [33]. Indicators are very important for the evaluation, monitoring, and improvement of various policies and programmes aiming for the implementation or improvement of the circular economy concept [51]. Apart from the Eurostat indicators, many others can also be used. Sassanelli et al. investigated through a systematic literature review, which is so far the performance assessment methods proposed to measure circular economy sites and how they can be characterised and classified. They concluded that circular models can be measured taking care of different aspects [52]. Silvestri et al. built two composite indicators— the Circular Economy Static Index (CESI) and the Circular Economy Dynamic Index (CEDI)—that permitted both a static and a dynamic evaluation of the circular economy (CE) performance of European regions [53]. Authors Garcia-Bernabeu et al. used a multi-criteria approach to construct a circular economy composite index based on Technique for Order Preferences by Similarity to Ideal Solutions methodology [54]. Robaina et al. used cluster analysis with three econometric estimation methods: panel unit root test, panel cointegration tests, and vector autoregression model with the similar data like in this article [55]. Momete developed an index which intends to provide the best/worst performers within the EU area in terms of readiness of EU nations to pass to a sustainable circular economy [56]. Scheel et al. developed the linear production model with the United Nations Environment Program current four decoupling indicators in order to propose a more robust model [2].
In addition to indicators showing the implementation of a circular economy, this paper also explores macroeconomic indicators explaining the economic efficiency of particular countries. Economic efficiency is often linked to negative environmental impact, raw material and energy consumption, and greenhouse gas emissions. The main economic goals include fast and high production growth, low unemployment, and price stability, none of which has to necessarily clash with environmental protection. In fact, by implementing the circular economy concept, it is possible to achieve economic growth and GDP growth while preserving the environment and reducing the consumption of natural resources. This paper emphasises the indicators of implementing a circular economy and the economic development of the EU, as shown in Table 2.
As can be seen in Table 2, the countries with the highest GDP are Luxembourg, Denmark, and Ireland, and when looking at municipal waste generation per capita, the leading countries are Denmark (789 kg per capita), Cyprus (665 kg per capita), and Luxembourg (647 kg per capita). These data already show a correlation between GDP and waste generation. Positive examples in relation to this indicator include the Czech Republic (282 kg per capita), Romania (219 kg per capita), and Poland (305 kg per capita). An important indicator as well is the recycling rate, which indicates that, even though particular countries generate large amounts of waste, they also measure high in the recycling rate of packaging waste by type of packaging—Belgium (80%), the Netherlands (72%), and Denmark (70%). Germany is the country with the highest annual number of patents (88) by a large margin.
These are not the only relevant indicators. Huysman et al. [23] proposed and indicator to measure the effectiveness of various possibilities for treating plastic waste in a circular economy. This measure takes into consideration the stream of plastic waste and its technical quality, and it monitors resource consumption through Cumulative Exergy Extraction. Saidani et al. [57] provided a synthesis and 36 clarification to the emerging and must-needed research theme of circular economy indicators and shed some light on 37 remaining key challenges, like their effective uptake by industry. Moraga et al. [58] gave the classification framework to categorise circular economy indicators according to the reasoning on what (CE strategies) and how (measurement scope). Howard et al. [59] provided a framework for developing circular economy indicators which link to the core goals, principles, and building blocks of a circular economy.
When we investigate a circular economy and economic growth, we can see that author Busu presents the economic factors that are at the basis of the development of a circular economy on the European Union level [60]. Trica et al. [61] conducted research about the economic factors of the sustainable development of a circular economy based on the findings of economic literature in the field. Adamo et al. investigated the relationship between recycling, GDP, and population [62]. They concluded that increasing of GDP and population means increasing the amount of recycling. George et al. constructed a circular economy model with two types of economic resources, namely, a polluting input and a recycling input. The results they obtained point towards several factors playing a key role in the development of economy. These factors are the levels of pollution stemming from using the polluting input, the expenses incurred from using the polluting input, the recycling ratio, and recycling input in the sense of its marginal product [63]. A methodology was proposed by Busu and Trica that enables the evaluation of a circular economy model’s sustainability by monitoring various indicators pertaining to the environment in order to determine the model’s effect on the economic growth of the EU [64].
4. Methodology
There is insufficient research about the impact of the economic development on the implementation of a circular economy, and therefore, on achieving the sustainable development of an economy. To that end, this research encompasses the following variables:
- GDP per capita;
- Value-added Mio EUR;
- Number of patents;
- Municipal waste generation per capita (kg);
- Recycling rate of municipal waste (%);
- Recycling rate of packaging waste by type of packaging (%);
- Recycling of bio-waste (kg per capita);
- Recycling rate of e-waste.
The variables were calculated independently for each member country of the EU (28) for the period from 2008 to 2016. The source of the indicators is the Eurostat database, whose scope is sometimes limited, so some variables for particular years were unavailable. Many authors used Eurostat indicators for their research. Authors Ghisellini et al. evaluated the transition to a CE in Italy [68]. The goals of circular economy, i.e. how well they measure up to expectations and how much of an impact they had in a selection of European countries from 2010 to 2016 was researched by Škrinjarić [69]. Additionally, a methodology was designed by Trica at al. that enables the evaluation of a circular economy model’s sustainability by using Eurostat indicators and measures to verify the effect of environmental factors [61].
The pooled approach was used in the research because the authors were interested in determining the indicators on the level of the entire EU. Based on research interests, we define three hypothesiss:
Hypothesis 1 (H1).
Higher gross domestic product generates more waste per capita.
Hypothesis 2 (H2).
A higher rate of using secondary raw materials results in lower municipal waste generation per capita per year.
Hypothesis 3 (H3).
The number of patents in a circular economy generates a higher GDP.
Based on the hypotheses, an econometric model was formed in which GDP was identified as an independent variable, while the observed dependent variables include Value-added Mio EUR, municipal waste generation per capita (kg), recycling rate of municipal waste (%), recycling rate of packaging waste by type of packaging (%), recycling of bio-waste (kg per capita), and recycling rate of e-waste (%).
The first part of the statistical analysis explores the Pearson correlation between the stated variables, and the second part explores the following univariate regression model:
where y is one of the dependent variables and x is the independent variable. All analyses were made in the Stata 13.0 software package (StataCorp. 2013. Stata Statistical Software: Release 13. College Station, TX: StataCorp LP).
5. Research Results
A description of the statistics obtained in the analysis (mean, standard deviation) is shown in Table 3.
When discussing GDP per capita and when these data are compared with the data in Table 2, it can be seen that 17 countries are underperforming, i.e., their GDP per capita is lower than the mean value, while 11 countries are achieving better results. When looking at the standard deviation for the same variable, it can be seen that the average deviation is 23,130 EUR GDP per capita. When observing Value-added Mio in euros, then it is clear that only 6 countries show better results than the mean value—France, Germany, Italy, the Netherlands, Spain, and the UK. Countries with lower municipal waste generation than the mean value are Belgium, the Czech Republic, Croatia, Estonia, Hungary, Latvia, Lithuania, Poland, Portugal, Romania, Slovakia, Slovenia, and Sweden. Excluding Belgium and Sweden, these are primarily countries with a lower GDP and weaker purchasing power, thus generating less waste. The recycling rate of municipal waste indicator has a mean value of 38%. Countries with a better percentage than the mean are Belgium, Denmark, and Germany. These data were not available for all countries so the number of observations (N) is very low. The recycling rate of packaging waste by type of packaging indicator shows a mean value of 59%. Countries with lower results than the mean are Cyprus, Croatia, Estonia, Finland, Hungary, Latvia, Malta, Poland, and Romania. The recycling of bio-waste indicator has a mean value of 54% and a total of 16 countries have a lower percentage than the mean. The recycling rate of e-waste indicator shows a mean value of 35%. A total of 15 countries, i.e., 53% of the EU, show a lower percentage than the mean value.
There is a positive correlation between GDP per capita and all other variables, which indicates that by increasing GDP, it can be expected that the other variables will increase as well which is shown in Table 4. All correlations are statistically significant. Those under 0.3 can be considered weak, i.e., increasing GDP will not impact them too significantly. In this case, they have a value-added Mio and recycling rate of packaging waste by type of packaging. Correlations between 0.3 and 0.6 can be considered moderate, so a greater impact is expected. In this case, it is the recycling rate of e-waste variable. Coefficients over 0.6 imply a strong correlation, thus making the impact great as well. Among the researched variables, they are the municipal waste generation per capita, the recycling rate of municipal waste and the recycling of bio-waste. The aim of further analysis was to define to which degree GDP influences particular elements of sustainable development, i.e., to quantify the impact of GDP on the dependent variables. Furthermore, a regression analysis was performed, which is shown in Table 5. Using the univariate pooled regression analysis; the independent variable is the logarithm of GDP per capita, while the other variables are dependent and non-logarithmic.
The analysis conducted indicates that increasing GDP per capita by 1% would mean an average increase of around 44.33 EUR Value-added Mio, 1.04 kg waste per capita, 0.1555% in the recycling rate of municipal waste, around 0.05% in the recycling rate of packaging waste, around 0.5 kg per capita in the recycling of bio-waste, and 0.06% in the recycling rate of e-waste.
By looking at the analysis conducted, it can be concluded that all three hypotheses have been confirmed. It can be seen in the example of all EU countries that the greater the GDP, the greater the municipal waste generation per capita. In 2008, Denmark had the highest GDP (44,000 EUR per capita), while also having the highest waste generation at 830 kg per capita. Denmark retained these tendencies in 2016 as well. The hypothesis that using more secondary raw materials means reducing municipal waste generation has been proven. In 2016, the country with the highest rate of using secondary raw materials was the Netherlands, and it has a lower rate of waste generation among the observed countries in the higher GDP range. The hypothesis regarding the relationship between the number of patents and a higher GDP is proven by the fact that all developed countries among the observed, such as Germany, Austria, the Netherlands, Denmark, and Sweden, have a greater number of patents in a circular economy and a higher GDP.
The analyzed data show that developed EU countries generate more waste but also have better indicators of the application of the circular economy. On the other hand, to achieve better results in less-developed countries of the world, it is necessary to invest more financial resources in activities such as R&D, new technology development, and innovation. Very important also is better involvement of customers in activities that promote a circular economy [14]. Achieving these two goals would enhance the implementation of sustainable economic development in EU member countries.
6. Discussion and Conclusion
The research topic determines the application of the circular economy concept in member countries of the European Union from 2008 to 2016 and how the implementation of a circular economy has influenced economic growth. The most common linear economic model is based on the conviction that resources are unlimited and that there is limitless space for waste disposal. Such a model is clearly unsustainable, and changes have to be made. The circular economy concept remains an insufficiently understood term to all economic stakeholders and the general public. Transitioning to a circular economy requires not only to change one single activity, but systemic changes in industry, social components, energy, transportation, agriculture, and more. Each economic sector has its own principles and limitations, and each country in the EU has its own specificities, which results in different approaches and time frames for transitioning to a circular economy. It can be concluded from the results of this research that there is a connection between economic development and circular economy indicators, and all three hypotheses have been confirmed. It is not possible, at least not without a time delay and in-depth analysis, to copy a system from across Europe and expect great results, but there are definitely various examples of adopting the circular economy concept from around the world with excellent results from which it is possible to learn. Implementing the circular economy concept should not only be a matter of waiting for state interventions and subsidies. Companies and citizens can undertake their own initiatives for the transition, starting with sorting and recycling waste, saving energy, etc. Adopting the circular economy concept can help companies get ahead of potential limitations such as a lack of resources, taxation, externalities, and more. The circular model can generate income and create new jobs, which most countries need, especially Croatia. The circular economy model does a good job of connecting economic and ecological benefits, which further helps to develop entrepreneurship. By using waste as a resource and applying the principles of a circular economy, it is possible to reach new milestones in economic development. It is necessary to continuously stimulate citizens both financially and in terms of education, as transitioning to a circular economy cannot be boiled down to a matter of infrastructure and technological advancement. It requires far stronger social involvement, collaboration on both the local and national levels, adopting new business models (encouraging consumers to adopt renting instead of owning), supporting industry clusters to trade in by-products, and a new urban management system that will require time to fully complete the transition. The authors are aware of this paper’s limitations, one of them being the fact that some variables have a very low R2 value, meaning that, for those variables, GDP will have a weaker predictive value, but a connection remains evident. In such cases, it is possible that nationality has a stronger influence, which would be better explored through a panel analysis. The recommendation for further research is to definitely explore if the Republic of Croatia is capable of transitioning to a circular economy, as well as which countries could be used as examples of good practices. Even though scientists face additional challenges in research, technologies, and infrastructure, it is individual papers such as this one that provide a humble contribution to this contemporary subject. It can be concluded that, in addition to investing in spreading information, education, and technology, it is also required to develop and strongly promote entrepreneurship that applies the circular economy concept.
Author Contributions
Z.S.G.: Methodology, Research Results. M.K.N.: Paper concept, Literature review, E.R.: Introduction, Analysis of circular economy indicators and indicators of economic development in the EU, Conclusion. All authors have read and agreed to the published version of the manuscript.
Funding
This paper is financially supported by the University of Rijeka, project ZP UNIRI 6/18.
Acknowledgments
We thank three independent reviewers and the Editor for the helpful comments that have substantially improved the clarity of the manuscript.
Conflicts of Interest
The authors declare no conflict of interest. The founding sponsors had no role in the design of the study; in the collection, analyses, or interpretation of data; in the writing of the manuscript, and in the decision to publish the results.
References
- Fischer, A.; Pascucci, S. Institutional incentives in circular economy transition: The case of material use in the Dutch textile industry. J. Clean. Prod. 2017, 155, 17–32. [Google Scholar] [CrossRef] [Green Version]
- Scheel, C.; Aguinaga, E.; Bello, B. Decoupling Economic Development from the Consumption of Finite Resources Using Circular Economy, A Model for Developing Countires. Sustainability 2020, 12, 1291. [Google Scholar] [CrossRef] [Green Version]
- Jawahir, I.S.; Bradley, R. Technological Elements of Circular Economy and the Principles of 6R-Based Closed-Loop Material Flow in Sustainable Manufacturing. Procedia Cirp 2016, 40, 103–108. [Google Scholar] [CrossRef] [Green Version]
- Korhonen, J.; Honkasalo, A.; Seppala, J. Circular Economy: The Concept and its Limitations. Ecol. Econ. 2018, 143, 37–46. [Google Scholar] [CrossRef]
- Ghisellini, P.; Cialani, C.; Ulgiati, S. A review of circular economy: The expected transition to a balanced interplay of environmental and economic systems. J. Clean. Prod. 2016, 114, 11–32. [Google Scholar] [CrossRef]
- Geissdoerfer, M.; Savaget, P.; Bocken, N.M.P.; Hultink, E.J. The Circular Economy—A new sustainability Paradigm. J. Clean. Prod. 2017, 143, 757–768. [Google Scholar] [CrossRef] [Green Version]
- Franklin-Johnson, E.L.; Figge, F.; Canning, L. Resource duration as a managerial indicator for Circular Economy performance. J. Clean. Prod. 2016, 133, 589–598. [Google Scholar] [CrossRef]
- Geng, Y.; Zhu, Q.; Doberstein, B.; Fujita, T. Implementing China’s Circular Economy Concept at the Regional Level: A Review of Progress in Dalian, China. Waste Manag. 2009, 29, 996–1002. [Google Scholar] [CrossRef]
- Ellen MacArthur Foundation. Completing the Picture How the Circular Economy Trackless Climate Change. 2019, pp. 1–65. Available online: https://www.ellenmacarthurfoundation.org/assets/downloads/COMPLETING_THE_PICTURE_HOW_THE_CIRCULAR_ECONOMY-_TACKLES_CLIMATE_CHANGE_V2_23_September.pdf (accessed on 10 September 2019).
- Webster, K. The Circular Economy: A Wealth of Flows, 2nd ed.; Ellen MacArthur Foundation Publishing: Cowes, UK, 2017; pp. 5–25. [Google Scholar]
- Tukker, A. Product services for a resource—Efficient and circular economy—A review. J. Clean. Prod. 2015, 97, 76–91. [Google Scholar] [CrossRef]
- Van Weelden, E.; Mugge, R.; Bakker, C. Paving the way towards circular consumption: Exploring consumer acceptance of refurbished mobile phones in the Dutch market. J. Clean. Prod. 2016, 113, 743–754. [Google Scholar] [CrossRef] [Green Version]
- Tišma, S.; Boromisa, A.M.; Funduk, M.; Čermak, H. Okolišne Politike i Razvojne Teme; Alinea: Zagreb, Croatia, 2017; pp. 35–55. [Google Scholar]
- Sijtsema, S.J.; Snoek, H.M.; de Haaster-Winter, M.A.; Dagevos, H. Let’s Talk about Circular Economy: A Qualitative Exploration of Consumer Perceptions. Sustainability 2020, 12, 286. [Google Scholar] [CrossRef] [Green Version]
- Domenech, T.; Bahn-Walkowiak, B. Transition towards a Resource Efficient Circular Economy in Europe: Policy Lessons From the EU and the Member States. Ecol. Econ. 2019, 155, 7–19. [Google Scholar] [CrossRef]
- Mayer, A.; Haas, W.; Wiedenhofer, D.; Krausmann, F.; Nuss, P.; Blengini., G.A. Measuring Progress towards a Circular Economy, A Monitoring Framework for Economy–wide Material Loop Closing in the EU 28. J. Ind. Ecol. 2019, 23, 62–76. [Google Scholar] [CrossRef] [PubMed] [Green Version]
- Ellen MacArthur Foundation. Towards the Circular Economy: Economic and Business Rationale from an Accelerated Transition. 2013. Available online: https://www.ellenmacarthurfoundation.org/assets/downloads/publications/Ellen-MacArthur-Foundation-Towards-the-Circular-Economy-vol.1.pdf (accessed on 12 December 2019).
- EASAC. Indicators for a Circular Economy; EASAC, Ed.; EASAC Policy Report 30; Deutsche Akademie der Naturforscher Leopoldina: Halle (Saale), Germany, 2016; pp. 25–57. [Google Scholar]
- Haupt, M.; Vadenbo, C.; Hellweg, S. Do we have the right performance indicators for the circular economy? Insight into the Swiss waste management system. J. Ind. Ecol. 2016, 21, 615–627. [Google Scholar] [CrossRef]
- Kovanda, J. Incorporation of recycling flows into economy-wide material flow accounting and analysis: A case study for the Czech Republic. Resour. Conserv. Recycl. 2014, 92, 78–84. [Google Scholar] [CrossRef]
- Hashimoto, S.; Tanikawa, H.; Moriguchi, Y. Framework for estimating potential wastes and secondary resources accumulated within an economy—A case study of construction minerals in Japan. Waste Manag. 2009, 29, 2859–2866. [Google Scholar] [CrossRef]
- Yuan, Z.; Bi, J.; Moriguichi, Y. The circular economy, A new development strategy in China. J. Ind. Ecol. 2006, 10, 4–8. [Google Scholar] [CrossRef] [Green Version]
- Huysman, S.; Schaepmeester, J.D.; Ragaert, K.; Dewulf, J.; De Meester, S. Performance indicators for a circular economy: A case study on post-industrial plastic waste. Resour. Conserv. Recycl. 2017, 120, 46–54. [Google Scholar] [CrossRef]
- BIO by Deloitte. Study on Data for a Raw Material System Analysis: Roadmap and Test of the Fully Operational MSA for Raw Materials. Prepared for the European Commission; DG GROW. 2015, pp. 45–65. Available online: https://ec.europa.eu/assets/jrc/msa/images/msa_final_report.pdf (accessed on 10 December 2019).
- Cullen, J.M.; Allwood, J.M. Mapping the global flow of aluminium: From liquid aluminium to end-use goods. Environ. Sci. Technol. 2013, 47, 3057–3064. [Google Scholar] [CrossRef] [Green Version]
- Graedel, T.E.; Harper, E.M.; Nassar, N.T.; Reck, B.K. On the materials basis of modern society. Proc. Nat. Acad. Sci. USA 2015, 112, 6295–6300. [Google Scholar] [CrossRef] [Green Version]
- Reck, B.K.; Graedel, T.E. Challenges in Metal Recycling. Science 2012, 337, 690–695. [Google Scholar] [CrossRef] [PubMed]
- Wang, T.; Muller, D.B.; Graedel, T.E. Forging the anthropogenic iron cycle. Environ. Sci. Technol. 2007, 41, 5120–5129. [Google Scholar] [CrossRef] [PubMed]
- Pauliuk, S.; Wang, T.; Muller, D.B. Moving toward the circular economy: The role of stocks in the Chinese steel cycle. Environ. Sci. Technol. 2012, 46, 148–154. [Google Scholar] [CrossRef] [PubMed] [Green Version]
- Lieder, M.; Rashid, A. Towards circular economy implementation: A comprehensive review in context of manufacturing industry. J. Clean. Prod. 2016, 115, 36–51. [Google Scholar] [CrossRef]
- Nuss, P.; Blengini, G.A.; Hass, W.; Mayer, A.; Nita, V.; Pennington, D. Development of a Sankey Diagram of Material Flows in the EU Economy Based on Eurostat Data; EUR 28811 EN, JRC technical reports; Publications Office of the European Union: Luxembourg, 2017; Available online: https://ec.europa.eu/jrc/en/publication/development-sankey-diagram-material-flows-eu-economy-based-eurostat-data (accessed on 20 December 2019).
- Hass, W.; Krausmann, F.; Wiedenhofer, D.; Heinz, M. How circular is the global economy? An assessment of material flows, waste production, and recycling in the European Union and the world in 2005. J. Ind. Ecol. 2015, 19, 765–777. [Google Scholar] [CrossRef]
- Hashimoto, S.; Moriguchi, Y.; Saito, A.; Ono, T. Six indicators of material cycles for describing society’s metabolism: Application to wood resources in Japan. Resour. Conserv. Recycl. 2004, 40, 201–223. [Google Scholar] [CrossRef]
- Henry, M.; Bauwens, T.; Hekkert, M.; Kirchherr, J.A. Typology of Circular Start-Ups—An Analysis of 128 Circular Business Models. J. Clean. Prod. 2020, 245, 118528. [Google Scholar] [CrossRef]
- Konitzko, J.; Bocken, N.; Hultink, E.J. A Tool to Analyze, Ideate and Develop Circular Innovation Ecosystems. Sustainability 2020, 12, 417. [Google Scholar] [CrossRef] [Green Version]
- Meyer, B. Macroeconomic Modelling of Sustainable Development and the Links between the Economy and the Environment; GWS Research Report Series 12-1; GWS-Institute of Economic Structures Research: Osnabruck, Germany, 2012; pp. 54–95. Available online: http://www.gws-os.com/discussionpapers/gws-researchreport12-1.pdf (accessed on 11 November 2019).
- Report from the Commission to the European Parliament, The Council, The Europe Economic and Social Committee and the Committee of the Regions on the implementation of the Circular Economy Action Plan; European Commission: Brussels, Belgium, 2019; Available online: https://eur-lex.europa.eu/legal-content/EN/TXT/PDF/?uri=CELEX:52019DC0190&from=EN (accessed on 14 September 2019).
- Hartley, K.; Santen, R.; Kirchherr, J. Policies for transitioning towards a circular economy: Ecpectations from the European Union (EU). Resour. Concervation Recycl. 2020, 155, 1–10. [Google Scholar] [CrossRef]
- McDowall, W.; Geng, Y.; Huang, B.; Bertekova, E.; Bleischwitz, R.; Turkeli, S.; Kemp, R.; Domenedh, T. Circular Economy Policies in China and Europe. J. Ind. Ecol. 2017, 21, 651–661. [Google Scholar] [CrossRef] [Green Version]
- Andabaka, A.; Beg, M.; Gelo, T. Challenges of circular economy in Croatia. Int. J. Multidiscip. Bus. Sci. 2018, 4, 115–126. [Google Scholar]
- Ribić, B.; Voća, N.; Ilakovic, B. Concept of sustainable waste management in the city of Zagreb, towards the implementation of circular economy approach. J. Air Waste Manag. Assoc. 2017, 67, 241–259. [Google Scholar] [CrossRef] [PubMed]
- Car, S.; Jelavić, V. Nove mogućnosti tehnološkog razvoja u okrilju nisko ugljične strategije EU. Polytech. Des. 2016, 4, 266–276. [Google Scholar] [CrossRef]
- Runko Luttemberger, L.; Vujević, D.; Šijeg, M.; Gudelj, I. Postizanje resursne učinkovitosti objedinjavanjem sektora energetike, vode i otpada. Inženjerstvo Okoliša 2015, 2, 23–28. [Google Scholar]
- Andabaka, A. Potencijali i ograničenja primjene kružne ekonomije u kontekstu održivoga razvoja Hrvatske. In Zbornik Radova Znanstvenog Skupa Modeli Razvoja Hrvatskog Gospodarstva; Družić, G., Družić, I., Eds.; Ekonomski fakultet Zagreb: Zagreb, Croatia, 2018; pp. 427–458. [Google Scholar]
- Drljača, M. Koncept kružne ekonomije. Kval. Izvornost 2015, IV, 18–22. [Google Scholar]
- Škrlec, D. Rok za prelazak Hrvatske na kružno gospodarstvo. Available online: www.davor-skrlec.eu (accessed on 10 August 2019).
- Šverko Grdić, Z.; Krstinić Nižić, M.; Rudan, E. Kružno gospodarstvo—Model Održivog Ekonomskog Rasta, 8th International Scientific Conference “Knowledge and Business Challenges of Globalisation in 2019, Circular Economy Opportunities and Modern Technologies”; Faculty of Commercial and Business Sciences in Celje: Celje, Slovenia, 2019; pp. 190–198. [Google Scholar]
- Geisendort, S.; Pietrulla, F. The circular economy and circular economic concepts: A literature analysis and redefinition. Thunderbird Int. Bus. Rev. 2018, 60, 771–782. [Google Scholar] [CrossRef]
- Bocken, N.M.P.; Olivetti, E.A.; Cullen, J.M.; Potting, J.; Lifset, R. Taking the circularity to the next level: A special issue on the circular economy. J. Ind. Ecol. 2017, 21, 476–482. [Google Scholar] [CrossRef]
- Which indicators are used to monitor the progress towards a circular economy? Eurostat. Available online: https://ec.europa.eu/eurostat/web/circular-economy/indicators (accessed on 1 August 2019).
- Geng, Y.; Fu, J.; Sarkis, J.; Xue, B. Towards a national circular economy indicator system in China: An evaluation and critical analysis. J. Clean. Prod. 2012, 23, 216–224. [Google Scholar] [CrossRef]
- Sassanelli, C.; Rosa, P.; Rocca., R.; Terzi, S. Circular economy performance assessment methods: A systematic literature review. J. Clean. Prod. 2019, 229, 440–453. [Google Scholar] [CrossRef]
- Silvestri, F.; Spigarelli, F.; Tassinari, M. Regional Development of Circular Economy in the European Union: A Multidimensional Analysis. J. Clean. Prod. 2020, 255. [Google Scholar] [CrossRef]
- Garcia-Bernabeu, A.; Hilario-Caballero, A.; Pla-Santamaria, D.; Salas-Molina, R. A Process Oriented MCDM Approach to Construct a Circular Economy Composite Index. Sustainability 2020, 12, 618. [Google Scholar] [CrossRef] [Green Version]
- Robaina, M.; Villar, J.; Pereira, E.T. The determinants for a circular Economy in Europe. Environ. Sci. Pollut. Res. 2020. [Google Scholar] [CrossRef] [PubMed]
- Momete, D.C. A unified framework for assessing the readiness of European Union Economies to migrate to a circular modolling. Sci. Total Environ. 2020, 718, 1–9. [Google Scholar] [CrossRef] [PubMed]
- Saidani, M.; Yannou, B.; Leroy, Y.; Cluzel, F.; Kendall, A. A taxonomy of circular economy indicators. J. Clean. Prod. 2019, 207, 542–559. [Google Scholar] [CrossRef] [Green Version]
- Moraga, G.; Huysveld, S.; Mathieux, F.; Blengini, G.A.; Alaerts, L.; Van Acker, K.; Dewulf, J. Circular economy indicators: What do they measure? Resour. Conserv. Recycl. 2019, 146, 452–461. [Google Scholar] [CrossRef] [PubMed]
- Howard, M.; Hopkinson, P.; Miemczyk, J. The regenerative supply chain: A framework for developing circular economy indicators. Int. J. Prod. Res. 2019, 57, 7300–7318. [Google Scholar] [CrossRef] [Green Version]
- Busu, M. Adopting Circular Economy at the European Union Level and Its Impact on Economic Growth. Soc. Sci. 2019, 8, 159. [Google Scholar] [CrossRef] [Green Version]
- Trica, C.L.; Banacu, C.S.; Busu, M. Environmental Factors and Sustainability of the Circular Economy Model at the European Union Level. Sustainability 2019, 11, 1114. [Google Scholar] [CrossRef] [Green Version]
- D’Adamo, I.; Gastaldi, M.; Rosa, P. Recycling of end-of-life vehicles: Assessing trends and performances in Europe. Technol. Forecast. Soc. Chang. 2020, 152. [Google Scholar] [CrossRef]
- George, D.A.R.; Lin, B.C.B.; Chen, Y. A circular economy model of economic growth. Environ. Model. Softw. 2015, 73, 60–63. [Google Scholar] [CrossRef]
- Busu, M.; Trica, C.L. Sustainability of Circular Economy Indicators and Their Impact on Economic Growth of the European Union. Sustainability 2019, 11, 5481. [Google Scholar] [CrossRef] [Green Version]
- Walker, S.; Coleman, N.; Hodgson, P.; Collins, N.; Brimacombe, L. Evaluating the Environmental Dimension of Material EFFICIENCY Strategies Relating to the Circular Economy. Sustainability 2018, 10, 666. [Google Scholar] [CrossRef] [Green Version]
- Cayzer, S.; Griffiths, P.; Beghetto, V. Design of indicators for measuring product performance in the circular economy. Int. J. Sustain. Eng. 2017, 289–298. [Google Scholar] [CrossRef] [Green Version]
- Di Maio, F.; Rem, P.C. A robust indicator for promoting circular economy through recycling. J. Environ. Prot. 2015, 6, 1095–1104. [Google Scholar] [CrossRef] [Green Version]
- Ghisellini, P.; Ulgiati, S. Circular economy transition in Italy. Achievements, perspectives and constraints. J. Clean. Prod. 2019, 118360. [Google Scholar] [CrossRef]
- Škrinjarić, T. Empirical assessment of the circular economy of selected European countries. J. Clean. Prod. 2020, 120246. [Google Scholar] [CrossRef]
Figure 1.
Principles of circular economy [13].
Figure 1.
Principles of circular economy [13].

Figure 2.
Main groups of indicators of the implementation of a circular economy on the EU level [50].
Figure 2.
Main groups of indicators of the implementation of a circular economy on the EU level [50].


Table 1.
Key elements of the revised proposals on waste management in the European Union (EU) [39,40].
| Recycling and Reuse | Landfilling |
|---|---|
| A common EU target for recycling 65% of municipal waste and recycling 75% of packaging waste by 2030. | A binding landfill target to reduce landfill to a maximum of 10% of municipal waste by 2030. |
| Simplified and improved definitions and harmonised calculation methods for recycling rates throughout the EU. | A ban on the landfilling of separately collected waste (except for certain hazardous waste and residual waste). |
| Concrete measures to promote reuse and stimulate industrial symbiosis (turning one industry’s by-product into another industry’s raw material). | The promotion of economic instruments to discourage landfilling (charges on landfilling). |
| Economic incentives for producers to put greener products on the market and to support recovery and recycling schemes (e.g., for packaging, batteries, electric and electronic equipment, vehicles). |
Table 2.
Important indicators of implementing a circular economy and the economic development of the EU (2008–2016 average) [50].
Table 2.
Important indicators of implementing a circular economy and the economic development of the EU (2008–2016 average) [50].
| Country | GDP per Capita in EUR Sdg_10_10 * | Value-Added (million EUR) Teina444_r2 | No. of Patents cei_cie 020 | Municipal Waste Generation (per capita per year) cei_pc031 | Recycling Rate of Municipal Waste (%) cei_wm011 | Recycling Rate of Packaging (%) cei_wm020 | Recycling Rate of Bio Waste (kg per capita) cei_wm020 | Recycling Rate of e- Waste (%) cei_wm050 |
|---|---|---|---|---|---|---|---|---|
| Austria | 37,544 | 3113 | 9.71 | 574 | - | 67 | 185 | 39 |
| Belgium | 34,856 | 2399 | 9 | 443 | 54 | 80 | 91 | 31 |
| Bulgaria | 5666 | 466 | 0.7 | 490 | 25 | 60 | 21 | 68 |
| Cyprus | 22,300 | 148 | 0.29 | 665 | - | 51 | 10 | 14 |
| Czech R. | 15,355 | - | 6.4 | 282 | 21 | 63 | 10 | 31 |
| Croatia | 10,588 | 541 | 0.29 | 395 | - | 57 | 5 | 61 |
| Denmark | 45,566 | 2129 | 3 | 789 | 45 | 70 | 133 | 42 |
| Estonia | 13,511 | 201 | 0.71 | 333 | 23 | 57 | 19 | 36 |
| Finland | 36,811 | 1826 | 9.43 | 495 | - | 58 | 61 | 36 |
| France | 31755 | 20,621 | 53 | 526 | - | 62 | 89 | 25 |
| Germany | 34,377 | 28,094 | 88 | 582 | 64 | 64 | 107 | 36 |
| Greece | 18,344 | 730 | 0.29 | 489 | - | 54 | 13 | 25 |
| Hungary | 10,466 | 837 | 3.83 | 398 | - | 52 | 18 | 37 |
| Ireland | 42,877 | - | 3 | 614 | 23 | 67 | 30 | 39 |
| Italy | 27,011 | 17,116 | 29 | 515 | - | 64 | 72 | 28 |
| Latvia | 10,811 | 238 | 1.14 | 321 | - | 50 | 12 | 23 |
| Lithuania | 11,100 | 308 | 1.14 | 428 | - | 59 | 29 | 33 |
| Luxemburg | 83,088 | - | 3.14 | 647 | - | 63 | 124 | 36 |
| Malta | 17,911 | - | 0.14 | 608 | - | 38 | 2 | 11 |
| Netherlands | 39,466 | 5454 | 14 | 552 | - | 72 | 141 | 32 |
| Poland | 10,055 | 4368 | 33 | 305 | - | 45 | 10 | 25 |
| Portugal | 16,844 | 1313 | 1.71 | 444 | - | 59 | 55 | 31 |
| Romania | 7111 | 1161 | 4 | 291 | - | 48 | 18 | 16 |
| Slovak R. | 13,355 | 604 | 0.71 | 317 | - | 60 | 16 | 39 |
| Slovenia | 18,200 | 459 | 1 | 453 | - | 63 | 26 | 26 |
| Spain | 23,066 | 10,377 | 19.4 | 486 | - | 64 | 72 | 23 |
| Sweden | 42,333 | 3911 | 3.71 | 452 | - | 67 | 65 | 58 |
| U.K. | 32,944 | 23,860 | 22 | 496 | - | 61 | 77 | 30 |
* Code for different categories in Eurostat.
Table 3.
Statistical description of variables in the model.
| Statistical Indicators | GDP/pc | Value-Added Mio EUR | Municipal Waste Generation per Capita (kg) | Recycling Rate of Municipal Waste % | Recycling Rate of Packaging Waste by Type of Packaging % | Recycling of bio-Waste (kg per capita) | Recycling Rate of e-Waste (%) |
|---|---|---|---|---|---|---|---|
| mean | 27,749.35 | 5176.746 | 473.6667 | 38.66038 | 59.7191 | 54.86219 | 35.19869 |
| sd | 23,130.4 | 7714.84 | 130.3471 | 17.52794 | 11.24437 | 49.73981 | 17.43674 |
| N | 310 | 209 | 321 | 53 | 267 | 283 | 229 |
Data analysis was performed by the authors using Stata.
Table 4.
Correlation analysis between the GDP variable and other variables.
| Statistical Indicators | Value-Added Mio EUR | Municipal Waste Generation per Capita | Recycling Rate of Municipal Waste % | Recycling Rate of Packaging Waste by Type of Packaging % | Recycling of Biowaste (kg per capita) | Recycling Rate of e-Waste (%) |
|---|---|---|---|---|---|---|
| Correlation coefficient (Pearson) | 0.2829 | 0.6202 | 0.7782 | 0.2308 | 0.6727 | 0.4551 |
| p-value | <0.001 | <0.001 | <0.001 | <0.001 | <0.001 | <0.001 |
Source: The data analysis was performed by the authors using STATA.
Table 5.
Regression analysis.
| Value-Added Mio EUR | Municipal Waste Generation per Capita (kg) | Recycling Rate of Municipal waste % | Recycling Rate of Packaging Waste by Type of Packaging % | Recycling of bio-Waste (kg per capita) | Recycling Rate of e-waste (%) | |
|---|---|---|---|---|---|---|
| Coefficient | 4433.913 | 104.5971 | 15.55376 | 5.08293 | 50.92421 | 6.243479 |
| R | 0.1460 | 0.4032 | 0.5136 | 0.1070 | 0.4929 | 0.0671 |
| p (t-test) | <0.001 | <0.001 | <0.001 | <0.001 | <0.001 | <0.001 |
| 95% CI | 2942.416–5925.41 | 90.06577–119.1285 | 11.29854–19.80898 | 3.289594–6.876266 | 44.75851–57.08991 | 3.197911–9.289048 |
| N | 203 | 299 | 53 | 262 | 274 | 229 |
Source: The data analysis was performed by the authors using Stata.
© 2020 by the authors. Licensee MDPI, Basel, Switzerland. This article is an open access article distributed under the terms and conditions of the Creative Commons Attribution (CC BY) license (http://creativecommons.org/licenses/by/4.0/).
Share and Cite
MDPI and ACS Style
Sverko Grdic, Z.; Krstinic Nizic, M.; Rudan, E. Circular Economy Concept in the Context of Economic Development in EU Countries. Sustainability 2020, 12, 3060. https://0-doi-org.brum.beds.ac.uk/10.3390/su12073060
AMA Style
Sverko Grdic Z, Krstinic Nizic M, Rudan E. Circular Economy Concept in the Context of Economic Development in EU Countries. Sustainability. 2020; 12(7):3060. https://0-doi-org.brum.beds.ac.uk/10.3390/su12073060
Chicago/Turabian StyleSverko Grdic, Zvonimira, Marinela Krstinic Nizic, and Elena Rudan. 2020. "Circular Economy Concept in the Context of Economic Development in EU Countries" Sustainability 12, no. 7: 3060. https://0-doi-org.brum.beds.ac.uk/10.3390/su12073060
Note that from the first issue of 2016, this journal uses article numbers instead of page numbers. See further details here.