MOOC Video Personalized Classification Based on Cluster Analysis and Process Mining


1
College of Computer Science and Engineering, Shandong University of Science and Technology, Qingdao 266590, China
2
Shandong key Laboratory of Wisdom Mine Information Technology, Qingdao 266590, China
3
College of Computer Science and Technology, Shandong University of Technology, Zibo 255000, China
*
Authors to whom correspondence should be addressed.
Sustainability 2020, 12(7), 3066; https://0-doi-org.brum.beds.ac.uk/10.3390/su12073066
Submission received: 7 February 2020
/
Revised: 7 March 2020
/
Accepted: 8 April 2020
/
Published: 10 April 2020
(This article belongs to the Section Sustainable Education and Approaches)
Abstract
:In the teaching based on MOOC (Massive Open Online Courses) and flipped classroom, a teacher needs to understand the difficulty and importance of MOOC videos in real time for students at different knowledge levels. In this way, a teacher can be more focused on the different difficulties and key points contained in the videos for students in a flipped classroom. Thus, the personalized teaching can be implemented. We propose an approach of MOOC video personalized classification based on cluster analysis and process mining to help a teacher understand the difficulty and importance of MOOC videos for students at different knowledge levels. Specifically, students are first clustered based on their knowledge levels through question answering data. Then, we propose the process model of a group of students which reflects the overall video watching behavior of these students. Next, we propose to use the process mining technique to mine the process model of each student cluster by the video watching data of the involved students. Finally, we propose an approach to measure the difficulty and importance of a video based on a process model. With this approach, MOOC videos can be classified for students at different knowledge levels according to difficulty and importance. Therefore, a teacher can carry out a flipped classroom more efficiently. Experiments on a real data set show that the difficulty and importance of videos obtained by the proposed approach can reflect students’ subjective evaluation of the videos.
1. Introduction
The development of MOOC (Massive Open Online Courses) promotes the reform of global education. In the teaching based on MOOC and flipped classroom, a student mainly learns the knowledge by watching MOOC videos. Therefore, MOOC videos are important learning resources for students. Meanwhile, a teacher needs to adopt different teaching strategies for students because the difficulty and importance of MOOC videos are different for students at different knowledge levels. In this way, a teacher can implement personalized teaching. To this end, a teacher needs to understand the difficulty and importance of MOOC videos for students at different knowledge levels in real time before a flipped classroom [1,2,3]. Thus, the teacher can classify MOOC videos in a personalized way to implement flipped classroom teaching more effectively.
In the current teaching mode based on MOOC and flipped classroom, the data of students’ learning processes is recorded in a MOOC platform. A valuable research question is the personalized classification of MOOC videos for students at different knowledge levels based on the learning data. Most existing works classify MOOC videos according to the content of videos. However, they pay little attention to classifying videos from the perspective of difficulty and importance, which is one of the biggest concerns of a teacher before a flipped classroom. Furthermore, the differences of students’ knowledge levels need to be considered because the difficulty and importance of a MOOC video generally vary with the knowledge levels of students. Consequently, existing approaches cannot assist teachers to carry out personalized teaching in the teaching process based on MOOC and flipped classroom [4,5]. To solve this problem, we propose an approach for MOOC video personalized classification based on cluster analysis and process mining. First, students are clustered based on knowledge levels according to their question answering data. Then, we propose the video learning behavior process model (hereinafter referred to as process model for short) to express the logical relationship of MOOC videos. We use the process mining technique to mine the process model of students in a cluster by their video watching data. Next, we propose to measure the MOOC video difficulty and importance based on the process model. Thus, the difficulty and importance of MOOC videos for students of each cluster can be obtained. Finally, the classification of videos in terms of the difficulty and importance can be obtained based on the difficulty and importance values of each video.
The main contributions of this paper are as follows:
- an approach is proposed to implement MOOC video personalized classification in terms of difficulty and importance for students at different knowledge levels;
- the business process modeling idea is introduced into the modeling of MOOC video learning behaviors, and the process mining technique is used to mine the video watching behaviors of students;
- an approach of measuring difficulty and importance of MOOC videos based on a process model is proposed, by which the difficulty and importance of MOOC videos for students at different knowledge levels can be obtained automatically.
From the perspective of the teaching, a teacher can be assisted to understand the key points and difficulties of videos for students at different knowledge levels before a flipped classroom in real time. In this way, the teacher can spend more time explaining the difficulties and key points, interacting with students and answering students’ questions rather than explaining the easy and unimportant knowledge points. Thus, the teacher can perform the flipped classroom teaching more effectively.
2. Related Works
EDM (Educational Data Mining) [6,7,8] is a hot topic in the field of educational technology. However, there are few works to cluster or classify MOOC videos using students’ behavior data from the view of the difficulty and importance of videos. At present, there are mainly three types of works on clustering or classification of learning resources.
The first works focus on the automatic clustering or classification of learning resources using data mining techniques. For example, Wu et al. used the K-means algorithm to cluster educational resources based on the URL (Uniform Resource Locator), source, and content of learning resources [4]. Based on the metadata information of learning objects, Rodríguez Duque and Ovalle used the multi-agent technique and K-means clustering algorithm to implement automatic clustering of learning objects [5]. In these works, clustering was implemented based on the content of learning resources, such as textual descriptions. However, MOOC videos commonly do not have enough text or metadata information to describe their content. Moreover, the existing descriptions of videos are mainly used to describe the content of knowledge points, which cannot be used to measure the difficulty and importance of videos. Therefore, these methods are not suitable for the difficulty and importance measure of MOOC videos.
In the second type of work, different features of learning resources are obtained through students’ learning behavior. For example, Van der Sluis, Ginn, and Van der Zee presented the formalized definition of the information complexity in videos [9]. Based on clickstream tracking data, they explored the relationship between videos complexity and students’ stay proportion or stay time. Similarly, Li et al. discussed the relationship between video interaction patterns and video difficulty as well as students’ revisiting behaviors and performance [10]. Ye, Cheng, and Huang used the K-means clustering algorithm to automatically classify a large number of network learning resources and evaluated the resources after clustering by dominant relationship [11]. Then, they selected high-quality network learning resources by the survival of the fittest mechanism. On the whole, these works mainly use the data of student behavior in MOOCs to judge the features of videos. However, they do not propose specific measure approaches of video features. Moreover, they do not implement the personalized classification based on the video features.
The third type of works studied the semantic similarity between learning resources based on the co-occurrence relationship of learning resources [12,13]. For the semantic similarity measure of learning resources, these works did not consider the content of the learning resources but the data of learning resources used by users. The basic idea of these works was that, if two learning resources are used in the same session, they were semantically similar. However, this kind of work mainly studies the semantic similarity between learning resources based on their content. Therefore, these works cannot be used for the classification of MOOC videos based on the difficulty and importance.
In summary, the existing EDM works cannot implement the personalized classification of MOOC videos based on the difficulty and importance. It is necessary to study the personalized measure and classification of MOOC videos from the perspective of difficulty and importance by the learning data of students.
3. MOOC Video Personalized Classification Framework
According to the teaching practice, learning behaviors of students are different for videos with different difficulty and importance in the MOOC-based learning process. A student usually watches more difficult videos many times in a short time. Meanwhile, a student also watches the videos with more important content many times, and the time interval of watching is related to the importance of videos. For the analysis of difficulty and importance of MOOC videos, we should consider not only the times of watching but also the specific time of watching. Therefore, we propose to measure the difficulty and importance of the videos based on the video learning process model, which considers both the watching times and the watching time sequence of videos. The video learning process model can describe the overall video watching behavior of a group of students, and it implies the difficulty and importance information of videos.
Based on the above ideas, we propose an approach for MOOC video personalized classification based on clustering analysis and process mining. The overall framework of the approach is shown in Figure 1. Specifically, students are first clustered based on their knowledge levels according to their homework, question-solving, or other relevant data. Next, the process mining technique is used to mine the video watching data of students in each cluster, and the process model describing video learning behavior in each student cluster is mined. Finally, the difficulty and importance values of each MOOC video are calculated using the process model of each student cluster. Thus, videos can be classified according to their difficulty and importance for students in each cluster.
3.1. Student Clustering
A teacher needs to understand the knowledge levels of students first in the process of personalized teaching, which is the basis of MOOC video personalized classification. The knowledge levels of students can be obtained through the data in online learning systems [14]. Therefore, we use the question answering data of students to measure their knowledge levels. In this way, we can implement student clustering based on their knowledge levels.
3.2. Video Learning Behavior Process Model Mining
Process mining is an extension of data mining in process management, and its applications include process discovery, conformance checking, and bottleneck analysis [15,16,17,18,19,20,21], etc. Among them, process discovery gets the process model based on multiple sequences in the event log. In this study, we apply the process mining technique to the MOOC video watching data. Thus, we can mine the overall video learning behavior of a group of students through their video watching data, which is expressed in a process model that describes the logical relationship of MOOC videos. The definition of the video learning behavior process model is given below.
Definition 1.
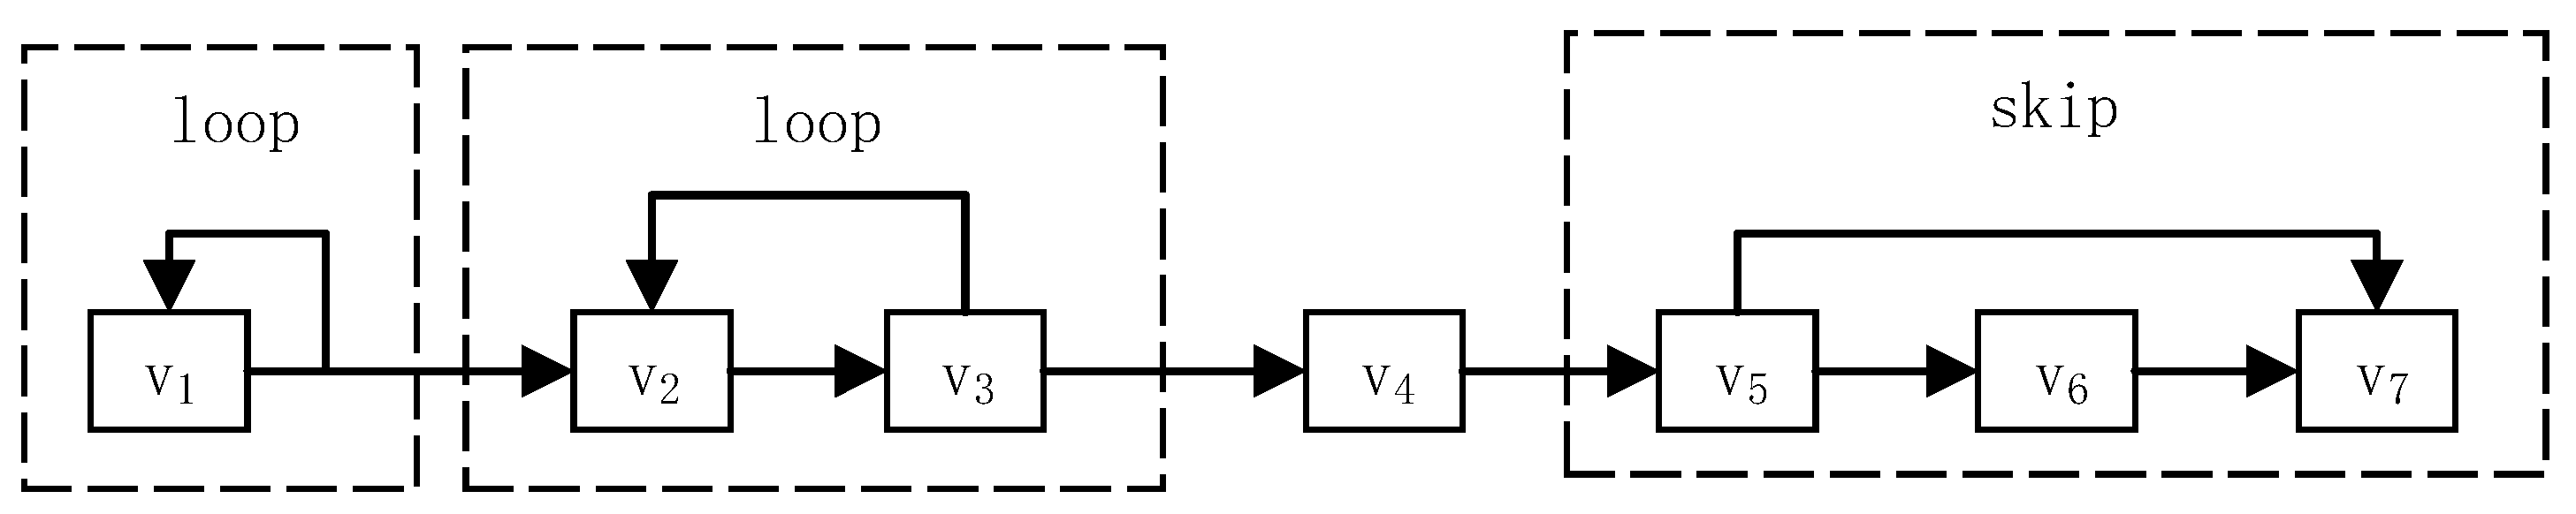
VLBP (Video Learning Behavior Process) = (V, E), where V = {v1, v2, …, vn} is a set of n MOOC videos and E = {e1, e2, …, em} is a set of order relationships between MOOC videos, in which ei is the sequential relationship between two different videos in V.
VLBP is composed of MOOC videos nodes and directed arcs that express the sequence of videos. VLBP contains logical structures among videos, such as order, loop, and skip. Figure 2 shows an example of a VLBP model. In Figure 2, v1 exists in a loop structure, indicating that students watch v1 repeatedly; v2 and v3 exist in a loop structure, which means students watch v2 and v3 in order repeatedly; and v5, v6, and v7 exist in a skip structure, which means students can skip v6 and watch v7 directly after watching v5.
3.3. MOOC Video Personalized Classification
We can find the difficulty and importance of MOOC videos for students by analyzing their overall learning behavior expressed by a VLBP model. For example, the loop structure in a VLBP model shows that the students watch the videos in this structure repeatedly, indicating that these videos are difficult or more important for these students. The skip structure shows the students skip the videos, which indicates that the videos are less important for the students. We can see that the specific structures in a VLBP model can reflect the difficulty and importance features of videos. Through the loop, skip, and other structures in a VLBP model, the learning behavior of students hidden in these structures can be analyzed and the difficulty and importance of videos for the students at different knowledge levels can be obtained. In this way, the MOOC video personalized classification can be implemented based on the obtained difficulty and importance.
4. MOOC Video Personalized Classification
4.1. Student Clustering
As mentioned above, the knowledge level of a student can be obtained through the question answering data. In the teaching process, a teacher can assign exercises to test students’ mastery of knowledge points and can get students’ knowledge levels through the results of exercises. In this way, a teacher can obtain student clusters based on their knowledge levels.
In the actual teaching, a teacher can choose different features of question answering data according to a course. For example, subjective questions usually have corresponding scores and a teacher can decide the scores based on the answers. For computer programming questions, if online judge (OJ) system [22] is used, the answer results can be “pass”, “error”, “timeout”, etc., in which “pass” indicates that the answer is correct and other results indicate that the answer is wrong. In a word, a teacher can choose the features of question answering data that are used to measure students’ knowledge levels in practice. We use three features of question answering data to measure knowledge levels of students in this study: the scope of the answered questions, the score, and the number of correct answers.
We use the clustering algorithm to cluster students after determining the clustering features of question answering data. Classic clustering algorithms include K-means clustering [23], hierarchical clustering [24], etc. In the actual teaching, students’ knowledge levels are usually divided into several categories, such as “excellent”, “good”, “general”, and “poor”. Therefore, we use the K-means clustering algorithm. The student clustering based on the K-means algorithm according to the knowledge levels of students is shown in Algorithm 1.
| Algorithm 1 Student clustering based on question answering vectors by K-means clustering. |
| Input: Students set S = {s1, s2, …, sn}; Students’ question answering vector set SV = {sv1, sv2, …, svn}; //svi represents the question answering vector of the i-th student; The number of clusters K; Max iteration times MT1; Max times of cluster centers unchanging MT2 Output: K clusters: C1, C2, …, CK |
| 1: init: C1 = C2 = … = CK = {}, current iteration times CT1 = 0, current times of cluster centers unchanging CT2 = 0, 2: CV = {cv1, cv2, …, cvK} = Random(SV, K) //select the question answering vectors of K students as K initial cluster centers randomly 3: while (CT1 < MT1 and CT2 < MT2) //stop iteration when CT1 reach MT1 or CT2 reach MT2 4: for each svi∈SV and cvj∈CV://traverse question answering vectors and cluster centers 5: if (svi nearest to cvj) then: //search the nearest cluster center to each students 6: add si to Cj //add student si to the nearest cluster 7: end if 8: end for 9: for each cvi∈CV, each sj∈Ci: //traverse cluster centers and students that belong to the cluster 10: cvi = avg(svj) //take the average value of every students’ question answering vectors in cluster i as new cluster centers of cluster i 11: end for 12: CT1 = CT1+1 //add 1 to max iteration times 13: if (unchanged(CV)) then://if all cluster centers are unchanged 14: CT2 = CT2+1 //add 1 to max times of cluster centers unchanging 15: end if 16: end while 17: output C1, C2, …, CK |
In Algorithm 1, question answering vector is V = (data1, data2, …, datan), where n is the number of the clustering features and datai represents the i-th clustering feature of the question answering data. Algorithm 1 first randomly selects K objects as the initial cluster centers (line 2). Then, it calculates the distance between each object and each cluster center and assigns each object to the cluster center closest to it (lines 4–8). Next, the algorithm recalculates all cluster centers based on the existing objects in each cluster (lines 9–11) and updates the iteration conditions (lines 12–15). Repeat the process until the termination conditions are met (lines 3–16). Finally, the algorithm outputs the clusters (line 17).
4.2. VLBP Model Mining
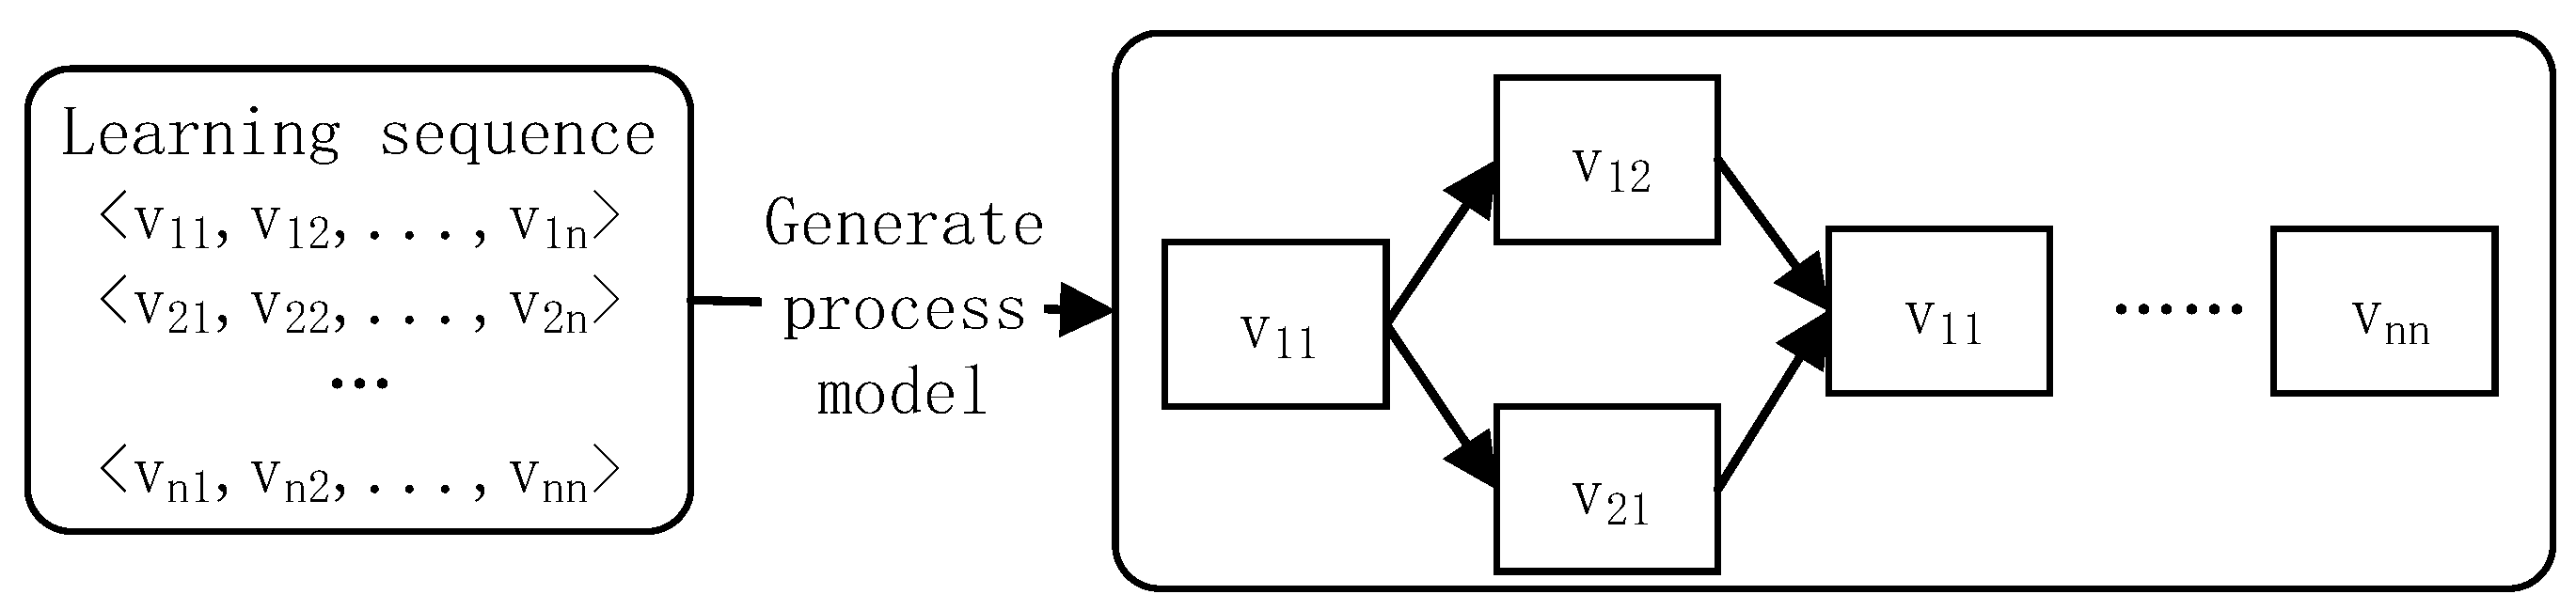
Video watching data of a student in a MOOC platform consists of a sequence of MOOC videos (herein referred to as learning sequence), which records the MOOC videos watched by the student in chronological order. The definition of the learning sequence is given below.
Definition 2.
LS (Learning Sequence) = <v1, v2, v3, ..., vn>, where n is a natural number and vi denotes the i-th video in the sequence.
The VLBP model of a student cluster can be obtained by a process mining algorithm through the MOOC video watching sequence data in the student cluster. The mining process is shown in Figure 3. Existing process mining algorithms include the α-algorithm [25], the heuristic mining algorithm [26], the genetic mining algorithm [27], the fuzzy mining algorithm [28], etc. In addition, a VLBP model can be expressed as a Petri net, a heuristic net, a BPMN (Business Process Modelling Notation) model, and so on. Heuristic algorithms can deal with short loop structure and noisy data, and it does not need complete logs and a large number of parameters. Furthermore, its mining speed is faster. In terms of the process model, the heuristic net is more concise, and it can better reflect the model structure. Therefore, it facilitates the difficulty and importance analysis of videos. We use the heuristic algorithm to mine the VLBP model based on the heuristic net, which is shown in Algorithm 2.
| Algorithm 2 VLBP model mining based on heuristic mining. |
| Input: Learning Sequence set LSS = {LS1, LS2, …, LSn}; The threshold of the number of following directly Tf; The threshold of dependency Td; Output: VLBP = (V, E) |
| 1: init: the number of following directly matrix F[][]=0, dependency matrix D[][], all videos set Vall = {}, target videos set V = {}, order relations set E = {} 2: for each LS∈LSS and each vi∈LS://traverse videos belonging to LSS 3: if (vi not belong to Vall) then: 4: add vi to Vall //record videos that appear in LSS 5: end if 6: end for 7: for each LS∈LSS and each vi, vi+1∈LS://traverse neighboring videos in each LS in LSS 8: F[vi][vi+1] = F[vi][vi+1] + 1 //count the times that vi follows vj directly 9: end for 10: for each vi, vj∈Vall: //traverse every two videos 11: if (vi == vj) then: 12: D[vi][vj]=F[vi][vj]/(F[vi][vj]+1) //calculate the dependency between vi and itself 13: end if 14: if (vi != vj) then: 15: D[vi][vj]=(F[vi][vj]-F[vj][vi])/(F[vi][vj]+F[vj][vi]+1)//calculate the dependency between vi and vj 16: end if 17: if (F[vi][vj] >= Tf) and (D[vi][vj] >= Td) then://the number of following directly and the dependency between videos are all greater than or equal to the threshold 18: if (vi, vj not belong to V) then: 19: add vi, vj to V//record videos that meet the conditions 20: end if 21: add (vi, vj) to E//record the order relationship between videos 22: end if 23: end for 24: output (V, E) |
Algorithm 2 first counts the number of directly following relationships (lines 7–9) between every two adjacent videos vi and vi+1 in the learning sequence. Next, it calculates the dependency between every two videos vi and vj (lines 11–16). Then, if the number of directly following relationships and the dependence of vi and vj are greater than Tf and Td, vi and vj are added into the video set of the VLBP model and the sequence relationship of vi and vj is added into the relationship set of the VLBP model (lines 17–22).
4.3. Video Classification Based on VLBP
We can get the importance and difficulty values of MOOC videos for students by analyzing the structures in a VLBP model. Based on the obtained importance and difficulty values of each video, we can classify videos for students in each cluster. Therefore, we first present the model structures that can reflect the difficulty and importance of videos in a VLBP model. Next, we introduce the difficulty and importance measure of the videos through these structures. Based on the difficulty and importance values of each video in a student cluster, we can classify the videos for the students in the cluster.
4.3.1. VLBP Structures for Video Difficulty and Importance Measure
According to a VLBP model, the following four structures are mainly considered to measure the difficulty and importance of MOOC videos.
• Self-Loop
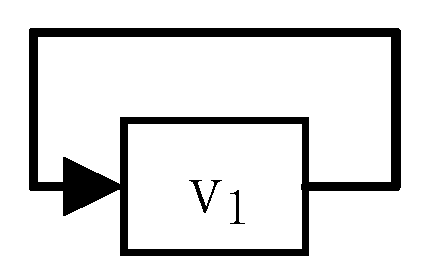
This structure refers to a loop structure containing only one video. Figure 4 shows an example of a self-looping structure where the video is v1. From the perspective of importance, the structure represents the repeated watching behavior of students. The behavior indicates that the content of the video is more important. From the perspective of difficulty, the centralized learning behavior of a single video also indicates that the content of the video is more difficult.
• Short-Loop
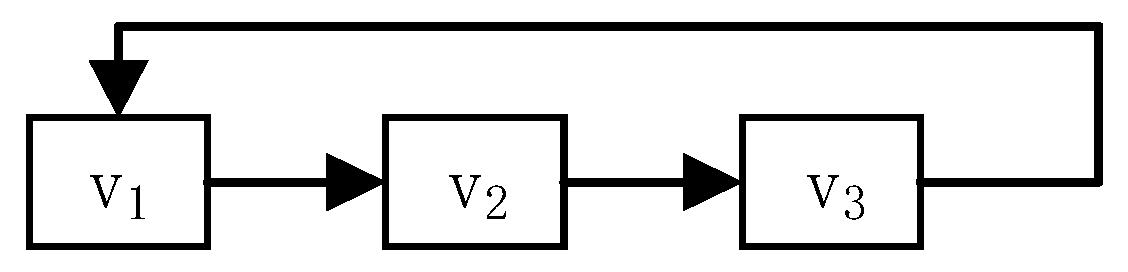
This structure refers to a loop structure containing 2-n videos (n can be determined in a practical teaching practice). Figure 5 shows an example of a short-loop structure in which the videos are v1, v2, and v3. From the perspective of importance, the correlation between the videos in the structure is strong. This is to say, these videos are commonly watched together. The behavior of watching the videos repeatedly in the structure indicates that the content of these video is more important. From the perspective of video difficulty, the continuous learning behavior of a small number of correlated videos also indicates that the content of these videos is more difficult. As a result, these videos need to be watched many times.
• Long-Loop
This structure refers to a loop structure containing more than n videos in the loop (n can be determined in a practical teaching practice). Figure 6 shows an example of a long-loop structure where videos are v1–v6. From the perspective of importance, this structure indicates that students review a set of videos that they have watched. This structure usually appears after students have watched these videos for a long time. Reviewing videos shows that these videos are important. Through data analysis, we find that videos in a long-loop structure generally belong to multiple chapters of the course, and there may not be correlations among these videos. From the perspective of difficulty, the reviewing behaviors of videos that have no correlations are not because these videos are difficult. In practice, it is possibly because students have forgotten the content of these videos after long interval. Therefore, it does not mean that videos in this structure are difficult.
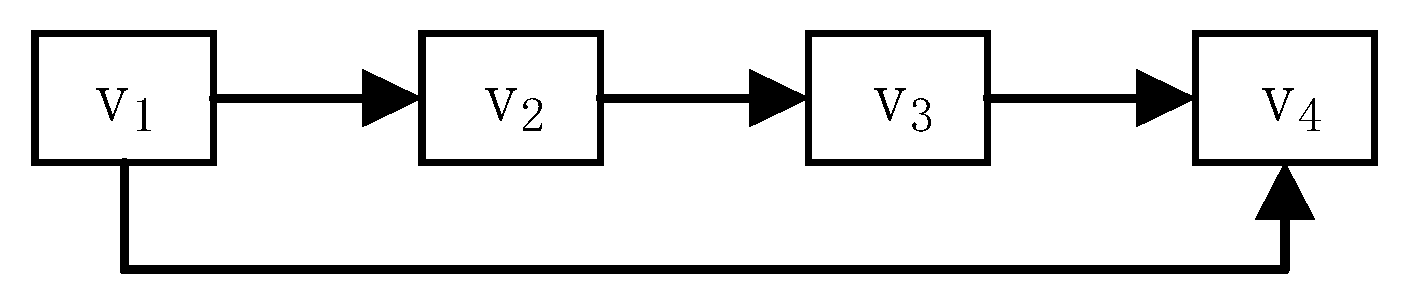
• Skip
This structure consists of a start node, a skip branch, and an end node. The videos in the skip branch are skipped by students in the learning process. Figure 7 shows an example of a skip structure, where v1 is the start node, v2 and v3 form the skip branch, and v4 is the end node. In this example, v4 can be directly watched after watching v1 while ignoring v2 and v3. It can be seen that the videos in the skip branch are less important.
4.3.2. Video Importance and Difficulty Measure based on VLBP
Based on the above analysis, the difficulty of videos can be obtained by analyzing self-loop and short-loop structures of VLBP because videos in these two structures are more difficult. The importance of videos can be obtained by analyzing self-loop, short-loop, long-loop, and skip structure of VLBP. Specifically, videos in the first three structures are more important, while videos in the skip branch of a Skip structure are less important. Accordingly, we give the following approach to measuring the difficulty and importance of MOOC videos based on the structures of VLBP.
We denote that vi is the i-th video, Di is the difficulty of vi, and Ii is the importance of vi. EXi indicates whether vi appears in a VLBP model. Specifically, EXi = 1 indicates that vi appears in the VLBP model and EXi = 0 indicates that vi does not appear in the VLBP model. In addition, EXi(x) indicates whether vi exists in the x structure. Specifically, EXi (x) = 1 indicates that vi exists in the x structure and EXi (x) = 0 indicates that vi does not exist in the x structure (if x is a skip structure, x represents the skip branch in the skip structure). We give the calculation methods of Di and Ii as Equations (1) and (2) to quantify the difficulty and importance of a video.
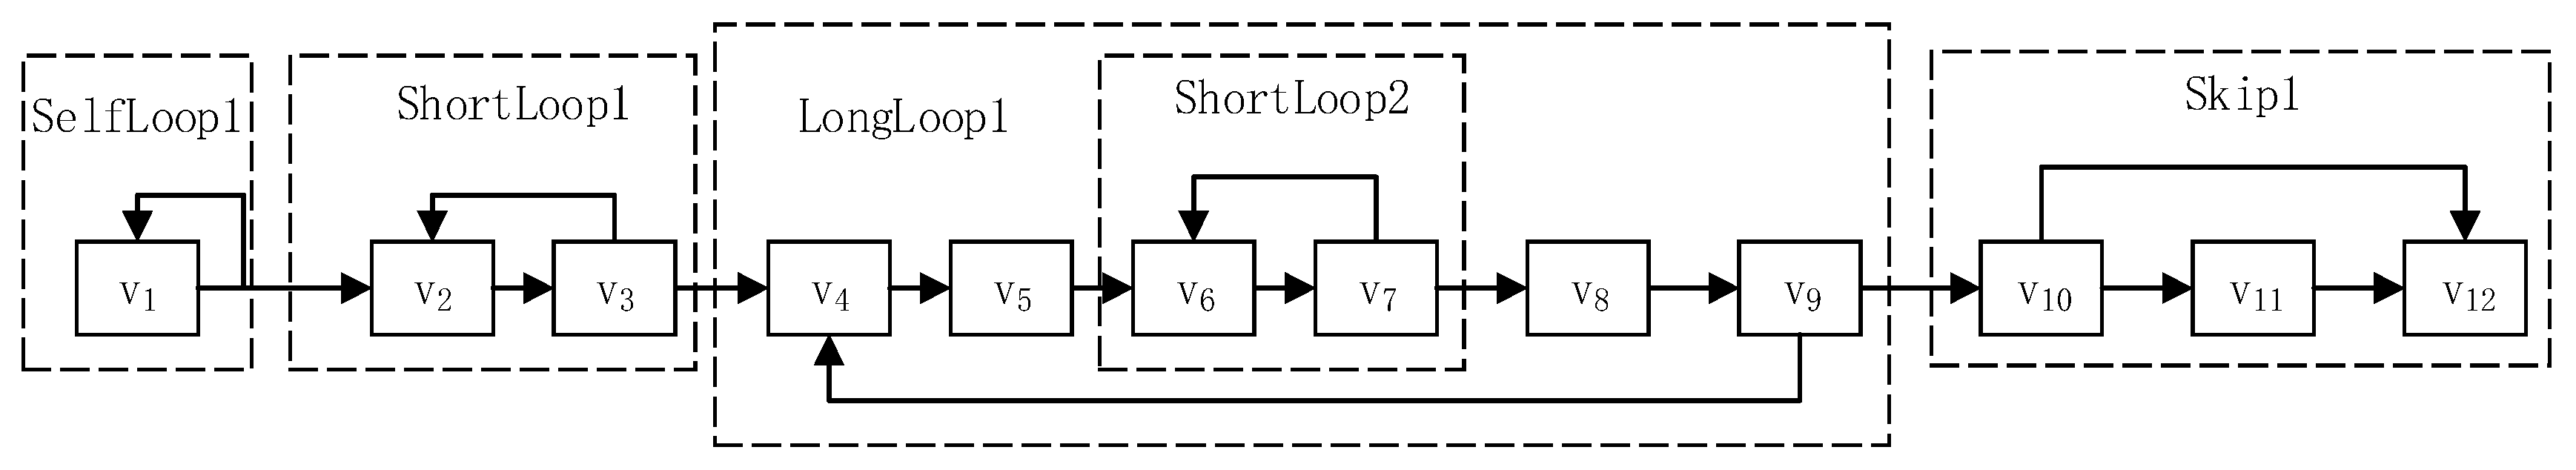
Figure 8 shows a VLBP model, which is mined by the video watching data of a group of students. Four structures in the VLBP model are analyzed to calculate the difficulty and importance values of the videos v1–v13. All the structures, together with the difficulty and importance of videos calculated by Equations (1) and (2), are shown in Table 1. In Table 1, different videos with the same structure name indicate that these videos exist in the same structure (note that videos with the same skip structure indicate that these videos belong to the same skip branch). For example, v1 is in the self-loop, v2 and v3 exist in the same short-loop, and v6 and v7 exist in the same short-loop. In addition, v4, v5, v6, v7, v8, and v9 exist in the same long-loop and v11 can be skipped. In addition, the video that does not appear in the VLBP model is v13.
4.3.3. MOOC Video Classification
Videos can be classified according to its values of difficulty and importance obtained by the VLBP model. For example, videos in Figure 8 are classified based on the difficulty and importance in Table 1. First, the videos with the difficulty value 1 are v4, v5, v8, v9, v10, v11, and v12 and the videos with the difficulty value 2 are v1, v2, v3, v6, and v7. Second, the video with the importance value 0 is v11; the videos with the importance value 1 are v10 and v12; the videos with importance 2 are v1, v2, v3, v6, and v7; and the videos with importance 3 are v6 and v7. The final classification results are shown in Table 2.
5. Experiment and Evaluation
This section evaluates the effectiveness of the proposed approach through an experiment based on a real dataset of a MOOC and OJ platform (Appendix A). We first introduce the dataset used in the experiment. Next, we introduce the procedures of the experiment. Finally, we give the experimental results.
5.1. Dataset
We select the learning data in the MOOC and OJ platform of our college. The video watching records are produced by two classes of students majoring in software engineering who learned Java course in one semester. The dataset mainly contains the data of students’ OJ exercises and MOOC video watching sequences. The former is used to cluster students, and the latter is used to generate the VLBP model of each student cluster.
• Question answering data
We use the question submission data from OJ as the question answering data. We get question submission data of each student in the OJ system, including the correct number and the total number of answered questions. The correct number of answered questions can reflect students’ knowledge level because each question commonly covers one or more knowledge points. Moreover, the programming questions in OJ can be submitted repeatedly. Students can submit answers multiple times until the answers are correct when they submit wrong answers. For the same question, the students at high knowledge level usually submit fewer times than the students at low knowledge level. Therefore, besides the correct number of answered questions, we take the correct rate of answered questions (the correct number of answered questions divided by the total number of answered questions) as another feature to measure the knowledge level of students.
• Video watching data
A video watching record contains the video name and learning time. According to the learning time of the videos, video watching sequence of each student can be obtained. We choose the videos in the first four chapters of the Java course in this experiment due to the large number of videos in the dataset. Meanwhile, we preprocess the video watching data to improve the accuracy of the experiment. Specifically, the learning records with video watching interval less than 1 minute and the records of student who do not watch any videos or only watch a few videos (the number of watched videos is less than one tenth of the total videos) are removed.
5.2. Experimental Procedures
5.2.1. Student Clustering
In this experiment, we cluster students based on the correct number and correct rate of their answered questions. By analyzing the data, the number of clusters in the experiment is set to 4. Then, we use K-means clustering algorithm to cluster the students. Finally, we analyze the average values of each cluster, and the result is shown in Table 3.
The correct number and correct rate of answered questions in cluster 1 are higher than cluster 2 and cluster 3 and much higher than the overall mean. The correct number and correct rate of answered questions in cluster 2 are higher than those in cluster 3 and slightly higher than the overall mean. The correct answer and correct rate of students in cluster 3 are lower than the overall mean. In addition, the correct number of cluster 4 is very small but the correct rate is the highest. This is because there are only two students in cluster 4 and they only answered relatively easy questions. As a result, this cluster is not considered in the experiment. According to the mean values in each cluster, we can determine that clusters 1, 2, and 3 correspond to the three categories of students at knowledge levels of “high”, “middle”, and “low”, respectively.
5.2.2. VLBP Model Mining and Video Classification
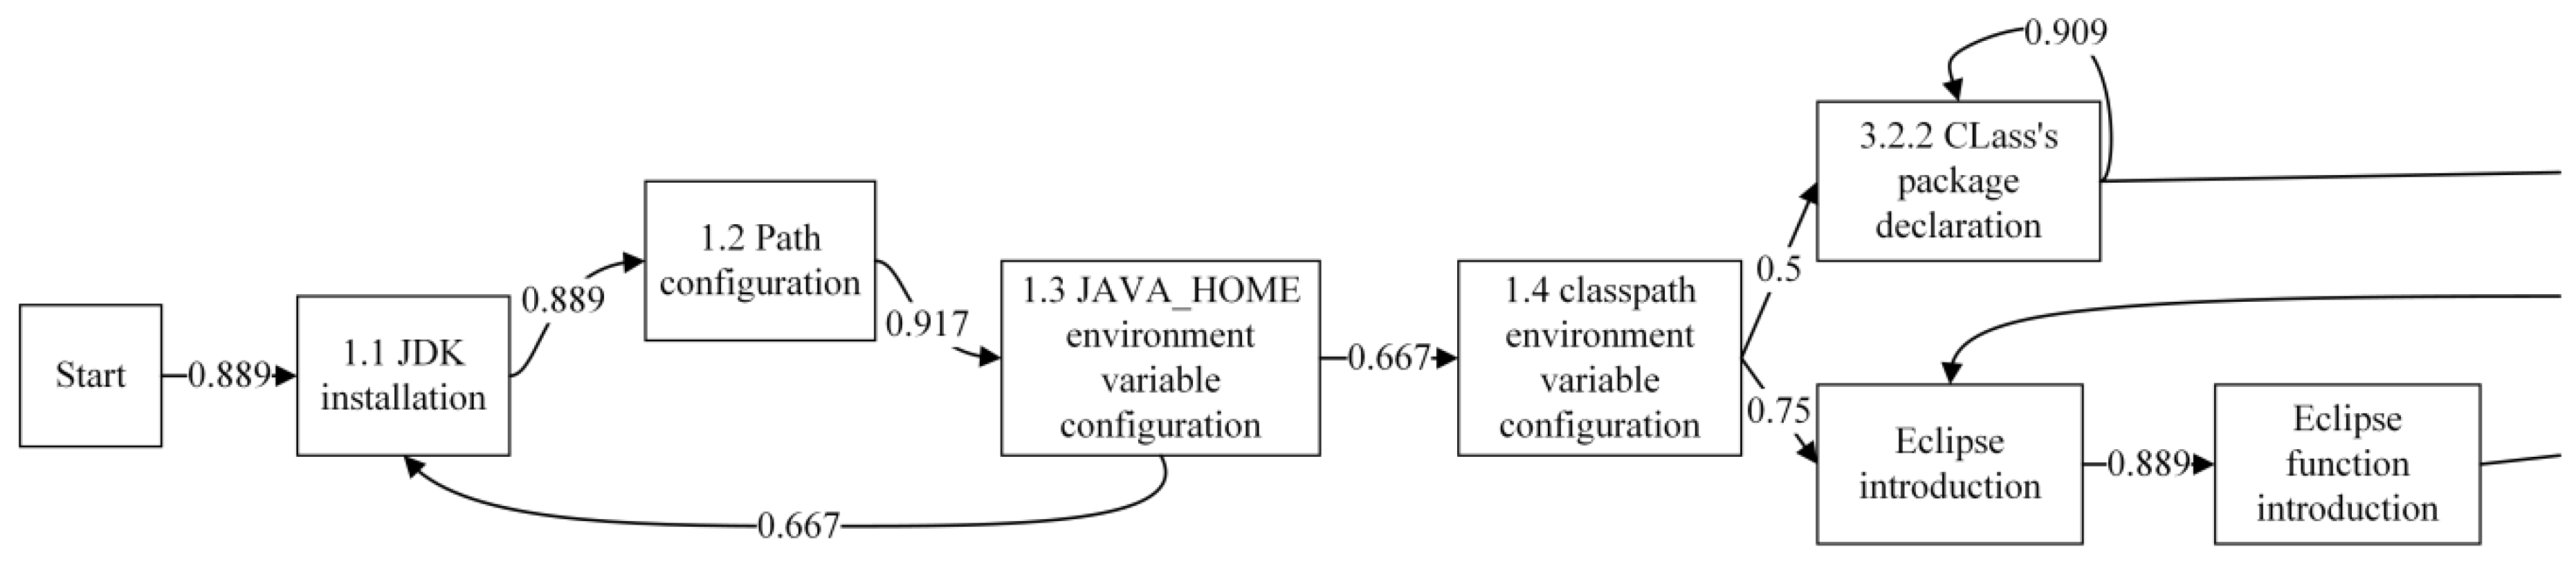
We use the heuristic mining algorithm to obtain the VLBP model of each student cluster by the MOOC video watching sequences of all students in each cluster. Taking the students at “high” knowledge level as an example, a part of its VLBP model is shown in Figure 9. We can see the VLBP model contains three structures: self-loop, short-loop, and long-loop.
Next, we find out above four kinds of structures in the VLBP model of each student cluster. Based on these structures, we calculate the difficulty D and importance I of each video. Finally, we classify the videos for three kinds of students according to their difficulty and importance. Take the student cluster at “high” knowledge level as an example. The VLBP model structures and the difficulty and importance of a few videos are shown in Table 4. According to the values in this table, the video classification result of this type of students can be obtained. Table 5 shows the final classification result, in which video names are denoted as v1–v40.
5.3. Experiment Analysis and Verification
In order to verify the effectiveness of the proposed approach, we first analyze the differences of video difficulty and importance for students at different knowledge levels. To this end, we compare the number of videos with different difficulty and importance in the experimental result. Then, we obtain students’ subjective evaluation of the difficulty and importance of videos through questionnaires. Finally, we evaluate the accuracy of the proposed approach by comparing the result of our approach with that of the questionnaires.
5.3.1. Difficulty and Importance Analysis of Videos
We count the number of videos with different difficulty and importance in the above three student clusters to analyze the video classification result. The comparison result is shown in Figure 10, from which we can draw following conclusions.
• Difficulty
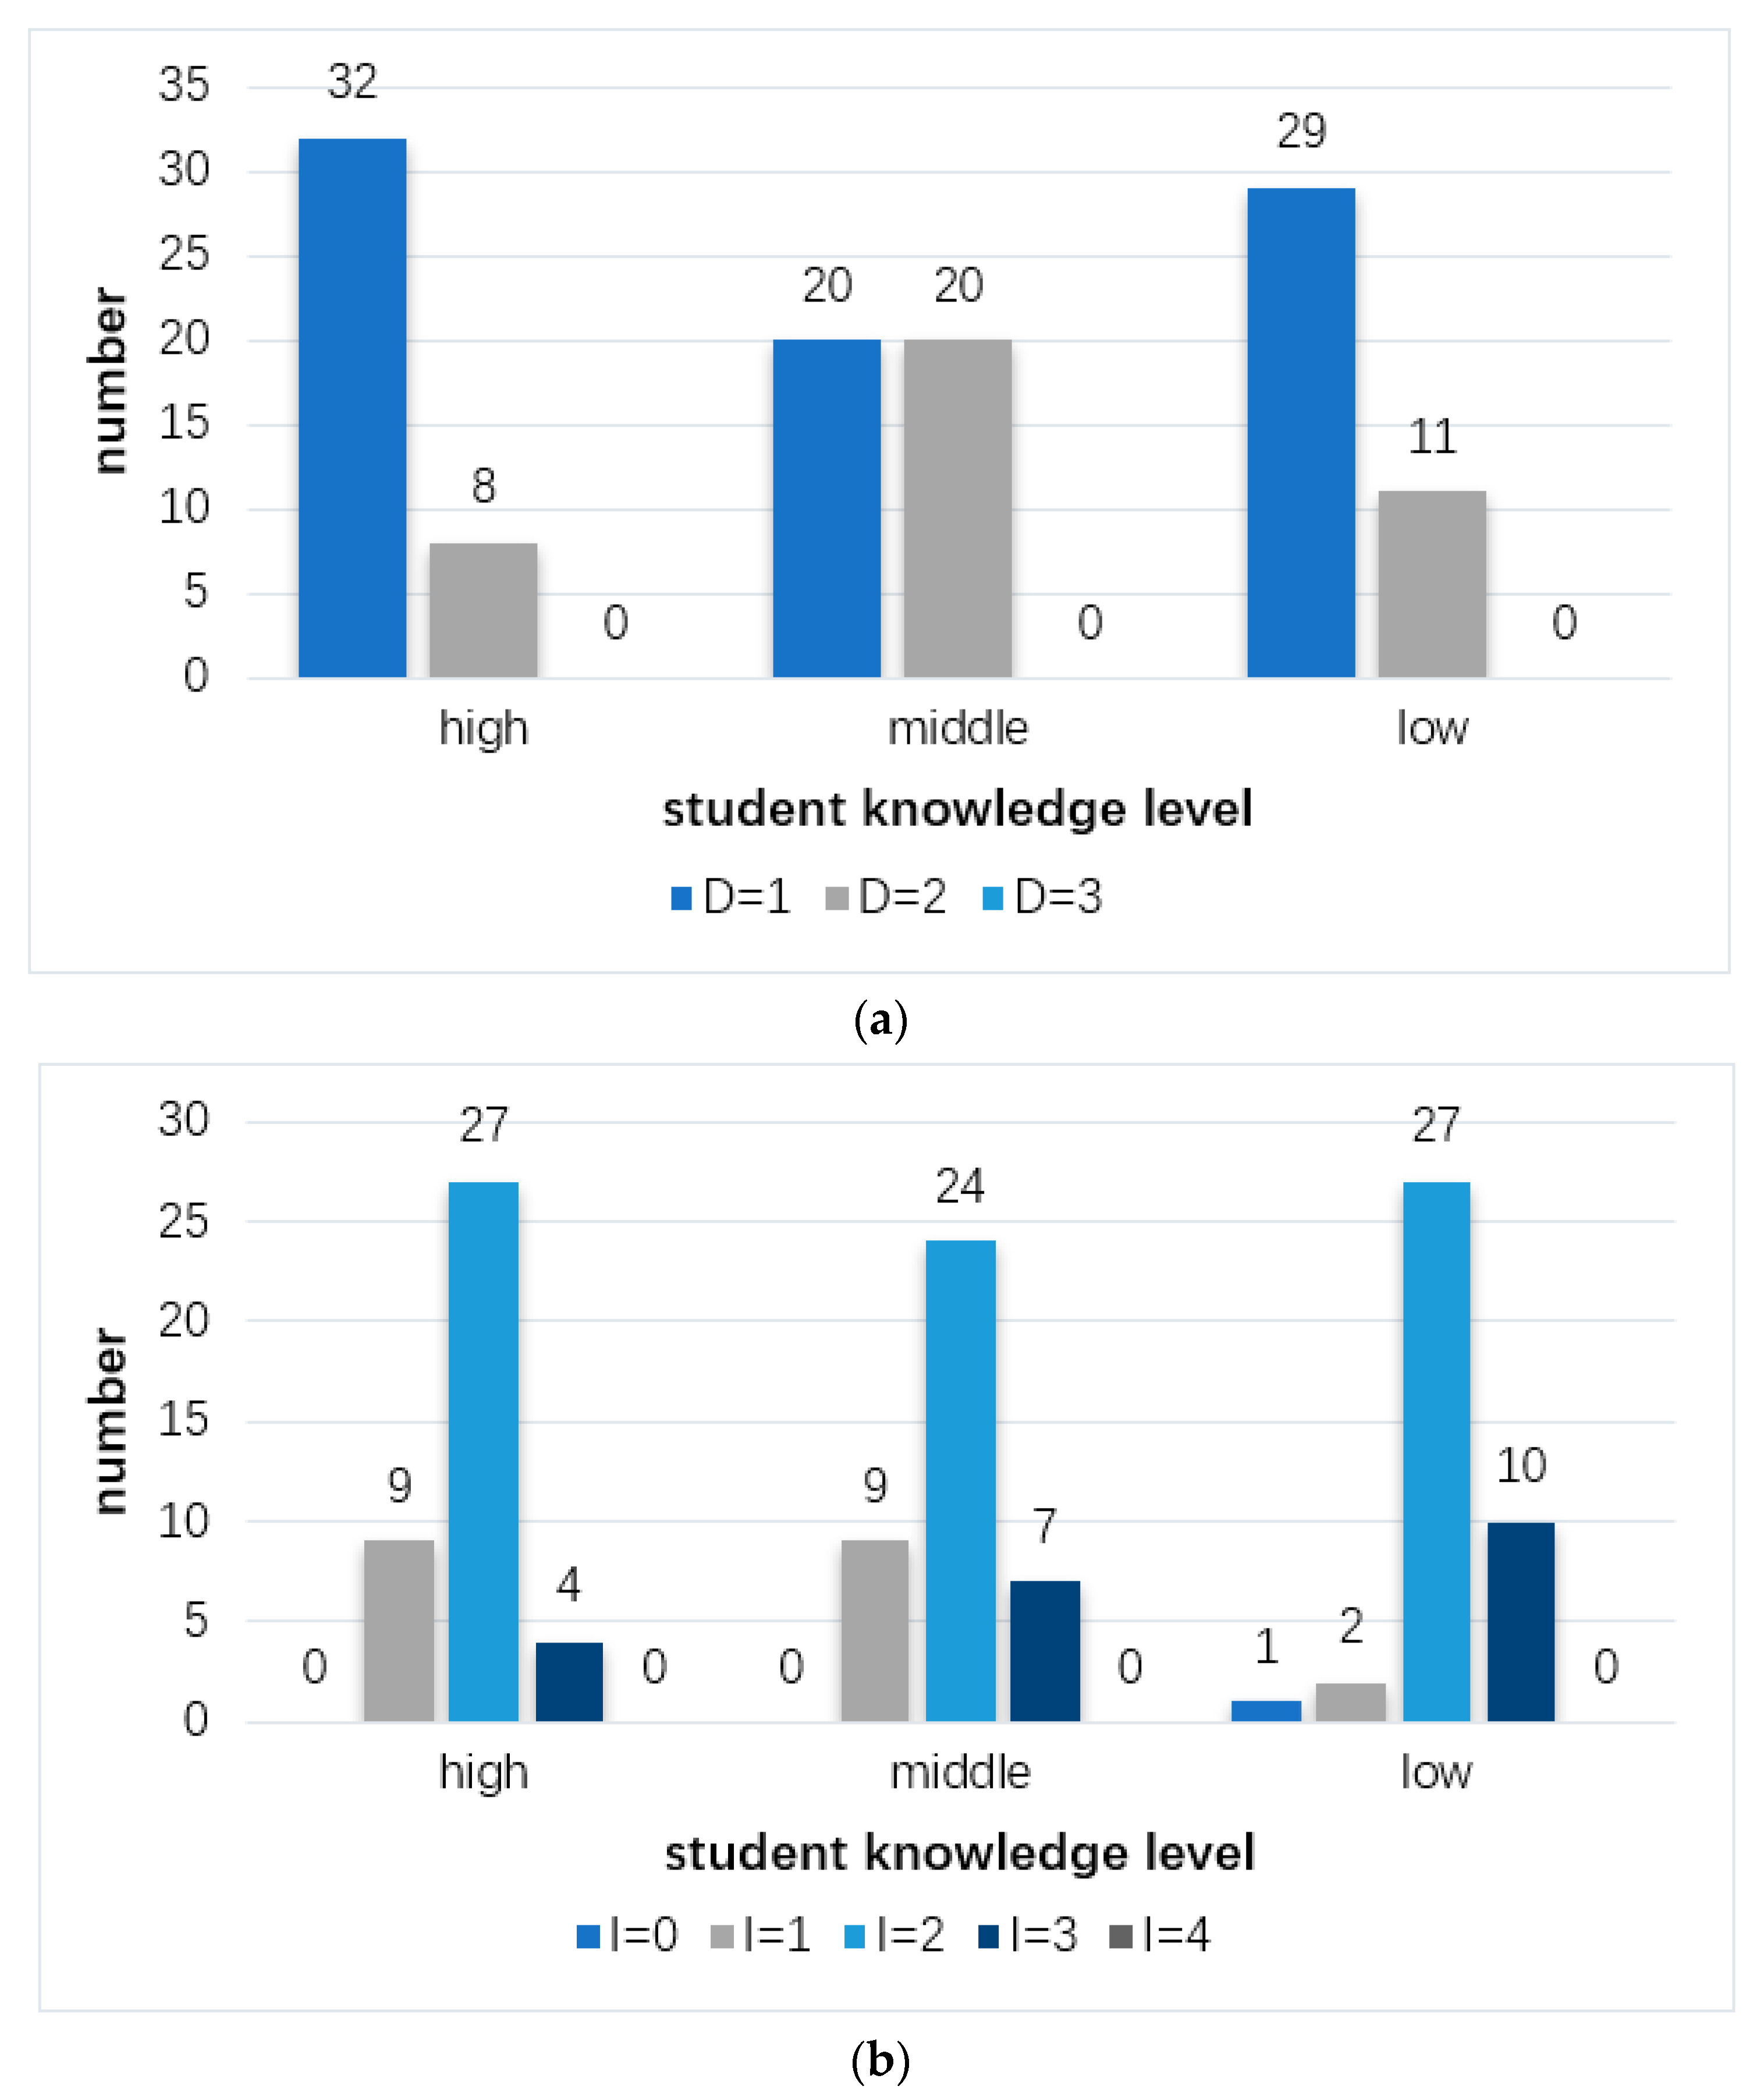
The difficulty of a video is different for students at different knowledge levels. We compare the number of videos with different difficulty in three student clusters in Figure 10a. We can see that, for students at the “high” and “low” knowledge levels, the number of videos with difficulty of 1 is more than those with difficulty of 2. Meanwhile, the number of videos with difficulty of 1 and 2 are equal for students at the “middle” knowledge level. This is because students at the “high” knowledge level generally have higher learning ability and because there are less difficult videos and more easy videos for them. However, for the students at the “low” knowledge level, there are fewer difficult videos and more easy videos, compared with those at the “middle” knowledge level. Through the interview with students, we find that many students at the “low” knowledge level rarely watch videos repeatedly in a short time in the learning process, even if these videos are difficult. In this case, the video watching data cannot reflect the videos’ real difficulty for these students. In conclusion, for students at the “middle” or “high” knowledge levels, the higher the knowledge level of students, the lower the difficulty of videos.
• Importance
The importance of a video is also different for students at different knowledge levels. We compare the number of videos with different importance in three student clusters according to Figure 10b. We can see that, for students at the “high” knowledge level, the overall importance of all videos is lower than that for the other two groups of students. For students at the “middle” knowledge level, the overall importance of all videos is lower than students at the “low” knowledge level. This is because the students at the “high” knowledge level grasp knowledge points of videos better, reducing behaviors of reviewing videos. However, the students at the “low” knowledge level have a weak grasp of knowledge. As a result, they have more behaviors of reviewing videos after a long time. According to the experimental results, we can conclude that the higher the students’ knowledge level, the lower the importance of videos.
5.3.2. Effectiveness of Video Personalized Classification
We verify the effectiveness of video personalized classification by comparing with the results of the students’ questionnaires. Specifically, ninety-six students from the two classes who participated in the course evaluated the difficulty and importance of forty videos in the Java course (video names are denoted as v1–v40). We compare the evaluation results of students with the classification results obtained by our approach.
• Questionnaire design
The questionnaire evaluates each video in terms of difficulty and importance. The optional values of difficulty are “easy”, “harder”, and “difficult”, which are denoted as one, two, and three, respectively. The optional values of importance are “unimportant”, “relatively important”, “important”, “more important”, and "very important", which are denoted as zero, one, two, three, and four, respectively.
• Classification accuracy
We denote the results of the questionnaire and the experiment as IG (Investigation Group) and EG (Experiment Group). In order to judge whether video difficulty and importance of EG are consistent with that of IG, we compare the results of IG with EG and obtain the average accuracy of video difficulty (denoted as DPx) and the average accuracy of video importance (denoted as IPx) in the student cluster x in EG.
We denote that n is the number of videos and that mx is the number of students in cluster x, and we denote that EDxi is the difficulty evaluation of cluster x for i-th video in EG and that IDxij is the difficulty value given by j-th student in cluster x for the i-th video in IG. Thus, DPx can be measured by Equation (3). Similarly, we denote that EIxi is the importance evaluation of cluster x for the i-th video in EG and that IIxij is the importance value given by the j-th student in cluster x for the i-th video in IG. Thus, IPx can be measured by Equation (4).
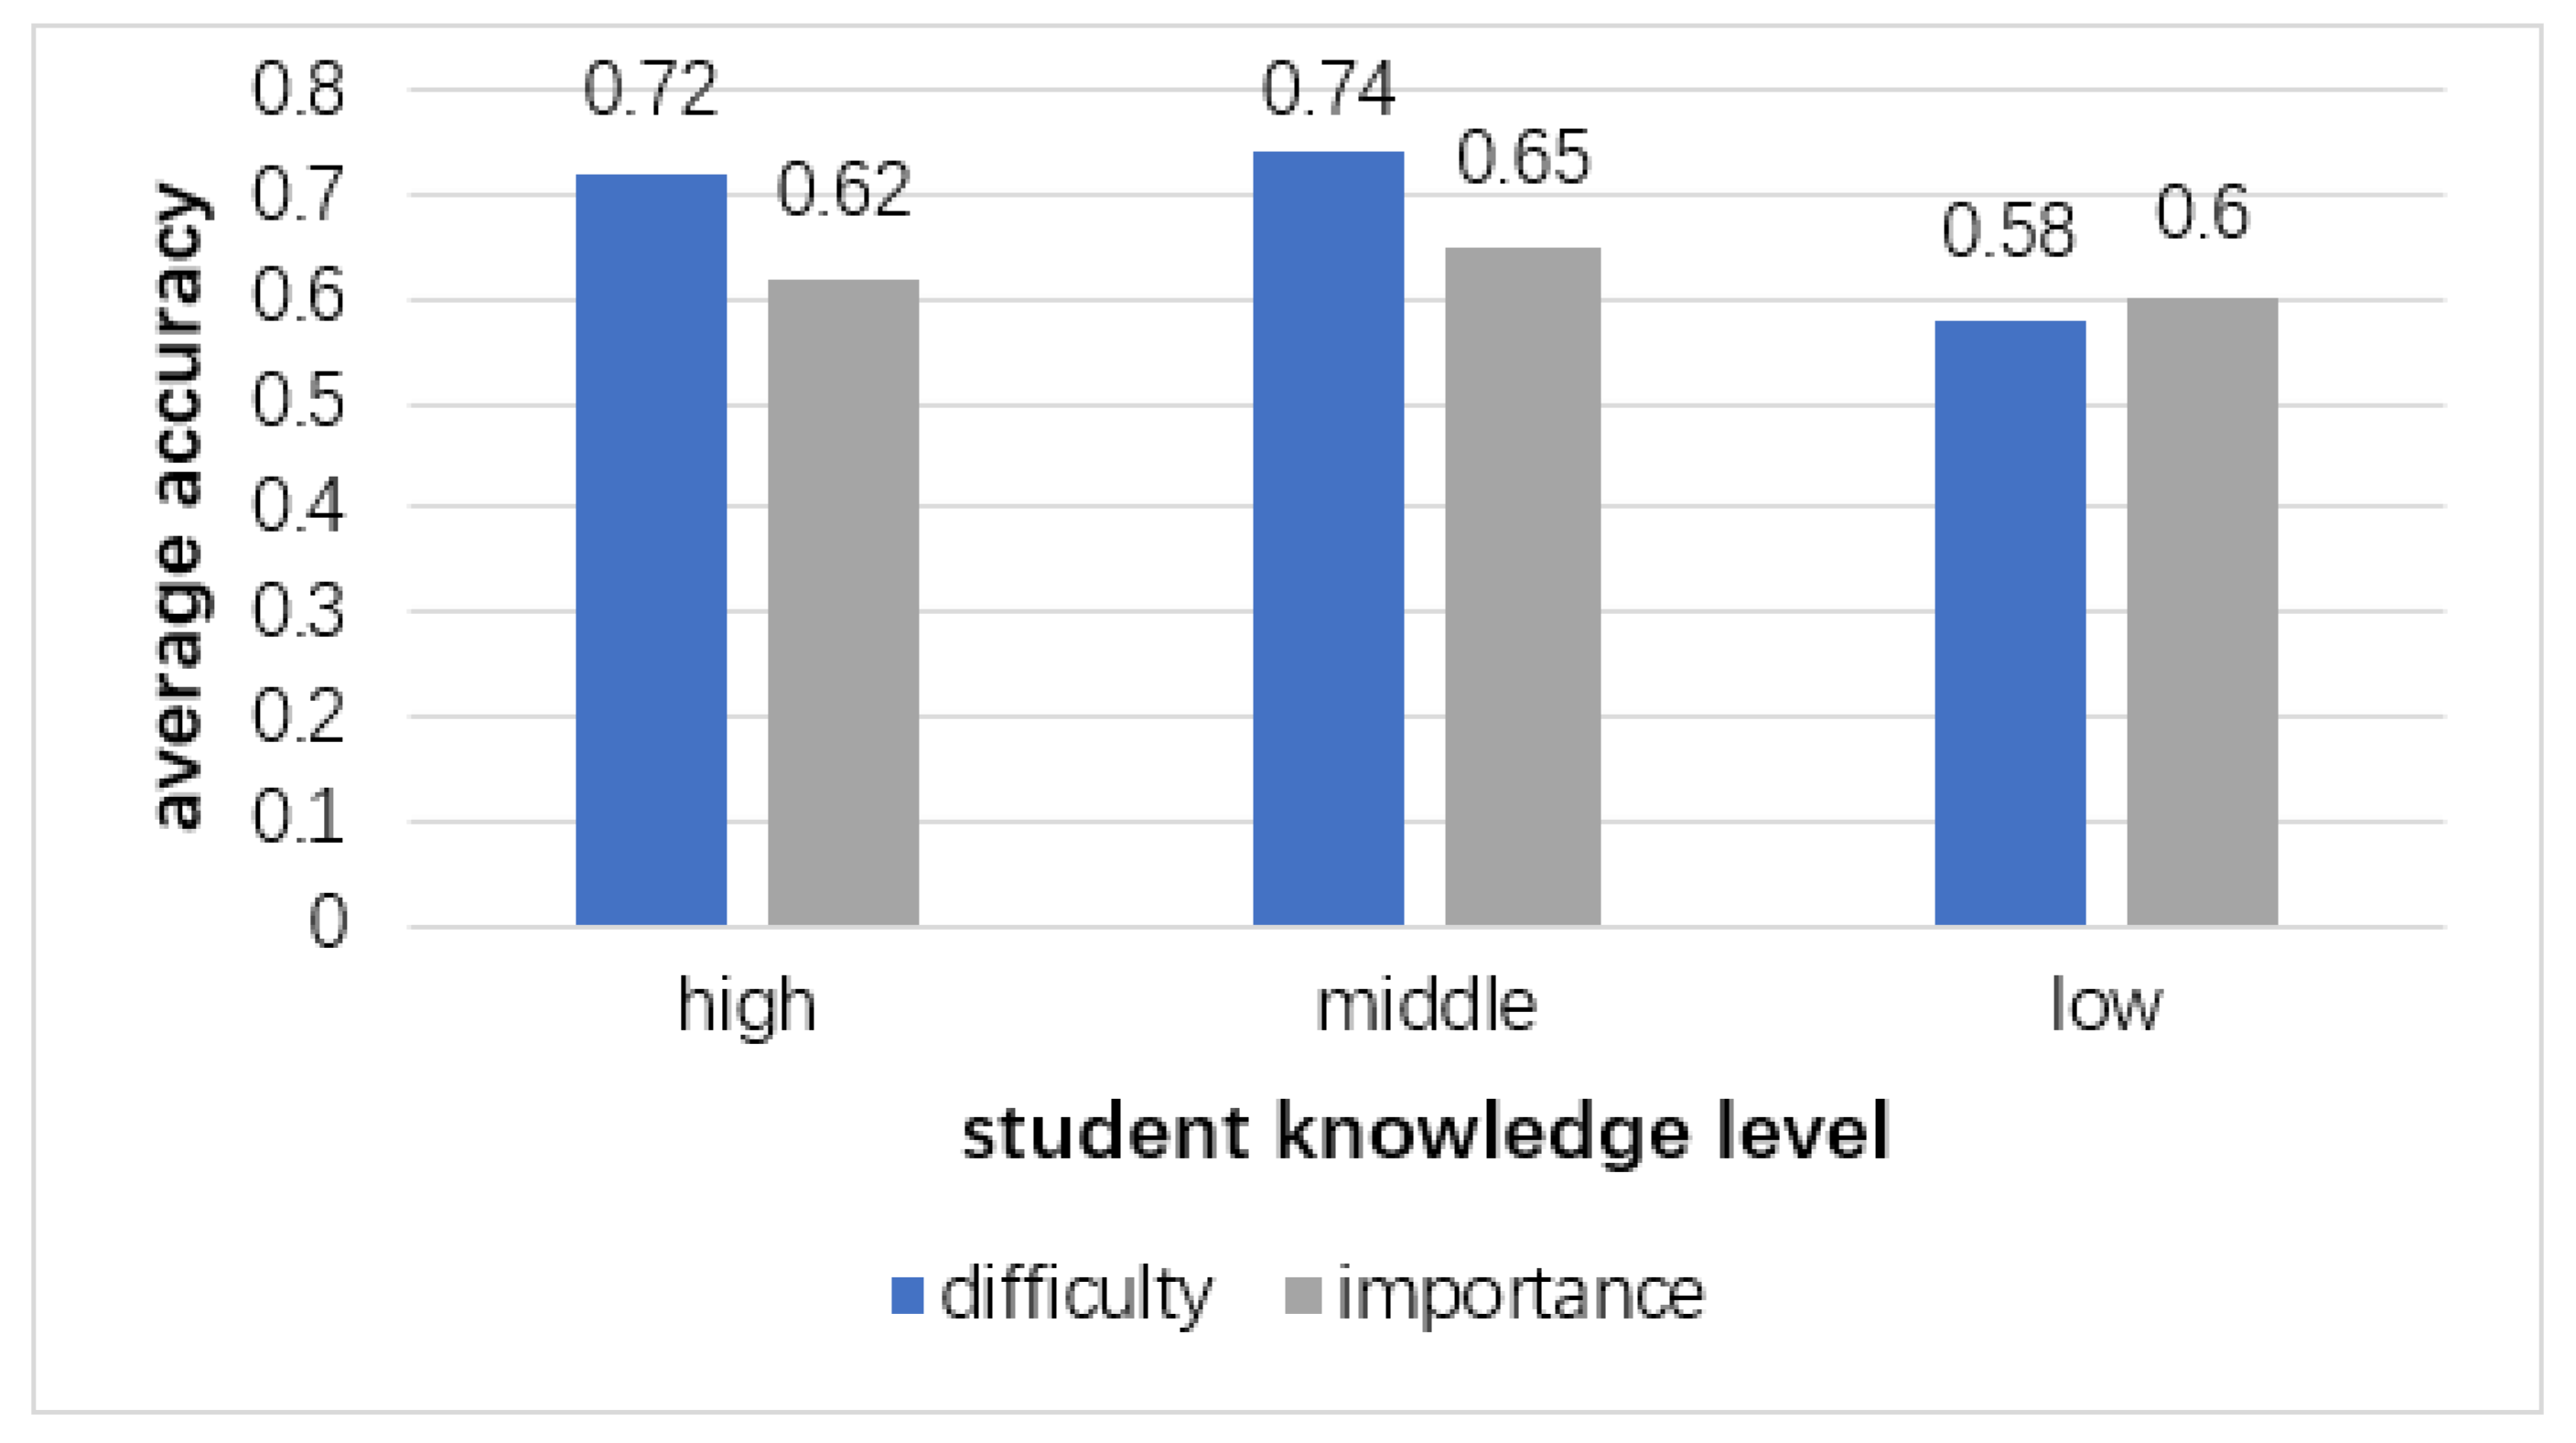
In Equation (3), we use DCxij to judge whether the difficulty of the i-th video in cluster x evaluated by EG and that given by the j-th student are consistent and we use DNxi to get the number of DCxij of which the value is 1. Next, we use DAxi to get the accuracy of difficulty evaluation of cluster x for the i-th video in EG. Finally, we get the average accuracy of difficulty evaluation of cluster x for all videos in EG by Equation (3). In the same way, we can get the average accuracy of importance evaluation of cluster x for all videos in EG by Equation (4). In the experiment, students are divided into three groups according to the clusters, and the average accuracy of difficulty and importance evaluation of each group of students for all videos is calculated (Note that the videos evaluated by students do not include the videos not watched by students). The calculation result is shown in Figure 11.
• Result analysis
First, we can see that the accuracy of difficulty is higher than that of importance from Figure 11. This is because the range of difficulty is one to three while the range of importance is zero to four. Thus, the classification of importance is more detailed. As a result, when students fill out the questionnaire, the value range of importance is larger than that of difficulty, which makes the evaluation results of importance more scattered.
Second, from the perspective of the video classification granularity, fine-grained video classification can better reflect the features of videos but the accuracy becomes lower. The coarse-grained video classification cannot reflect the features of videos better, but the accuracy is higher. Therefore, for the number of video classifications, we should take into account both the accuracy of classification and the features of videos.
Third, we can see that the average accuracy of difficulty of each student cluster is greater than 0.7 except the cluster at the “low” knowledge level. Meanwhile, the accuracy of importance of each student cluster is greater than 0.6, indicating that this approach is helpful to teachers’ personalized teaching. In addition, the video difficulty accuracy of student cluster at the “low” knowledge level is lower than that of other student clusters. This is because their video learning behaviors cannot truly reflect their real learning situation. Therefore, their learning behaviors cannot reflect the real difficulty of videos.
• Applications in the personalized teaching
From the experiment, we can see that the same video has different difficulty and importance for students at different knowledge levels. In addition, the number of videos with high or low difficulty and importance for different students are also different. Therefore, for videos that are in the same difficulty or importance for students, a teacher can explain the videos to all students. For videos with different difficulty and importance for students at different knowledge levels, a teacher can only explain them to students who regard the videos as difficult or important. In this way, a teacher can explain different video content to different students using our approach in a flipped classroom. In conclusion, the proposed video classification approach can assist a teacher to carry out personalized teaching in practice.
6. Conclusions
MOOC videos are important learning resources in MOOC and flipped classroom-based teaching. Through the video watching data of students, we can obtain the personalized features of videos for students at different knowledge levels. Thus, teachers can be assisted to carry out personalized teaching in a flipped classroom. Existing approaches classify learning resources according to their content descriptions, whereas few of them consider the difficulty and importance of videos that are the primary concern of teachers before a flipped classroom. Furthermore, the difficulty and importance of a MOOC video are personalized, i.e., they vary with students at different knowledge levels. This paper proposes the MOOC video personalized classification approach using video watching and question answering data. Clustering analysis and process mining techniques are employed to classify videos according to the difficulty and importance for students at different knowledge levels. Because the results are obtained through the learning data of students, the classification results are objective. Meanwhile, the results can be updated instantly when the learning data is changed or when teachers need to classify videos next time.
Compared with the existing works, the proposed approach measures the difficulty and importance of videos while considering the knowledge levels of students. Thus, this approach can implement the personalized classification of MOOC videos. In the actual teaching, a teacher can use existing video watching data and question answering data that can reflect the students’ knowledge levels to obtain the personalized classification of MOOC videos. In this way, the teacher can adopt different teaching strategies for different students in a flipped classroom.
This work is the preliminary exploration of the personalized classification of MOOC videos in terms of difficulty and importance in the field of EDM. The questions that can be further studied are as follows. First, student clustering is the basis of the personalized classification of MOOC videos. Because we focus on the difficulty and importance of videos for students in this paper, we use the question answering data to cluster students. In the teaching practice, if we need to cluster students according to other characteristics of students, such as the engagement in the course, we need the learning data that can reflect these characteristics. Based on the obtained student clusters, the proposed approach can be further used to obtain the corresponding personalized classification of videos. Therefore, we need to study more clustering approaches of students using different learning data and clustering algorithms. Second, because the VLBP model is affected by the watching behavior of students, learning data that cannot reflect students’ real learning situation can lead to some deviation in the video classification. Therefore, how to filter invalid data is a key point of the following works. Third, the proposed approach only considers four common structures in a VLBP model and it does not take into account more complex structures. How to analyze more complex structures of a VLBP model is also needed to be studied.
Author Contributions
Conceptualization, F.Z.; methodology, F.Z. and C.L.; validation, F.Z. and C.L.; formal analysis, F.Z. and D.L.; investigation, D.L.; data curation, D.L.; writing—original draft preparation, D.L.; writing—review and editing, F.Z., D.L., and C.L.; visualization, D.L.; project administration, F.Z. All authors have read and agreed to the published version of the manuscript.
Funding
This research was funded by the Humanities and Social Science Research Project of the Ministry of Education (“User-steering multi-source education data integration approach research in big data environment” with grant numbers 19YJCZH240 and “Research on the dynamic evolution tracking and evaluation method of government’s Internet word-of-mouth in dealing with emergencies based on big data” with grant numbers 18YJAZH017), by 2019 Qingdao social science planning research project (grant number QDSKL1901123), by the NSFC (grant numbers 61902222 and 31671588), by Sci. & Tech. Development Fund of Shandong Province of China (grant numbers 2016ZDJS02A11 and ZR2017MF027), by Taishan Scholar Program of Shandong Province (tsqn201909109), by SDUST Research Fund (grant number 2015TDJH102), by the Education and Teaching Research “Constellation” Project of Shandong University of Science and Technology (grant number QX2018M22), and by SDUST Excellent Teaching Team Construction Plan (grant number JXTD20180503).
Conflicts of Interest
The authors declare no conflict of interest. The funders had no role in the design of the study; in the collection, analyses, or interpretation of data; in the writing of the manuscript; or in the decision to publish the results.
Appendix A. Dataset Used in the Experiments
1. Question answering data:
The question answering data is available online at https://pan.baidu.com/s/1zG7JkOg5pSDX1oji9CL4FQ, and the extraction code is “5a5y”.
2. Student learning sequence data:
The learning sequence data is available online at https://pan.baidu.com/s/1JP5r8mjTtHCMoMK5jU8woA, and the extraction code is “enbq”.
References
- Long, T.; Cummins, J.; Waugh, M. Use of the flipped classroom instructional model in higher education: instructors’ perspectives. J. Comput. High. Educ. 2017, 29, 179–200. [Google Scholar] [CrossRef]
- Elmaadaway, M.A.N. The effects of a flipped classroom approach on class engagement and skill performance in a Blackboard course. Br. J. Educ. Technol. 2018, 49, 479–491. [Google Scholar] [CrossRef]
- Wu, H.Y. Integration of Personalized Learning and Flipped Classroom Teaching Mode. Mod. Educ. Technol. 2015, 25, 46–52. [Google Scholar]
- Wu, L.J.; Liu, Q.T.; Huan, H.; Liu, M.; Huang, J.X. The Design and Development of Educational Resources Clustering System Oriented to e-Learning. China Educ. Technol. 2014, 35, 85–89. [Google Scholar]
- Rodríguez, P.; Duque, N.; Ovalle, D.A. Multi-agent system for knowledge-based recommendation of learning objects using metadata clustering. In Highlights of Practical Applications of Agents, Multi-Agent Systems, and Sustainability—The PAAMS Collection; Bajo, J., Hallenborg, K., Pawlewski, P., Botti, V., Sánchez-Pi, N., Méndez, N.D.D., Lopes, F., Julian, V., Eds.; Springer: Cham, Switzerland, 2015; Volume 524, pp. 356–364. [Google Scholar]
- Zhou, Q.; Mu, C.; Yang, D. Research Progress on Educational Data Mining: A Survey. J. Softw. 2015, 26, 3026–3042. [Google Scholar]
- Dutt, A.; Ismail, M.A.; Herawan, T. A systematic review on educational data mining. IEEE Access 2017, 5, 15991–16005. [Google Scholar] [CrossRef]
- Peña-Ayala, A. Educational data mining: A survey and a data mining-based analysis of recent works. Expert Syst. Appl. 2014, 41, 1432–1462. [Google Scholar] [CrossRef]
- van der Sluis, F.; Ginn, J.; van der Zee, T. Explaining student behavior at scale: The influence of videos complexity on student dwelling time. In Proceedings of the Third (2016) ACM Conference on Learning @ Scale; ACM: Edinburgh, UK, 2016; pp. 51–60. [Google Scholar]
- Li, N.; Kidziński, Ł.; Jermann, P.; Dillenbourg, P. MOOC videos interaction patterns: What do they tell us? In Design for Teaching and Learning in a Networked World; Conole, G., Klobučar, T., Rensing, C., Konert, J., Lavoué, E., Eds.; Springer: Cham, Switzerland, 2015; Volume 9307, pp. 197–210. [Google Scholar]
- Ye, H.Z.; Cheng, Q.J.; Huang, H.T. Using the K-means Algorithm-Based Method to Screen High-quality Online Resources. Distance Educ. China 2014, 34, 62–66. [Google Scholar]
- Niemann, K.; Schmitz, H.C.; Kirschenmann, U.; Wolpers, M.; Schmidt, A.; Krones, T. Cluestering by usage: Higher order co-occurrences of learning objects. In Proceedings of the 2nd International Conference on Learning Analytics and Knowledge; ACM: Vancouver, BC, Canada, 2012; pp. 238–247. [Google Scholar]
- Niemann, K.; Wolpers, M. Usage-based clustering of learning resources to improve recommendations. In Open Learning and Teaching in Educational Communities; Rensing, C., de Freitas, S., Ley, T., Muñoz-Merino, P.J., Eds.; Springer: Cham, Switzerland, 2014; Volume 8719, pp. 317–330. [Google Scholar]
- Jiang, Q.; Zhao, W.; Li, S.; Wang, P.J. Research on the Mining of Precise Personalized Learning Path in Age of Big Data: Analysis of Group Learning Behaviors Based on AprioriAll. e-Educ. Res. 2018, 39, 45–52. [Google Scholar]
- Bogarín, A.; Cerezo, R.; Romero, C. A survey on educational process mining. Wiley Interdiscip. Rev. Data Min. Knowl. Discov. 2018, 8, 1–17. [Google Scholar] [CrossRef] [Green Version]
- Liu, C.; Duan, H.; Zeng, Q.; Zhou, M.; Lu, F.; Cheng, J. Towards comprehensive support for privacy preservation cross-organization business process mining. IEEE Trans. Serv. Comput. 2019, 12, 639–653. [Google Scholar] [CrossRef]
- Liu, C. Automatic Discovery of Behavioral Models from Software Execution Data. IEEE Trans. Autom. Sci. Eng. 2018, 2018 15, 1897–1908. [Google Scholar] [CrossRef]
- Liu, C.; Pei, P.; Duan, H.; Zeng, Q. LogRank: An Approach to Sample Business Process Event Log for Efficient Discovery. In 11th International Conference on Knowledge Science, Engineering, and Management (KSEM 2018); Springer: Cham, Switzerland, 2018; pp. 415–425. [Google Scholar]
- Liu, C.; Zhang, J.; Li, G.; Gao, S.; Zeng, Q. A Two-Layered Framework to Discover Software Behavior: A Case Study. IEICE Trans. Inf. Syst. 2018, E101-D, 2005–2014. [Google Scholar] [CrossRef] [Green Version]
- Zeng, Q.; Sun, S.X.; Duan, H.; Liu, C.; Wang, H. Cross-organizational Collaborative Workflow Mining from a Multi-source log. Decis. Support Syst. 2013, 54, 1280–1301. [Google Scholar] [CrossRef]
- Liu, C.; Wang, S.; Gao, S.; Zhang, F.; Cheng, J. User Behavior Discovery from Low-level Software Execution Logs. IEEJ Trans. Electr. Electron. Eng. 2018, 13, 1624–1632. [Google Scholar] [CrossRef]
- Wasik, S.; Antczak, M.; Badura, J.; Laskowski, A.; Sternal, T. A survey on online judge systems and their applications. ACM Comput. Surv. (CSUR) 2018, 51, 1–34. [Google Scholar] [CrossRef] [Green Version]
- Xue, L.M.; Luan, W.X. Application of clustering algorithm in university network user behavior analysis. Mod. Electron. Tech. 2016, 39, 29–32. [Google Scholar]
- You, Z.X.; Qian, X.L.; Wang, Z.X. Clustering Research on MOOC Hot Topics Abroad. e-Educ. Res. 2015, 36, 38–44. [Google Scholar]
- Mekhala. Review Paper on Process Mining. Int. J. Eng. Tech. 2015, 1, 11–17. [Google Scholar]
- Ayutaya, N.S.N.; Palungsuntikul, P.; Premchaiswadi, W. Heuristic mining: Adaptive process simplification in education. In Proceedings of the 2012 Tenth International Conference on ICT and Knowledge Engineering, Bangkok, Thailand, 21–23 November 2012; pp. 221–227. [Google Scholar]
- Vázquez-Barreiros, B.; Mucientes, M.; Lama, M. ProDiGen: Mining complete, precise and minimal structure process models with a genetic algorithm. Inf. Sci. 2015, 294, 315–333. [Google Scholar] [CrossRef]
- Günther, C.W.; van der Aalst, W.M.P. Fuzzy mining—Adaptive process simplification based on multi-perspective metrics. In Business Process Management; Alonso, G., Dadam, P., Rosemann, M., Eds.; Springer: Heidelberg/Berlin, Germany, 2007; Volume 4714, pp. 328–343. [Google Scholar]
Figure 1.
MOOC (Massive Open Online Courses) video personalized classification framework.

Figure 2.
An example of Video Learning Behavior Process (VLBP).

Figure 3.
VLBP model mining based on process mining.

Figure 4.
An example of a self-loop structure.

Figure 5.
An example of a short-loop structure.

Figure 6.
An example of a long-loop structure.

Figure 7.
An example of a skip structure.

Figure 8.
A VLBP example.

Figure 9.
The VLBP model segment of the student cluster at “high” knowledge level.

Figure 10.
(a) The number of videos with different difficulty in three student clusters and (b) the number of videos with different importance in three student clusters.
Figure 10.
(a) The number of videos with different difficulty in three student clusters and (b) the number of videos with different importance in three student clusters.

Figure 11.
Average accuracy result.


Table 1.
Model structures, video difficulty, and importance in Figure 8.
Table 1.
Model structures, video difficulty, and importance in Figure 8.
| Video Name | Whether it Appears | Self-Loop | Short-Loop | Long-Loop | Skip | Difficulty | Importance |
|---|---|---|---|---|---|---|---|
| v1 | 1 | Self-Loop1 | 2 | 2 | |||
| v2 | 1 | Short-Loop1 | 2 | 2 | |||
| v3 | 1 | Short-Loop1 | 2 | 2 | |||
| v4 | 1 | Long-Loop1 | 1 | 2 | |||
| v5 | 1 | Long-Loop1 | 1 | 2 | |||
| v6 | 1 | Short-Loop2 | Long-Loop1 | 2 | 3 | ||
| v7 | 1 | Short-Loop2 | Long-Loop1 | 2 | 3 | ||
| v8 | 1 | Long-Loop1 | 1 | 2 | |||
| v9 | 1 | Long-Loop1 | 1 | 2 | |||
| v10 | 1 | 1 | 1 | ||||
| v11 | 1 | Skip1 | 1 | 0 | |||
| v12 | 1 | 1 | 1 | ||||
| v13 | 0 |
Table 2.
MOOC video classification results in Figure 8.
Table 2.
MOOC video classification results in Figure 8.
| classify by difficult | classification 1 (D = 1) | classification 2 (D = 2) | ||
| v4, v5, v8, v9, v10, v11, v12 | v1, v2, v3, v6, v7 | |||
| classify by importance | classification 1 (I = 0) | classification 2 (I = 1) | classification 3 (I = 2) | classification 4 (I = 3) |
| v11 | v10, v12 | v1, v2, v3, v4, v5, v8, v9 | v6, v7 | |
Table 3.
Clustering result.
| Cluster | Number of Students | Correct Number of Answered Questions | Correct Rate of Answered Questions | Knowledge Level |
|---|---|---|---|---|
| 1 | 12 | 16.0833 | 0.5092 | High |
| 2 | 56 | 11.3214 | 0.4818 | Middle |
| 3 | 26 | 8.8077 | 0.3058 | Low |
| 4 | 2 | 2.5 | 0.875 | Poor |
| overall mean | 96 | 11.0521 | 0.4457 |
Table 4.
Model structure and the difficulty and importance values for the students at “high” knowledge level.
Table 4.
Model structure and the difficulty and importance values for the students at “high” knowledge level.
| Video Name | Whether It Appears | Self-Loop | Short-Loop | Long-Loop | Skip | D | I |
|---|---|---|---|---|---|---|---|
| 1.1 JDK installation | 1 | Short-Loop1 | 2 | 2 | |||
| 1.2 Path configuration | 1 | Short-Loop1 | 2 | 2 | |||
| 1.3 JAVA_HOME environment variable configuration | 1 | Short-Loop1 | 2 | 2 | |||
| 1.4 classpath environment variable configuration | 1 | 1 | 1 |
Table 5.
Video classification result of student cluster with “high” knowledge level.
| classify by difficult | classification1 (D = 1) | classification2 (D = 2) | |
| v4, v5, v6, v7, v8, v9, v10, v11, v12, v13, v14, v15, v17, v18, v19, v20, v21, v22, v23, v24, v25, v26, v27, v28, v29, v30, v31, v32, v33, v34, v39, v40 | v1, v2, v3, v16, v35, v36, v37, v38 | ||
| classify by importance | classification1 (I = 1) | classification2 (I = 2) | classification3 (I = 3) |
| v4, v17, v19, v20, v21, v22, v23, v24, v25 | v1, v2, v3, v5, v6, v7, v8, v9, v10, v11, v12, v13, v14, v15, v16, v18, v26, v27, v28, v29, v30, v31, v32, v33, v34, v39, v40 | v35, v36, v37, v38 | |
© 2020 by the authors. Licensee MDPI, Basel, Switzerland. This article is an open access article distributed under the terms and conditions of the Creative Commons Attribution (CC BY) license (http://creativecommons.org/licenses/by/4.0/).
Share and Cite
MDPI and ACS Style
Zhang, F.; Liu, D.; Liu, C. MOOC Video Personalized Classification Based on Cluster Analysis and Process Mining. Sustainability 2020, 12, 3066. https://0-doi-org.brum.beds.ac.uk/10.3390/su12073066
AMA Style
Zhang F, Liu D, Liu C. MOOC Video Personalized Classification Based on Cluster Analysis and Process Mining. Sustainability. 2020; 12(7):3066. https://0-doi-org.brum.beds.ac.uk/10.3390/su12073066
Chicago/Turabian StyleZhang, Feng, Di Liu, and Cong Liu. 2020. "MOOC Video Personalized Classification Based on Cluster Analysis and Process Mining" Sustainability 12, no. 7: 3066. https://0-doi-org.brum.beds.ac.uk/10.3390/su12073066
Note that from the first issue of 2016, this journal uses article numbers instead of page numbers. See further details here.