Article

Evaluation of the Importance of Some East Asian Tree Species for Refinement of Air Quality by Estimating Air Pollution Tolerance Index, Anticipated Performance Index, and Air Pollutant Uptake

1
Department of Environmental Horticulture, University of Seoul, Seoul 02504, Korea
2
Urban Forests Research Center, National Institute of Forest Science, Seoul 02455, Korea
*
Author to whom correspondence should be addressed.
Sustainability 2020, 12(7), 3067; https://0-doi-org.brum.beds.ac.uk/10.3390/su12073067
Submission received: 13 March 2020 / Revised: 8 April 2020 / Accepted: 8 April 2020 / Published: 10 April 2020
(This article belongs to the Special Issue Climate Change and Air Pollution Impacts on Forests)

Abstract

:
Potentials of tree species as biofilters depend on appropriate selection based on their tolerance to air pollution, which is usually evaluated by the air pollution tolerance index (APTI) and anticipated performance index (API). Thus, these index values need as a means of scientific understanding to assess the role of urban trees for better greenspace planning/management to mitigate impacts of gaseous air pollution such as ozone (O3) and sulfur dioxide (SO2). O3 exposure to Chionanthus retusus, Pinus densiflora, and Ginkgo biloba showed higher stomatal O3 flux than the others, finally resulting in both favoring stomatal movement and maintaining carbon fixation. In contrast, despite the whole tree enhanced SO2 uptake under excess SO2 exposure, the carbon assimilation capacity was only found in Taxus cuspidata and Zelkova serrata as a consequence of no stomatal sluggishness. On the basis of API, P. densiflora and Prunus × yedoensis were good performers for developing greenspace, while Z. serrata and G. biloba were moderate performers; however, C. retusus and T. cuspidata were estimated to be poor and very poor performers, respectively, for reducing the air quality injury caused by air pollutants. The present study suggests that an integration of both APTI and API based on stomatal absorption flux is needed for selecting sound tree-species in greenspace planning/construction to control gaseous air pollutions.

1. Introduction

Over the last few decades, many studies have focused on the ongoing global trend of relatively fast and steady urbanization [1,2,3,4,5]. Sustainable and healthy urban environments are increasingly important for human well-being, including human health, ecosystems, climate, and visibility [6]. Air pollution is an intractable global problem that affects human and ecosystem health, plant vitality, meteorological conditions, atmospheric quality, and more. The most common air pollutants include carbon monoxide (CO), nitrogen dioxide (NO2), ozone (O3), sulfur dioxide (SO2), and particulate matter (PM10 and PM2.5). Overall, trees are able to remove a significant amount of pollutants by the adsorption of airborne particulates on leaf surfaces and the absorption of gaseous pollutants through leaf stomata [7,8]. Therefore, urban trees can contribute to improving human well-being through natural purification of air pollutants and particulate matter [9]. Because of this, urban greenspace plays an important role in cities, and the selection of tolerant tree species is essential to reform air quality in urban greenspace planning [10,11]. Overall, the findings of the studies mentioned above have suggested less of a causal relationship between exposure to air pollution and health outcomes in areas with more green space, although several recent studies revealed no significant correlations [12,13].
In previous studies, the potential of urban and suburban forests to remove harmful pollutants from the atmosphere has been quantified in many cities in Europe [14,15]. Air pollution removal by trees is recognized as an economic component of the pollution reduction strategy in global urbanization areas [16,17,18]. Gaseous air pollutants are partially removed from leaf surfaces but mainly reduced by air pollutant uptake through stomata [19,20]. Harmful gas pollutants may be dissolved by the moisture film on wettable leaf surfaces. In the case of non-wettable leaf surfaces, gas pollutants are primarily taken up through leaf stomata and may react in leaf mesophyll cells [19], ultimately leading to reactive oxygen species (ROS) generation [21,22,23,24]. The nature and effects of air pollutant abatement studies usually depend on the plant’s resistance or sensitivity to air pollution [25]. Plant response to air pollution at physiological and biochemical levels can be understood by analyzing factors that determine tolerance and sensitivity. Previous studies have identified an ideal species for the development of urban forests based on the air pollution tolerance index (APTI) and the anticipated performance index (API) to estimate tolerant plant species with the greatest possibility for reducing the injury caused by air pollutants. These two measurements can be applied in various tree species for developing green space anywhere in the world [26,27,28]. The APTI provides a reliable method for estimating the susceptibility level of tree species as the biofilter performance for managing ambient air quality in an urban area. Also, tolerance level of trees to air pollutants is specific to a site and varies with the type and level of air pollution [29]. The APTI value uses distinct biochemical parameters such as ascorbic acid, total chlorophyll, relative water content, and leaf extract pH that collectively reflect stress indicators [27,29,30,31].
As mentioned previously, air pollution mitigation potential by urban trees occurs mainly due to precipitation into leaf surfaces and/or stomata. Adsorption refers to the deposition of solid particulates in the atmosphere onto plant surfaces such as leaves or bark, and absorption indicates biofiltration by chemical reactions of plants with reactive air pollutants such as O3 and SO2 [32]. Air pollution reduction potential depends on physio-biochemical characteristics and antioxidative defense systems of plants [29,33,34], so it is necessary to improve air quality by selecting suitable species. However, in Korea, there is insufficient information available from APTI and API assessment in selecting appropriate trees to ameliorate air pollution. Furthermore, the relative magnitude of the benefit and value of urban trees on air quality and human health in Korea remains unknown. Through tree-based air pollution removal and other ecosystem services, urban trees are positively correlated with air quality improvement and consequently human health, but high canopy-covered areas are not necessarily positively related to air pollution reduction [16]. Currently, issues such as selecting the best species for a particular environment for air quality improvement complicate the process of green planning. Therefore, consideration of suitable urban trees is important to high-quality green infrastructure. In addition, there is an urgent need for basic data on the use of urban trees to improve air quality by understanding the interaction between trees and air pollutants. In the present study, we quantified the stomatal uptake of gaseous pollutants and estimated its specific tolerance on interactions between air pollutants and major urban trees.

2. Materials and Methods

2.1. Experiment Site and Plant Materials

Six major street tree species in Seoul were selected based on street tree statistics of the Seoul Open Data Plaza [35], and these urban tree species were tested to assess their absorption capacity to gaseous air pollutants. This research was carried out to study the possibility of significantly reducing urban air pollution based on physio-biochemical responses using chamber exposure experiments under controlled conditions for the following species: Taxus cuspidata Siebold & Zucc., Pinus densiflora Siebold & Zucc., Ginkgo biloba L., Chionanthus retusus Lindl. & Paxton, Prunus × yedoensis Matsum., and Zelkova serrata (Thunb.) Makino. Prior to experimental procedures, 20 individuals of two-year-old tree saplings with similar height and basal diameter were transplanted to 4-L plastic pots containing a commercial growth medium (Nong Kyung Co., Jincheon, Korea), followed by the four-week acclimation process, and then conducted a study over a period of three months. For each gas exposure, 10 individuals of each tree species were selected and divided by five into control or treatment group. All physiological parameters and stomatal uptake were measured from 12 and 15 leaves for O3 and SO2, respectively, using the third to fifth fully expanded leaves from the top of each plant for each treatment. For analyses of total chlorophyll content (TChl) and relative water content (RWC) at the end of each gas exposure experiment, leaf samples of each species were randomly detached from twigs, put into plastic bags, placed in an icebox, and then transported immediately to a laboratory. In addition, further leaf samples from each species were immediately packed in aluminum foil to avoid contamination, frozen in liquid nitrogen, and kept in a deep freezer at −80 °C until analyses of ascorbic acid content (AsA) and leaf extract pH.

2.2. Experimental Design and Growth Conditions

Trees were exposed to ozone (O3) and sulfur dioxide (SO2), the major air pollutants generated in cities, divided into four groups, and treated as follows: (1) Ambient O3 concentration (as control of O3 treatment, OC: 10 nmol mol−1); (2) O3 exposure (elevated O3, OT: 100 nmol mol−1); (3) ambient SO2 concentration (as control of SO2 treatment, SC: 4 nmol mol−1); and (4) SO2 exposure (elevated SO2, ST: 500 nmol mol−1). The exposure period was five to seven weeks for O3 and two to five days for SO2, periods which cause visible damage. The experiment was carried out using a phytotron growth chamber (150 cm × 150 cm × 200 cm; Koito Industries, Yokohama, Japan) linked to a plant environment control system at the University of Seoul. Typical conditions of temperature, relative humidity, and concentration in each chamber were precisely controlled. In the phytotron growth chamber with sunlight and natural day-length, day/night temperature and relative humidity were maintained 25/20 °C and 50–60%, respectively, using a well-controlled air pollution fumigation system.

2.3. Monitoring Physiological Parameters

Leaf gas exchange was measured according to a previously reported method [36] using the LI-6400XT Portable Photosynthesis system (LI-6400XT; Li-Cor Inc., Lincoln, NE, USA) equipped with a leaf cuvette that enables artificial LED Red and Blue light sources (6400-02B; LI-COR Inc., NE, Lincoln, USA). During measurements, conditions inside the LI-6400XT cuvettes were set up to match as follows: The cuvette block temperature was fixed at 25 °C, CO2 concentration was 400 µmol mol−1, photosynthetic photon flux density (PPFD) was 1000 µmol m−2 s−1, and the relative humidity was 50–55%.
P n = U e C e C c 100 s C c E ,
where Pn: Net photosynthetic rate (µmol CO2 m−2 s−1), Ue: Air flow into the leaf chamber (µmol s−1), Ce: Mole fraction of CO2 in the leaf chamber (µmol CO2 mol−1 air), Cc: Molar ratio of CO2 entering the leaf chamber (µmol CO2 mol−1 air), s: Leaf area (cm2), E: Transpiration (mmol H2O m−2 s−1).

2.4. Stomatal Ozone Uptake

O3 uptake through leaf stomata was calculated by dividing leaf conductance by the ratio of the binary diffusivities for water vapor and O3 in air (1.68) and multiplying by the O3 concentration in the chamber at the time of measuring water vapor conductance [36]. The O3 uptake rate, Q, was calculated using the following Equation (2) [37].
Q = z a × g g w / 1.68 ,
where Q: Stomatal O3 uptake (nmol m−2 s−1), za: The ambient O3 concentration in the chamber, ggw: The gas phase conductance to water vapor, 1.68: The ratio of the binary diffusivities for water vapor and O3 in the air.

2.5. Stomatal Sulfur Dioxide Uptake

SO2 uptake rates through leaf stomata were determined by modifying the equation, which was devised by [38]. Total SO2 uptake is the sum of SO2 adsorption rates to exterior leaf features and SO2 absorption rates through leaf stomata. Here, the values of SO2 uptake via stomata (hereafter referred to as SO2 absorption rate) were calculated based on the following Equation (3), assuming that SO2 causes a change in leaf metabolism.
J SO 2 = S 0.531 × L W ,
where J SO 2 : SO2 absorption rate through stomata (nmol m−2 s−1), S: SO2 concentration around the leaf, 0.531: Ratio of SO2 diffusivity to water vapor diffusivity, L W : Stomatal conductance (nmol m−2 s−1).

2.6. Determination of Leaf Microstructural Changes to Air Pollutants

Visible observations were made from the point of time of visible damage. Leaf sample preparation for stomata observation was prepared as previously described [39] and was carried out by freeze-drying for one week on the samples collected from the same leaves used for measuring the photosynthetic function. After one week, the freeze-dried leaves were transferred to the electron microscope lab at the Korea Basic Science Institute (KBSI) and cut into 1-mm sections. These samples were mounted on a metal stub and then coated with platinum using a sputter-coater (SCD 005; BAL-TEC, Balzers, Liechtenstein). Observation of ultra-fine structures of stomata was carried out using a focused ion beam-field emission scanning electron microscopy (FIB-FESEM; Auriga, Carl Zeiss, Oberkochen, Germany).

2.7. Development of Air Pollution Tolerance Index (APTI) and Anticipated Performance Index (API)

Air pollution tolerance index (APTI) was measured to evaluate the trees’ resistance to air pollution. The APTI as an indicator of susceptibility to air pollution was analyzed by biochemical parameters of ascorbic acid content (AsA), leaf extract pH, total chlorophyll content (TChl), and relative water content (RWC). The value of each of these variables was measured by the following Equation (4) [40].
APTI = (A × (T + P) + R)/10,
where A is the AsA (mg·g−1 FW), T is the TChl (mg·g−1 FW), P is the leaf extract pH, and R is the RWC (%).
Based on the resultant APTI values as well as some relevant morphological parameters and socio-economic importance (e.g., plant habit, crown structure, plant type, laminar structure, and economic value), the anticipated performance index (API) was calculated. Grades (+ or −) for these parameters were assigned as shown in Table 1. The API value was calculated for each tree species based on percentage score (Table 2). The percentage score was evaluated using the following Equation (5):
Percentage   score = Grades   obtained   by   tree   species Maximum   possible   grades   for   any   tree   species × 100 ,
where the maximum possible grade scored for any plant is 16 [26,27,28,29,30,41].

2.8. Statistical Analysis

All data were analyzed using IBM SPSS Statistics 25 (SPSS Inc., IBM Company Headquarters, Chicago, IL, USA), and the data were expressed as mean ± standard deviation. One-way analysis of variance (ANOVA) was used at the p < 0.05 level to analyze the statistically significant differences in each species. Then, ANOVA was performed to identify the differences among the groups and the significance of each group was tested using the Tukey HSD test. The significance of the control and treatment groups for each air pollutant was statistically analyzed using the paired-samples t-test.

3. Results

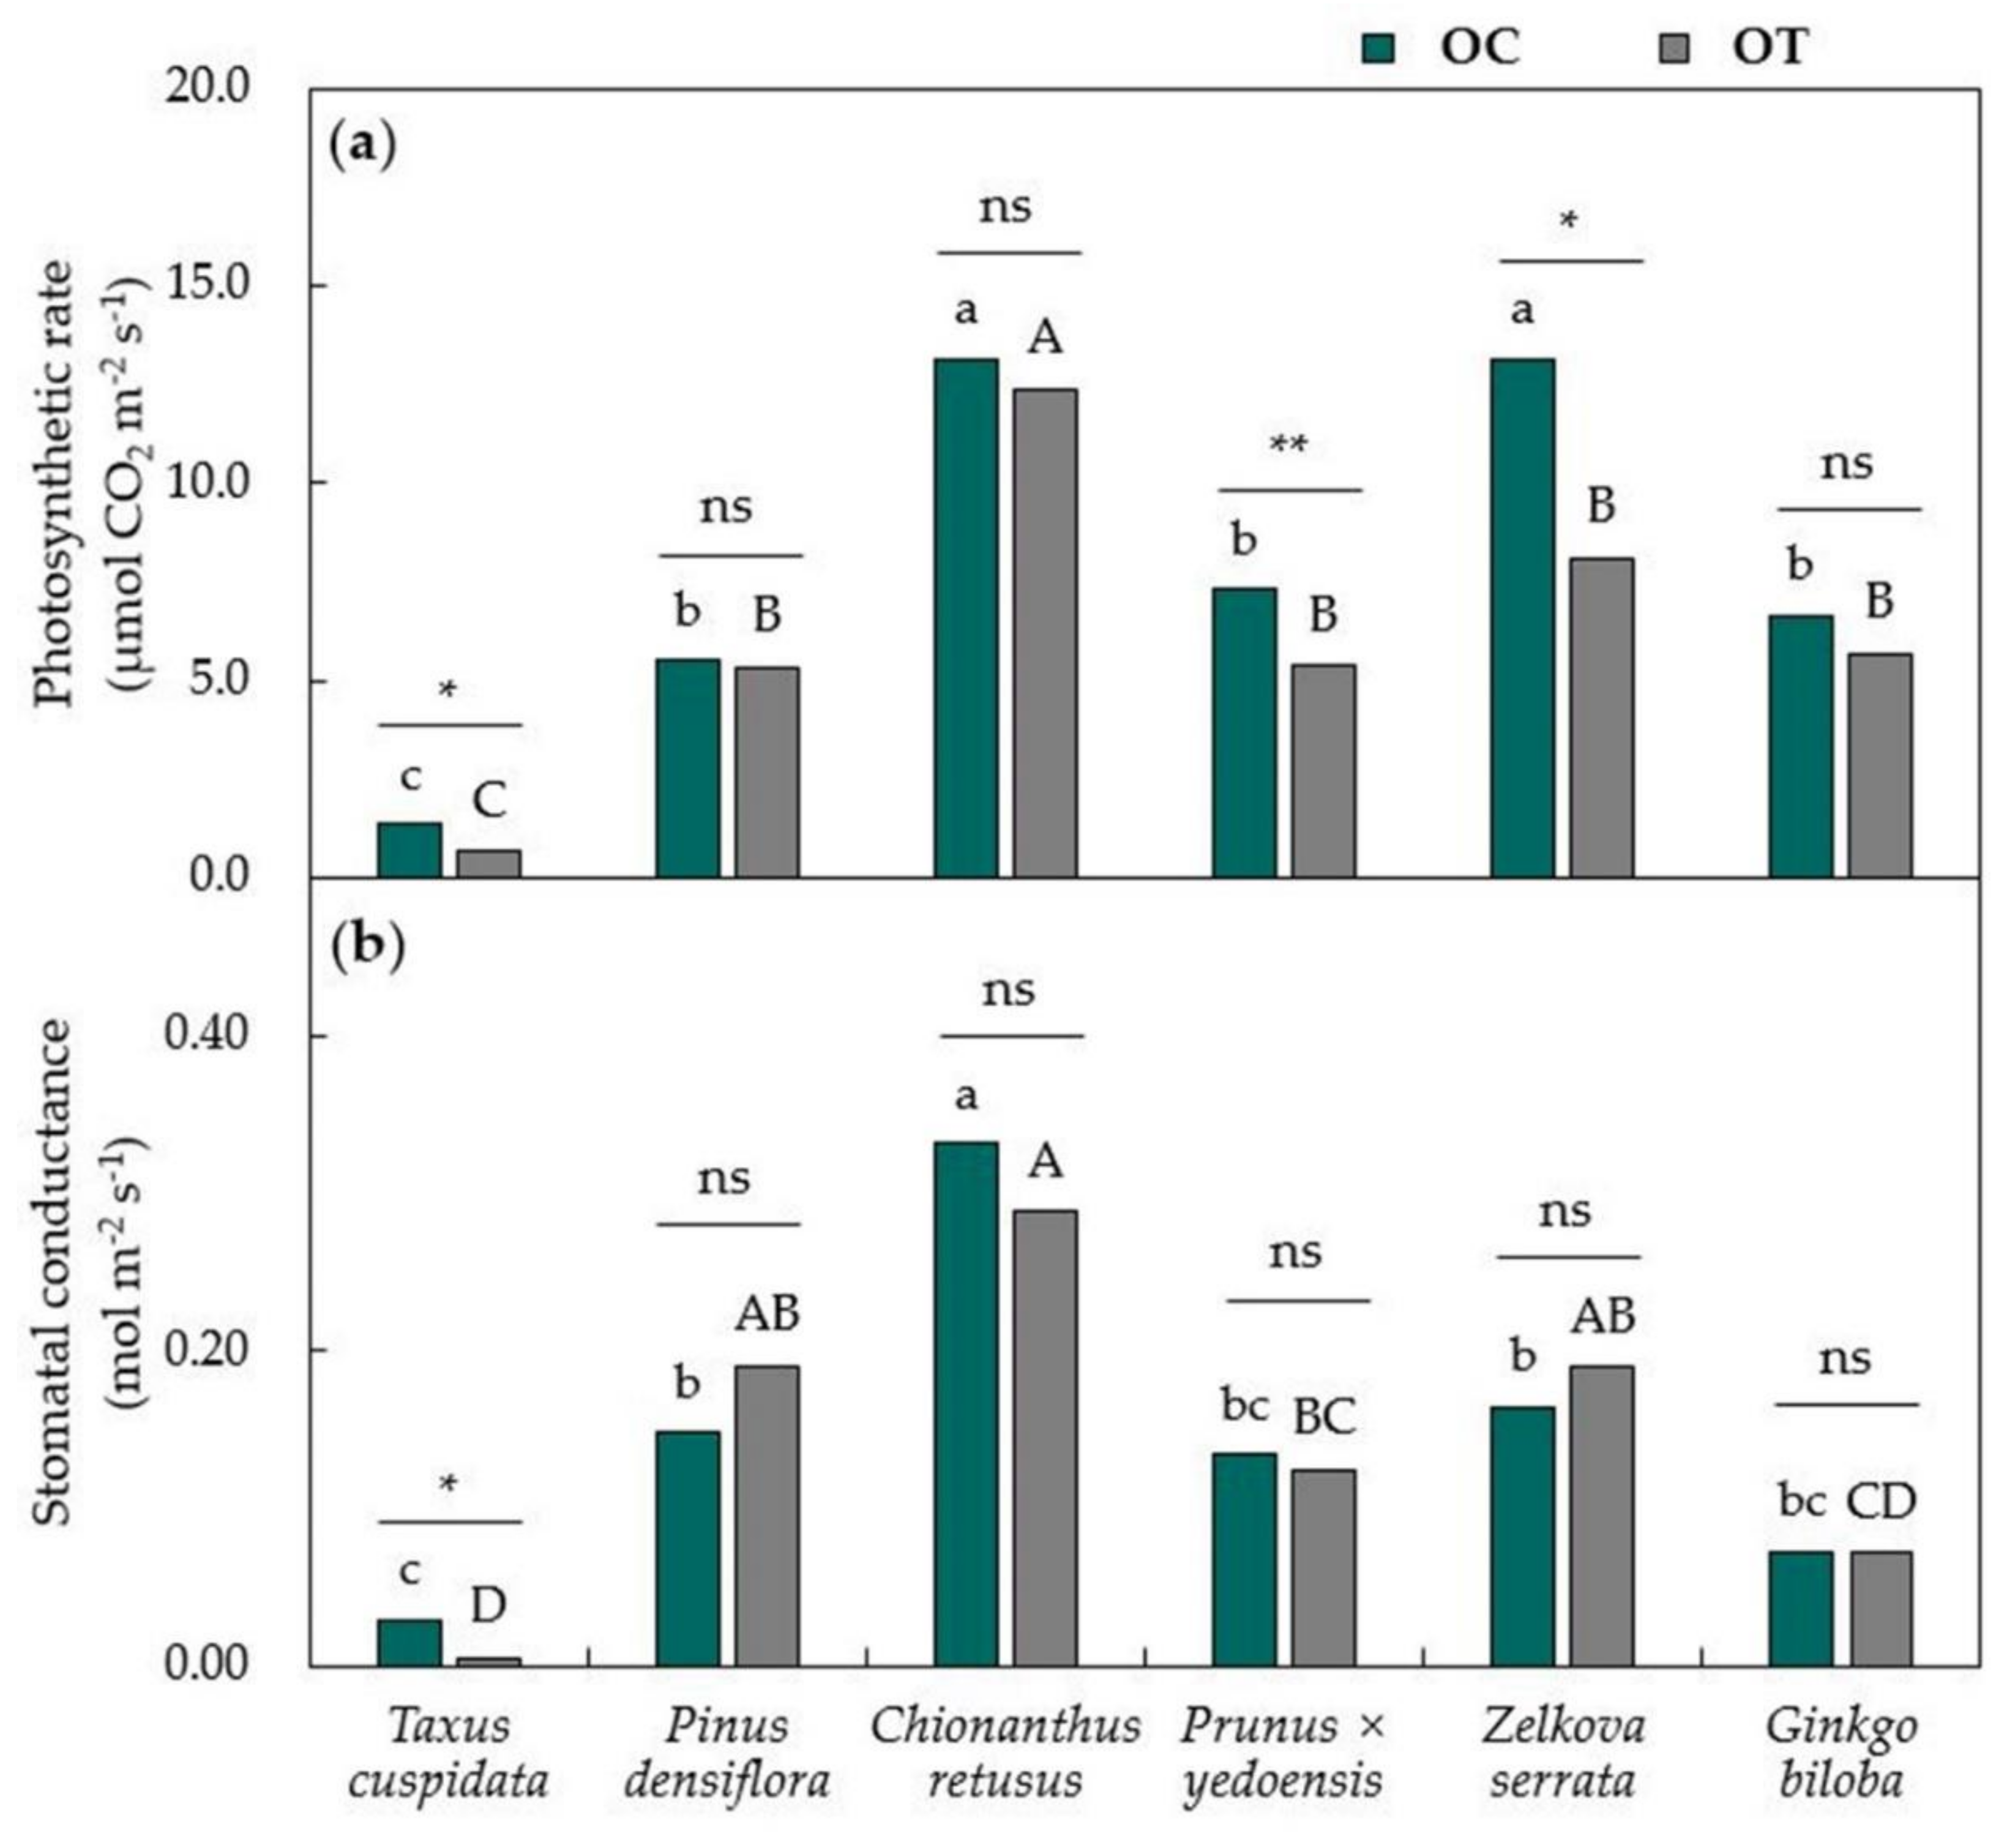
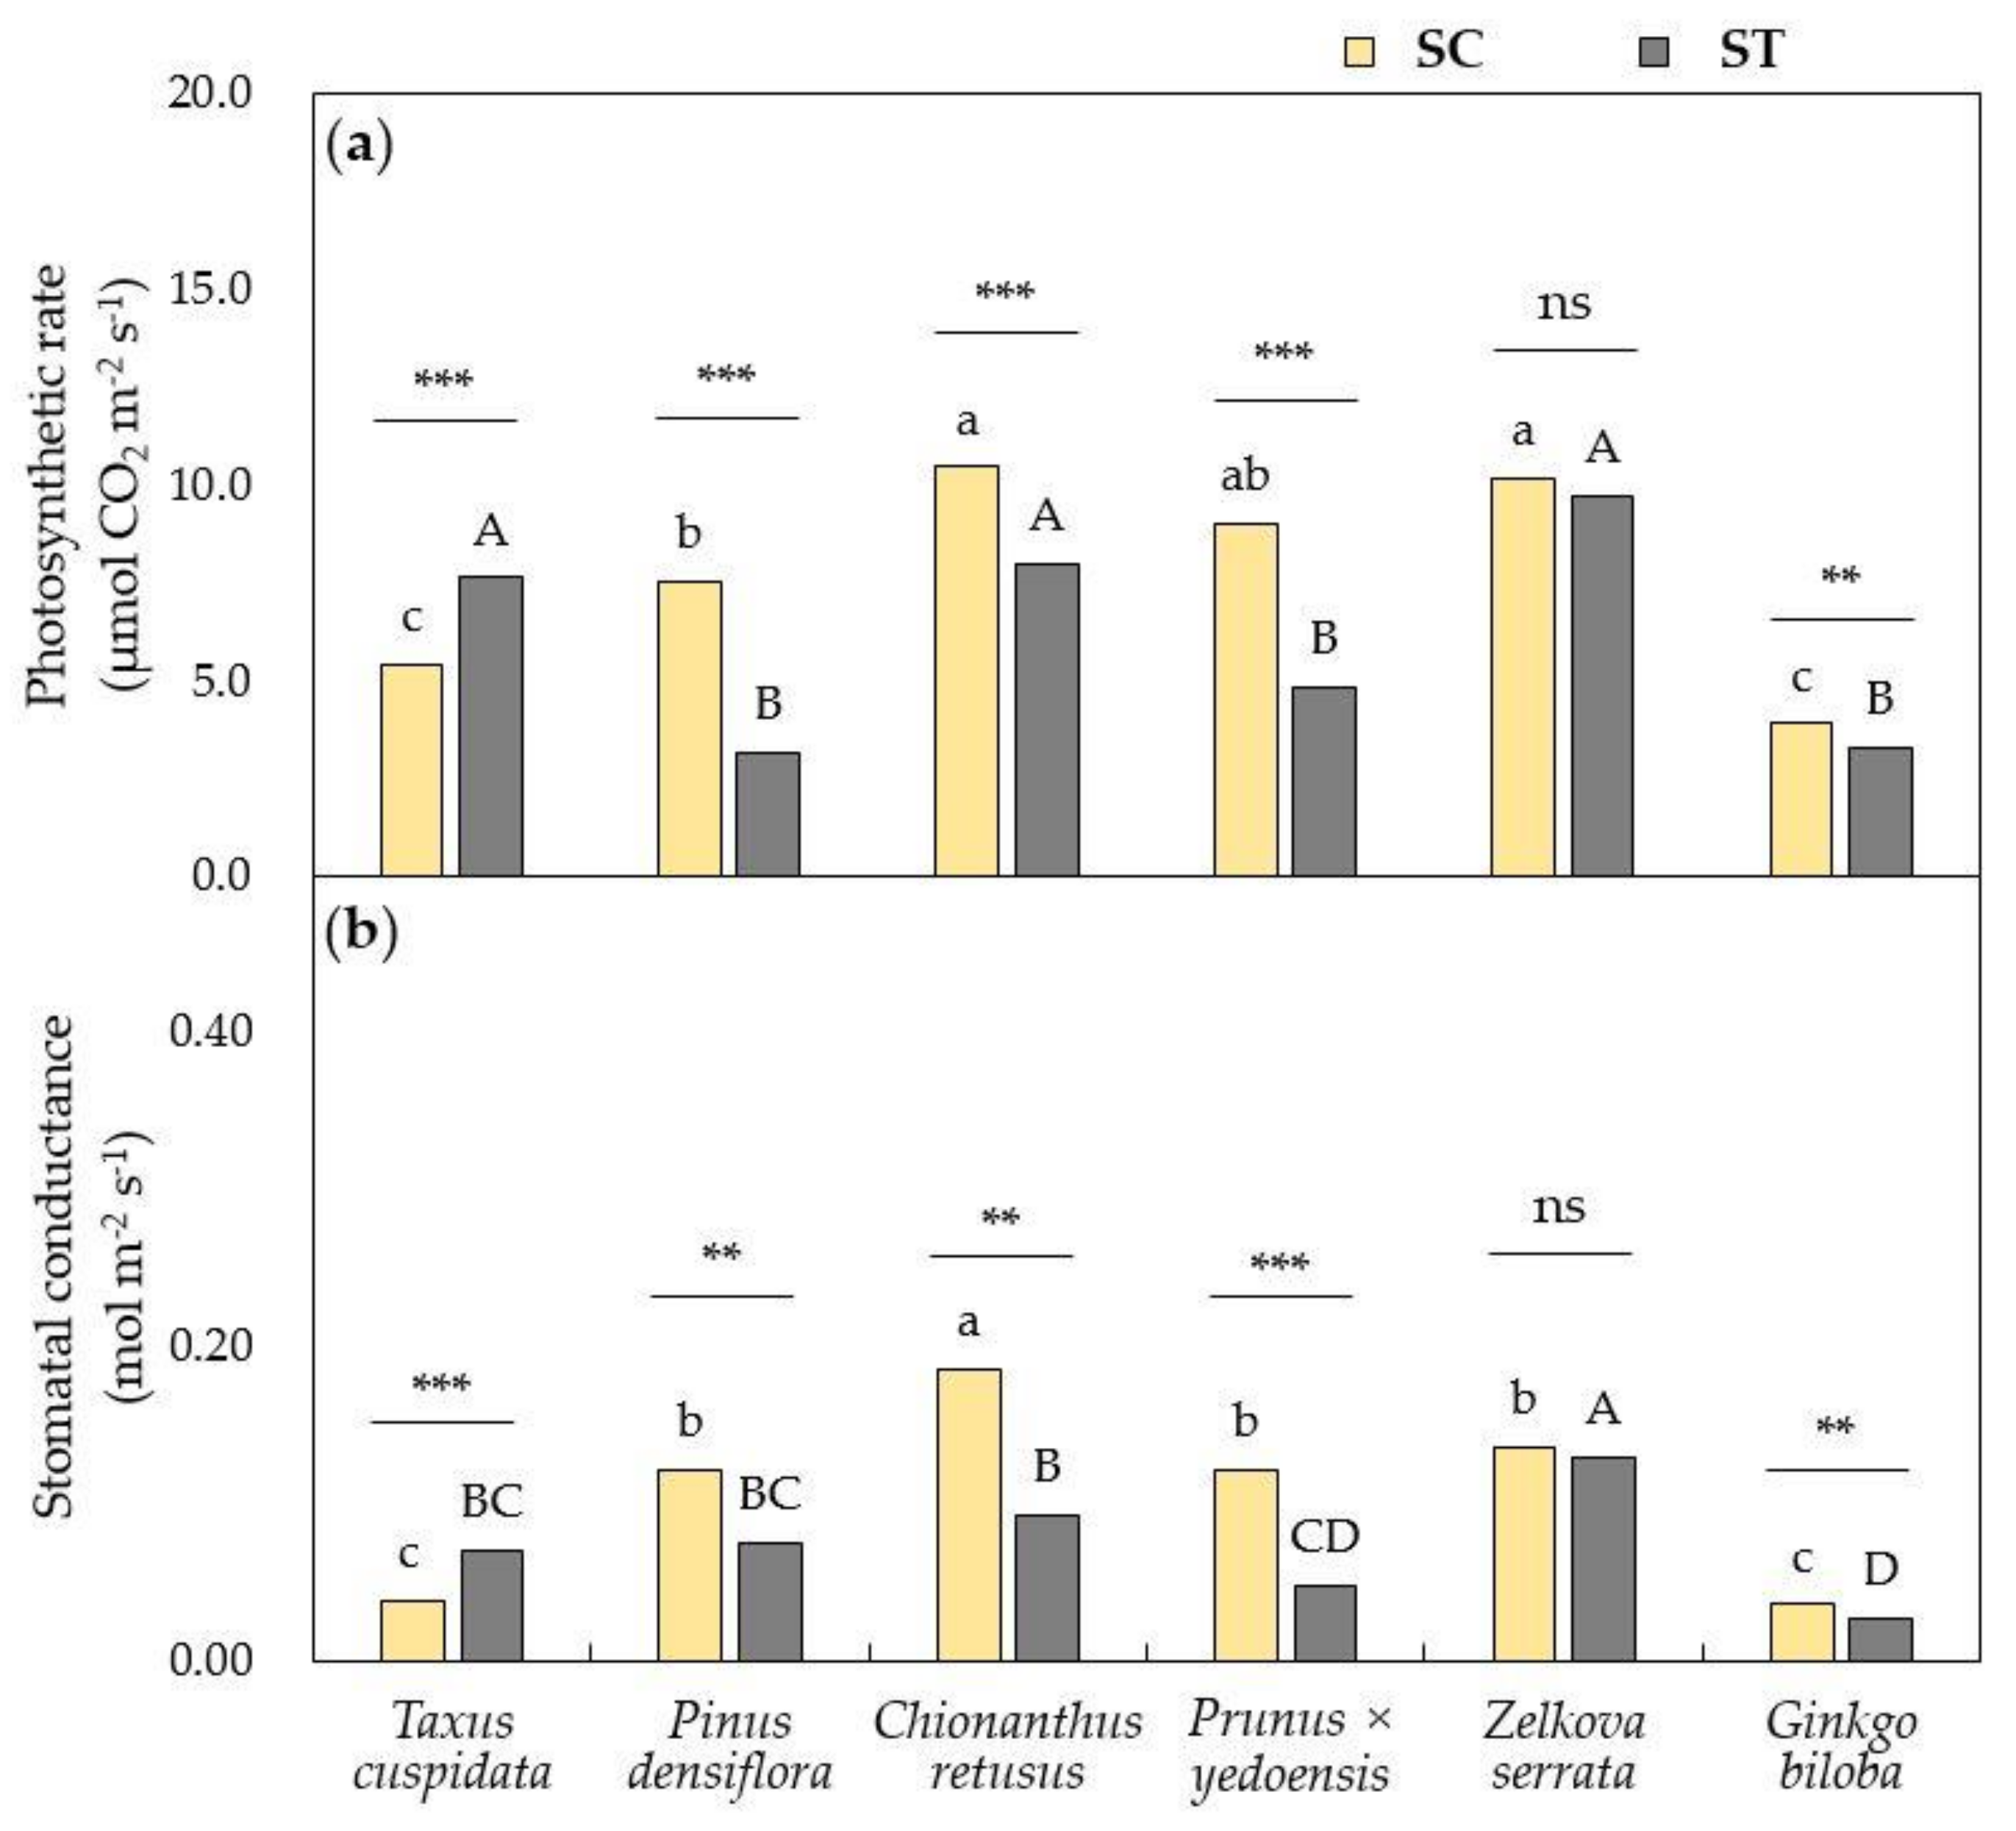
3.1. Physiological Responses of Urban Trees Towards Air Pollutants

In the present study, photosynthesis of ozone (O3) exposed T. cuspidata, P. × yedoensis, and Z. serrata decreased by 50%, 26%, and 38%, respectively, compared with the control after four weeks of O3 exposure. The photosynthetic capacity of P. densiflora, C. retusus, and G. biloba showed no statistically significant difference after O3 treatment compared with the control, which can be explained by normal stomatal opening and maintenance (Figure 1a). After four weeks of O3 exposure, stomatal conductance of T. cuspidata significantly decreased by 79% compared with the control. P. densiflora, C. retusus, P. × yedoensis, Z. serrata, and G. biloba were found to maintain stomatal conductance in O3 treatment compared with control (Figure 1b).
After SO2 exposure to 500 ppb, carbon assimilation in P. densiflora, C. retusus, P. × yedoensis, and G. biloba decreased significantly compared with the control, whereas Z. serrata showed no statistically significant difference (Figure 2a). Leaf photosynthetic traits of P. densiflora and P. × yedoensis were markedly down-regulated by SO2 treatment, by 58% and 46%, respectively, compared with those of control. Stomatal conductance was significantly decreased in P. densiflora, C. retusus, P. × yedoensis, and G. biloba exposed to SO2 compared with the control. Stomatal conductance of Z. serrata showed no statistically significant difference in SO2 treatment compared with the control (Figure 2b). Importantly, T. cuspidata was greater in photosynthetic rate and stomatal conductance than those for control (Figure 2), despite enhanced SO2 absorption flux (except other species).

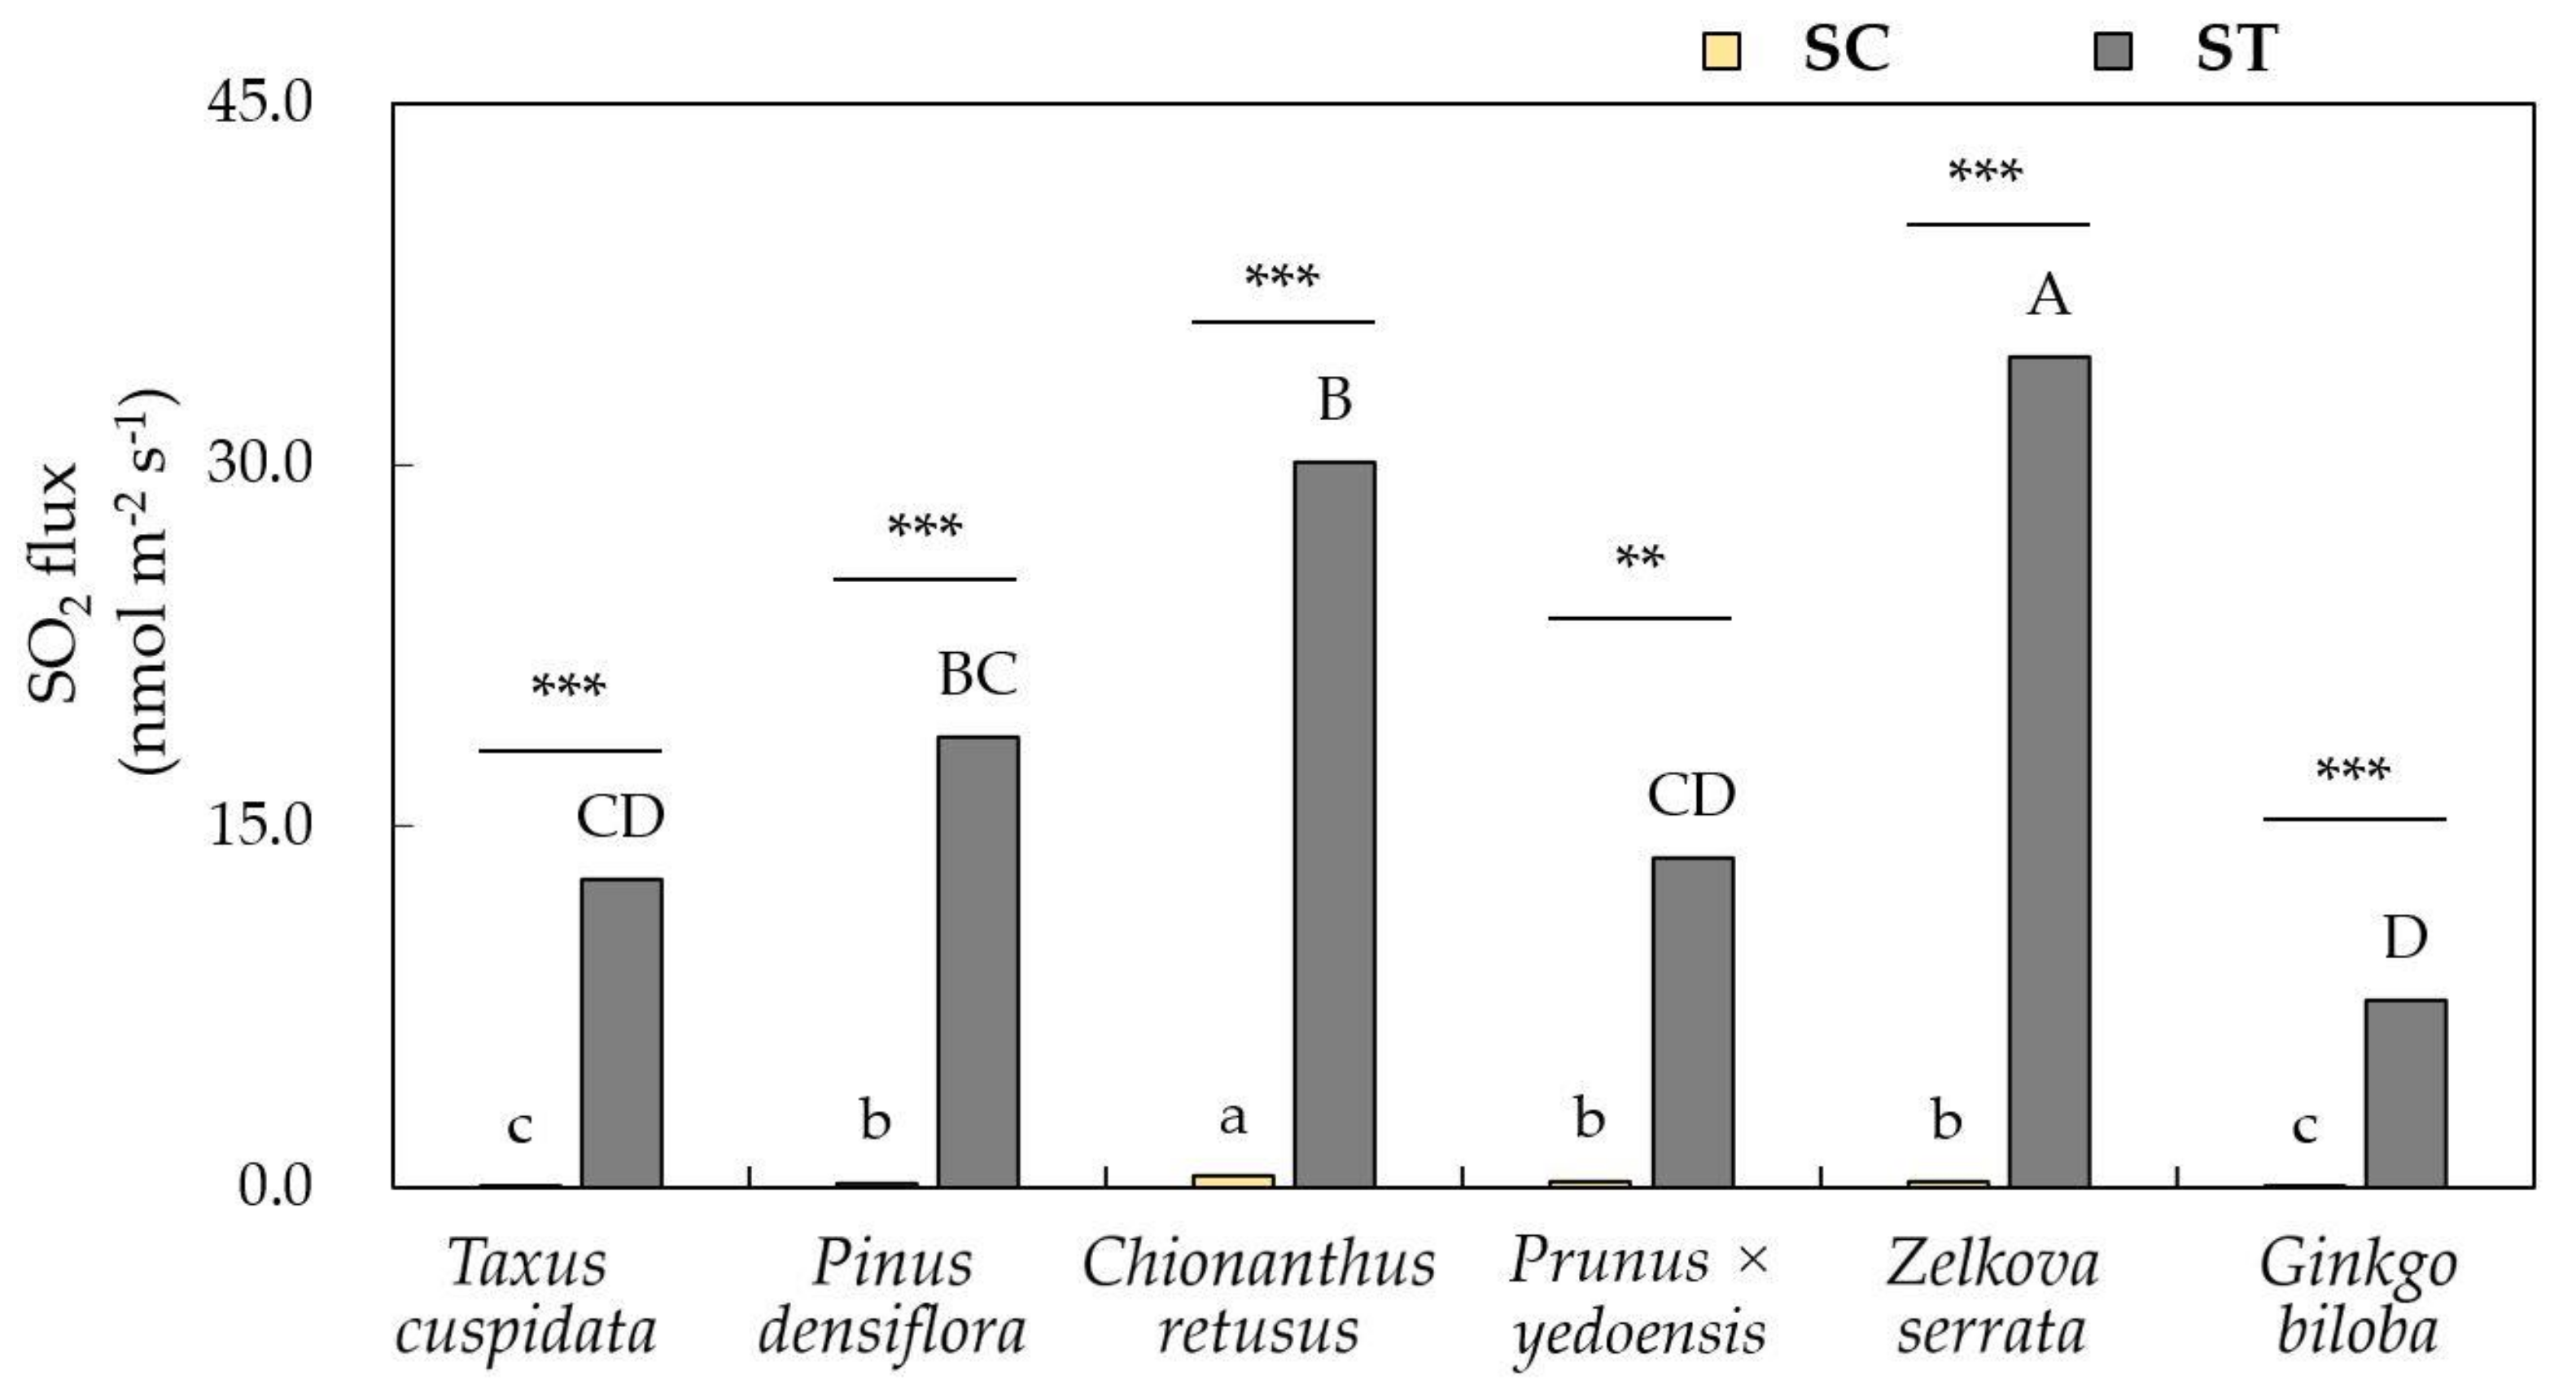
3.2. Leaf Response Towards Removal Efficiency of Air Pollutants

Under the O3 concentration of 100 ppb, values of O3 flux through stomata were higher in C. retusus, P. densiflora, and G. biloba compared with control; however, these species showed maintenance of carbon assimilation ability. O3 flux of T. cuspidata showing stomatal closure had no statistically significant difference under O3 treatment compared with the control (Figure 3). Carbon assimilation and O3 uptake were high in P. densiflora, C. retusus, and G. biloba, but not in T. cuspidata showing O3-induced stomatal closure.
In order to determine differences of SO2 uptake via stomata, dynamics of SO2 flux via stomata were calculated from six species after four days of exposure (Figure 4). Based on SO2 uptake calculated by stomatal conductance, Z. serrata had the highest SO2 absorption (34.5 nmol m−2 s−1), while G. biloba presented the lowest absorption capacity (7.8 nmol m−2 s−1), compared to other species (one-way ANOVA, p < 0.001), C. retusus (30.1 nmol m−2 s−1), P. densiflora (18.7 nmol m−2 s−1), P. × yedoensis (13.7 nmol m−2 s−1), and T. cuspidata (12.8 nmol m−2 s−1). The stomatal SO2 flux of P. × yedoensis showed the lowest increase under SO2 exposure (as compared to other plants), resulting from a drastic decrease in stomatal conductance over a period of a four-day exposure.
The leaves of G. biloba were found to be totally yellowed with pale brown stains after four weeks of O3 exposure. C. retusus and Z. serrata showed black spots between the leaf veins and yellowing at the edges of the leaves. P. × yedoensis had red spots across the leaves (data not shown). In this study, anatomical changes and visible damages were observed in trees exposed to SO2. The leaves of G. biloba were observed to have a yellowing of the leaves due to chlorophyll destruction and the formation of light brown spots. C. retusus and Z. serrata showed browning between the leaf veins and yellowing at the periphery. P. × yedoensis showed browning and yellowing at the periphery of the leaf veins, and the leaves of P. densiflora turned to light green and gray green from the apex, and turned brown as the damage persisted (data not shown).
Leaf stomata unexposed to O3 had a smooth and regular pore rim, a soft, small, uniform wax layer, and sporadic wax crystals. The stomata of leaves exposed to O3 in our study were swollen and had crystals in the amorphous wax layer. In particular, the guard cells severely damaged by O3 were completely destroyed or the wax layer was blocking the stomata. Unlike the data of stomatal conductance (Figure 2), acute exposure to SO2 led to partially observed stomatal closure in Z. serrata, representing a possible mechanism to avoid internal damage by SO2 exposure (Figure 5k). In addition, swollen guard cells and collapsed subsidiary cells adjacent to some stomata were observed in Z. serrata after acute exposure of SO2. Interestingly, Z. serrata was strongly damaged in some trichomes (hair-like epidermal appendages), acting as a protective cover against air pollutants (Figure 5l). Consistent with the observed stomatal conductance in P. × yedoensis, stomata had small pores after SO2 exposure and they virtually closed by guard cells, leaf guard cells were swollen, and subsidiary cells represented the cytoplasmic shrinkage, as compared with the control (Figure 5o,p). Some stomata of P. densiflora were blocked by the wax layer after exposure to SO2 (Figure 5g). Importantly, T. cuspidata exposed to SO2 showed similar stomatal opening and undamaged wax layer compared with the control (Figure 5c,d), therefore resulting in enhanced or at least maintained activities in physiological parameters. G. biloba revealed normal stomatal opening but was found to collapse epicuticular wax layers in excess exposure to SO2 (Figure 5s,t). Interestingly, C. retusus showed some closing response of stomatal apertures, destruction of glandular trichomes, and deformation of non-glandular trichomes under SO2 exposure (Figure 5w,x).

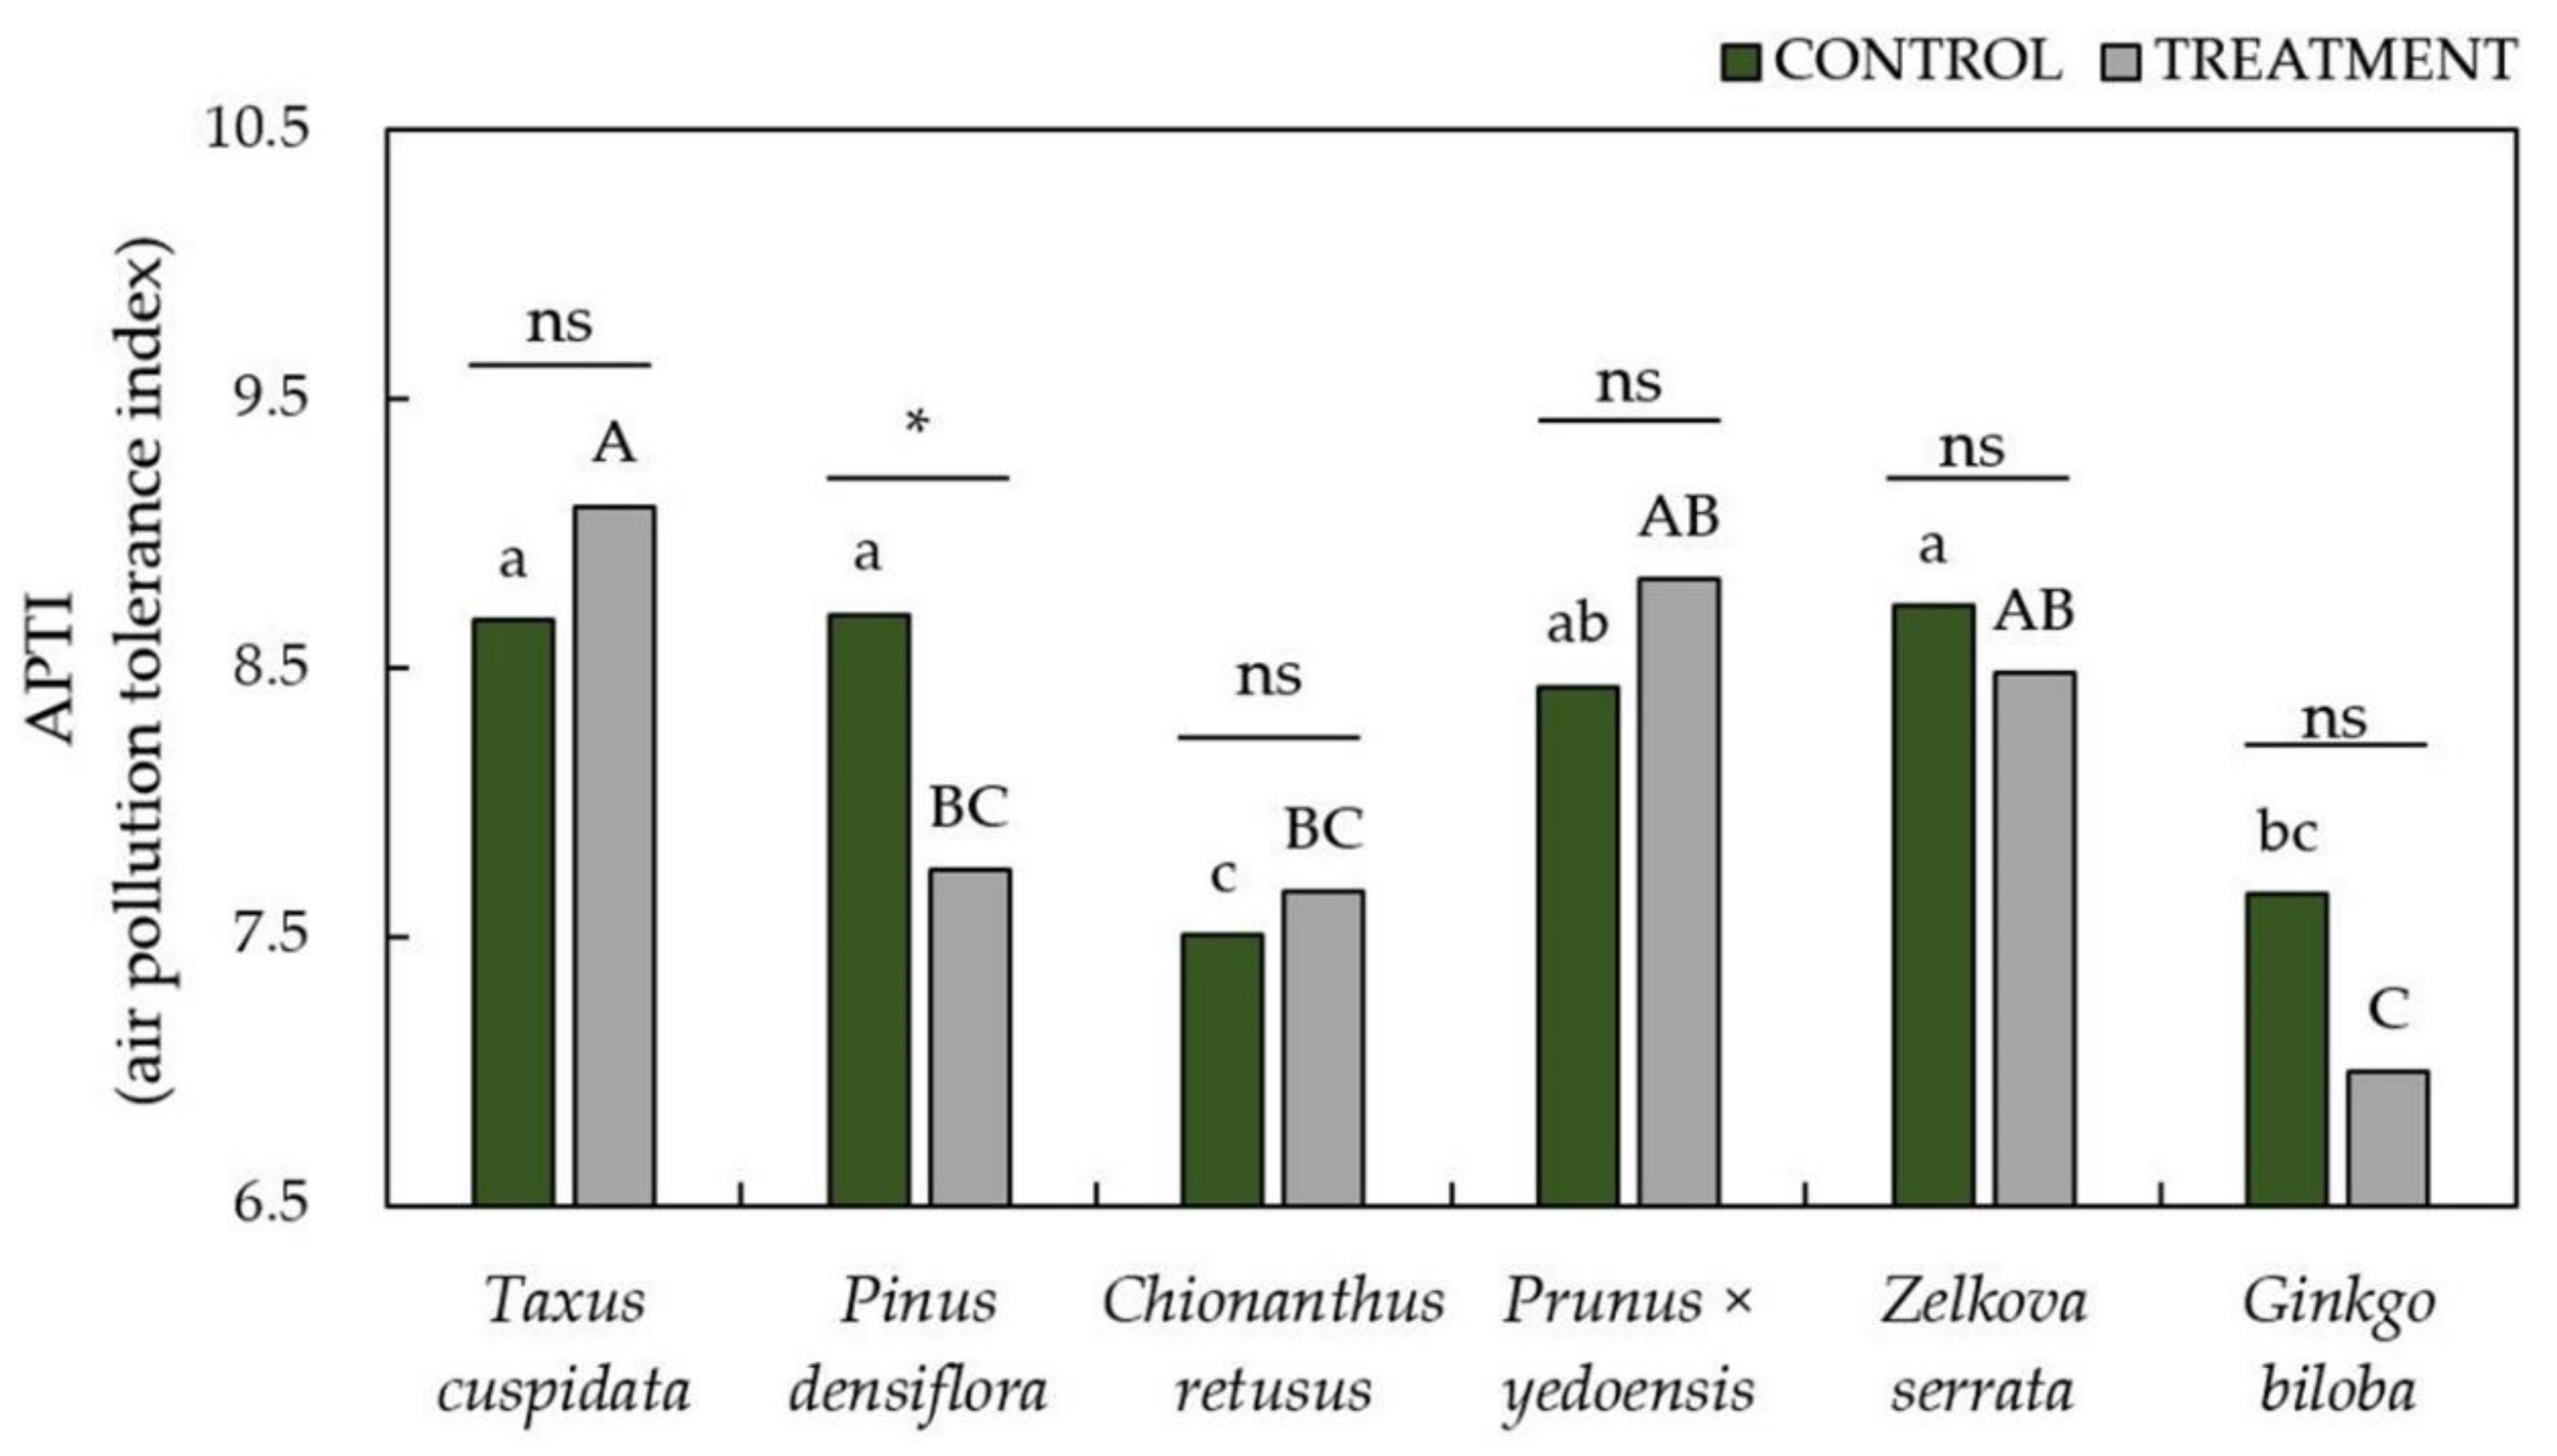
3.3. Evaluation of Air Pollution Tolerance Index (APTI) and Anticipated Performance Index (API) to Air Pollutants

Four important biochemical variables, ascorbic acid content (AsA), relative moisture content (RWC), leaf extract pH, and total chlorophyll (TChl), were analyzed to evaluate the APTI of the six trees (Table 3 and Figure 6). As shown in Table 3, the AsA and pH of these tree species were confirmed to be normally maintained as the control level under air pollution exposure. On the other hand, there were significant variations in the RWC of P. densiflora between unexposed controls and exposed groups to air pollutants. The RWC of P. densiflora was significantly lower by 12% in exposed groups than in unexposed controls, whereas the RWC of P. × yedoensis was significantly higher by 7% in exposed groups. Interestingly, the RWC values of T. cuspidata, C. retusus, Z. serrata, and G. biloba were confirmed to be normally maintained as the control level under the air pollution exposure. The TChl of P. × yedoensis, and Z. serrata to exposure of gaseous air pollution were significantly lower than those of the control group by 33% and 47%, respectively. The TChl of T. cuspidata, P. densiflora, C. retusus, and G. biloba was not statistically significant in the air pollution exposure.
As shown in Figure 6, the air pollution tolerance index (APTI) and anticipated performance index (API) were evaluated along with the efficiency of the absorption of air pollutants. The APTI of P. densiflora to exposure of gaseous air pollutants was significantly lower than those of the control group by 11%. In particular, the APTI of T. cuspidata, C. retusus, P. × yedoensis, and Z. serrata were not statistically significant in air pollution treatment compared with the control (Figure 6). Table 4 presented the obtained results of the grade allotted to urban tree species based on their APTI values and relevant morphobiological parameters, and socio-economic importance. The grade of P. densiflora and P. × yedoensis showed higher values of 62.5% relating to a good performer, while the other four tree species were categorized with grades allotted as follows: Z. serrata (moderate, 56.3%), G. biloba (moderate, 56.3%), C. retusus (poor, 50.0%), and T. cuspidata (very poor, 37.5%).

4. Discussion

Previous studies of elevated air pollutants have demonstrated the genesis of an oxidative burst response as initial events in injury to plants by air pollutants, because plants must cope with the persistent levels of air pollution in natural or ecological contexts [32]. The uptake of ozone (O3) through leaf stomata generates a range of ROS within the apoplast. As ROS exceeds the antioxidant capacity in the apoplast, ROS-induced intracellular oxidative stress accelerates senescence and photosynthetic damage, ultimately reducing productivity and yield [23]. Plants exposed to O3 change stomatal conductance by stomata closure and inefficient stomatal sluggishness [42]; however, C. retusus, P. densiflora, and G. biloba showed the normal function of stomatal movement, therefore maintaining the stomatal conductance and photosynthetic capacity in response to O3 exposure. The functional changes result from a stress response mechanism that blocks their intracellular uptake during O3 exposure. Plants can mitigate secondary damage from O3 by using a stomatal pore-blocking strategy [32]. According to [43], a decrease in photosynthetic damage rate over time in leaves exposed to a constant rise in O3 could be explained by a decrease in stomatal conductance. O3-induced visible lesion formation is induced by hormonal regulation such as ethylene and salicylic acid. In addition, jasmonic acid acts to limit the spread of the lesion. The initiation, propagation, and sequestration processes that determine the formation of ozone lesions after stomatal control, apoplastic antioxidants, and ROS perception can be described as a self-amplifying loop called the oxidative cell death cycle [44]. Yet, although the molecular biological mechanisms causing a plant’s visible damage from O3 are not fully understood, physiological studies suggest that chronic elevations of O3 reduce productivity primarily by decreasing photosynthesis [45].
Exposure to high concentrations of O3 causes visible leaf symptoms in sensitive plants [46] and negative effects on photosynthesis and growth [23]. Plant responses to O3 lead to protein changes by launching gene expression programs as a stress response mechanism prior to the induction of tissue damage. The decomposition of O3 and subsequent accumulation of ROS in the extracellular space activates some signaling due to a finely balanced network of ROS-mediated cellular signaling [47]. Gaseous air pollutants penetrate leaf stomata and reach deep into cell membranes, so stomatal movements are key feedback loops, which is the first defense mechanism via regulating gas fluxes [45,48]. Conversely, environmental conditions that cause higher stomatal conductance than necessary for CO2 absorption can exacerbate damage from O3 absorption in forests. However, trees differ in their ability to detoxify O3 by biochemical reactions that vary with age and ability [49,50].
Sulfur dioxide (SO2) enters plants through the stomata. When stomata are opened to allow the exchange of CO2, O2, and water vapor with the atmosphere, SO2 enters by diffusion because the concentration gradient of SO2 inside the plant is low. High concentrations of SO2 can cause continuous stomatal opening as epidermal cells surrounding the guard cells are damaged by SO2 and no longer provide the structural support required. SO2 also damages the stomatal pore opening mechanism by slowing down the control of stomatal closure. Once SO2 enters the interior of a moist cell, it is converted to sulfite (SO32−) and hydrogen sulfite (HSO3), which are partially oxidized to sulfate (SO42−) [51,52]. Certain amounts of SO2 can be metabolized by plants, but beyond a critical concentration and duration of exposure it causes damage. Sulfur oxides (SOx), which can be converted chemically into strong acids in the atmosphere, denature the membrane-related proteins and phospholipid bilayers within the cell membrane, which are essential for osmotic pressure regulation [53]. In particular, SO2 absorption ability was higher in C. retusus and Z. serrata. Therefore, Z. serrata seems to be resistant to SO2 because there was no significant difference in photosynthesis or air pollution tolerance index (APTI) value after SO2 exposure compared with control. Membrane-related calcium ions, the second most important messenger in signaling to environmental stimuli, stabilize the membrane structure and affect the permeability (especially in conifers). Hydrogen ions of acids, including sulfuric acid, can displace calcium ions in the plasma membrane, thus damaging physiological responses in response to environmental stresses [53]. Closing stomata in the presence of harmful gases is a stress avoidance mechanism for plants [54]. SO2, one of the main air pollutants, has been reported to induce stomatal closure in major species in urban areas.
Based on an ‘integrated theory’ of the effects of O3 on conifers, hardwoods, and crops proposed by a previous study, photosynthetic damage is linearly related to the rate of stomatal O3 flux [55]. Also, O3 flux through leaf stomata is closely related to O3 damage in plants [56]. The overall effect of stomatal absorption of O3 plays an important role in the physiological activity associated with stomatal openness [57]. O3 can directly reduce stomatal conductance, and the decrease in stomatal conductance reduces the ability of photosynthetic carboxylation. If O3 reduces stomatal conductance in forests on a large scale, there may be major effects on local hydrology, surface temperature, and global climate systems. O3 fluxes are closely related to carbon assimilation and can reduce carbon losses by up to 19% in forest ecosystems [58]. A comparison of SO2 flux from the atmosphere to the leaves with flux across the biofilm revealed that stomata were the major barrier for SO2 to enter the leaves, except the cuticle. The SO2 flux into the plant leaves can be calculated with sufficient accuracy, assuming that the intracellular SO2 concentration is zero. SO2, which enters the cells in the lobe, is trapped in the cytoplasm and reacts with water and light to form a new product, which is processed in chloroplasts [59].
Visible O3 damage to plants is yellowing or whitening, chronic lesions, necrosis, and spots. In this study, visible damage was observed in plants exposed to 100 ppb of O3. Different plant species have different symptoms of O3 exposure. Damage to coniferous leaves is characterized by photobleaching or mottling. In leaves of deciduous broad-leaved trees, red spots appear on adaxial and abaxial leaf surfaces after O3 exposure, and the red spots are uniformly distributed between leaf veins on the back of leaves. Leaves of plants with high anthocyanin content are reddened except for the veins [60]. The wax component of the cuticle layer is known to be affected by many environmental factors. Leaves with moisture stress or low nitrogen levels show increased epidermal wax layers, while leaves exposed to O3 represent a reduced wax layer. Leaves of plants exposed to nitrogen oxides (NOx) and aerosol black carbon have been shown to have a degraded wax crystal structure [53]. Once inside the plant, air pollutants can cause a variety of injuries. Prolonged exposure can lead to chronic damage, and significant exposure to transient concentrations can cause serious injury. Physiological damage by SO2 includes down-regulation of photosynthesis [53,61]. Continuous exposure to SO2 causes damage to plant leaves, and lesions are usually observed in the tissue surrounding opened stomata. In addition, the epicuticular and epistomatal waxes are altered, and torsion and folding of leaf surfaces occur where epidermal cells collapse [53]. The epidermis and subsidiary cells that structurally support guard cells collapse due to leaf anatomical damages to SO2 exposure, and the stomata remain open due to stomatal malfunction, which in turn degrades water use efficiency [53]. Morphological damage of the plant cuticle layer negatively affects the cuticle wax and results in a difference in SO2 absorption capacity between plants by breaking the protective barrier between the inside and outside of the plant [62].
Stomatal closure in the presence of noxious gases is considered a stress avoidance mechanism. One of the major air pollutants, SO2, has been reported to cause stomatal closure, but the mechanism is unknown [54]. Little is known about stomatal reactions to air pollutants in addition to O3 in plants. Fully developed leaves show a clear damage structure associated with damage from exposure to SO2. In general, plants exposed to SO2 have smaller leaves than control leaves. A distinct protruding portion of the cuticle surrounding the stomata appears, the wax layer on the leaf surface is deformed, and blisters occur in the cuticle layer [63]. O3 is a photochemically formed reactive gas responsible for the reduction of carbon assimilation in plant ecosystems. The low-level O3 concentration in the atmosphere (less than 100 ppb) can inhibit carbon assimilation in urban and forest ecosystems [58]. Therefore, the sensitivity of species to ozone is a factor to consider in urban greening. In this study, the APTI of P. densiflora and G. biloba were significantly lower by 5% and 15%, respectively. In particular, after 100 ppb ozone exposure, the air pollutant resistance index of C. retusus was increased by 11% compared to the control. Corresponding to photosynthetic data, it is believed that C. retusus is resistant to ozone. It appears that C. retusus has the ability to absorb O3 as well as its ability to absorb SO2, and thus it is considered to have excellent air pollutant resistance (Figure 3 and Figure 4).
Once SO2 is released into the atmosphere, it can affect air and land environments on different spatial and temporal scales, with detrimental effects on human health and plant communities [64]. The results demonstrated that Z. serrata had a higher tolerance ability to SO2 pollution compared with the other tree species, indicating the maintenance of photosynthetic capacity and stomatal conductance (Figure 2 and Figure 4). In contrast, corresponding to the APTI, it is believed that T. cuspidata, C. retusus, P. × yedoensis, Z. Serrata, G. biloba are resistant to gaseous air pollutants. Studies have shown that ascorbic acid content, total chlorophyll content, leaf extract pH, and relative moisture content are biochemical variables related to air pollutant resistance and sensitivity. The APTI can be used to rank the resistance to air pollution [20,40,65]. APTI value determines the tolerance towards environmental pollutants in plants because all these biochemical parameters determine the susceptibility of plant species to pollution [20,66]. TChl is related to AsA productivity, and the AsA is mainly concentrated in chloroplasts. The high RWC is well suited for helping maintain physiologically proper balances under stress conditions such as exposure to air pollution when evaporation rates are generally high. In addition, high RWC can provide drought resistance in plants. When transpiration rates in leaves decrease due to air pollution, the physio-biochemical functions of plants are degraded by a loss of its engine that draws water from the roots to supply photosynthesis [20].
Previous studies have demonstrated that urban forests can play an important role in mitigating urban air quality [7,8,14,17,27,30]. However, trees respond differently to different gaseous air pollutants [27,29]. Several studies have clearly shown the impacts of biochemical parameters (TChl and AsA) to air pollution on plants [26,27,28,29,30,31,40,41]. As shown in our results, its impact on plant growth in response to elevated air pollution generally causes alterations of micro-morphological (stomata, wax layers, and trichomes), biochemical (TChl and AsA), and physiological (pH and RWC) parameters [27,30,31]. However, a single parameter such as total chlorophyll, leaf extract pH, ascorbic acid content may not provide sufficient insights, indicating conflicting results for the same species [26]. APTI is a biochemical approach that can be used to select eco-friendly urban trees which can be employed for the improvement of air quality [29,30,66]. Despite the importance of APTI for selecting environmentally beneficial tree species in urban forest development, there is still an urgent need for its usefulness. A previous study [26] suggested that the APTI alone is not adequate to select the suitability of eco-friendly tree species for greenspace development, although it can be employed to identify sensitive plants for biomonitoring of air pollution. Furthermore, the anticipated performance index (API) by integrating of APTI values, morphobiological parameters, and socio-economic characters on plants can be very effective in a practical approach for the development of a sink to control air pollution [26,27,31]. This study was to evaluate stomatal uptake of gaseous air pollutants and a combination of the APTI and API on the potential of tree species commonly growing in urban forests, Korea, for sustainable greenspace development. Based upon API (Table 4), P. densiflora and P. × yedoensis were anticipated as good performers, while Z. serrata and G. biloba were predicted to be moderate performers. The remaining C. retusus and T. cuspidata were evaluated as poor and very poor performers, respectively, for developing greenspace to control gaseous air pollutants. Previous studies revealed that plant species based on their higher APTI and API values are more tolerant to air pollutants and have the capacity for managing seriously polluted regions [31]. Further, plants falling into API categories of best, excellent, very good, good, and moderate performers can be recommended as a superior biofilter for the development of greenspace planning/maintaining around urban areas and highly polluted sites [27,31]. Based on the integration of API values and stomatal absorption flux, P. densiflora and Z. serrata showed the maintained physiological parameters in air pollution conditions and can be recommended as a suitable species for reducing air pollution in O3 and SO2 contaminated areas, respectively. Despite being poor and very poor performers, C. retusus and T. cuspidata were maintained and improved in O3 or SO2, respectively, either for photosynthetic ability or stomatal conductance. As a result, a combination of APTI and API based on gas uptake through stomata (stomatal flux) can also be of immense importance for developing greenspace to control air pollution.

5. Conclusions

Air pollution causes the reduction of carbon assimilation, possibly due to cell damage by diffusing into intercellular spaces through stomata, and the gaseous pollutants can affect urban forest ecosystem services. The current and future potential of urban forests on air quality improvement can be achieved judiciously by selecting suitable trees to mitigate and adapt air pollutants. To fulfill the purpose of that activity, the current paper focuses on the importance of integrating of air pollution tolerance index (APTI), anticipated performance index (API), and air pollutant uptake (stomatal flux) to examine the potential suitability of some urban tree species. C. retusus, P. densiflora, and G. biloba showed higher stomatal O3 uptake under elevated O3 exposure; however, there were no remarkable changes in stomatal movement and carbon fixation. Despite high SO2 uptake of T. cuspidata and Z. serrata, photosynthetic ability and stomatal conductance were maintained under excess SO2 exposure as compared to control. The maintenance of APTI values to air pollution exposure was observed for T. cuspidata, C. retusus, P. × yedoensis, Z. serrata, and G. biloba except for P. densiflora. Upon considering API for air quality amelioration, P. densiflora and P. × yedoensis were good performers, Z. serrata and G. biloba were moderate performers, but C. retusus and T. cuspidata were estimated to be poor and very poor performers, respectively. Based on their API values, P. densiflora, P. × yedoensis, Z. serrata, and G. biloba can be recommended as appropriate species for greenspace development in air polluted regions. In particular, based on API value and stomatal uptake, P. densiflora and Z. serrata can be recommended as appropriate species for greenspace development in O3 and SO2 polluted regions, respectively, by maintaining physiological parameters. Interestingly, C. retusus and T. cuspidata, despite being poor and very poor performers, showed maintained and enhanced photosynthetic ability and stomatal conductance in O3 and SO2 exposure, respectively. Our data showed the idea that the integration of APTI and API played a distinctive role in determining the gas-induced susceptible responses of tree species but may not be ideal for selecting suitable species to reform air quality for sustainable and healthy urban environments. In this study, the decreased stomatal conductance reflecting stomatal closure in air pollution-sensitive species affects the dynamics of stomatal flux, indicating that it faces an important challenge in the contribution of urban trees on improving air quality. Thus, it becomes important to address the integration of APTI and API values with stomatal uptake of air pollutants based on potential tree health benefits.

Author Contributions

Conceptualization, S.Y.W.; methodology, M.J.K.; validation, C.R.P. and S.M.J.; formal analysis, S.P. and J.K.L.; investigation, Y.J.L., S.P. and H.K.; resources, J.K.L.; data curation, Y.J.L., S.P. and H.K.; writing—original draft preparation, M.J.K.; writing—review and editing, M.J.K. and K.N.K.; visualization, M.J.K.; supervision, S.Y.W.; project administration, J.K.L.; funding acquisition, S.Y.W. All authors have read and agreed to the published version of the manuscript.

Funding

This research was funded by National Institute of Forest Science (NIFoS), Republic of Korea, grant number FE0000-2018-01-2018.

Acknowledgments

This study was carried out with the support of ‘A Study on Mechanism and Function Improvement of Plants for Reducing Air Pollutants’ (Grant No. FE0000-2018-01-2018) from National Institute of Forest Science (NIFoS), Republic of Korea.

Conflicts of Interest

The authors declare no conflict of interest.

References

  1. Kalnay, E.; Cai, M. Impact of urbanization and land-use change on climate. Nature 2003, 423, 528–531. [Google Scholar] [CrossRef] [PubMed]
  2. UN DESA. World Urbanization Prospects: The 2018 Revision, Key Facts; United Nations Department of Economics and Social Affairs, Population Division: New York, NY, USA, 2018. [Google Scholar]
  3. Gerten, C.; Fina, S.; Rusche, K. The sprawling planet: Simplifying the measurement of global urbanization trends. Front. Environ. Sci. 2019, 7, 140. [Google Scholar] [CrossRef]
  4. Gotham, K.F.; King, A.J. Urbanization. In The Wiley Blackwell Companion to Sociology, 2nd ed.; Ritzer, G., Murphy, W.W., Eds.; Wiley–Blackwell: Hoboken, NJ, USA, 2019; pp. 267–282. [Google Scholar]
  5. Strohbach, M.W.; Döring, A.O.; Möck, M.; Sedrez, M.; Mumm, O.; Schneider, A.K.; Schröder, B. The “hidden urbanization”: Trends of impervious surface in lowdensity housing developments and resulting impacts on the water balance. Front. Environ. Sci. 2019, 7, 29. [Google Scholar] [CrossRef] [Green Version]
  6. Chen, X.; De Vries, S.; Assmuth, T.; Dick, J.; Hermans, T.; Hertel, O.; Jensen, A.; Jones, L.; Kabisch, S.; Lanki, T.; et al. Research challenges for cultural ecosystem services and public health in (peri-) urban environments. Sci. Total Environ. 2019, 651, 2118–2129. [Google Scholar] [CrossRef] [PubMed]
  7. Nowak, D.J.; Hirabayashi, S.; Bodine, A.; Greenfield, E. Tree and forest effects on air quality and human health in the United States. Environ. Pollut. 2014, 193, 119–129. [Google Scholar] [CrossRef] [Green Version]
  8. Nowak, D.J.; Hirabayashi, S.; Doyle, M.; McGovern, M.; Pasher, J. Air pollution removal by urban forests in Canada and its effect on air quality and human health. Urban For. Urban Green. 2018, 29, 40–48. [Google Scholar] [CrossRef]
  9. Weber, C. Ecosystem services provided by urban vegetation: A literature review. In Urban Environment; Rauch, S., Morrison, G., Norra, S., Schleicher, N., Eds.; Springer: Dordrecht, The Netherlands, 2013; pp. 119–131. [Google Scholar]
  10. Han, D.; Shen, H.; Duan, W.; Chen, L. A review on particulate matter removal capacity by urban forests at different scales. Urban For. Urban Green. 2019, 48, 126565. [Google Scholar] [CrossRef]
  11. Heo, S.; Bell, M.L. The influence of green space on the short–term effects of particulate matter on hospitalization in the US for 2000–2013. Environ. Res. 2019, 174, 61–68. [Google Scholar] [CrossRef]
  12. Vos, P.E.; Maiheu, B.; Vankerkom, J.; Janssen, S. Improving local air quality in cities: To tree or not to tree? Environ. Pollut. 2013, 183, 113–122. [Google Scholar] [CrossRef]
  13. Wu, J. Urban ecology and sustainability: The state-of-the-science and future directions. Landsc. Urban Plan. 2014, 125, 209–221. [Google Scholar] [CrossRef]
  14. Selmi, W.; Weber, C.; Rivière, E.; Blond, N.; Mehdi, L.; Nowak, D. Air pollution removal by trees in public green spaces in Strasbourg city, France. Urban For. Urban Green. 2016, 17, 192–201. [Google Scholar] [CrossRef] [Green Version]
  15. Paoletti, E.; Bardelli, T.; Giovannini, G.; Pecchioli, L. Air quality impact of an urban park over time. Procedia Environ. Sci. 2011, 4, 10–16. [Google Scholar] [CrossRef] [Green Version]
  16. Nowak, D.J.; Crane, D.E.; Stevens, J.C. Air pollution removal by urban trees and shrubs in the United States. Urban For. Urban Green. 2006, 4, 115–123. [Google Scholar] [CrossRef]
  17. Yang, J.; Yu, Q.; Gong, P. Quantifying air pollution removal by green roofs in Chicago. Atmos. Environ. 2008, 42, 7266–7273. [Google Scholar] [CrossRef]
  18. Morani, A.; Nowak, D.J.; Hirabayashi, S.; Calfapietra, C. How to select the best tree planting locations to enhance air pollution removal in the MillionTreesNYC initiative. Environ. Pollut. 2011, 159, 1040–1047. [Google Scholar] [CrossRef]
  19. Smith, W.H. Forests as Sinks for Air Contaminants: Vegetative Compartment. In Air Pollution and Forests, 2nd ed.; Smith, W.H., Ed.; Springer-Verlag: New York, NY, USA, 1990; pp. 147–180. [Google Scholar]
  20. Skrynetska, I.; Karcz, J.; Barczyk, G.; Kandziora-Ciupa, M.; Ciepał, R.; Nadgórska-Socha, A. Using Plantago major and Plantago lanceolata in environmental pollution research in an urban area of Southern Poland. Environ. Sci. Pollut. Res. 2019, 26, 23359–23371. [Google Scholar] [CrossRef] [Green Version]
  21. Ainsworth, E.A. Understanding and improving global crop response to ozone pollution. Plant J. 2017, 90, 886–897. [Google Scholar] [CrossRef]
  22. McAdam, E.L.; Brodribb, T.J.; McAdam, S.A. Does ozone increase ABA levels by non-enzymatic synthesis causing stomata to close? Plant Cell Environ. 2017, 40, 741–747. [Google Scholar] [CrossRef]
  23. Choquette, N.E.; Ogut, F.; Wertin, T.M.; Montes, C.M.; Sorgini, C.A.; Morse, A.M.; Brown, P.J.; Leakey, A.D.B.; Ainsworth, E.A. Uncovering hidden genetic variation in photosynthesis of field-grown maize under ozone pollution. Glob. Chang. Biol. 2019, 25, 4327–4338. [Google Scholar] [CrossRef] [Green Version]
  24. Mukherjee, A.; Agrawal, S.B.; Agrawal, M. Responses of tropical tree species to urban air pollutants: ROS/RNS formation and scavenging. Sci. Total Environ. 2020, 710, 136363. [Google Scholar] [CrossRef]
  25. Rai, R.; Rajput, M.; Agrawal, M.; Agrawal, S.B. Gaseous air pollutants: A review on current and future trends of emissions and impact on agriculture. J. Sci. Res. 2011, 55, 77–102. [Google Scholar]
  26. Ogunkunle, C.O.; Suleiman, L.B.; Oyedeji, S.; Awotoye, O.O.; Fatoba, P.O. Assessing the air pollution tolerance index and anticipated performance index of some tree species for biomonitoring environmental health. Agroforest. Syst. 2015, 89, 447–454. [Google Scholar] [CrossRef]
  27. Pandey, A.K.; Pandey, M.; Mishra, A.; Tiwary, S.M.; Tripathi, B.D. Air pollution tolerance index and anticipated performance index of some plant species for development of urban forest. Urban For. Urban Green. 2015, 14, 866–871. [Google Scholar] [CrossRef]
  28. Kashyap, R.; Sharma, R.; Uniyal, S.K. Bioindicator responses and performance of plant species along a vehicular pollution gradient in western Himalaya. Environ. Monit. Assess. 2018, 190, 302. [Google Scholar] [CrossRef]
  29. Jain, S.; Bhattacharya, T.; Chakraborty, S. Comparison of plant tolerance towards air pollution of rural, urban and mine sites of Jharkhand: A biochemical approach to identify air pollutant sink. In Advances in Waste Management; Kalamdhad, A., Singh, J., Dhamodharan, K., Eds.; Springer: Singapore, 2019; pp. 123–142. [Google Scholar]
  30. Kaur, M.; Nagpal, A.K. Evaluation of air pollution tolerance index and anticipated performance index of plants and their application in development of green space along the urban areas. Environ. Sci. Pollut. Res. 2017, 24, 18881–18895. [Google Scholar] [CrossRef]
  31. Karmakar, D.; Padhy, P.K. Air pollution tolerance, anticipated performance, and metal accumulation indices of plant species for greenbelt development in urban industrial area. Chemosphere 2019, 237, 124522. [Google Scholar] [CrossRef]
  32. Wei, X.; Lyu, S.; Yu, Y.; Wang, Z.; Liu, H.; Pan, D.; Chen, J. Phylloremediation of air pollutants: Exploiting the potential of plant leaves and leaf-associated microbes. Front. Plant Sci. 2017, 8, 1318. [Google Scholar] [CrossRef]
  33. Khalid, N.; Noman, A.; Sanaullah, T.; Akram, M.A.; Aqeel, M. Vehicle pollution toxicity induced changes in physiology, defence system and biochemical characteristics of Calotropis procera L. Chem. Ecol. 2018, 34, 565–581. [Google Scholar] [CrossRef]
  34. Khalid, N.; Masood, A.; Noman, A.; Aqeel, M.; Qasim, M. Study of the responses of two biomonitor plant species (Datura alba & Ricinus communis) to roadside air pollution. Chemosphere 2019, 235, 832–841. [Google Scholar] [CrossRef]
  35. Seoul Open Data Plaza. Available online: http://data.seoul.go.kr/dataList/367/S/2/datasetView.do (accessed on 10 April 2019).
  36. Lee, J.K.; Woo, S.Y.; Kwak, M.J.; Park, S.H.; Kim, H.D.; Lim, Y.J.; Park, J.H.; Lee, K.A. Effects of Elevated Temperature and Ozone in Brassica juncea L.: Growth, Physiology, and ROS Accumulation. Forests 2020, 11, 68. [Google Scholar] [CrossRef] [Green Version]
  37. Laisk, A.; Kull, O.; Moldau, H. Ozone concentration in leaf intercellular air spaces is close to zero. Plant Physiol. 1989, 90, 1163–1167. [Google Scholar] [CrossRef] [PubMed] [Green Version]
  38. Winner, W.E.; Mooney, H.A. Ecology of SO2 resistance: I. Effects of fumigations on gas exchange of deciduous and evergreen shrubs. Oecologia 1979, 44, 290–295. [Google Scholar] [CrossRef] [PubMed]
  39. Kwak, M.J.; Lee, S.H.; Khaine, I.; Je, S.M.; Lee, T.Y.; You, H.N.; Lee, H.K.; Jang, J.H.; Kim, I.; Woo, S.Y. Stomatal movements depend on interactions between external night light cue and internal signals activated by rhythmic starch turnover and abscisic acid (ABA) levels at dawn and dusk. Acta Physiol. Plant. 2017, 39, 162. [Google Scholar] [CrossRef]
  40. Thambavani, S.D.; Sabitha, M.A. Variation in air pollution tolerance index and anticipated performance index of plants near a sugar factory: Implications for landscape-plant species selection for industrial areas. J. Res. Biol. 2011, 7, 494–502. [Google Scholar]
  41. Prajapati, S.K.; Tripathi, B.D. Anticipated Performance Index of some tree species considered for green belt development in and around an urban area: A case study of Varanasi city, India. J. Environ. Manag. 2008, 88, 1343–1349. [Google Scholar] [CrossRef]
  42. Hoshika, Y.; Katata, G.; Deushi, M.; Watanabe, M.; Koike, T.; Paoletti, E. Ozone-induced stomatal sluggishness changes carbon and water balance of temperate deciduous forests. Sci. Rep. 2015, 5, 9871. [Google Scholar] [CrossRef]
  43. Martin, M.J.; Host, G.E.; Lenz, K.E.; Isebrands, J.G. Simulating the growth response of aspen to elevated ozone: A mechanistic approach to scaling a leaf-level model of ozone effects on photosynthesis to a complex canopy architecture. Environ. Pollut. 2001, 115, 425–436. [Google Scholar] [CrossRef]
  44. Kangasjärvi, J.; Jaspers, P.; Kollist, H. Signalling and cell death in ozone-exposed plants. Plant Cell Environ. 2005, 28, 1021–1036. [Google Scholar] [CrossRef]
  45. Käffer, M.I.; Domingos, M.; Lieske, I.; Vargas, V.M. Predicting ozone levels from climatic parameters and leaf traits of Bel-W3 tobacco variety. Environ. Pollut. 2019, 248, 471–477. [Google Scholar] [CrossRef]
  46. Vainonen, J.P.; Kangasjärvi, J. Plant signalling in acute ozone exposure. Plant Cell Environ. 2015, 38, 240–252. [Google Scholar] [CrossRef]
  47. Kollist, H.; Nuhkat, M.; Roelfsema, M.R.G. Closing gaps: Linking elements that control stomatal movement. New Phytol. 2014, 203, 44–62. [Google Scholar] [CrossRef] [PubMed]
  48. Zhang, J.; Gao, F.; Jia, H.; Hu, J.; Feng, Z. Molecular response of poplar to single and combined ozone and drought. Sci. Total Environ. 2019, 655, 1364–1375. [Google Scholar] [CrossRef] [PubMed]
  49. Matyssek, R.; Bytnerowicz, A.; Karlsson, P.E.; Paoletti, E.; Sanz, M.; Schaub, M.; Wieser, G. Promoting the O3 flux concept for European forest trees. Environ. Pollut. 2007, 146, 587–607. [Google Scholar] [CrossRef] [PubMed]
  50. Grulke, N.E.; Heath, R.L. Ozone effects on plants in natural ecosystems. Plant Biol. 2020, 22, 12–37. [Google Scholar] [CrossRef] [PubMed]
  51. Smith, B.N.; Lytle, C.M. Air pollutants. In Plant Ecophysiology; Prasad, M.N.V., Ed.; John Wiley and Sons: New York, NY, USA, 1997; pp. 375–392. [Google Scholar]
  52. Tausz, M. Sulfur in forest ecosystems. In Sulfur in Plants an Ecological Perspective. Plant Ecophysiology; Hawkesford, M.J., De Kok, L.J., Eds.; Springer: Dordrecht, The Netherlands, 2007; Volume 6, pp. 59–75. [Google Scholar]
  53. Elliott-Kingston, C.; Haworth, M.; McElwain, J.C. Damage structures in leaf epidermis and cuticle as an indicator of elevated atmospheric sulphur dioxide in early Mesozoic floras. Rev. Palaeobot. Palynol. 2014, 208, 25–42. [Google Scholar] [CrossRef]
  54. Ooi, L.; Matsuura, T.; Munemasa, S.; Murata, Y.; Katsuhara, M.; Hirayama, T.; Mori, I.C. The mechanism of SO2-induced stomatal closure differs from O3 and CO2 responses and is mediated by nonapoptotic cell death in guard cells. Plant Cell Environ. 2018, 42, 437–447. [Google Scholar] [CrossRef] [Green Version]
  55. Reich, P.B. Quantifying plant response to ozone: A unifying theory. Tree Physiol. 1987, 3, 63–91. [Google Scholar] [CrossRef]
  56. Hoshika, Y.; Watanabe, M.; Carrari, E.; Paoletti, E.; Koike, T. Ozone-induced stomatal sluggishness changes stomatal parameters of Jarvis-type model in white birch and deciduous oak. Plant Biol. 2018, 20, 20–28. [Google Scholar] [CrossRef]
  57. Manes, F.; Vitale, M.; Fabi, A.M.; De Santis, F.; Zona, D. Estimates of potential ozone stomatal uptake in mature trees of Quercus ilex in a Mediterranean climate. Environ. Exp. Bot. 2007, 59, 235–241. [Google Scholar] [CrossRef]
  58. Fares, S.; Conte, A.; Chabbi, A. Ozone flux in plant ecosystems: New opportunities for long-term monitoring networks to deliver ozone-risk assessments. Environ. Sci. Pollut. Res. 2018, 25, 8240–8248. [Google Scholar] [CrossRef]
  59. Pfanz, H.; Martinoia, E.; Lange, O.L.; Heber, U. Flux of SO2 into leaf cells and cellular acidification by SO2. Plant Physiol. 1987, 85, 928–933. [Google Scholar] [CrossRef] [PubMed] [Green Version]
  60. Vollenweider, P.; Ottiger, M.; Günthardt-Goerg, M.S. Validation of leaf ozone symptoms in natural vegetation using microscopical methods. Environ. Pollut. 2003, 124, 101–118. [Google Scholar] [CrossRef]
  61. Haworth, M.; Elliott-Kingston, C.; Gallagher, A.; Fitzgerald, A.; McElwain, J.C. Sulphur dioxide fumigation effects on stomatal density and index of non-resistant plants: Implications for the stomatal palaeo-[CO2] proxy method. Rev. Palaeobot. Palynol. 2012, 182, 44–54. [Google Scholar] [CrossRef]
  62. Bartiromo, A.; Guignard, G.; Lumaga, M.R.B.; Barattolo, F.; Chiodini, G.; Avino, R.; Guerriero, G.; Barale, G. The cuticle micromorphology of in situ Erica arborea L. exposed to long-term volcanic gases. Environ. Exp. Bot. 2013, 87, 197–206. [Google Scholar] [CrossRef]
  63. Steinthorsdottir, M.; Elliott-Kingston, C.; Bacon, K.L. Cuticle surfaces of fossil plants as a potential proxy for volcanic SO2 emissions: Observations from the Triassic–Jurassic transition of East Greenland. Paleobiodivers. Paleoenviron. 2018, 98, 49–69. [Google Scholar] [CrossRef] [Green Version]
  64. Granieri, D.; Vita, F.; Inguaggiato, S. Volcanogenic SO2, a natural pollutant: Measurements, modeling and hazard assessment at Vulcano Island (Aeolian Archipelago, Italy). Environ. Pollut. 2017, 231, 219–228. [Google Scholar] [CrossRef]
  65. Rai, P.K.; Panda, L.L. Dust capturing potential and air pollution tolerance index (APTI) of some road side tree vegetation in Aizawl, Mizoram, India: An Indo-Burma hot spot region. Air Qual. Atmos. Health 2014, 7, 93–101. [Google Scholar] [CrossRef]
  66. Kaur, M.; Sharma, A.; Katnoria, J.; Nagpal, A. Air Pollution Tolerance Index (APTI): An Important Determinant for the Development of Green Space in and Around Industrial/Urban Area. In Bioremediation: Current Research and Applications; Rathoure, A.K., Ed.; IK International Publishing House Pvt. Ltd.: New Delhi, India, 2017; pp. 422–449. [Google Scholar]
Figure 1. Photosynthetic rate (a) and stomatal conductance (b) of urban trees after four weeks of O3 exposure of 100 ppb concentration. Each bar represents the mean of 15 replicates. Green bars, OC (ambient O3, 10 nmol mol−1); gray bars, OT (elevated O3, 100 nmol mol−1). Different lowercase and uppercase letters mean significant differences among tree species within ambient O3 and elevated O3, respectively (Tukey HSD test after one-way ANOVA). Asterisks represent significant differences between ambient O3 (OC) and elevated O3 (OT) within each tree species (paired t-test, * p < 0.05; ** p < 0.01; *** p < 0.001; ns, not significant).
Sustainability 12 03067 g001
Figure 2. Photosynthetic rate (a) and stomatal conductance (b) of urban trees after four days to SO2 exposure of 500 ppb concentration. Each bar represents the mean of 12 replicates. Yellow bars, SC (ambient SO2, 4 nmol mol−1); gray bars, ST (elevated SO2, 500 nmol mol−1). Different lowercase and uppercase letters mean significant differences among tree species within ambient SO2 and elevated SO2, respectively (Tukey HSD test after one-way ANOVA). Asterisks represent significant differences between ambient SO2 (SC) and elevated SO2 (ST) within each tree species (paired t-test, * p < 0.05; ** p < 0.01; *** p < 0.001; ns, not significant).
Sustainability 12 03067 g002
Figure 3. O3 flux of urban trees after four weeks of exposure to 100 ppb O2 concentration. Each bar represents the mean of 15 replicates. Green bars, OC (ambient O3, 10 nmol mol−1); gray bars, OT (elevated O3, 100 nmol mol−1). Different lowercase and uppercase letters mean significant differences among tree species within ambient O3 and elevated O3, respectively (Tukey HSD test after one-way ANOVA). Asterisks represent significant differences between OC and OT within each tree species (paired t-test, * p < 0.05; ** p < 0.01; *** p < 0.001; ns, not significant).
Sustainability 12 03067 g003
Figure 4. SO2 flux by urban trees after four days of exposure to 500 ppb SO2 concentration. Each bar represents the mean of 12 replicates. Yellow bars, SC (ambient SO2, 4 nmol mol−1); gray bars, ST (elevated SO2, 500 nmol mol−1). Different lowercase and uppercase letters mean significant differences among tree species within ambient SO2 and elevated SO2, respectively (Tukey HSD test after one-way ANOVA). Asterisks represent significant differences between SC and ST within each tree species (paired t-test, * p < 0.05; ** p < 0.01; *** p < 0.001; ns, not significant).
Sustainability 12 03067 g004
Figure 5. Leaf surface topography showing stomata, grooves, trichomes, and waxes in urban trees after exposure to gaseous air toxic SO2. (ad) Taxus cuspidata, (eh) Pinus densiflora, (il) Zelkova serrata, (mp) Prunus × yedoensis, (qt) Ginkgo biloba, and (ux) Chionanthus retusus. (a,b,e,f,i,j,m,n,q,r,u,v) Control leaf surfaces (having normal stomatal movement) and (c,d,g,h,k,l,o,p,s,t,w,x) gaseous air pollution treated leaf surfaces (having abnormal stomatal movement). Scale bars: (b,n) 5 μm; (d,f,i,k,m,o,p,r,t,u,w) 10 μm; (a,c,e,g,q,s) 20 μm; (h,l) 50 μm; (j) 100 μm; and (v,x) 200 μm.
Sustainability 12 03067 g005
Figure 6. Assessment of air pollution tolerance index (APTI) of selected urban tree species after exposure to gaseous air pollutants. Each bar represents the mean of eight replicates. Green bars, unexposed controls (CONTROL); gray bars, exposed groups (TREATMENT) to gaseous air pollution. Different lowercase and uppercase letters mean significant differences among tree species within CONTROL and TREATMENT, respectively (Tukey HSD test after one-way ANOVA). Asterisks represent significant differences between CONTROL and TREATMENT within each tree species (paired t-test, * p < 0.05; ** p < 0.01; *** p < 0.001; ns, not significant).
Sustainability 12 03067 g006
Table 1. Gradation of urban tree species by air pollution tolerance index (APTI), morphobiological parameters, and socio-economic importance to determine the anticipated performance index (API).
Grading CharacterPattern of AssessmentGrading Allotted 1
(a) ToleranceAPTI2.0–6.0+
6.1–10.0++
10.1–14.0+++
14.1–18.0++++
18.1–22.0+++++
(b) BiologicalPlant habitSmall
parametersMedium+
Large++
Crown structureSparse/irregular/globular
Spreading crown/open/semi-dense+
Spreading dense++
Plant typeDeciduous
Evergreen+
(c) MorphologicalSizeSmall
laminar structureMedium+
Large++
TextureSmooth
Coriaceous+
HardinessNot hardy
Hardy+
(d) Socio-economicFrequency<3 uses
importance3–4 uses+
>4 uses++
Note: A maximum grade for any tree species is 16. 1 Gradation characteristics and grades allotted were adopted from [26,27,28,30].
Table 2. Anticipated performance index (API) and of urban tree species under gaseous air pollution [26,27,28,30,41].
Score (%)API ValueAssessment of Category
Up to 30.00Not recommended
31.0–40.01Very poor
41.0–50.02Poor
51.0–60.03Moderate
61.0–70.04Good
71.0–80.05Very Good
81.0–90.06Excellent
91.0–100.07Best
Table 3. Assessment of biochemical parameters in selected urban tree species after exposure to gaseous air pollution.
Tree SpeciesAsA
(mg/g FW)
pHTChl
(mg/g FW)
RWC
(%)
Taxus cuspidataCon.1.07 ± 0.30 a5.56 ± 0.10 b2.69 ± 0.51 c,d78 ± 6 b,c
Tre.1.02 ± 0.25 a5.54 ± 0.02 b2.46 ± 0.23 b83 ± 6 a
Pinus densifloraCon.1.12 ± 0.34 a3.85 ± 0.08 d1.60 ± 0.25 d81 ± 3 a
Tre.1.12 ± 0.34 a3.79 ± 0.10 d1.48 ± 0.22 b72 ± 8 a,b,c **
Chionanthus retususCon.0.55 ± 0.12 b5.36 ± 0.19 c11.7 ± 4.44 a66 ± 6 d
Tre.0.47 ± 0.01 b5.49 ± 0.02 b11.0 ± 4.82 a69 ± 5 b,c
Prunus × yedoensisCon.1.08 ± 0.32 a5.66 ± 0.13 b3.32 ± 0.11 c,d75 ± 3 b,c
Tre.1.11 ± 0.37 a5.57 ± 0.07 b2.22 ± 0.51 b ***80 ± 5 a,b *
Zelkova serrataCon.1.14 ± 0.37 a6.03 ± 0.04 a7.37 ± 0.83 b72 ± 5 c,d
Tre.1.16 ± 0.43 a6.01 ± 0.02 a3.93 ± 0.96 b ***74 ± 8 a,b,c
Ginkgo bilobaCon.0.51 ± 0.17 b3.94 ± 0.03 d5.07 ± 3.28 b,c73 ± 4 c,d
Tre.0.50 ± 0.17 b3.99 ± 0.18 c4.15 ± 2.23 b66 ± 10 c
Values are expressed as the mean ± SD (n = 8). Different superscript lowercase letters represent significant differences among the six species in unexposed controls (Con.) and exposed groups (Tre.) to gaseous air toxic pollution, respectively (Tukey HSD test after one-way ANOVA). Asterisks represent significant differences between Con. and Tre. within each species (* p < 0.05; ** p < 0.01; *** p < 0.001).
Table 4. Anticipated performance index (API) of urban tree species based on the air pollution tolerance index (APTI) as well as morphological parameters and socio-economic importance.
SpeciesAPTIPHCSPTLS 1EVGrade Allotted
STHScore (%)API ValueCategory
Taxus cuspidata++++++37.51Very poor
Pinus densiflora++++++++++62.54Good
Chionanthus retusus++++++++50.02Poor
Prunus × yedoensis++++++++++62.54Good
Zelkova serrata+++++++++56.33Moderate
Ginkgo biloba++++++++++56.33Moderate
1 APTI, air pollution tolerance index; PH, plant habit; CS, crown structure; PT, plant type; LS, laminar structure; S, size; T, texture; H, hardiness; EV, economic values.

