Article

Analysis on Spatial Pattern and Driving Factors of Carbon Emission in Urban–Rural Fringe Mixed-Use Communities: Cases Study in East Asia

1
College of Design and Architecture, Zhejiang University of Technology, Hangzhou 310058, China
2
Faculty of Environmental Engineering, The University of Kitakyushu, Kitakyushu 808-0135, Japan
*
Authors to whom correspondence should be addressed.
Sustainability 2020, 12(8), 3101; https://0-doi-org.brum.beds.ac.uk/10.3390/su12083101
Submission received: 24 February 2020 / Revised: 3 April 2020 / Accepted: 3 April 2020 / Published: 13 April 2020
(This article belongs to the Collection Urban Planning and Built Environment)

Abstract

:
Urban-intensive areas are responsible for an estimated 80% of greenhouse gas emissions, particularly carbon dioxide. The urban–rural fringe areas emit more greenhouse gases than urban centers. The purpose of this study is to analyze the spatial pattern and driving factors of carbon emissions in urban–rural fringe mixed-use communities, and to develop planning methods to reduce carbon emissions in communities. This study identifies mixed-use communities in East Asian urban–rural fringe areas as industrial, commercial, tourism, and rental-apartment communities, subsequently using the emission factor method to calculate carbon emissions. The statistical information grid analysis and geographic information systems spatial analysis method are employed to analyze the spatial pattern of carbon emission and explore the relationship between established space, industrial economy, material consumption, social behavior, and carbon emission distribution characteristics by partial least squares regression, ultimately summing up the spatial pattern of carbon emission in the urban–rural fringe areas of East Asia. Results show that (1) mixed-use communities in the East Asian urban–rural fringe areas face tremendous pressure to reduce emissions. Mixed-use community carbon emissions in the late urbanization period are lower than those the early urbanization. (2) Mixed-use community carbon emission is featured by characteristics, such as planning structure decisiveness, road directionality, infrastructure directionality, and industrial linkage. (3) Industrial communities produce the highest carbon emissions, followed by rental-apartment communities, business communities, and tourism communities. (4) The driving factor that most affects the spatial distribution of carbon emissions is the material energy consumption. The fuel consumption per unit of land is the largest driver of carbon emissions. Using the obtained spatial pattern and its driving factors of carbon emissions, this study provides suggestions for planning and construction, industrial development, material consumption, and convenient life guidance.

1. Introduction

The actual impact of a global temperature rise of 2 °C will be more serious than predicted, and the climate warming target should be adjusted to 1.5 °C to avoid large losses and dangers due to climate change [1]. The large amount of CO2 emitted from human production and life is the main cause of global warming [2,3], which pressures human beings to pay attention to efforts towards a low-carbon society [4,5]. Therefore, the analysis of carbon emission laws suitable for East Asia can provide a theoretical basis for regional low-carbon construction.
The rapid urbanization of East Asia reveals a different process from Western developed countries, and a new East Asian landscape emerges, the desakota, which is characterized by a mix of agricultural and nonagricultural activities and economic transition from agricultural activities to nonagricultural activities in densely populated areas [6,7]. Such areas made great contributions to the urbanization of East Asia and have become the center of urbanization development in the future world [8]. Some scholars refer to them as the extended metropolitan region [9], urban–rural interaction [10], or peri-urban areas [11]. Urban–rural fringe areas extend along the corridor of the cores of large cities and adopt a development model of high energy consumption and high carbonization. Development movements, such as “one product one village” in Japan [12], the “new village movement” in Korea [13], reform of the land system in Taiwan, the development of beautiful villages and small towns in Zhejiang Province, have enabled urban–rural fringe areas to deploy their characteristics and gradually move toward industrialization, maturity, and ecologicalization. It is further predicted that the East Asian region with the largest scale of urbanization and industrialization will have large-scale carbon emissions. The problems caused by carbon emissions in urban–rural fringe areas have gradually attracted the attention of governments and academia. Implementation of the low-carbon concept in the planning and construction of urban–rural fringe areas has become an inevitable trend.
Mixed-use communities have different interpretations and definitions in various fields [14,15]. From the macro level of urban social and economic development, the mixed-use community is generally located in the urban–rural fringe department. The core of this community is a harmonious and unified social and economic form that creates a community of production, achieves the upgrading of high-end manufacturing and the accumulation of technology-based enterprises, promotes the integration of the modernization of life ideology and the modern production city space model, and endorses a balanced and sustainable development of industrial and natural ecological environments. Being of high-order status of urbanization development in urban–rural integration areas, mixed-use communities have a strong practical importance for studying the spatial pattern and driving factors of carbon emissions.
In this study, four communities including industrial, commercial, tourism and rental-apartment communities are assumed as carriers of mixed-use communities. On one hand, the analysis of the spatial differences in carbon emissions of these four types of communities can reveal the spatial pattern of carbon emissions in mixed-use communities. On the other hand, the relationship between the multi-drive factors and the spatial distribution of carbon emissions explored by partial least squares (PLS) regression can summarize the carbon emission driving model of urban-rural integration areas, and in practice provide low-carbon construction ideas for other areas.

2. Literature Review

2.1. Low Carbon Research Areas and Scales

Carbon emission assessments have covered multiple regions on multiple scales. The differences in carbon emission factors between developed and developing countries are explored by quantifying greenhouse gas emissions [16]. Druckman & Jackson [17], on the basis of the quasi-multiregional input and output model, calculated that the carbon emissions of English homes in 2004 increased by 15% compared with those in 1990. S. Lin et al. [18] introduced the impact of urbanization and economic development on CO2 emissions from non-high-income countries through the extended Stochastic Impacts by Regression on Population, Affluence, and Technology (STIRPAT) model. S. Wang and Liu [19] applied spatiotemporal modeling to assess China’s city-level CO2 emission levels using Linear Scanning System sensors carried by the US Defense Military Meteorological Satellite (DMSP/OLS) nighttime light imagery. Dahal et al. [20] studied the role of renewable energy policies in carbon neutrality in Helsinki metropolitan areas through multilevel perspective (MLP) and renewable energy framework. Gustavsson et al. [21] analyzed the primary energy use and CO2 emissions of an eight-story timber-framed apartment building. J. Li et al. [22] took the desakota area in Shenzhen, Guangdong province, China as an example to prepare for carbon capture and storage through the carbon capture and storage ready center. Generally, current carbon emission research is mainly concentrated on large scales and large cities, and few studies on urban–rural fringe areas are available.

2.2. Methods for Carbon Emission Research

Scholars worldwide have used numerous methods to analyze factors that affect carbon emissions. K. Feng et al. [23] analyzed the carbon emission mechanism in 28 regions in China through environmental Input-Output analysis and structural decomposition analysis. Cansino et al. [24] analyzed carbon emissions in Spain from different perspectives using log mean Divisia index method. C. Wang et al [25] used the extended STIRPAT model based on IPAT identity to examine the driving factors of energy-related carbon emissions in Xinjiang. Y. Feng et al. [26] used system dynamics modeling to analyze Beijing’s urban energy consumption and CO2 emissions. Partial least squares regression (PLS) has been widely used in the fields of biology, medicine, ecology, and influencing factors analysis. However, studies on the analysis methods of PLS influencing factors of carbon emissions are few.

2.3. Low-Carbon Community Research

Low-carbon community research aims to promote low-carbon communities around the world to achieve low-carbon development. A participatory process that combined an urban climate action plan, formulated by a team of academics, local government, and community members, was used in Denver City and Broomfield, Colorado, USA [27]. Chatterton [28] completed a case study of an embryonic post-carbon initiative called Lila, which is the first attempt in building an affordable, ecological cohousing project in the UK. Charoenkit and Kumar [29] inspected five criteria classification tools widely used in assessing urban environmental sustainability, namely, Building Research Establishment Environmental Assessment Method Community (BREEAM-Community), Leadership in Energy and Environmental Design for Neighborhood Development (LEED-ND), Comprehensive Assessment System for Built Environment Efficiency (CASBEE-UD), SBTool2012(a generic framework for rating the sustainable performance of buildings and projects), and Green Building Index (GBI) for Township. A compact urban form and an orderly urban spatial structure were established in the planning of practice of Shanghai Nanqiao New City from the planning level through the construction of a “composite community.” This approach was based on the basic standpoint of increasing carbon sinks and reducing carbon emissions to achieve the development goals of low-carbon cities.
The practice of low-carbon communities has been observed worldwide. In this study, carbon emission statistics are calculated using the emission factor (EF) method provided by the Intergovernmental Panel on Climate Change (IPCC). Previous research on the driving factors of carbon emission impact and of carbon emission in communities of urban and rural areas are summarized, and PLS model regression analysis is performed.

3. Cases and Methods

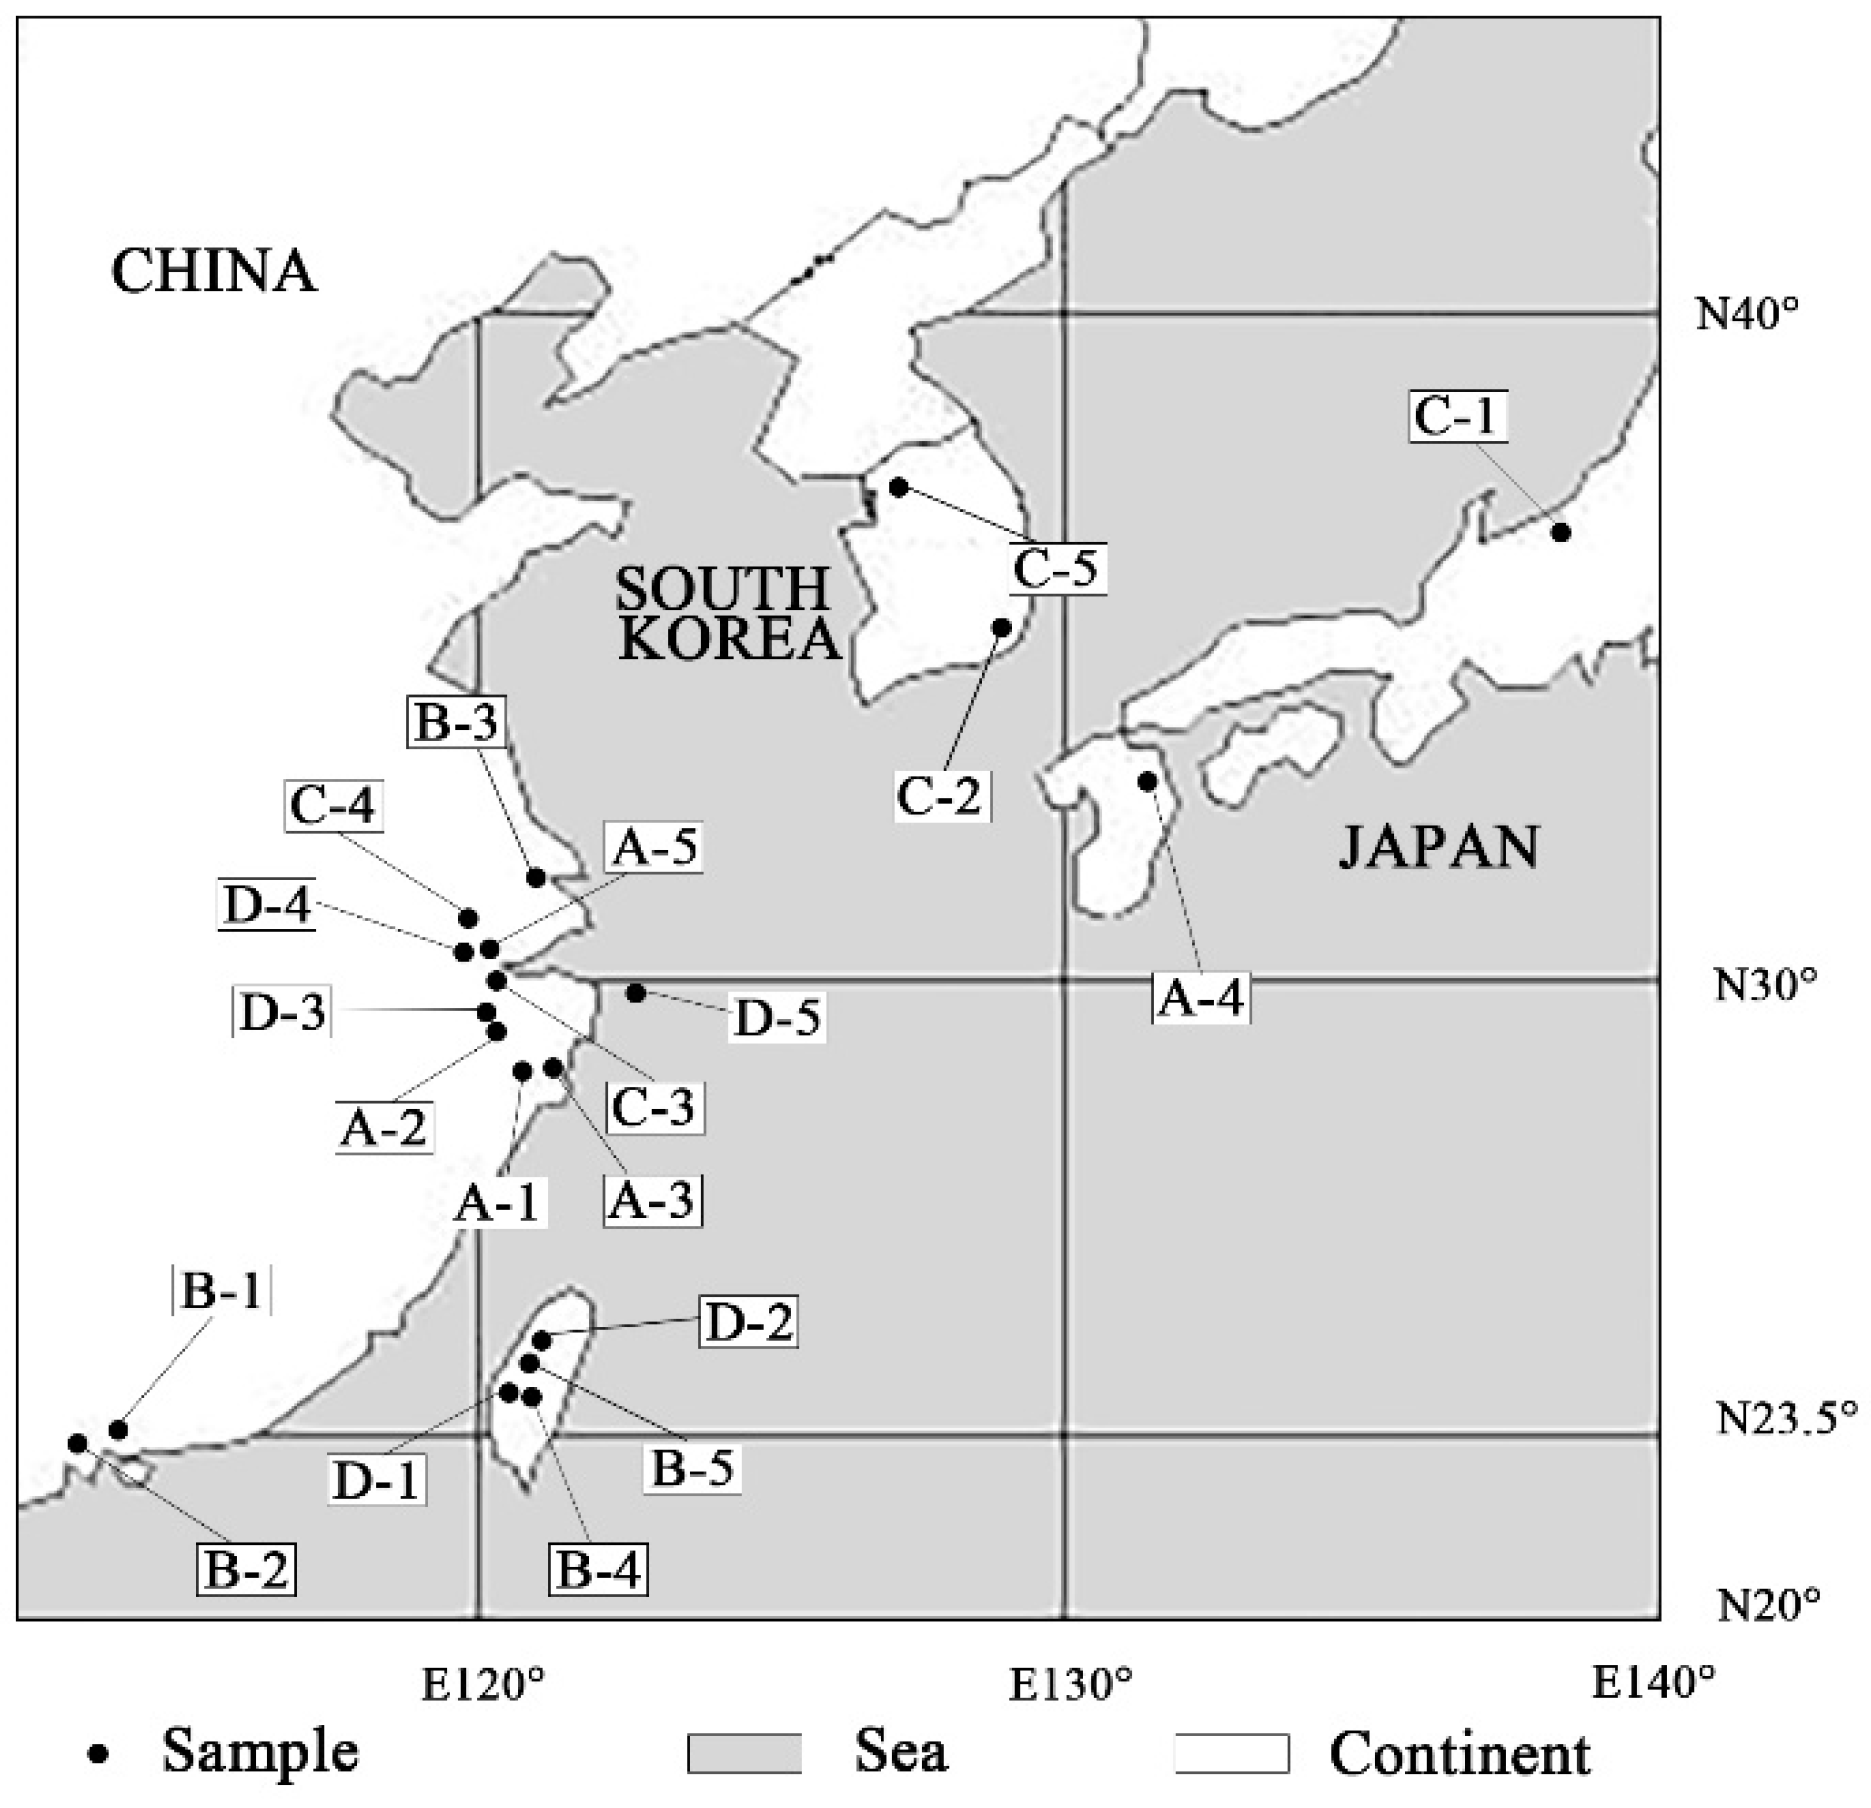
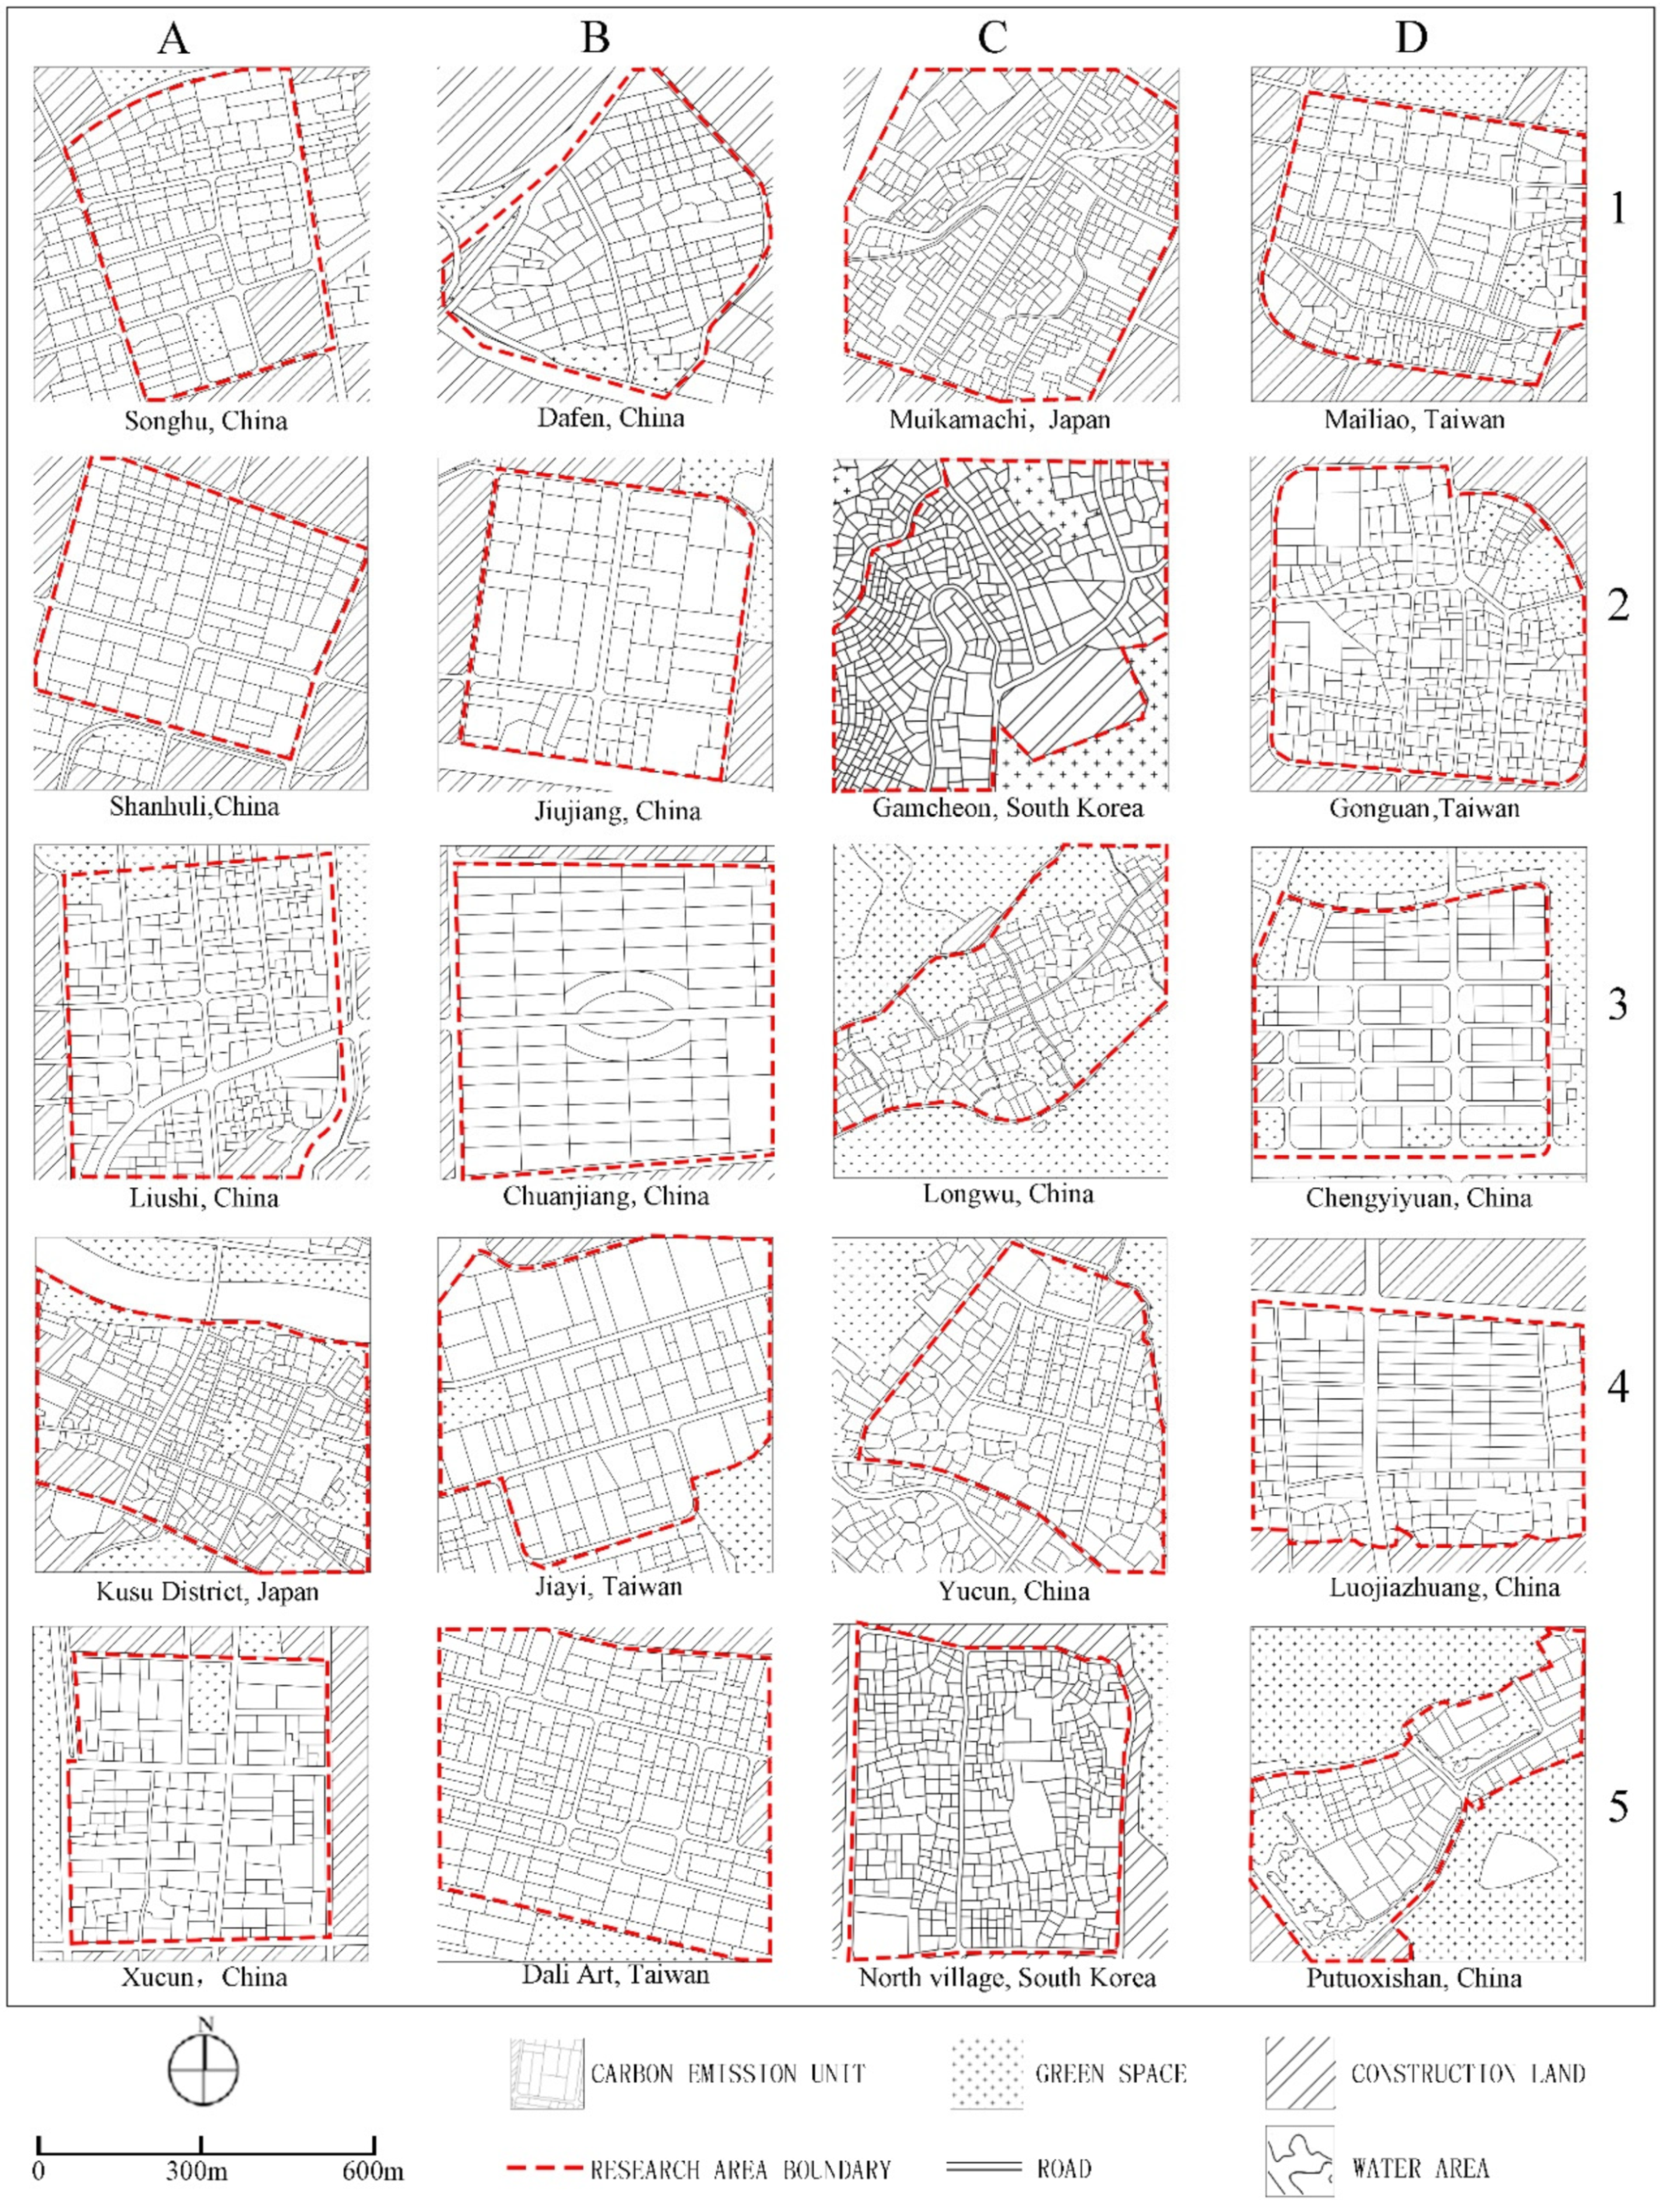
3.1. Cases Selection
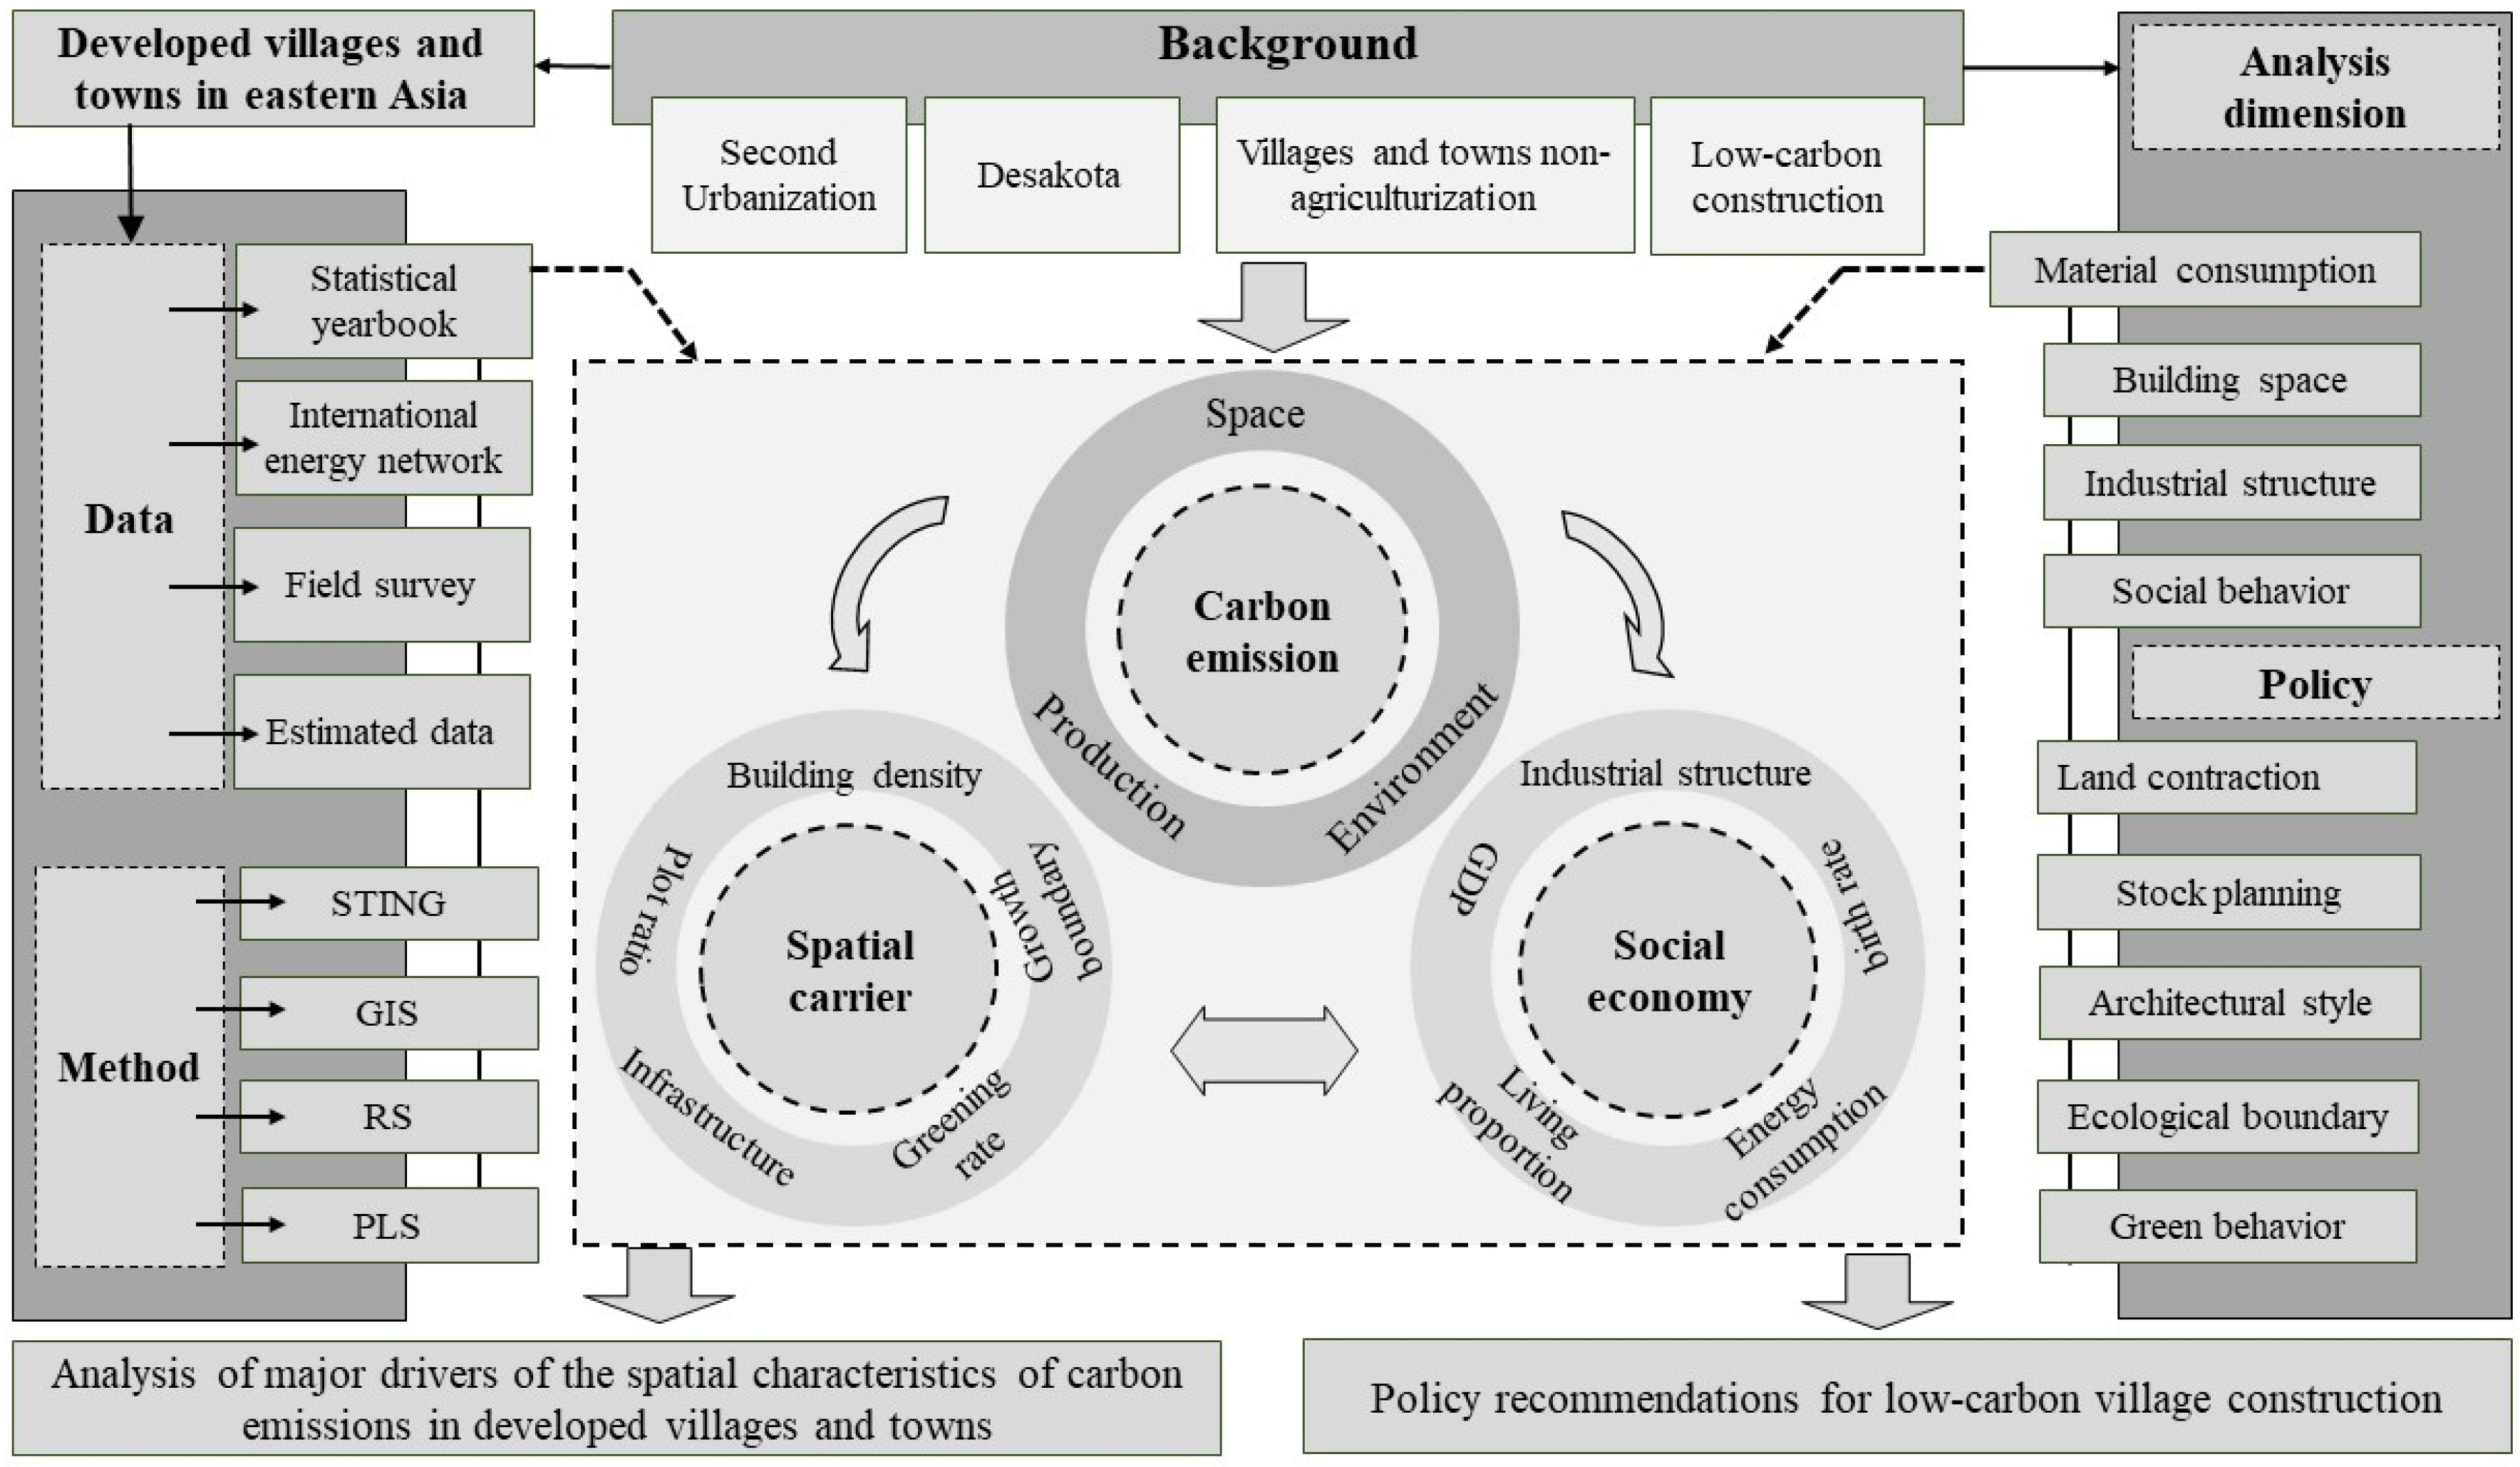
As East Asian urban–rural fringe communities often have multiple industries, this study will be based on the leading industries within the community, that is, industries with an annual output value of more than 50%, and classifies mixed-use communities as follows: (1) industrial communities, which are divided into family-based leading industries and modern park-leaded industries; (2) commercial communities, which are divided into traditional business communities and e-commerce communities; (3) tourist communities, which are divided into communities for cultural tourism and for experiential tourism, in which the former is based on cultural experience, whereas the latter is based on specific agricultural and sideline industries and participatory tourism industry; and (4) rental-apartment communities, which are referred to as urban residence complexes that provide long-term residential services, such as urban villages. The communities in this study include not only areas with the preceding four types of leading industries, but also areas with various topographies, such as rivers and lakes, mountainous hills, and impact plains.
A total of 20 communities are selected, including 16 in China (including 4 in China, Taiwan), 2 in Japan, and 2 in Korea (Figure 1, Table 1). All the cases belong to the East Asia region and meet the basic characteristics of the urban–rural fringe region, that is, the urban-rural fringe area, has a clear leading industry and can support regional development, and there are obvious carbon emission activities. At the same time, the development degree of the case is obtained based on the urbanization level and per capita disposable income of the case area.

3.2. Methods

This study framework contain physical, social and spatial parts, and the methods of IPCC-EF, spatial grid analysis, and partial least squares (PLS) regression are applied in the specific technical route (Figure 2): (1) This study analyzes the spatial distribution of carbon emissions based on Remote Sensing (RS) technology on carbon emission units divided by the statistical information grid (STING) method; (2) The carbon source-sink theory are given to illustrate the carbon emission streamlines and visualize the flow path; (3) PLS regression model is set to explore the influence of four dimensions which including material consumption, building space, industrial structure, and social behavior; (4) With the system dynamic analysis on the carbon emission driving mechanism of various types of the carriers, this study proposes the low-carbon community optimization strategies of Land contraction, Stock planning, Architectural style, Ecological boundary, and Green behavior.

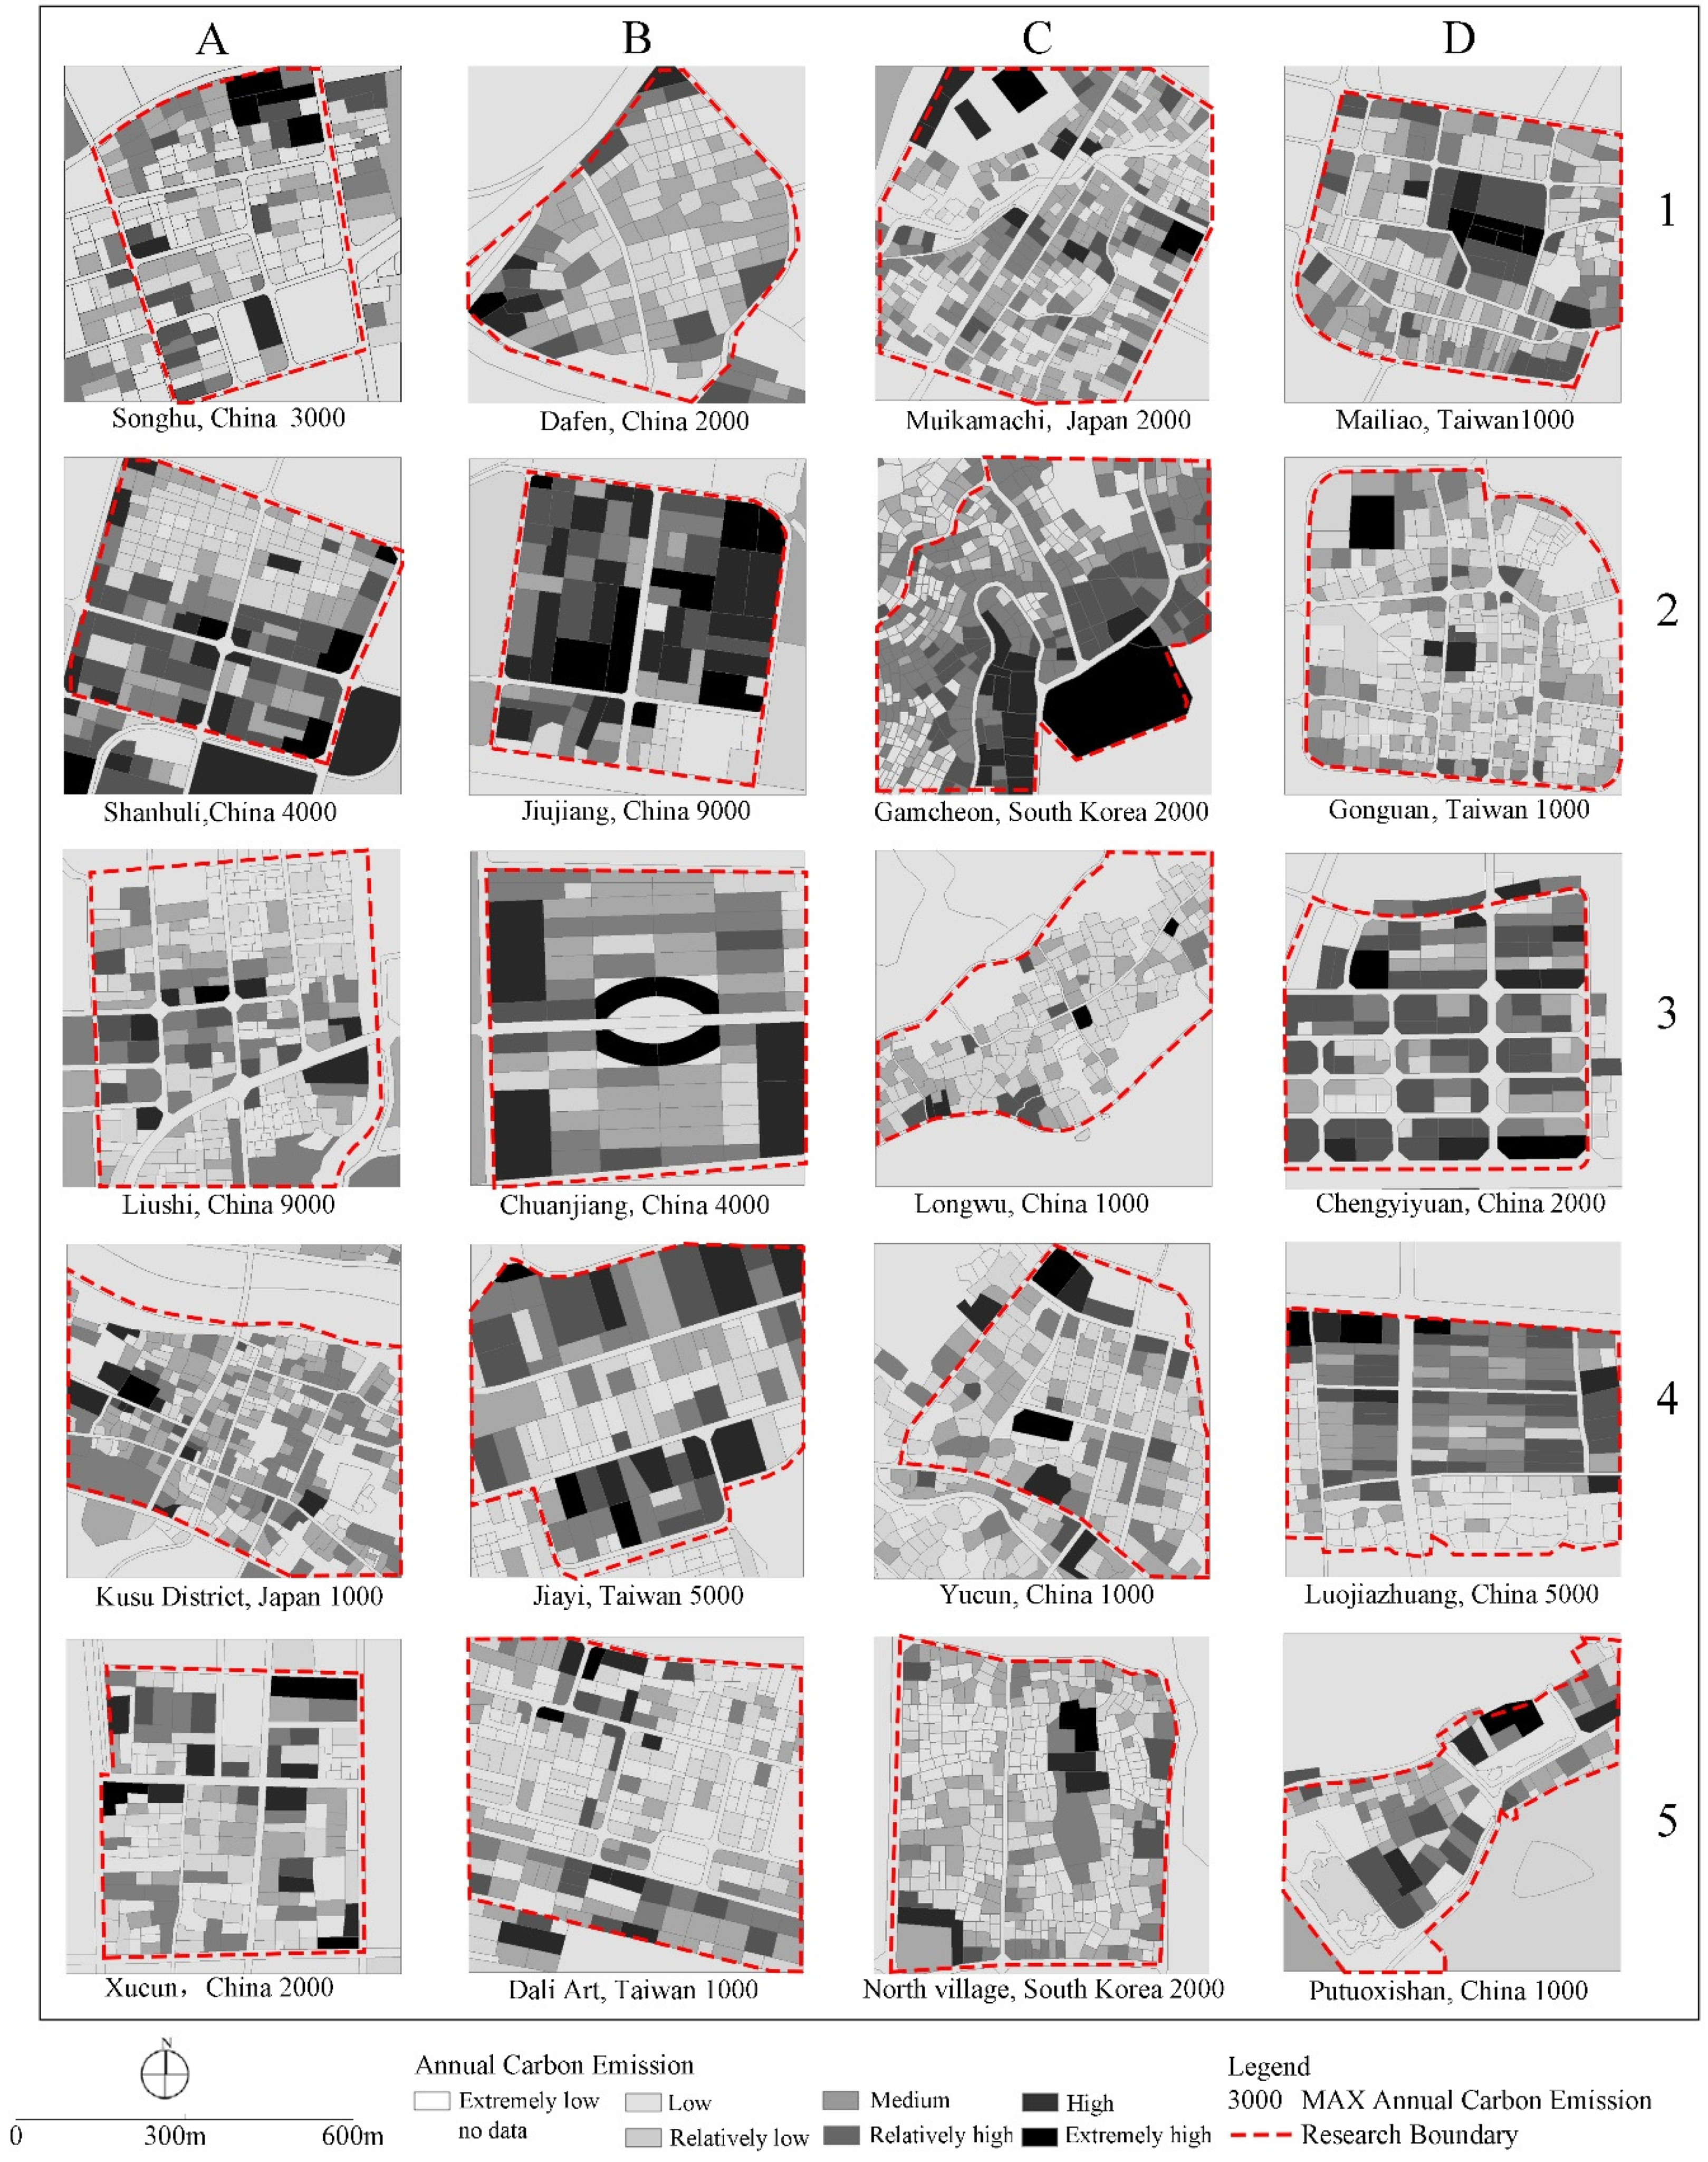
3.2.1. Spatial Grid Analysis

In this study, the STING method is used to divide the study area. This approach is one of the basic methods for data collection and statistical analysis of complex geographical conditions and of a solid theoretical basis [30,31]. It has also been widely applied worldwide [32]. The study area is approximately 3 km2 and has a building density of more than 50%. The study area’s per capita national economic income belongs to the top 30% in the region, which solves the problem of large differences in administrative areas and lack of contrast. First, the mixed-use community space is divided into spatial units with data comparability. Second, spatial feature data were collected and processed. Finally, the data from different spatial units was compared to explore the similarity or particularity, and drawing preliminary conclusions. The statistical graph of the STING method analysis results, as shown in Figure 3.

3.2.2. IPCC-EF

The IPCC-EF [33] and Chinese provincial greenhouse gas (GHG) inventory preparation guide are jointly used in this study. The three carbon footprint (CF) accounts, namely, production, ecology, and space, are analyzed through the emission source account model and are aggregated to obtain the CF of mixed-use community carbon emissions. The formula is as follows:
CF = CFe + CFp + CFw ,
where CFe, CFp, CFw represent the three CF accounts of production, ecology, and space, respectively. Carbon emission activities include electricity consumption of residents and gasoline consumption of vehicles in the mixed-use community. The carbon emission formula for a single activity bill is
C p = i = 1 n Q i EF i ( 44 12 ) ,
where Cp is the total CO2 emission (kg), i is the ith carbon emission activity, n is the number of carbon emission activities, Qi is the degree of carbon emission activity, and EFi is the ith EF coefficient (kg/tce). The EF for energy consumption is determined by the standards provided by the IPCC.

3.2.3. Partial Least Squares Regression

PLS regression is mainly used to analyze the regression of multiple dependent variables to multiple independent variables, which can effectively solve the multiple collinearity problem of independent variables [34]. With the use of the variable projection importance analysis technique of PLS regression, the value of each index reflects the importance of the influence on the ecological footprint and can effectively identify the influence degree of each index of the regression factors on the carbon emission [35].
The carbon emission of the model is taken as the dependent variable Y. Then, the driving factors of the difference in carbon emissions of mixed-use communities are analyzed using the PLS method and SIMCA-P 11.5 software. Among many determined driving factors, Kaya identity is one of the most widely used models [36]. The drivers of CF are divided into population growth, per capita GDP, energy consumption per unit of GDP (energy intensity), and carbon emissions per unit of energy (energy carbon intensity) using the Kaya equation. Scholars have expanded and improved the key factors in Kaya identity to understand the driving factors of the CF. H. Li et al. [37] considered per capita GDP, industrial structure, population, urbanization rate, technical level, and CO2 emissions as drivers of CF changes. Z. Wang et al. [38] selected the driving factors for CF change from three perspectives, namely, population, affluence, and technology. Therefore, on the basis of the actual situation, the driving factor indicators in this study are selected as established space index, industrial economic index, material consumption index, and social behavior index (Table 2).

4. Results

4.1. Carbon Emissions and Spatial Distribution Analysis

Based on the results of carbon emission statistics and comprehensively considering factors (e.g., considerable differences in total carbon emissions, division of the total carbon emissions within the unit, and the complex spatial pattern of emissions), the stratified coloring method is used to calculate and analyze carbon emissions in a particular case. The carbon emissions of various units in the concerned community are divided into seven levels on the basis of the natural discontinuity classification method, using the ArcGIS platform. This classification ranges from small to large (e.g., very small, slight, small, medium, great, dense, extremely high, and extra high emissions; Figure 4). The color depth of the unit s represents the difference in carbon emissions. The darker color refers to the higher total carbon emissions in this unit, whereas the lighter color refers to the lesser total carbon emissions in this unit.
The average carbon emission of mixed-use communities is 25,511.51 tons/year, and the amount of carbon emission of each property unit is 164.12 tons/year. Among all the cases, the largest single unit of property rights is B-2, which is located in Jiujiang Town, Foshan City, Guangdong Province, with an emission of 8834.45 tons/year. Meanwhile, the smallest value is D-5, which is 861.5 tons/year in Putuo, Zhoushan.
The maximum emission of each property unit at B-2, Jiuijang Town, Foshan City, Guangdong Province, is 8,834.45 tons/year for carbon emissions. The minimum emission of each property unit at D-5 in Putuo is 861.5 tons/year for carbon emissions.
The carbon emission per capita of the selected cases is 3.8 tons/year, in which the emission value in the early developed regions is 4.1 tons/year, and those of the medium and maturely developed regions are 6.54 tons/year and 3.2 tons/year, respectively. Therefore, based on the classification of case development degree, the carbon emission of the cases with different development stages is relatively different, and the low-carbon construction in mature areas is better than that in the middle stage of development. Hence, an environmental Kuznets “inverted U” curve exists [39]. Based on the global carbon prediction report [40], the average global carbon emission is 1.1 tons/year. Thus, the emission of mixed-use communities in East Asia is still under severe circumstances.
Based on the results of GIS layered color analysis, the mixed-use communities of the same dominant industry are similar in carbon emissions, emission composition, and spatial layout. However, the carbon emissions of different types of mixed-use community vary greatly (Figure 4).
Carbon emissions of the mountain-based rural planning communities, such as Hangzhou Longwu (C-3) and South Korea’s Busan Ganchuan Cultural Village (C-2), follow the characteristics of random and free distribution, depending on the topography without evident grouping characteristics. However, the spatial distribution of carbon emissions in modern industrial parks is highly consistent with its high-density grid road or circular road planning. Carbon emissions of China’s Songhu (A-1) and Shanhuli (A-2) are featured by obvious agglomeration in space and have high coupling with the division of the grid.
The preceding condition is due to the planning structure determining the spatial distribution of carbon emissions. This study explains this feature from the following three perspectives. (1) Road directionality: carbon emissions are the highest at the crossroads, higher along the road, and low in the middle of the unit. Catering industry, commerce, trade, and public service facilities in mixed-use communities are affected by road traffic organizations, which are concentrated along the side of the road with high building density, such that carbon emissions are considerably higher than in other regions. As a representative of mixed-use communities, carbon emissions along the road of Coral Village in Dongyang City are considerably higher than those inside the plot. The intersection of Kunhan and Kunxi Roads is a regional community service center that gathers catering, business, education, and other functions, whose carbon emissions are the highest. (2) Infrastructure directionality: the carbon emissions around major public facilities are significantly higher than those in other surrounding areas. This phenomenon is due to rapid accumulation of population around public facilities and the rapid consumption of energy. The carbon emissions of Ganchuan Cultural Village in Busan, South Korea, including schools and tourist centers in the region, are high, and those around them are higher than that in other regions. (3) Industry linkage: the carbon emissions of leading industries in the region are closely related to the development of their industrial chains. Emissions from emission units in the same production chain are directly proportional to their production. For example, Haining Xucun Town is known for the garment manufacturing industry in the Yangtze River Delta, whose production department has the highest carbon emission concentration. The carbon emissions of carbon emission units that provide raw materials, storage, waste disposal, and transportation for its production are also higher than those in other surrounding areas. In Hangzhou Luojiazhuang, a rental-apartment community, the carbon consumption of the food service industry is considerably higher than that of the fast supermarket and clothing sales services.

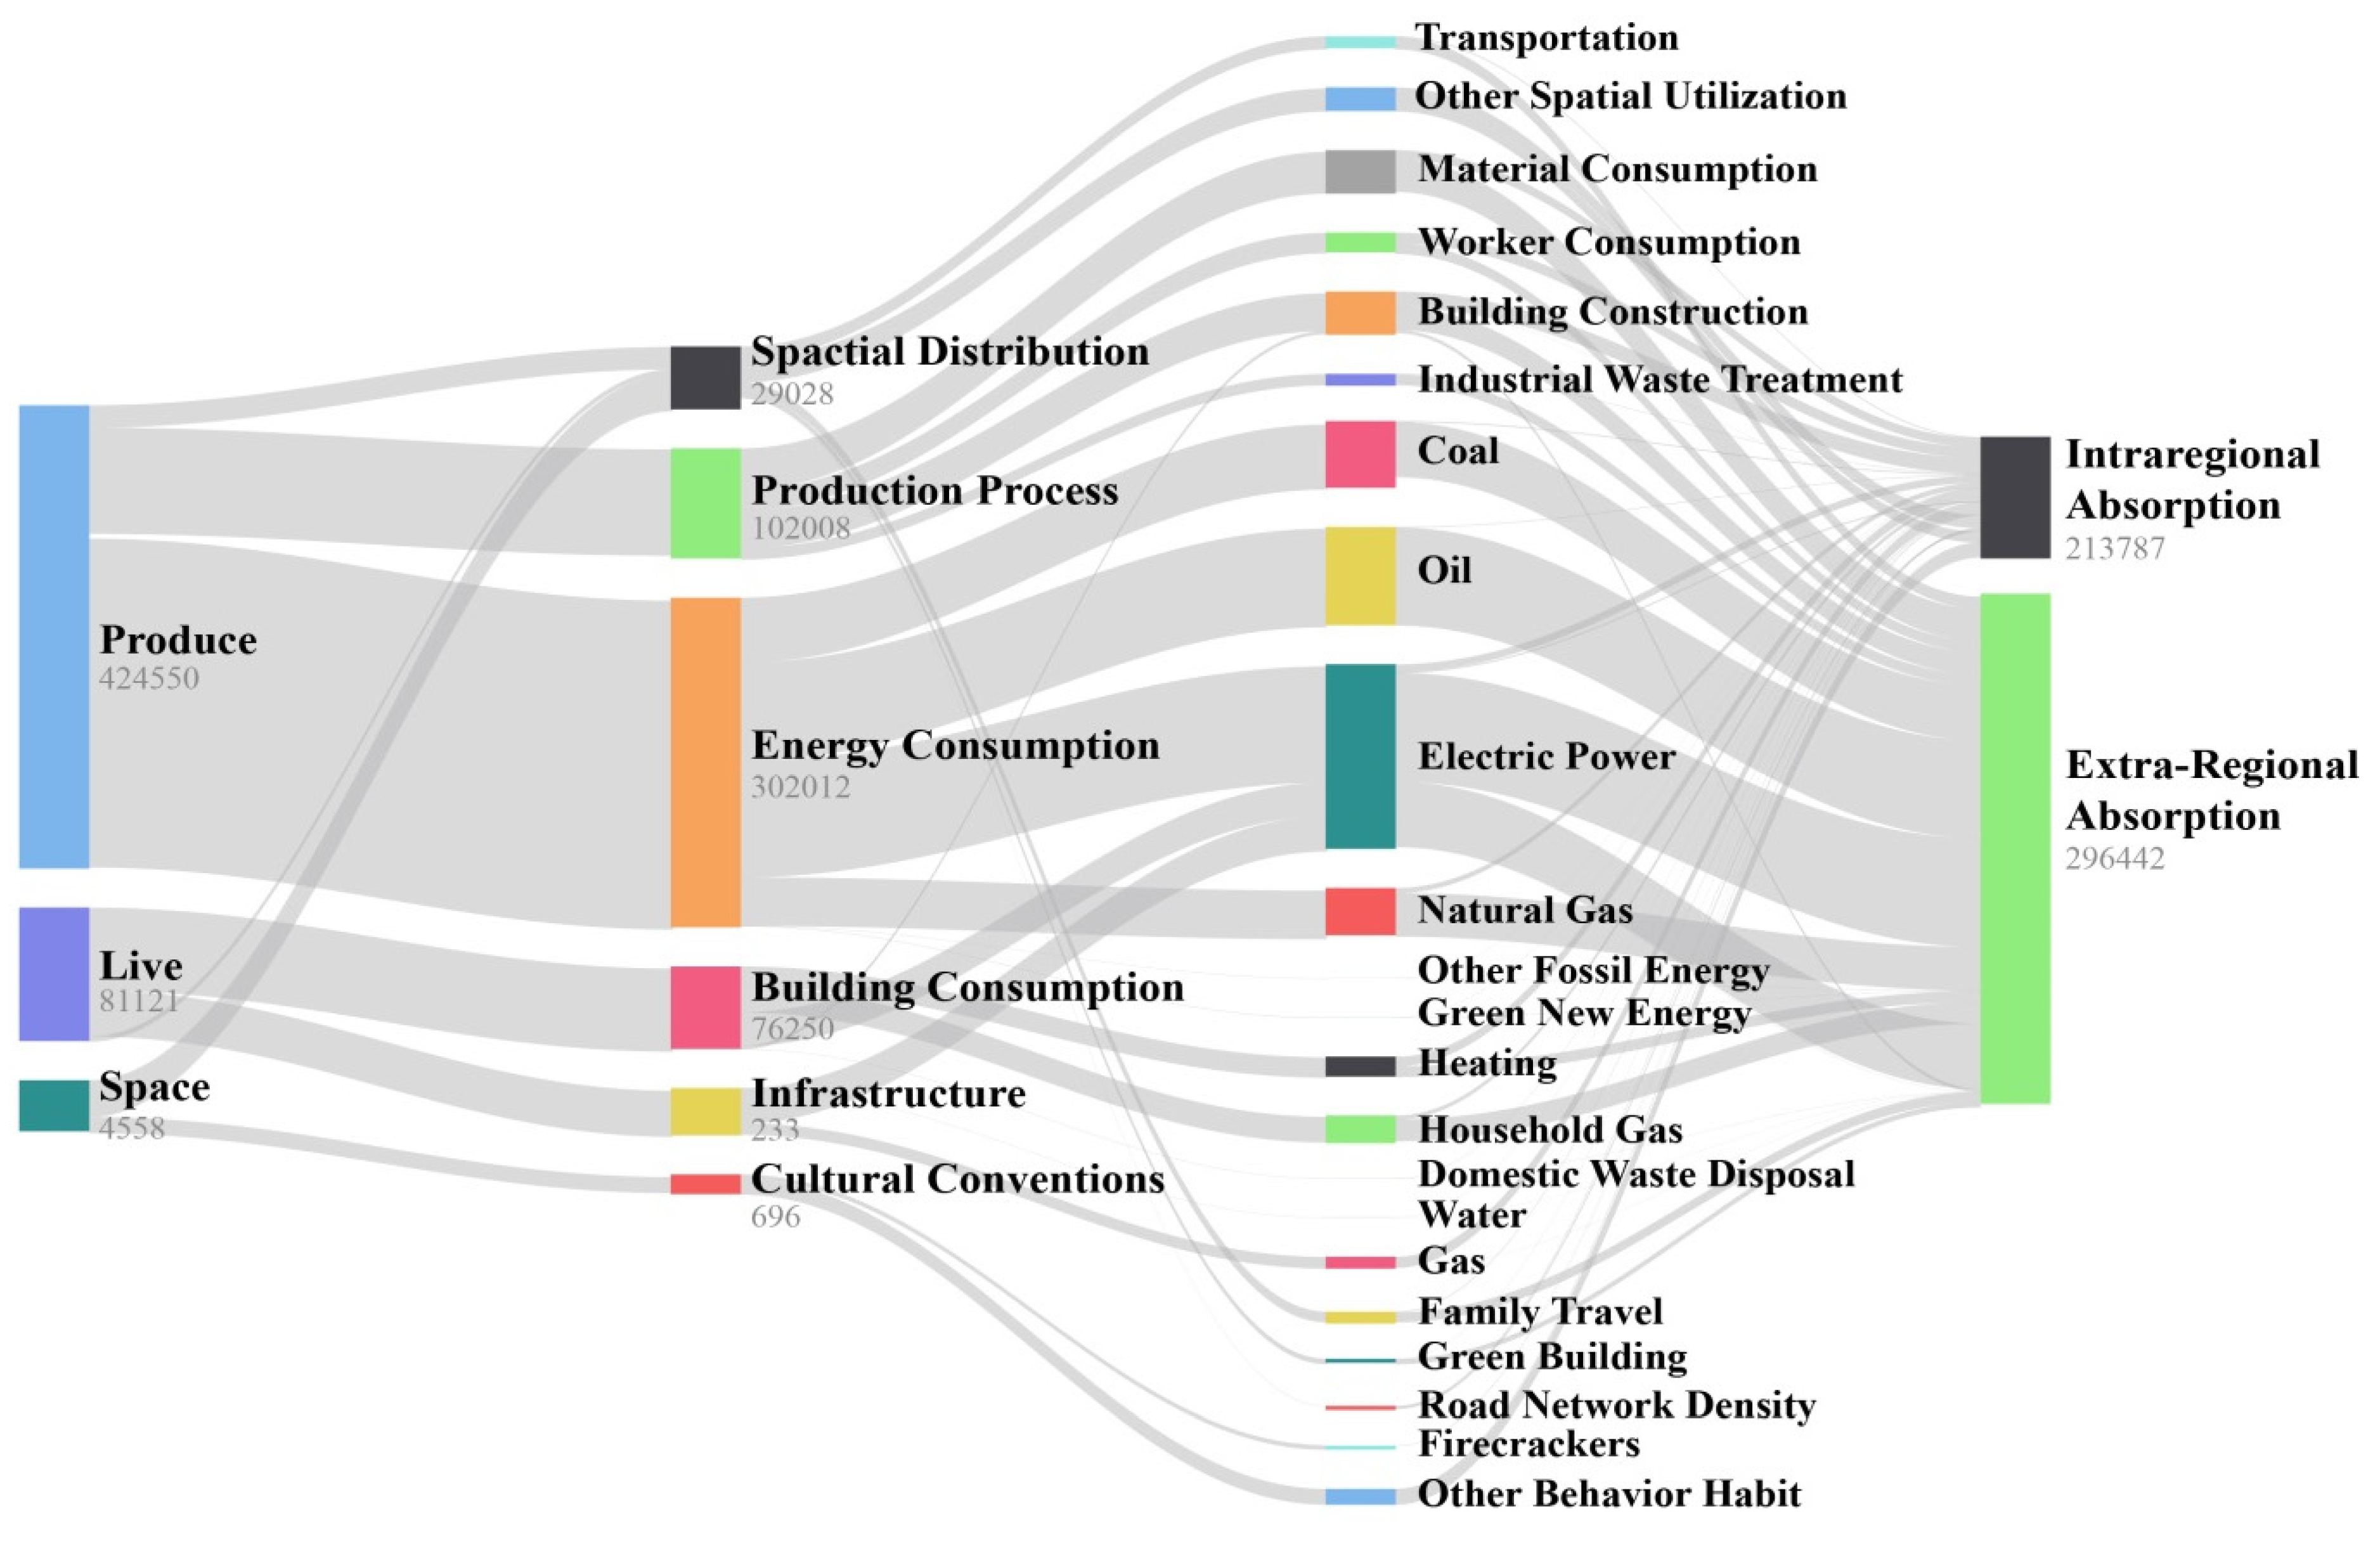
4.2. Carbon Flow Billing Analysis

Carbon flow bills of mixed-use communities are constructed on the basis of statistical results of carbon emissions. Bills are divided into two dimensions, namely, the carbon source and sink. Among the three dimensions of the carbon source dimension (i.e., production, life, and space), production accounts for the largest proportion of carbon emissions at 424,550.07 tons/year. This value accounts for 83.20% of total carbon emissions, which is inseparable from the mixed-use community’s dependence on industrial revitalization. Whether it is a modern industrial, tourist-oriented or rental-apartment community, the production of its leading industries provides an economic basis for mixed-use community revitalization and development. In view of the specific implemented consumption path, the carbon emission of energy consumption is the largest, which totals 302,012.37 tons/year (59.19%.) Such energy consumption includes industrial production processes and household heating and cooling. The order of other emission routes from large to small is: building consumption, production process, and space building (Figure 5).
The carbon sink dimension is divided into intra- and extra-regional carbon sinks. Statistical results show that most of the carbon emissions can be solved in the region, which totals 108,284.43 tons/year (78.78%). From the perspective of geomorphology, green space absorbs most carbon emissions, followed by cultivated lands, water bodies, and woodlands. Based on the worldwide experience, forestland carbon sequestration capacity is the strongest. However, green space and cultivated land account for a large proportion in the actual area and play several roles due to the characteristics of communities.

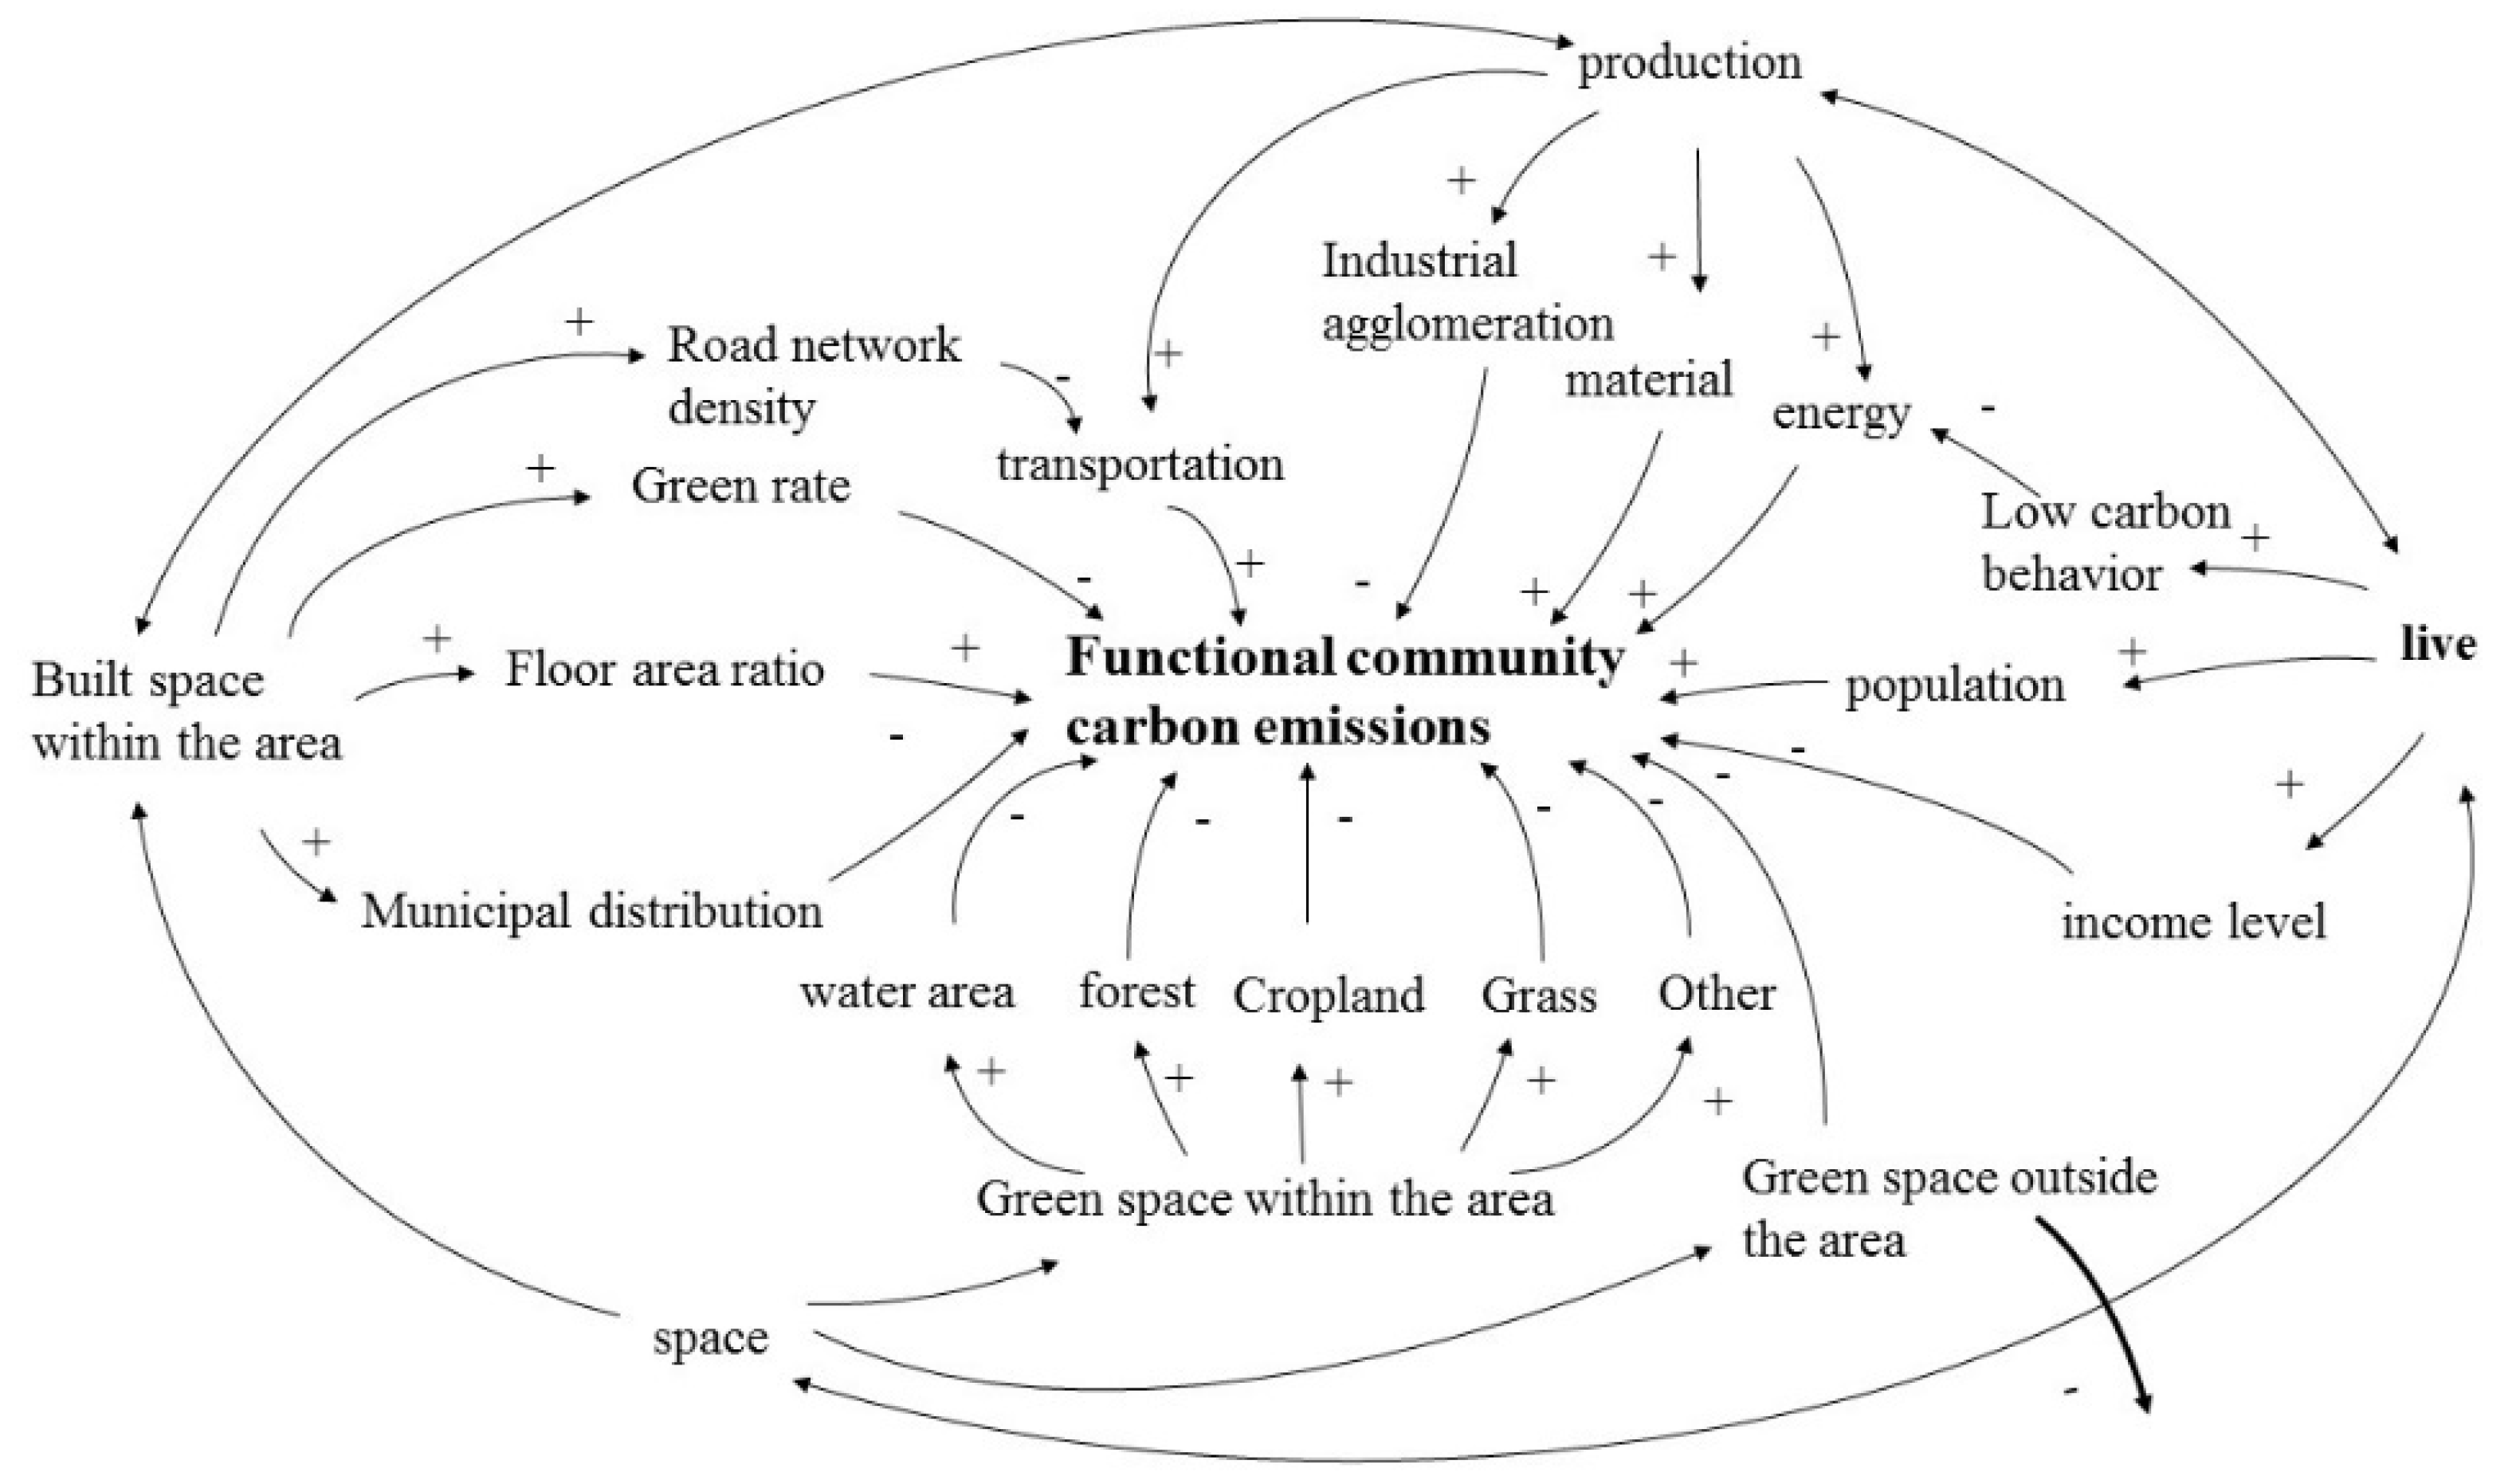
4.3. Factors Affecting Carbon Emissions

When two PLS components are extracted, the cross-validity Q12 is 0.0995 > 1 – 0.952 = 0.0975, and the third component is −0.581. Therefore, only two PLS components are extracted from the system. The interpretation capability of the model for Y is 0.871, and the regression model is of high precision and reliability. According to the singular point recognition principle, the case points are all distributed inside the singular point recognition map, and the case quality can be guaranteed. The final standardized PLS regression is given as:
Y = 0.967408   +   0.142144 X 1 + 0.14244 X 2 + 0.0333897 X 3 + 0.0381875 X 4 + 0.0941695 X 5 + 0.158782 X 6 + 0.168541 X 7 + 0.206416 X 8 + 0.154787 X 9 + 0.288312 X 10 + 0.20722 X 11 + 0.103418 X 12   0.125679 X 13 0.131263 X 14   0.0406407 X 15 ,
In the regression analysis of PLS, the variable projection importance (VIPj) is used to measure the interpretation power of each independent variable Xj on the dependent variable Y. Generally, the independent variable with VIPj greater than 1 is relatively important, and the one between 0.5 and 1 is likewise important, whereas that less than 0.5 holds no importance. Based on the analysis results (Table 3), the VIPj of factors X10, X8, X1, X3, X14, X11, and X13 are greater than 1, which demonstrates a significant impact on mixed-use community carbon emissions. Meanwhile, the VIPj of X2, X4, X5, X6, X7, X9, X12, X14, and X15 is between 0.5 and 1, which demonstrates that the impact on carbon emissions in the community is important.
Based on the correlation coefficient and VIP value in Equation (3), the established density VIP value ranked first in the dimension of established space index, and its influence on carbon emission CF was 1.193. This condition is caused by planning elements, which determine the spatial distribution of the carbon emission through the characteristics of planning structure decisiveness, road directionality, and infrastructure directionality.
The industrial economic index dimension has a low contribution to carbon emissions, such that the GDP per unit land, leading industrial agglomeration, and economic income per capita rank 12th, 14th, and 16th in the model, respectively, and VIP values are between 0.5 and 1, which depict relatively important factors. The total amount of carbon emissions and the spatial distribution of mixed-use communities in the same industry are similar, whereas carbon row characteristics in the communities of different industries are different. (1) In terms of total volume, modern industrial communities have the highest carbon emission, which is considerably larger than that in other mixed-use communities, followed by traditional industrial, modern logistics, comprehensive industry, traditional trade, and tourism resorts. (2) From the perspective of the space pattern, innovative and creative communities are mostly emitted in the free and random low-density form. The communities dominated by industrial production, whether modern or traditional, are of high carbon emissions and strong linkages.
Fuel energy and electricity consumptions per land rank the first and second in the contribution of the entire driving force model, respectively. The consumption of energy is the main source of carbon emissions and has the highest impact on spatial distribution of carbon emissions. In Liushi Town, famous for the production of electrical appliances, the unit where the manufacturer is located is affected by power and energy consumptions, whose carbon emission value is considerably higher than other land parcels.
The social behavior index shows that the employment-to-living ratio and the number of units of land are the main driving factors of this dimension, and their VIP values are greater than 1, which indicates a significant factor. Occupational residence balance requests that the number of jobs offered within a reasonable scale is roughly equal to the number of employed people. Since the population of the developed community is mostly inflowing population, the rents in the plots are high, and the imbalance of occupational residence is significant. Traffic, intensive housing, and non-recyclable use of household goods will increase carbon emissions. Meanwhile, population is proportional to regional carbon emissions.
In order to clearly reflect the impact mechanism of the four-dimensional influencing factors on the community’s carbon emissions in the region, this paper has produced a related power map as a schematic. (Figure 6)

5. Recommendation

(1) Planning and construction methods for new or expanded mixed-use communities should be optimized. As far as the current urban–rural fringe mixed-use communities in East Asia are concerned, their development model is mainly based on spatial incremental construction, and functional zoning should be integrated from the level of planning and design to build a green ecological network to increase carbon sinks. As shown in the cases of Chuanjiang and Chengyiyuan, thanks to their quality design, their carbon emissions from the interior of the building or other spaces throughout the year are much lower than other unplanned areas. Therefore, we propose to build a green and efficient transportation network system for areas with incremental construction to reduce transportation consumption in mixed-use communities. A system-connected green water system and an efficient mixed-use community service management system should also be constructed. Protecting ecological green spaces and promoting low-carbon, energy-saving building materials will also contribute to low-carbon construction in the community. For mixed-use communities with stock planning and construction, the main focus should be on land optimization and low-carbon service facilities. Moreover, urban industrial upgrading, brownfield reconstruction, and greenway construction should be introduced. Ecological protection, resource consumption, and environmental damage should also be incorporated into the assessment mechanism of communities. Liushi Town and Songhu Town can be taken as typical examples of this type of transformation and optimization.
(2) The development of the new green industries in mixed-use communities need to be planned. The development of communities, whether urbanized, industrialized, or modernized, cannot be separated from the support of the industry. Blindly pursuing low carbon is not advisable. For industrial communities such as Xucun town and Shanhuli town, relevant laws or carbon emission industry plans should be formulated. Mixed-use communities should strengthen technological upgrading of related industries, widely apply green energy, and reduce carbon emissions from energy consumption. The application of new technologies, such as Internet technology, big data analysis, and artificial intelligence, should be promoted to effectively reduce unnecessary carbon emissions, improve work efficiency in the logistics, trade links of commercial and trade communities, and improve the low-carbon construction of facilities in tourism and rental-apartment communities. Jiujiang and Chuangjiang, dominated by the logistics and commerce industries, are on this path. In addition, backward high-energy and high-emission industries should be eliminated.
(3) Limit resource and energy consumption index in mixed-use communities. Clean energy is advocated to reduce the dependence of economic development on energy. An annual plan or budget for energy consumption in a business or community unit should be initiated to reduce energy consumption per unit of GDP, which will effectively reduce carbon emissions. The industrial structure should be rationally adjusted and optimized by transforming the way of asset investment to improve the quality of industrial development. Regional coordination and cooperation should be strengthened. Taking Luojiazhuang as an example, the unit area should limit the available energy to reduce energy waste and unnecessary waste emissions. Diversified and comprehensive energy supply channels and multi-scale energy balance and regional layout should be constructed.
(4) Strengthen the guidance of low-carbon lifestyle in mixed-use communities. Focus on Rental-apartment-type communities, strengthen the promotion of low-carbon survival, and build a green and low-carbon education that covers all ages, from young to old. Recommended values for building energy use should be introduced to reduce the value of building energy consumption in production and living. Certain financial support or policy incentives should be provided to residents and enterprises that use green energy and new energy vehicles. The improvement of sewage treatment, garbage collection and treatment, electric vehicle charging piles and other facilities in mixed-use communities, and adding garbage recovery should be promoted, as well as public transportation systems, production, and lifestyle. An environmental protection accountability system and an ecological damage supplement system should also be established.

6. Conclusions

First, carbon emission statistics show that mixed-use communities face tremendous pressure to reduce emissions, which is higher than the world average. Moreover, carbon emissions of mature urban–rural fringe areas are smaller than those in the early development areas. Second, from the perspective of carbon emissions bills, production emissions account for the largest proportion of carbon sources. Although development of the industry is a key factor in the development of mixed-use communities, the rapid development of industrial production, tourism and holiday, trade and logistics industries consume a large amount of energy and materials, directly leading to carbon emissions. Most carbon emissions can be solved in the region with green spaces that absorb carbon emissions, which is greatly related to the high proportion of green space in mixed-use communities. Third, spatial distributions of carbon emissions in mixed-use communities exhibit shared characteristics. The carbon emission space of mixed-use communities can be summarized as spatial distribution characteristics, including planning structure decisiveness, road orientation, public service facility directionality, and industrial linkage. Fourth, from the perspective of industrial classification, industrial communities produce the highest carbon emissions, which are considerably larger than other communities, modern logistics, residential integration, and tourism vacation. Tourist resort communities mostly emitted in the free and random low-density form, whereas the communities dominated by industrial production, mostly dense, have high carbon emissions and strong linkages. In communities with modern planning, their carbon emissions are spatially distributed in a square format. The fitting results of the carbon emission driving force analysis model based on the PLS model are shown to be accurate. The material energy consumption dimension contributes predominantly to the driving force of carbon emission spatial distribution, followed by the established space, social life, and industrial economic dimensions. The fuel consumption per unit of land is the greatest factor that affects carbon emissions.
This study is limited by the data provided. Most of the data was processed twice, and the carbon emission value is unlikely to be completely consistent with the actual situation, which may lead to deviations in the analysis results of this study. In addition, the evaluation of carbon emissions in the spatial dimension is the focus of this study, and the analysis of the time dimension needs to be further deepened and improved in future work.

Author Contributions

Conceptualization, X.Z. and W.G.; methodology, T.Z. and X.Z.; validation, D.M. and T.Z.; formal analysis, T.Z.; investigation, D.M.; resources, X.Z. and W.G.; writing—original draft preparation, T.Z.; writing—review and editing, X.Z.; supervision, W.G.; funding acquisition, X.Z. All authors have read and agreed to the published version of the manuscript.

Funding

This research was funded by the National Natural Science Fund of China (grant No.:51878613), Humanities and Social Science Project of Chinese Ministry of Education (grant No.:17YJAZH136), the Fundamental Research Funds for the Provincial Universities of Zhejiang (grant No.: GB201901003), and the Natural Science Fund of Zhejiang Province (grant No.:LY16E08011).

Conflicts of Interest

The authors declare no conflicts of interest.

References

  1. Intergovernmental Panel on Climate Change. Global Warming of 1.5 °C: An. IPCC Special Report on the Impacts of Global Warming of 1.5 °C Above Pre-industrial Levels and Related Global Greenhouse Gas. Emission Pathways, in the Context of Strengthening the Global Response to the Threat of Climate Change, Sustainable Development, and Efforts to Eradicate Poverty; Intergovernmental Panel on Climate Change: Geneva, Switzerland, 2018. [Google Scholar]
  2. Green, F.; Nicholas, S. China’s changing economy: Implications for its carbon dioxide emissions. Clim. Policy. 2017, 17, 423–442. [Google Scholar] [CrossRef] [Green Version]
  3. Rosa, E.A.; Dietz, T. Human drivers of national greenhouse-gas emissions. Nat. Clim. Chang. 2012, 2, 581–586. [Google Scholar] [CrossRef]
  4. Diffenbaugh, N.S.; Singh, D.; Mankin, J.S.; Horton, D.E.; Swain, D.L.; Touma, D.; Tsiang, M. Quantifying the influence of global warming on unprecedented extreme climate events. Proc. Natl. Acad. Sci. USA 2017, 114, 4881–4886. [Google Scholar] [CrossRef] [PubMed] [Green Version]
  5. Hansen, J.; Sato, M.; Hearty, P.; Ruedy, R.; Kelley, M.; Masson-Delmotte, V.; Rignot, E. Ice melt, sea level rise and superstorms: Evidence from paleoclimate data, climate modeling, and modern observations that 2 C global warming could be dangerous. Atmos. Chem. Phys. 2016, 16, 3761–3812. [Google Scholar] [CrossRef] [Green Version]
  6. Ginsburg, N. Extended metropolitan regions in Asia: A new spatial paradigm. In The Extended Metropolis: Settlement Transition in Asia; University of Hawaii Press: Honolulu, HI, USA, 1991; pp. 27–46. [Google Scholar]
  7. Sui, D.Z.; Zeng, H. Modeling the dynamics of landscape structure in Asia’s emerging desakota regions: A case study in Shenzhen. Landsc. Urban Plan. 2001, 53, 37–52. [Google Scholar] [CrossRef]
  8. Legates, R.; Hudalah, D. Peri-urban planning for developing East Asia: Learning from chengdu, China and Yogyakarta/Kartamantul, Indonesia. J. Urban. Aff. 2014, 36 (Supppl. 1), 334–353. [Google Scholar] [CrossRef]
  9. Firman, T. Post-suburban elements in an Asian extended metropolitan region: The case of Jabodetabek (Jakarta Metropolitan Area). In International Perspectives on Suburbanization; Springer: Berlin/Heidelberg, Germany, 2011. [Google Scholar]
  10. Lin, G.C. Evolving spatial form of urban-rural interaction in the Pearl River Delta, China. Prof. Geogr. 2001, 53, 56–70. [Google Scholar] [CrossRef]
  11. Hudalah, D.; Winarso, H.; Woltjer, J. Peri-urbanisation in East Asia: A new challenge for planning? Int. Dev. Plan. Rev. 2007, 29, 503–519. [Google Scholar] [CrossRef]
  12. Igusa, K. Globalization in Asia and Local Revitalization Efforts: A view from one village one product (OVOP) movement in Oita. Retr. Feb. 2006, 18, 2015. [Google Scholar]
  13. Shi, L. A Search for Alternative Developmental Paradigm: New village movement in South Korea and rural construction in China. Sociol. Res. 2004, 4, 39–49. [Google Scholar]
  14. Côté, R.P.; Cohen-Rosenthal, E. Designing eco-industrial parks: A synthesis of some experiences. J. Clean. Prod. 1998, 6, 181–188. [Google Scholar] [CrossRef] [Green Version]
  15. Hachem-Vermette, C.; Cubi, E.; Bergerson, J. Energy performance of a solar mixed-use community. J. Sustain. Cities Soc. 2016, 27, 145–151. [Google Scholar] [CrossRef]
  16. Hertwich, E.G.; Peters, G.P. Carbon footprint of nations: A global, trade-linked analysis. Environ. Sci. Technol. 2009, 43, 6414–6420. [Google Scholar] [CrossRef] [PubMed] [Green Version]
  17. Druckman, A.; Jackson, T. The carbon footprint of UK households 1990–2004: A socio-economically disaggregated, quasi-multi-regional input–output model. Ecol. Econom. 2009, 68, 2066–2077. [Google Scholar] [CrossRef] [Green Version]
  18. Lin, S.; Wang, S.; Marinova, D.; Zhao, D.; Hong, J. Impacts of urbanization and real economic development on CO2 emissions in non-high income countries: Empirical research based on the extended STIRPAT model. J. Clean. Prod. 2017, 166, 952–966. [Google Scholar] [CrossRef]
  19. Wang, S.; Liu, X. China’s city-level energy-related CO2 emissions: Spatiotemporal patterns and driving forces. Appl. Energy. 2017, 200, 204–214. [Google Scholar] [CrossRef]
  20. Dahal, K.; Juhola, S.; Niemelä, J. The role of renewable energy policies for carbon neutrality in Helsinki Metropolitan area. Sustain. Cities Soc. 2018, 40, 222–232. [Google Scholar] [CrossRef] [Green Version]
  21. Gustavsson, L.; Joelsson, A.; Sathre, R. Life cycle primary energy use and carbon emission of an eight-storey wood-framed apartment building. Energy Build. 2010, 42, 230–242. [Google Scholar] [CrossRef]
  22. Li, J.; Liang, X.; Cockerill, T. Getting ready for carbon capture and storage through a ‘CCS (Carbon Capture and Storage) Ready Hub’: A case study of Shenzhen city in Guangdong province, China. Energy 2011, 36, 5916–5924. [Google Scholar] [CrossRef]
  23. Feng, K.; Siu, Y.L.; Guan, D.; Hubacek, K. Analyzing drivers of regional carbon dioxide emissions for China: A structural decomposition analysis. J. Ind. Ecol. 2012, 16, 600–611. [Google Scholar] [CrossRef]
  24. Cansino, J.M.; Sánchez-Braza, A.; Rodríguez-Arévalo, M.L. Driving forces of Spain’ s CO2 emissions: A LMDI decomposition approach. Renew. Sustain. Energy Rev. 2015, 48, 749–759. [Google Scholar] [CrossRef]
  25. Wang, C.; Wang, F.; Zhang, X.; Yang, Y.; Su, Y.; Ye, Y.; Zhang, H. Examining the driving factors of energy related carbon emissions using the extended STIRPAT model based on IPAT identity in Xinjiang. Renew. Sustain. Energy Rev. 2017, 67, 51–61. [Google Scholar] [CrossRef]
  26. Feng, Y.; Chen, S.; Zhang, L. System dynamics modeling for urban energy consumption and CO2 emissions: A case study of Beijing, China. Ecol. Model. 2013, 252, 44–52. [Google Scholar] [CrossRef]
  27. Ramaswami, A.; Main, D.; Bernard, M.; Chavez, A.; Davis, A.; Thomas, G.; Schnoor, K. Planning for low-carbon communities in US cities: A participatory process model between academic institutions, local governments and communities in Colorado. Carb. Manag. 2011, 2, 397–411. [Google Scholar] [CrossRef] [Green Version]
  28. Chatterton, P. Towards an agenda for post-carbon cities: Lessons from Lilac, the UK’s first ecological, affordable cohousing community. Int. J. Urban Reg. Res. 2013, 37, 1654–1674. [Google Scholar] [CrossRef] [Green Version]
  29. Charoenkit, S.; Kumar, S. Environmental sustainability assessment tools for low carbon and climate resilient low income housing settlements. Renew. Sustain. Energy Rev. 2014, 38, 509–525. [Google Scholar] [CrossRef]
  30. Wang, W.; Yang, J.; Muntz, R. STING: A statistical information grid approach to spatial data mining. In Proceedings of the VLDB 1997, Athens, Greece, 25–29 August 1997. [Google Scholar]
  31. Ye, J.; Yang, X.; Jiang, D.; Urban, M. The grid scale effect analysis on town leveled population statistical data spatialization. J. Geo-Inform. Sci. 2010, 12, 40–46. [Google Scholar] [CrossRef]
  32. Borzacchiello, M.T.; Nijkamp, P.; Koomen, E. Accessibility and urban development: A grid-based comparative statistical analysis of Dutch cities. Environ. Plan. B Plan. Des. 2010, 37, 148–169. [Google Scholar] [CrossRef] [Green Version]
  33. IPCC. 2006 IPCC guidelines for National Greenhouse Gas Inventories; IPCC: Geneva, Switzerland, 2006. [Google Scholar]
  34. Hair, J.F., Jr.; Hult, G.T.M.; Ringle, C.; Sarstedt, M. A Primer on Partial Least Squares Structural Equation Modeling (PLS-SEM); Sage Publications: Thousand Oaks, CA, USA, 2016. [Google Scholar]
  35. Wang, Z.; Yang, L. Indirect carbon emissions in household consumption: Evidence from the urban and rural area in China. J. Clean. Prod. 2014, 78, 94–103. [Google Scholar] [CrossRef]
  36. Kaya, Y. Impact of carbon dioxide emission on GNP growth: Interpretation of proposed scenarios, presentation to the energy and industry subgroup, response strategies working group. In Proceedings of the IPCC Conference, Paris, France, 30 June 1989. [Google Scholar]
  37. Li, H.; Mu, H.; Zhang, M.; Gui, S. Analysis of regional difference on impact factors of China’s energy–Related CO2 emissions. Energy 2012, 39, 319–326. [Google Scholar] [CrossRef]
  38. Wang, Z.; Yin, F.; Zhang, Y.; Zhang, X. An empirical research on the influencing factors of regional CO2 emissions: Evidence from Beijing city, China. Appl. Energy 2012, 100, 277–284. [Google Scholar] [CrossRef]
  39. Galeotti, M.; Lanza, A.; Pauli, F. Reassessing the environmental Kuznets curve for CO2 emissions: A robustness exercise. Ecol. Econom. 2006, 57, 152–163. [Google Scholar] [CrossRef]
  40. Le Quéré, C.; Andrew, R.; Friedlingstein, P.; Sitch, S.; Pongratz, J.; Manning, A.; Jackson, R. Global Carbon Budget 2017. Earth Syst. Sci. Data 2018, 10, 405–448. [Google Scholar] [CrossRef] [Green Version]
Figure 1. Map of the presented cases.
Sustainability 12 03101 g001
Figure 2. Method and model of the study framework.
Sustainability 12 03101 g002
Figure 3. Analysis of the carbon row unit space grid of the study case.
Sustainability 12 03101 g003
Figure 4. Color separation cartogram of carbon emissions.
Sustainability 12 03101 g004
Figure 5. Parallel line diagram of carbon emission bills.
Sustainability 12 03101 g005
Figure 6. Dynamic analysis chart of carbon emissions
Sustainability 12 03101 g006
Table 1. Mixed-use communities in East Asia.
No.Case LocationLandformTypeDevelopment DegreeBuilt-Up Density
A-1Songhu, ChinaPlainIndustrialMID72.5%
A-2Shanhuli, ChinaRiverlandIndustrialMID71.8%
A-3Liushi, ChinaRiverlandIndustrialLATE79.6%
A-4Kusu district, JapanRiverlandIndustrialLATE62.8%
A-5Xucun, ChinaPlainIndustrialLATE78.6%
B-1Dafen, ChinaPlainCommercialMID59.2%
B-2Jiujiang, ChinaRiverlandCommercialLATE83.5%
B-3Chuangjiang, ChinaBasinCommercialMID68.2%
B-4Jiayi, China TaiwanPlainCommercialLATE73.1%
B-5Dali Art, China, TaiwanPlainCommercialMID68.1%
C-1Muikamachi, JapanRiverlandTourismLATE70.6%
C-2Gamcheon, KoreaHillTourismLATE65.3%
C-3Longwu, ChinaHillTourismINITIAL50.16%
C-4Yucun, ChinaHillTourismMID73.2%
C-5North Village, KoreaHillTourismMID70.6%
D-1Mailiao, China, TaiwanHillRental-apartmentMID62.1%
D-2Gonguan, China, TaiwanHillRental-apartmentMID71.3%
D-3Chengyiyuan, ChinaBasinRental-apartmentLATE76.2%
D-4Luojiazhuang, ChinaRiverlandRental-apartmentMID64.8%
D-5Putuoxishan, ChinaCoastRental-apartmentINITIAL52.1%
Table 2. Carbon emission driving factors.
Primary IndicatorSecondary IndicatorsIndependent Variable
Established space indexBuilt-up density (%)X1
Municipal distribution (㎡)X2
Floor area ratioX3
Green rate (%)X4
Industrial economic indexPer capita economic income ($)X5
Leading industry concentration (%)X6
GDP per unit land ($/ha)X7
Material consumption indexElectricity consumption per unit land (kilowatt-hour /ha)X8
Water consumption per unit land (t/ha)X9
Fuel consumption per unit land (kJ/ha)X10
Production and living material consumption per unit land (t/ ha)X11
Social behavior indexPopulation fluctuation rate (%)X12
Population per unit land X13
Employment-to-living ratio (%)X14
Green traffic ratio per capita (%)X15
Table 3. VIP for carbon emission driving factors.
VAR IDVIP
Fuel energy consumption per unit of land1.4932
Electricity consumption per unit of land1.43228
Built-up density1.19309
Floor area rate1.15503
Employment-to-Living Ratio1.13881
Production and living materials per unit of land1.07908
Population per unit of land0.955784
Green rate0.955784
Green transportation ratio per capita 0.896847
Water consumption per unit of land0.872799
GDP per soil unit0.867382
Municipal distribution0.833209
leading industries concentration0.639332
Population fluctuation rate0.638946
Economic income per capita0.551304

