1. Introduction
Climate change is the greatest challenge facing humanity. All the agents involved, from leaders to citizens, must become aware of the problem and join efforts in the fight against global warming. All countries must agree on mitigation measures against climate change that involve ambitious targets for reducing greenhouse gases. To reach the Paris agreement and limit the temperature increase to 2 °C by the end of the century, or to 1.5 °C if possible, a major shift is needed in current energy policy towards a low-carbon economy, where on the one hand the share of renewables in the current energy mix is enhanced and on the other hand the energy efficiency of energy systems is increased [
1,
2,
3]. Universities, within the framework of their social and environmental responsibility, cannot stay away from these objectives [
4,
5]. Universities, research centers, and institutions are the starting point of research in renewable energy knowledge and practice. These institutions have carried out several projects on renewable energy sources (RES), like the proposal on compressed air as reserve energy, made at the University of Auckland in New Zealand [
6]. Zhou et al. [
7] and the Ocean University of China (OUC) developed a methodology based on the study of the dynamic characteristics of an actual Offshore Wind Turbines (OWT) in different operational states based on sea tests to determine the negative impact on their structures. In Tokat Gaziosmanpasa University, Emeksiz and Cetin [
8] analyzed the effects of tower shadow disturbance and wind shear variations. In this study, they determined that the x distance is the most correlated parameter on the tower shadow disturbance problem. Karasmanaki and Tsantopoulos [
9] researched the attitude of RES students in the Department of Forestry and Management of the Environmental and Natural Resources at the Democritus University of Thrace in Greece since they are possible experts in RES, and the results show that students support renewables and have awareness about current polluting energy systems. Tran and Smith [
10] developed an analysis on renewable energy systems integration and uncertainty to meet the three major types of energy consumption: Electricity (solar photovoltaic and wind), heating (combined heat and power) and cooling (electricity) at facilities on the campus of the University of Utah. They found that the uncertainty of energy loads and power generation from renewable energy heavily affects the operating cost of the district energy system.
Arnaout et al. [
11] explain that the Heriot-Watt University Malaysia (HWUM) has a unique roof design that could be utilized as part of the Building-integrated photovoltaics (BIPV) system to generate electricity, thereby reducing the carbon footprint of the facility. This system is an innovative green solution that makes possible energy generation on the building facade with modification of the building material or architectural structure.
Sierra et al. [
12], during characterization of an 840Wp BIPV installed at the Faculty of Sciences at the National University of Colombia, found that the energy generation with coal has a greater negative environmental impact (84%) compared with the photovoltaic system (PVS) (6%), and the use of PVS represents an emission factor of 35 gCO
2eq/kWh.
A techno-economic and environmental analysis of a PVS conducted by Sulukan [
13] at the Turkish Naval Academy of the National Defense University was done. This study was carried out using the RETScreen software considering performance, efficiency, inverter efficiency, and temperature on PVS. The results of emission were a 93% reduction in greenhouse gases and a saving of 721.1 tons of crude oil.
Bilcik et al. [
14] dealt with the impact of temperature on module surfaces The experiment was conducted at the University of Life Sciences in Prague and found that the performances of photovoltaic modules depend on climatic conditions.
In Morocco, Ameur et al. [
15] evaluated different solar photovoltaic technologies (amorphous silicon (a-Si), Polycrystalline silicon (pc-Si) and Monocrystalline silicon (mc-Si)) connected to a low voltage three phases electrical grid of Al Akhawayn University. The results show that the polycrystalline panel is the most cost-effective technology.
Silveira et al. [
16] presented an economic study about electric power generation using PSV in a Brazilian university with the aim of reducing the electric consumption. The results show that with the PSV, the tariff can be reduced by 39.9%.
Mukherji et al. [
17] present a techno-economic and ecological analysis of a 50 kWp rooftop solar photovoltaic plant installed at ICFAI University, Jaipur where the plant produced 106.9 kWh/kWp/month, and the reductions in greenhouse gases obtained were 102tCO
2, 128 kg SO
2, 268 kg NOx and 7033 kg ash.
Oh and Park [
18] analyzed the optimal orientation of solar panels, and the analysis was performed regarding demand and supply electricity at the Seoul National University. Their results show that orientation is very important and depends on the building’s architecture. The output generation presented a low electricity demand in the evening, but monthly demand shows a pattern opposite to solar power generation.
At the Marmara University in Istanbul, a study done by Akpolat et al. [
19] demonstrates that the installation of grid-connected rooftop solar photovoltaic systems of 84.75 kW can produce several benefits and an annual electrical savings of 90,298 kWh.
Another study was done by Al-Najideen et al. [
20] at the faculty of Engineering-Mu’tah in University of Jordan in order to reduce the electricity demand with a 56.7 kW grid-connected PVS. The results show that this PVS will produce 97.02 MWh per year, with an investment of 117,000 USD and a payback period of 5.5 years.
A hybrid system composed by a photovoltaic (PV) panel, wind turbine, and storage batteries installed in Yildiz Technical University is analyzed by Arikan et al. [
21] and determines the most accurate system sizing using the maximum power point tracking controller, a hybrid controller, and an inverter.
An Artificial Neural Network (ANN) methodology for studying and modeling the soiling effect on solar PV glass has been done by Laarabi et al. [
22]. They exposed outdoor solar PV glazing at Mohammed V University in Rabat (Morocco), and found that the most influential parameter for the PV soiling rate was relative humidity, followed by wind direction.
An ensemble approach to predict solar PV power production has been proposed by Al-Dahidi et al. [
23]. This ensemble approach has the capability of handling the intermittent nature of solar energy. They demonstrated it using a grid-connected solar PV system of 231 kW of capacity installed on the rooftop of the Faculty of Engineering at the Applied Science Private University of Jordan and it was determined that this methodology could allow for balancing power supplies. Since the installation of rooftop PV arrays is increasing, many standards have been designed, like the study done by Bender et al. [
24] at Central Washington University (CWU) where they present one calibration done at the rooftop of CWU.
According to Wen [
25], the interaction between the University-Firm-Government linkage has been discussed several times. In the special case of the solar photovoltaic industry in Taiwan, he found that this industry is essential for the development of the University-Firm-Government linkage.
As it can be seen in many universities studies about RES which have been done, with these efforts, institutions contribute to developing these systems, because in the end, the main objective of renewable energy is to create development where there is none and increase it where there is. RES faces some problems. One of them is this premise: where there is no price for carbon emissions, there is no reason to reduce carbon [
26]. This premise is not related to a very important decision-making variable called sustainability, which it can be defined as the use of today’s resources without compromising the ability of future generations to be at least as well off as we are [
27]. Several authors coincide that sustainability is a concept with many interpretations, including economic, environmental and social ones, and complete sustainability requires all of them. This is also referred to as the triple-bottom-line [
28,
29,
30].
In 1990, in France, a statement made by university presidents, chancellors, and rectors commited to environmental sustainability in higher education. This statement was called the Talloires Declaration (TD) and has ten actions to incorporate sustainability into institutions [
31,
32,
33,
34].
There is a ranking that grouped 619 worldwide universities and awards the best sustainable policies incorporated in these universities. This is the
UI GreenMetric World University Ranking, which gives basic information about the university’s policy towards a green environment. Its aim is to trigger the participating university to provide more space for developing sustainable energy [
35]. From the results of this ranking, 11 Mexican universities are in different positions; the most important Mexican University is the National Autonomous University of Mexico (UNAM) and is in 101st place from 619 universities worldwide.
UNAM developed a macro project for the transformation of the University into a model of efficient and intelligent energy use, by which it is expected to obtain electricity savings ranging from 20 and 30 percent by using solar, biomass, and hydrogen energy, as well as the promotion of green culture.
With the title of “The University City and Energy”, the macro project, which can serve as an example to other communities in the country, includes 21 projects contained in 6 research lines, highlighting the creation of public lighting with solar energy, saving electric energy with the use of photovoltaic technology, and using the prototype of a multifunctional ecological vehicle and a virtual classroom for learning and teaching on the subject, among other things.
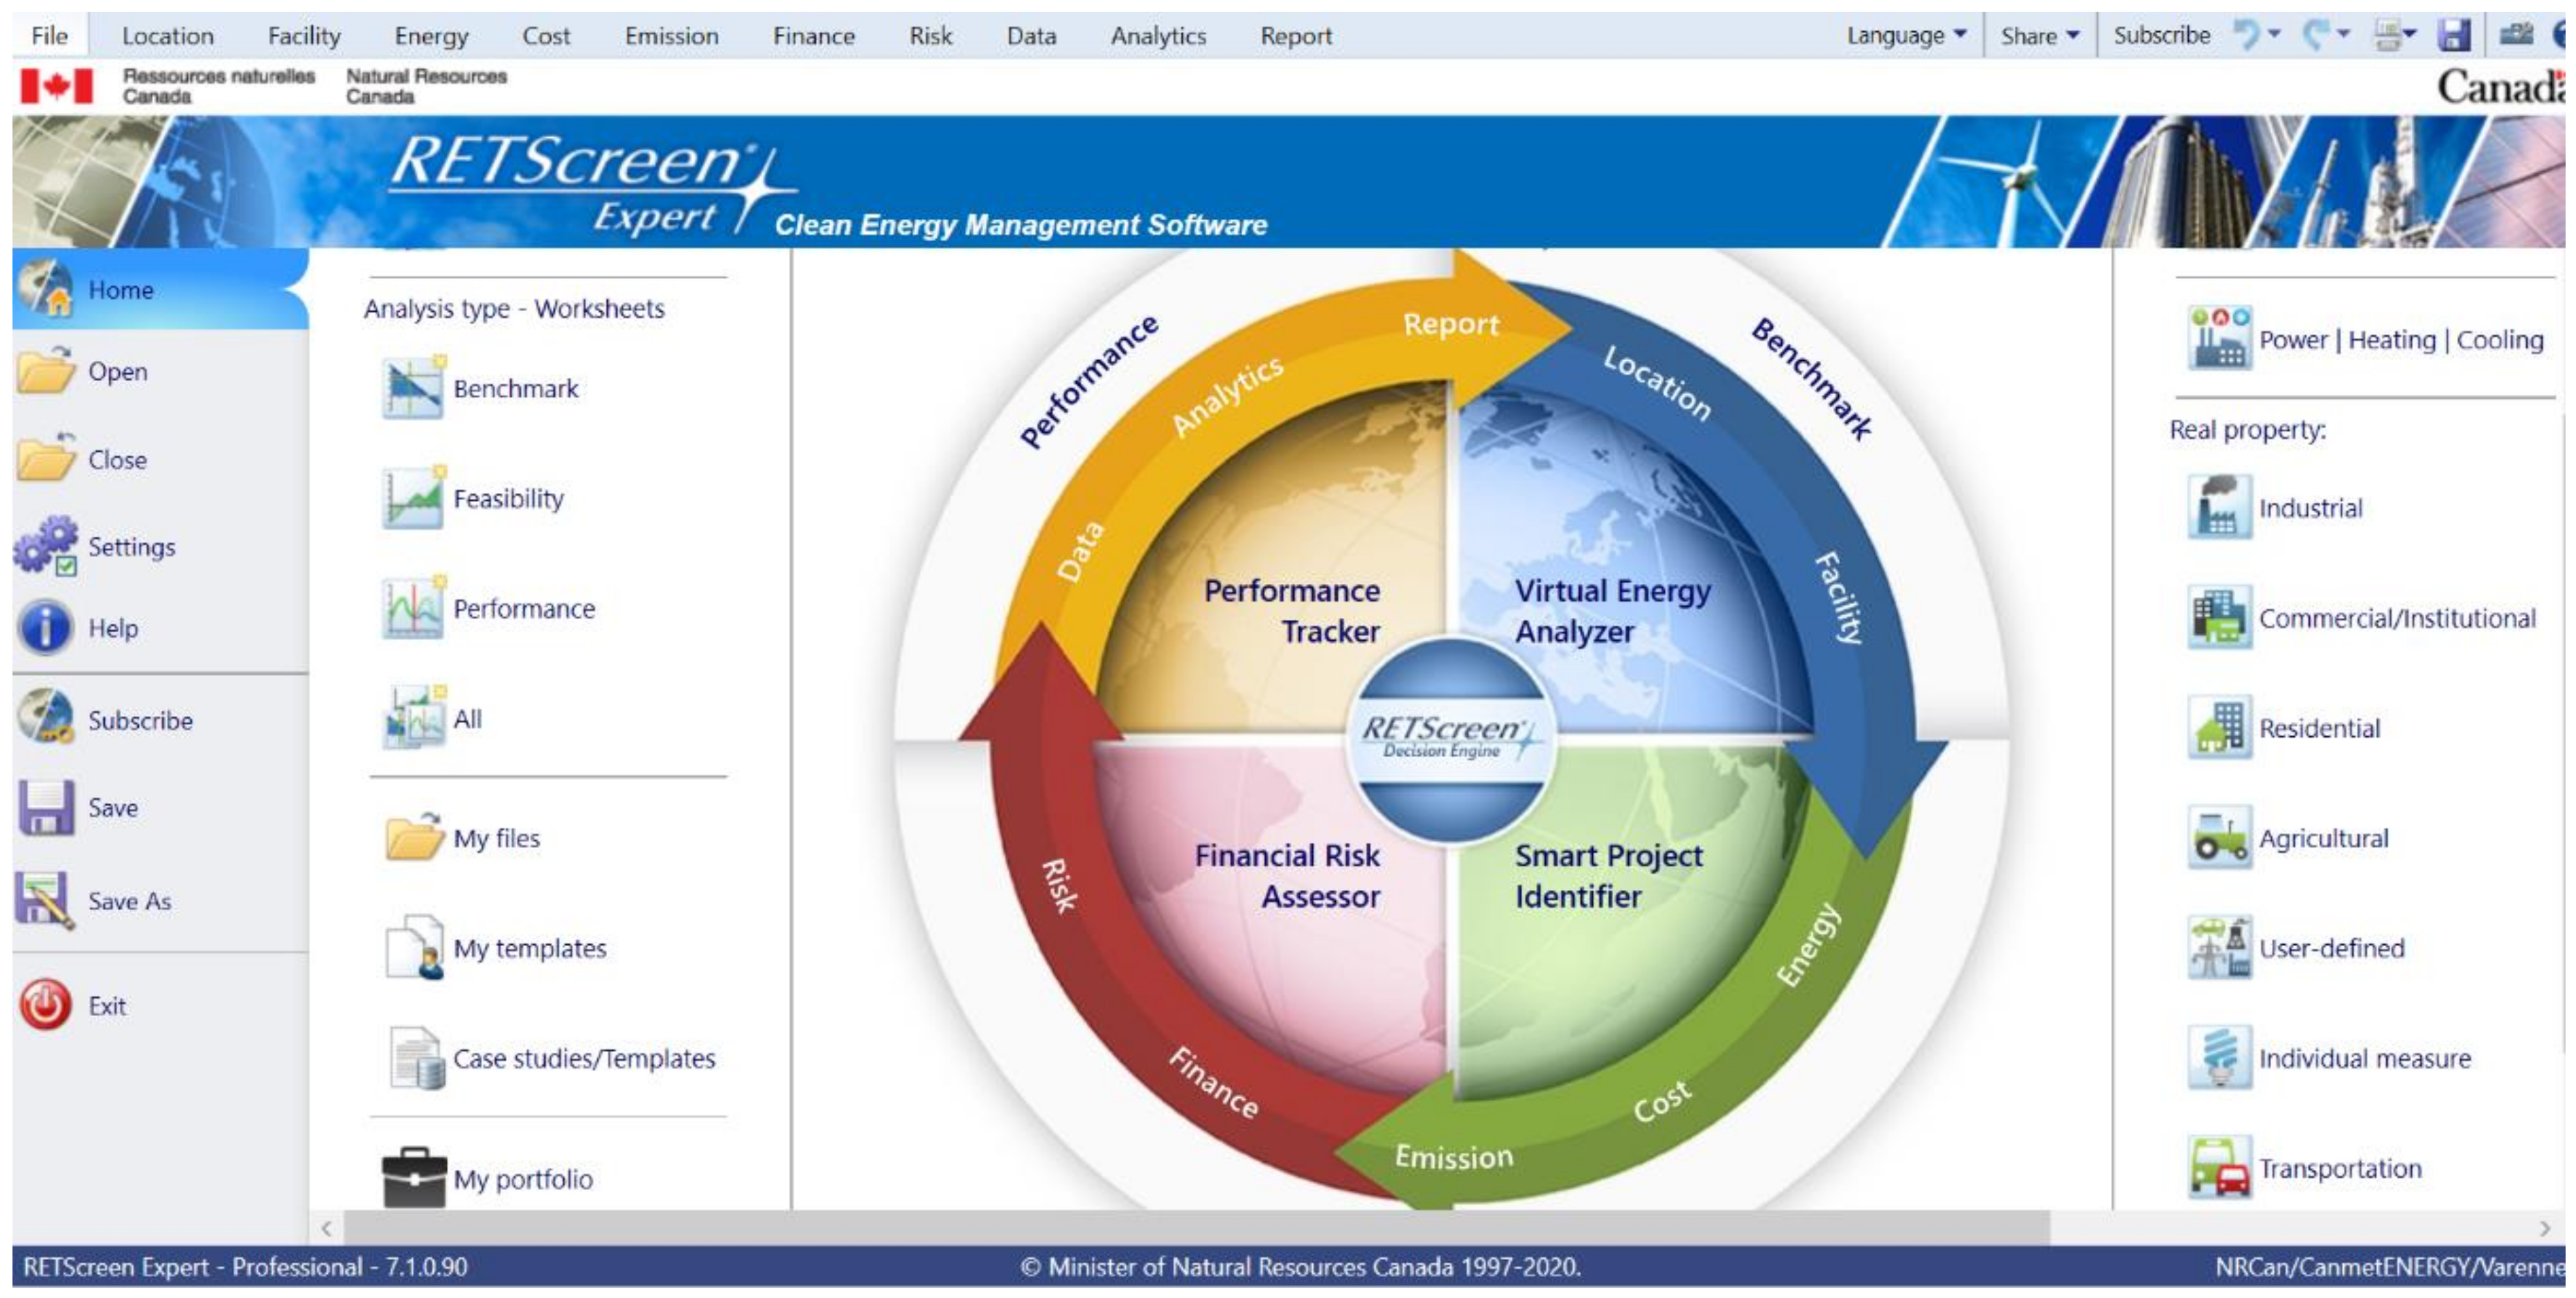
In this work, the software RETScreen is used, which will help to determine both the technical and economic feasibility of the study. RETScreen is a Clean Energy Management Software system for energy efficiency, renewable energy, and cogeneration project feasibility analysis, as well as ongoing energy performance analysis. It is developed by Canada’s government through the Natural Resources Canada office.
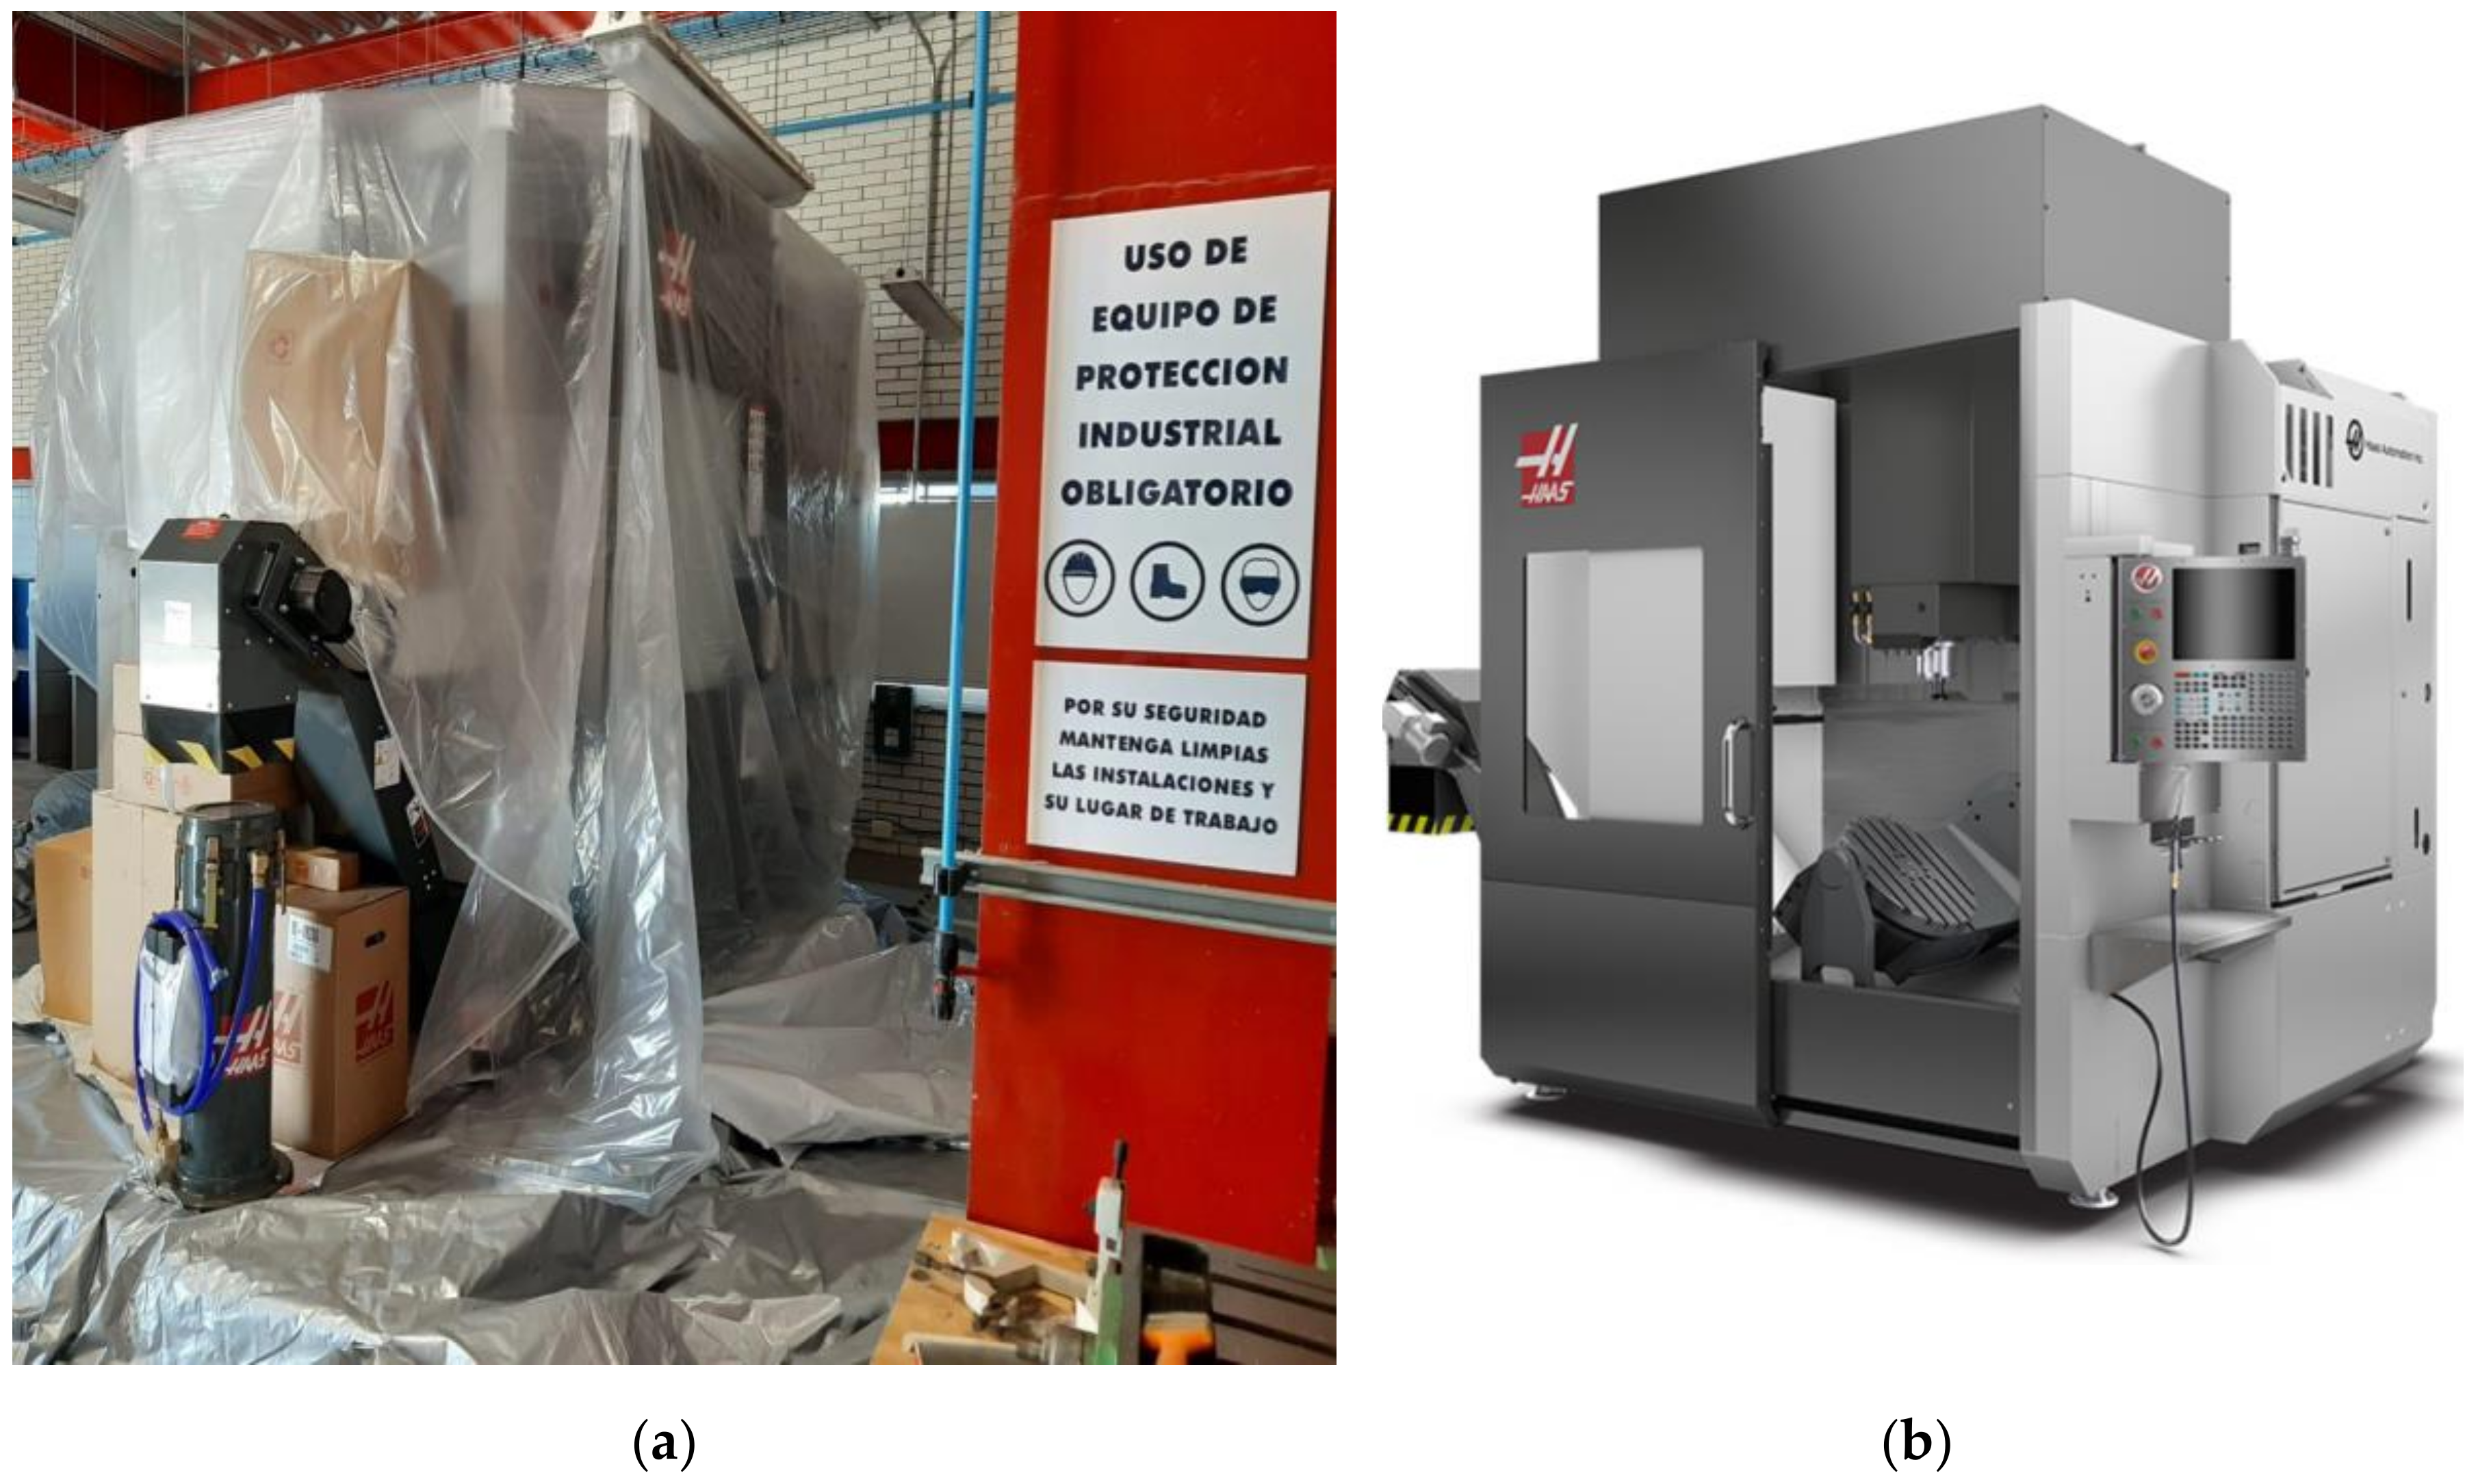
UNAM has some campuses outside of Mexico City. One of them is the National School of Higher Studies Juriquilla (ENES-J) in the state of Queretaro, where there is the Orthotics and Prosthetics Laboratory (OPL), in which has been installed a Computer Numerical Control (CNC) machine type Haas Automation model UMC-750, which has 5-axis and is an effective means to reduce setups and increase accuracy for multi-sided and complex parts. This machine will be used to design, build, and assess human prosthesis.
The Kyoto Protocol has established three mechanisms: The Clean Development Mechanism (CDM), Joint Implementation (JI), and Emissions Trading (ET), which allow parties to pursue opportunities to cut emissions or enhance carbon sinks abroad. The cost of curbing emissions varies considerably from region to region, and therefore it makes economic sense to cut emissions where it is cheapest to do so, given that the impact on the atmosphere is the same [
36]. It is important to mention that a project can be evaluated as CDM if the project is planned in a developed country.
The main objective of this work is to contribute to sustainability policies at the ENES-J from UNAM implementing a solar photovoltaic system to deliver electricity to the grid and contribute to reducing the electricity load at the Orthotics and Prosthetics Laboratory (OPL), as well to propose new research lines to support the sustainability policies in universities and proposing a financial analysis.
In the following section, the materials and methods are described. In
Section 3, the results and discussion are presented. Finally,
Section 4 presents the main conclusions and future research lines.
2. Materials and Methods
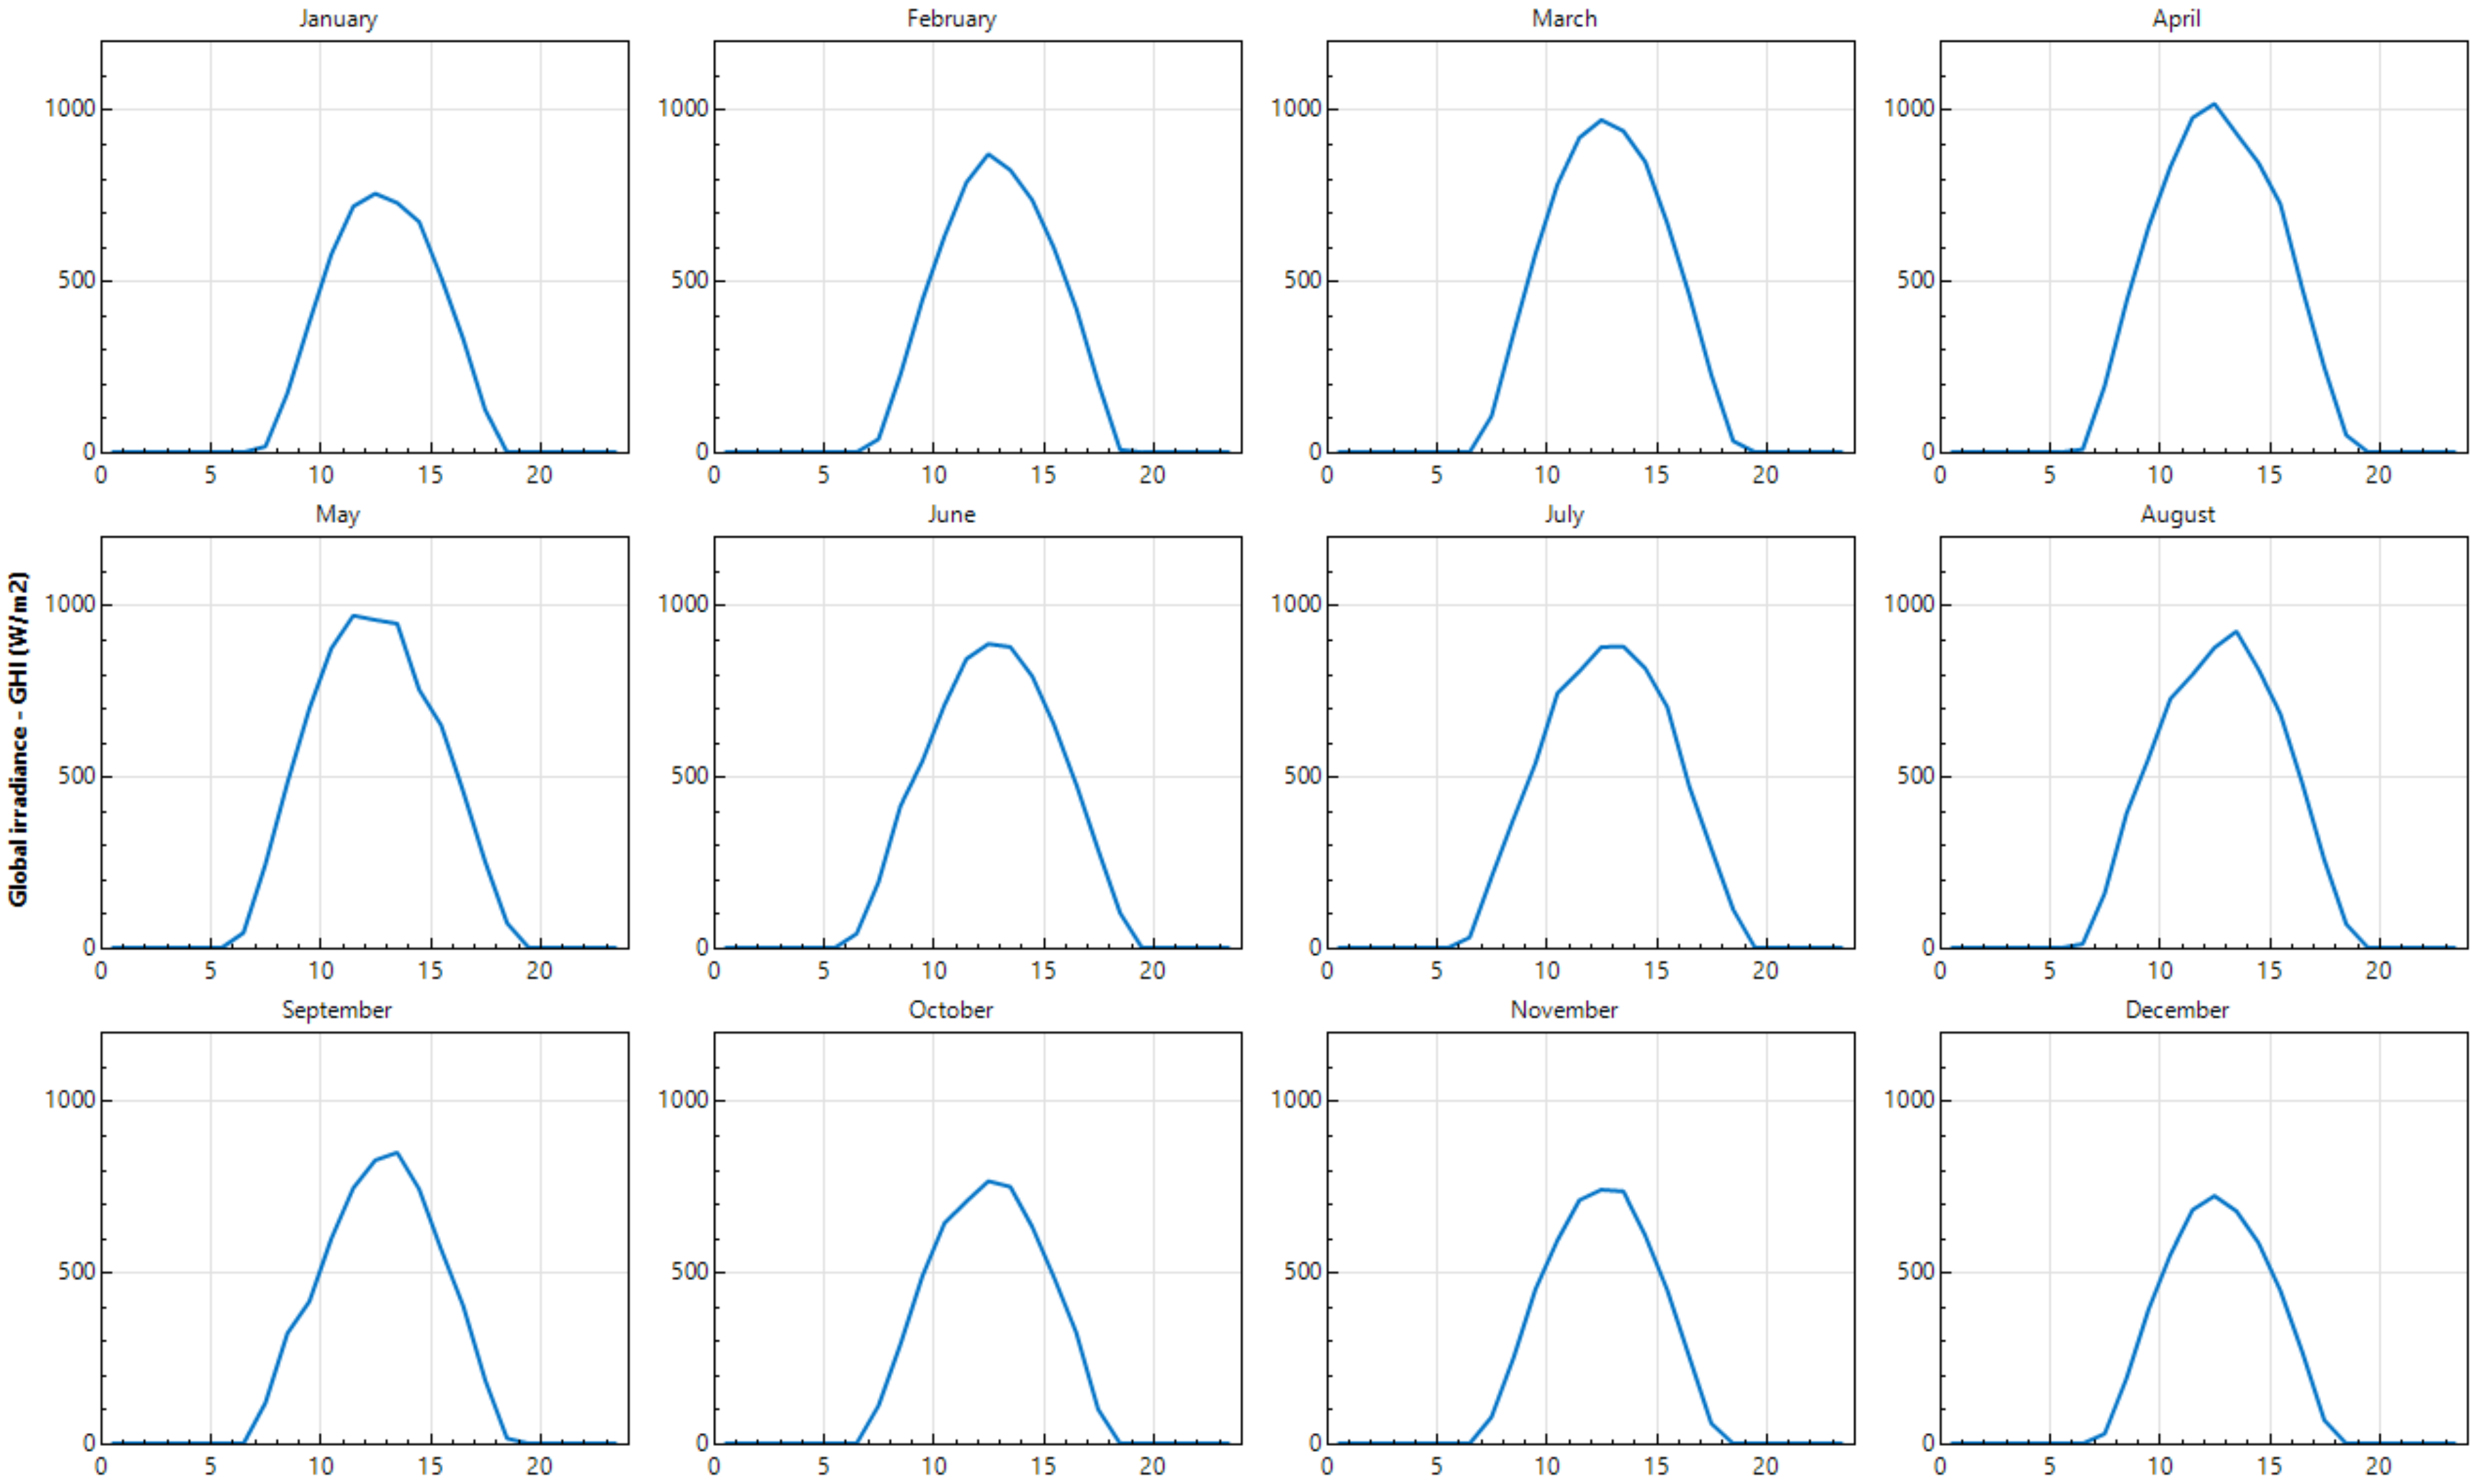
The average solar irradiation recorder in the area studied is 6.1 kWh/m2/day with an average global horizontal irradiance (GHI) of 800 W/m2. The PVS has been designed to contribute with the CNC machine type Haas Automation model UMC-750 electric load and could be applied to any site when data are known.
Figure 1 shows both, the Computer Numerical Control (CNC) machine type Haas Automation model UMC-750 arriving at the Orthotics and Prosthetics Laboratory (OPL) and an image obtained from the machine’s website.
All the electric energy at the National School Higher Studies in Queretaro is delivered by the electric grid; in this case, the PVS show both economic and technical benefits.
The electric load demanded by the CNC machine is presented in
Table 1.
With the electric load presented in
Table 1, the electric rate will be the highest one, named Domestic High Consumption Tariff (DHCT), which means that it is the one with the highest prices; the load is in AC.
The ENES-J belongs to UNAM and is located in the city of Queretaro in central Mexico. This city is a semidesert zone, with an average temperature of 16.4 °C during the year. The maximum temperature is 28 °C in April and May, and the minimum is 6 °C in January [
37]. In
Figure 2 is shown the geographic position of Queretaro Mexico.
Data are extracted from the Synoptic Meteorological Station (SMS) that belongs to the National Weather Service (NWS) of Mexico. In the state of Queretaro, there is one SMS, and this meteorological station delivers data every 10 minutes. The process of recording data is as follows: the data acquirer is programmed to record data every 2 seconds and after 10 minutes delivers an average. The variables registered are wind speed, wind direction, air temperature, atmospheric pressure, rain, relative humidity, and solar radiation. This last one is our focus of study.
Table 2 shows the main characteristics of these meteorological stations.
2.1. Modelling the Energy
The software RETScreen has been applied in several studies on renewable energy to determine their feasibility [
38,
39,
40,
41,
42]. RETScreen rapidly identifies, assesses and optimizes the technical and financial viability of potential clean energy projects. This decision intelligence software platform also allows managers to easily measure and verify the actual performance of their facilities and helps find additional energy savings/production opportunities [
43].
Figure 3 shows how the software looks and the variables taken into the assessment.
The workflow shown in
Figure 3 represents the model used by the software. The data set is the first variable needed, followed by location and facility, the energy project, costs, and emission analysis, then both financial and risk analyses are done.
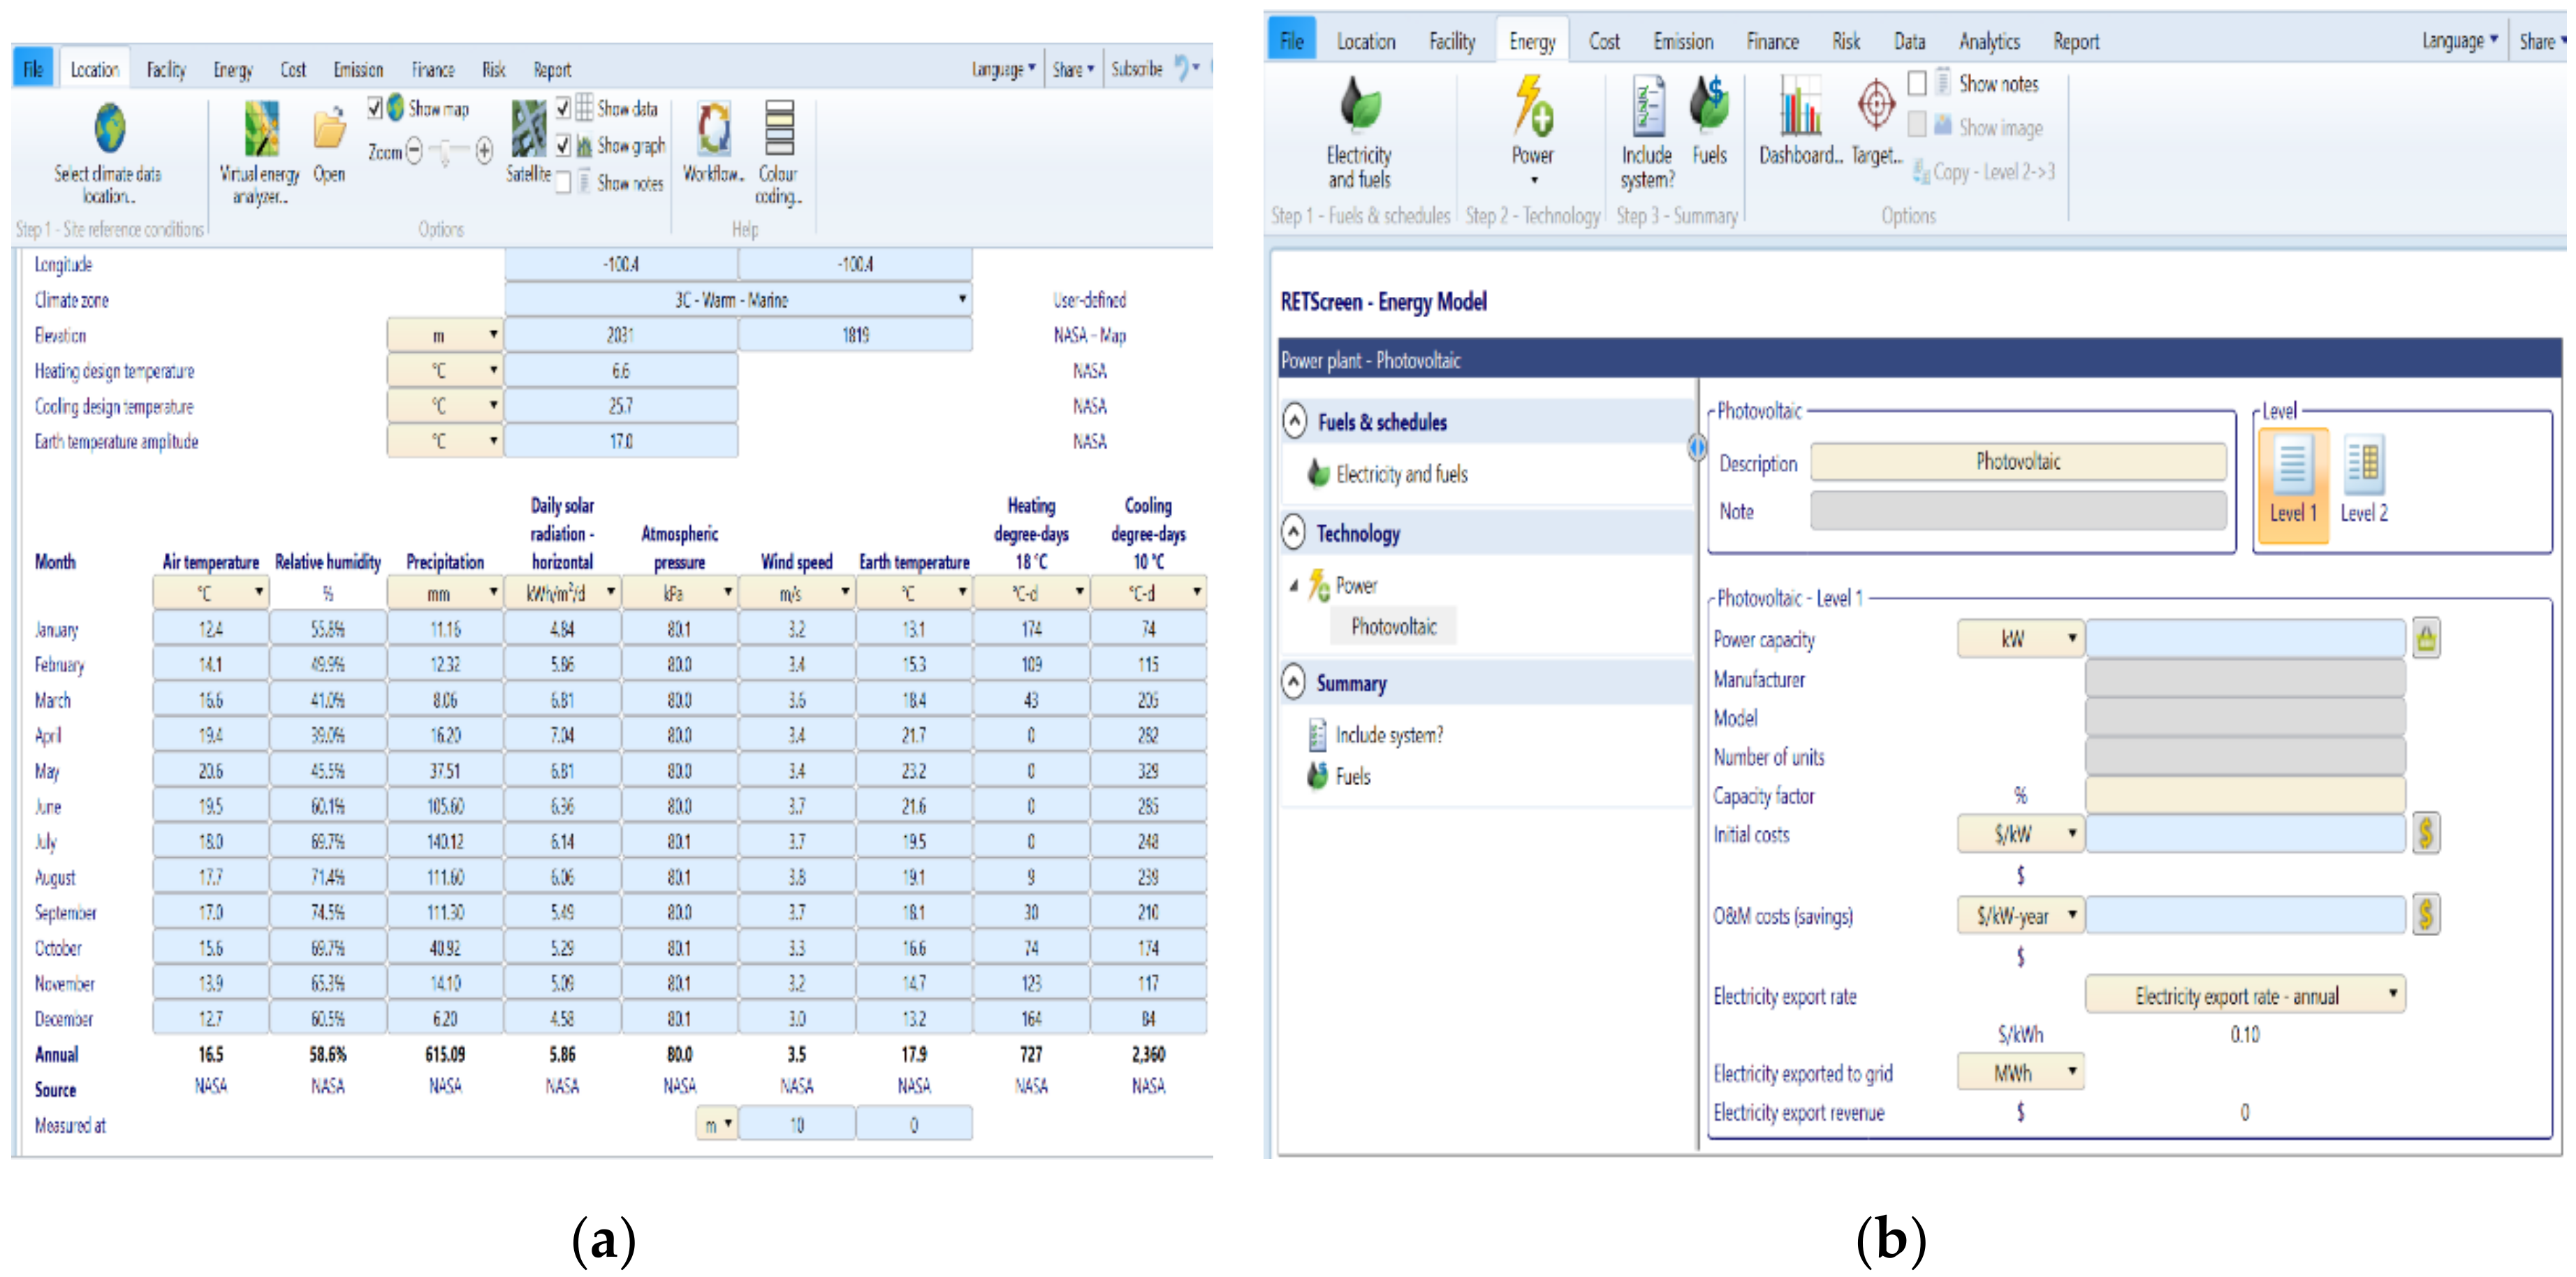
Figure 4 shows the data used and technology selected in the software.
Data used in the study are included in the location module (see
Figure 4a). The technology used is added in the energy module, as seen in
Figure 4b. As we can see in this last figure, the manufacturer, model, number of solar panels, initial costs, and other variables must be included.
2.2. Solar Assessment
The solar global irradiance assessment considers the variable which is most important to calculate a PVS [
44]. Through the photoelectric principle, solar irradiation is converted into electrical energy and can be delivered to consumers. An inverter alternative current (AC) can be used, or a direct current (DC).
The PVS equipment includes a PV panel, a load regulator to regulate the voltage generated by the PV panel (this load regulator can perform a charge cycle on deep cycle batteries), and the protection systems.
PVS Requirements
One we defined the PVS, these recommendations must be followed:
Charges calculation: in this section, the charges must be defined (AC or DC), with useful time and quantity. These data can determine the installed capacity, kiloWatt, (kW) and consumption, kiloWatt-hour, (kWh).
Solar sizing: determining sun peak hours (SPH) or irradiation (kWh/m2/day) with data obtained from AMSs.
Power, voltage, current and panel area.
Determining the number of PVs using Equations (1) and (2).
where
E is the real energy consumption in kWh,
ET is the theoretical energetic consumption in kW,
R is a proportional constant that includes losses related in the batteries use, inverters and electrical wiring, commonly its value is 0.8,
NP is the number of PV,
SPH are sun peak hours, and
Wp is the PVS peak power.
Inverter selection: the inverter will be in the function of the charge and operation.
To determine the correct position of the PVS, some variables need to be considered, such as the solar declination angle (δ) that can be defined as the angle formed by the plane that contains the axis of terrestrial rotation and the plane perpendicular to the elliptic [
45]. The solar declination angle is positive in the North and varies between −23.45° ≤ δ ≤ 23.45°. Its highest value is on June 21, and its lowest on December 22 [
46]. The expression of the solar declination angle in Equation (3) includes Julian days,
n.
The angle formed with respect to the equator is called the latitude angle (ϕ) and is considered positive in the North and negative in the South, its value being between −90° ≤ ϕ ≤90°.
The hour angle (ω) is formed by solar rays and the meridional plane at the site. The measure is from the meridional plane, in which the position of the Sun at 12:00 h has a ω = 0°. In the East is positive and in the West is negative, the position of the Sun at 6:00 h, ω = 90°, at 18:00 h, ω = −90°. The hour angle is given by Equation (4).
where
t is time in hours in decimal.
The angle between the horizontal plane and PVS is known as the optimum angle (β), and this angle needs to be oriented at the South in the North hemisphere. This angle has values from 0° ≤ β ≤ 180° and can be expressed by Equation (5).
The PVS power output components such as module operating temperature and its nominal efficiency (
ηref) depend on the environmental conditions, as well as the optimum output (
ηPV). The Mexican solar abridgment [
47] establishes that the PV module
ηPV is a function of
ηref, the temperature of the cell
TC, the module power temperature coefficient β
ref (which is considered between −0.3% to −06% per °C) [
48], and the standard temperature
Tstc; this last one is provided by the manufacturer. With these conditions, the PVS efficiency can be calculated by Equation (6).
To calculate
TC, in Equation (7), is necessary to have the air temperature of the site
Ta and the solar radiation
Irad, as well as the nominal operating cell temperature (NOCT) provided by the manufacturer.
The PV power output module is expressed by Equation (8).
where
Gstc is the irradiance at standard conditions whose value is 1 kW/m
2, and
Pmax,sct is the cell maximum power at standard test conditions.
2.3. Inverter
Inverters are electric and electronic equipment developed to transform DC into AC. The inverters interconnected to the electric grid need to consider the grid electric characteristics such as voltage and frequency.
According to the Mexican standard NOM-001-SEDE-1999, the inverter nominal capacity could be between 75% to 80% of the PVS nominal capacity, because of temperature losses, electric wiring, shadowed and mismatch of the system. The inverter input voltage in PVS interconnected to the grid must be higher than 100 VDC. Additionally, it is recommended to use a maximum interconnection voltage in AC of 13% above the grid’s nominal voltage.
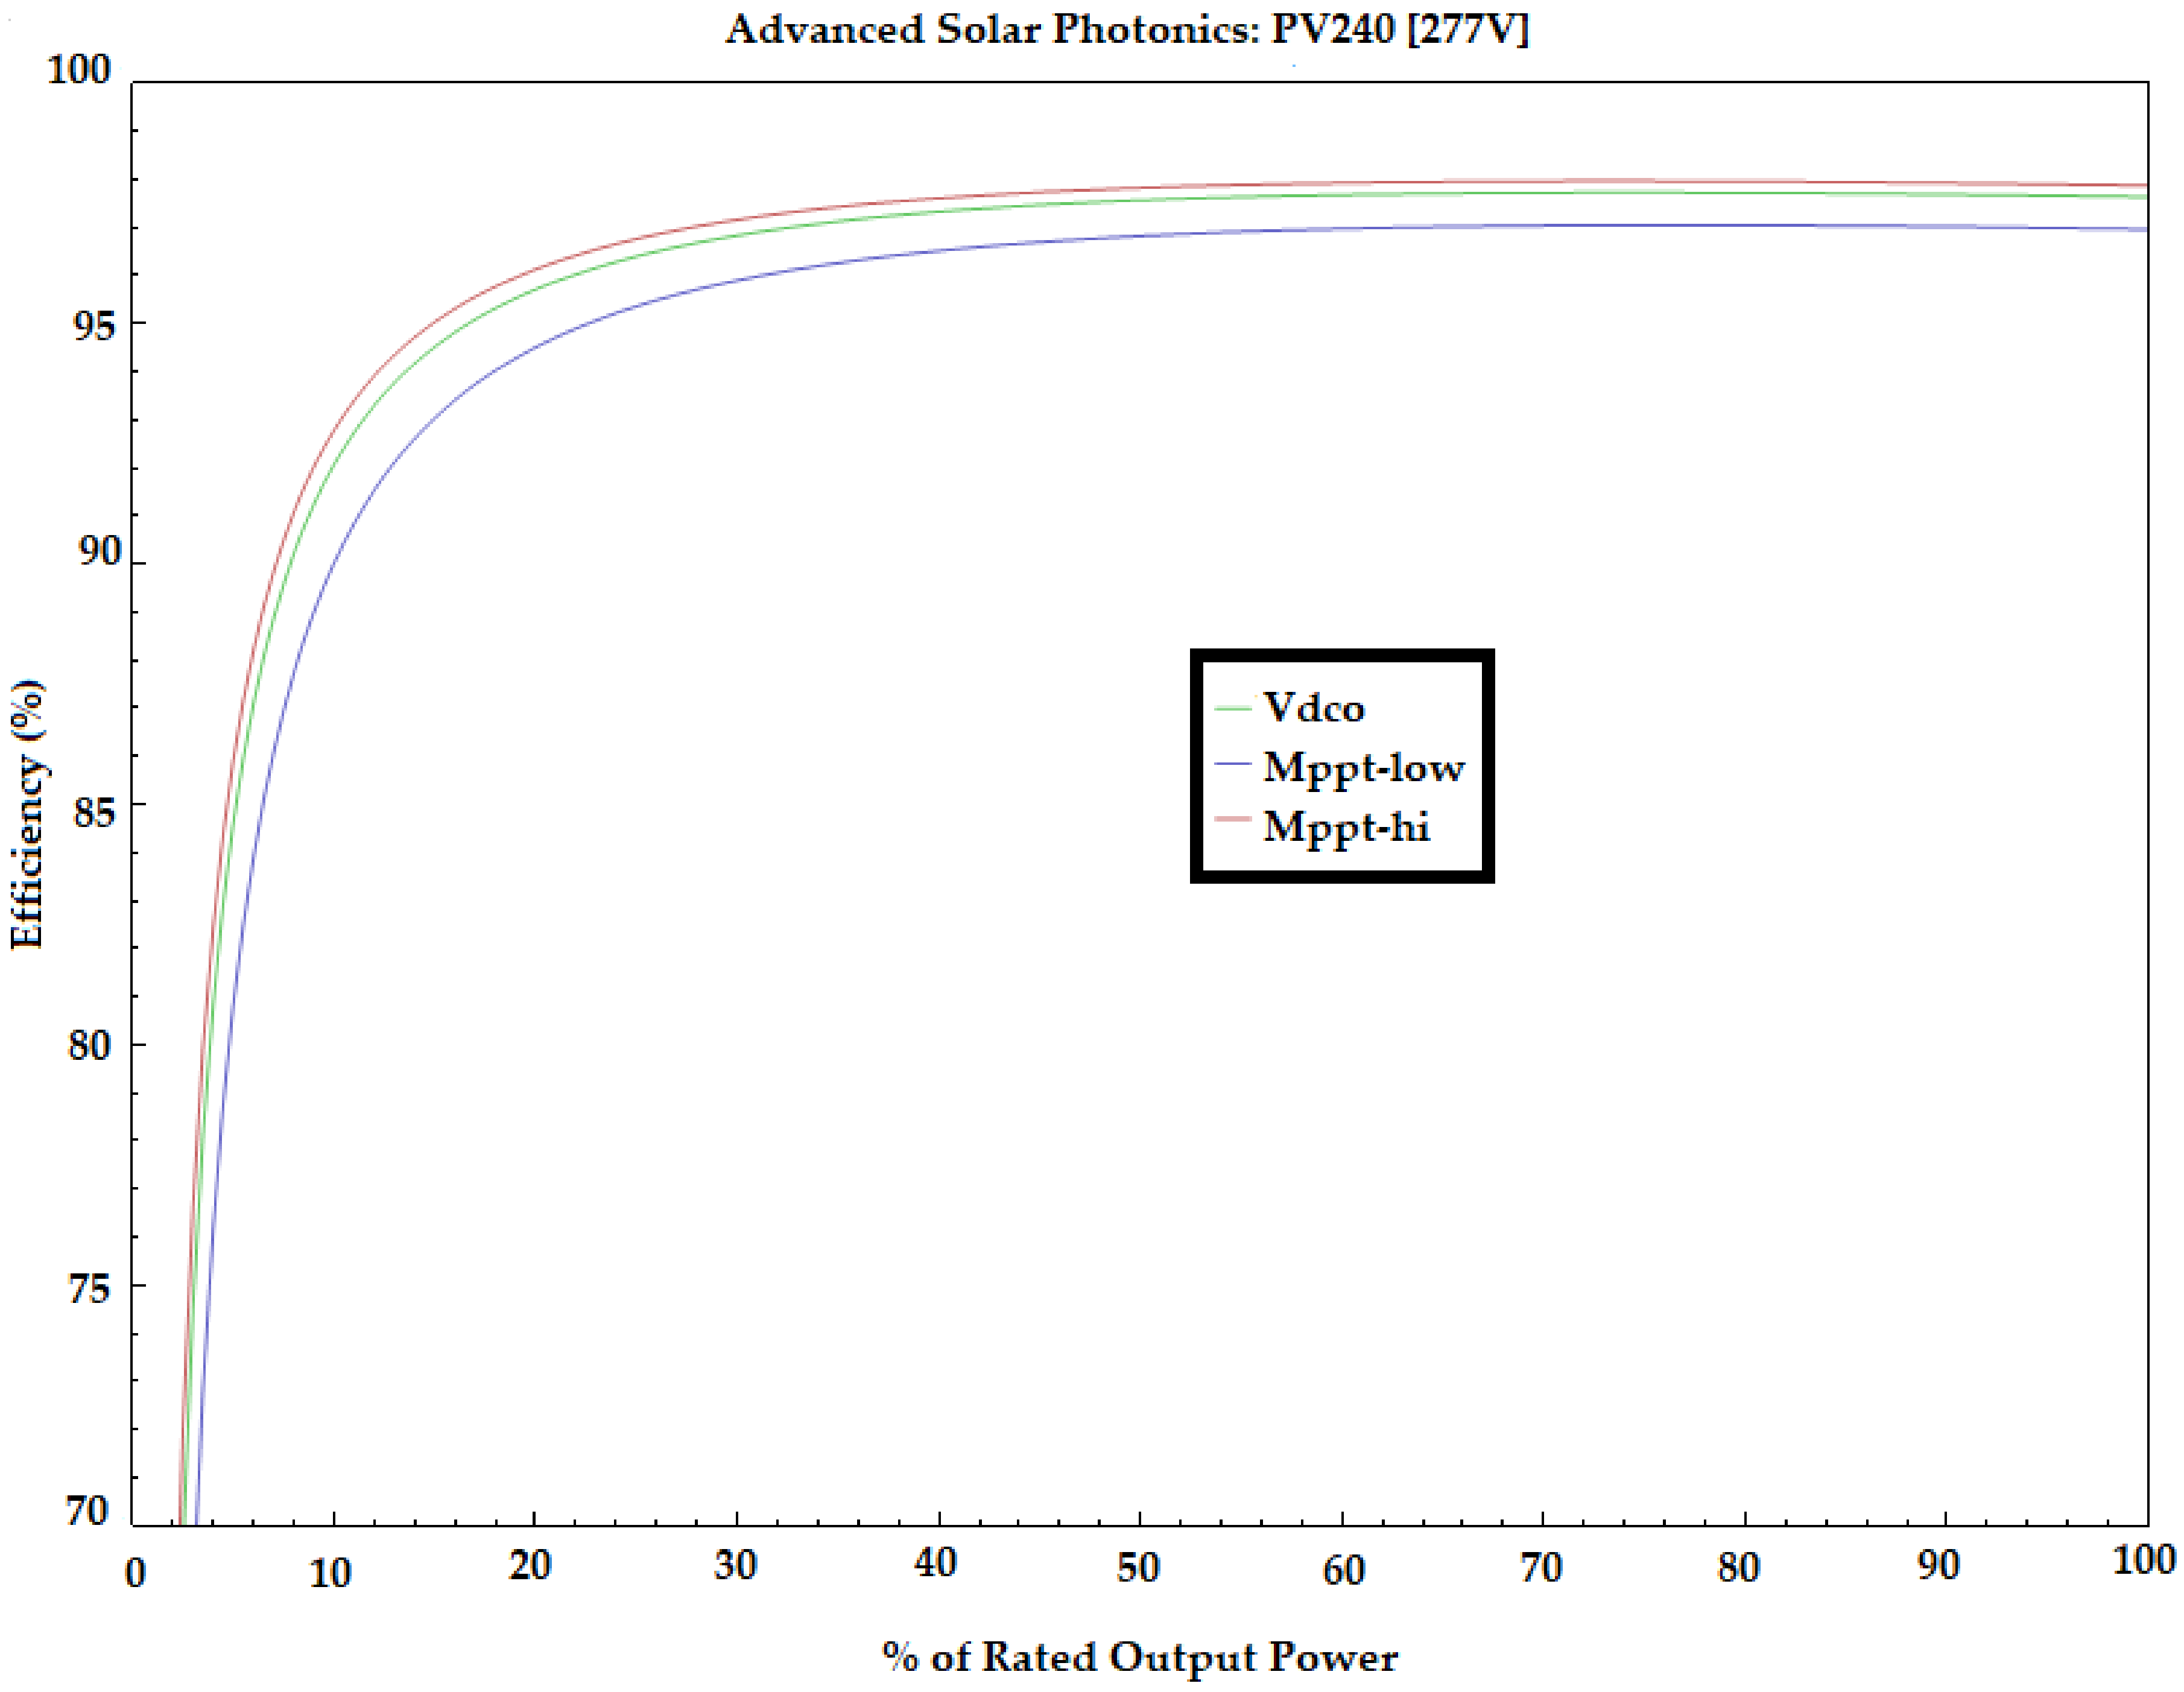
The inverter selected is the model Advanced Solar Photonics: PV240-277V and 3 inverters are needed for the PVS. The characteristics of the inverter are presented in
Table 3.
The inverter efficiency curve is presented in
Figure 5.
Figure 5 shows that the selected inverter has 98% efficiency. In this figure, three curves can be seen: the nominal DC voltage (Vdco), or design input voltage; the minimum MPPT DC voltage (MPPT-low), the manufacturer-specified minimum DC operating voltage; and the maximum MPPT DC voltage (MPPT-hi), the manufacturer-specified maximum DC operating voltage.
2.4. Financial Model
The financial model used calculates financial metrics of the power project based on a project’s cash flows over an analysis period studied. The financial model uses the system’s electrical output calculated by the performance model to calculate the series of annual cash flows.
According to Short et al. [
49], the financial metrics are defined based on the definitions and methods as follows:
The present value (PV) analysis is a measure of today´s value of revenues or costs to be incurred in the future. PV is considered an important financial variable because it shows the cost assumed in moment zero. It is defined by Equation (9).
where d is the annual discount rate, and n is the number of periods studied.
Internal rate return (IRR) is commonly used for many accept or reject decisions because it allows for a comparison with a minimum acceptable rate of return that presents an opportunity cost of capital. It is calculated through iterations until PV cash flow is equal to zero.
A simple payback period (SPB) is the number of years necessary to recover the project cost of investment under consideration and can be worked out by using Equation (10).
where
is the non-discounted incremental investment cost, and
is the non-discounted sum value of the cash flows net annual costs.
Benefit/cost ratio (B/C) shows whether, and to what extent, the benefits of a project exceed the costs. The B/C ratio is expressed by Equation (11).
where PV (all Benefits) is the present value of all positive cash flow equivalents, and PV (all Costs) is the present value of all negative cash flow equivalents.
2.5. Sensitivity Analysis
According to Helton [
50] and Saltelli et al., [
51] a sensitivity analysis (SA) is a typical measure used to quantify the impact of parameter uncertainty on overall simulation/prediction uncertainty. Evaluating the two indices requires calculating the mean and variance in the parameter space, and this is always done by using Monte Carlo (MC) methods. The quasirandom sampling method is the most computationally-efficient one among the existing MC methods. Following Saltelli et al. [
52], the mean and variance are evaluated with Equations (12) and (13),
and
where
Δ =
f(.) denotes a model execution for its parameters. The calculation requires two independent parameter sample matrices,
A and
B, with the same dimension of
n ×
d, where
n is the number of samples and
d is the number of parameters. Matrix
is the same as matrix
A, except that its
ith column is from the
ith column of matrix
B. Suscript
j denotes the
jth row of the corresponding matrix [
53].
2.6. Capital Asset Pricing Model (CAPM)
The Capital Asset Pricing Model (CAPM) describes the relationship between systematic risk and expected return for assets. CAPM has been developed by Sharpe [
54], Lintner [
55] and Ferreira et al. [
56]. This model estimates the cost of equity, which allows for comparison among businesses with an economic rationale for calculations [
57]. The CAMP equation is widely used for calculating the expected returns of an asset and can be expressed by Equation (14).
where
ERi is the expected return of an asset,
Rf is the risk-free rate,
βi is the beta of the investment (according to NASDAQ:FSLR the beta of the solar stock is 1.84),
ERm is the expected return of the market (Mexican
ERm is 8.00%), and (
ERm – Rf) is the market risk premium. The Mexican risk-free rate is taken from the Bank of Mexico and is equal to 7.00%,
βi is a measure of a stock’s risk given by measuring the fluctuation of its price changes relative to the overall market; the market risk premium represents the additional return over and above the risk-free rate.
2.7. Levelized Cost of Electricity (LCOE)
The levelized cost of electricity (LCOE) has been used to determine the USD per megawatt-hour (
$/MWh) cost of PVS over the life of the capacity [
57] and may compare different scenarios. According to Perkins [
58], the expression used to calculate LCOE is given by Equation (15).
where
It is the invested capital,
Mt is the operating and maintenance costs,
Ft is the solar photovoltaic feedstock,
Et is the energy delivered to the grid (MWh/yr),
n is the lifetime of the project, and the discount rate is given by
r. The Mexican Central Bank shows the value of the discount rate of 7.25% [
59].
2.8. Emission Analysis
Greenhouse gases (GHG) include water vapor, ozone (O
3), carbon dioxide (CO
2), nitrous oxide (N
2O), methane (CH
4), nitrous and several classes of halocarbons. GHG allow solar radiation to enter the Earth’s atmosphere but prevent the infrared radiation emitted by the Earth’s surface from escaping. Instead, this outgoing radiation is absorbed by the GHG and then partially re-emitted as thermal radiation back to Earth, warming the surface [
60].
According to the “National Inventory of Emissions of Greenhouse Gases and Compounds (INEGYCEI)” that presents the National Institute of Ecology and Climate Change (INECC) in accordance with Article 74 of the General Law of Climate Change, Mexico emitted 683 million tons of carbon dioxide equivalent (MtCO2e) of GHG in 2018.
The Inventory is an instrument that allows for knowing the emissions of Mexico that originate from human activities throughout the national territory. It is a fundamental exercise in designing emission reduction policies, understanding the main sources and the role that ecosystems play in capturing part of these emissions.
Mexico is conducting an inventory, in accordance with scientific and technical criteria established by the Intergovernmental Panel on Climate Change (IPCC), which is a signatory of the United Nations Framework Convention on Climate Change (UNFCCC).
The most relevant gas emitted by Mexico is carbon dioxide with 71% of emissions, followed by methane with 21%. According to total emissions, 64% corresponded to the consumption of fossil fuels; 10% originated from livestock production systems; 8% came from industrial processes; 7% were issued for waste management; 6% for fugitive emissions from oil, gas and mining extraction, and 5% were generated by agricultural activities. In the inventory 148 MtCO2e absorbed by the vegetation were also counted, mainly in forests and jungles. The net balance between emissions and removals for 2018 was 535 MtCO2e. It was estimated that in 2018, 112,240 tons of this short-lived climatic forcer was generated, which has negative effects on public health.
4. Conclusions and Future Research Lines
University sustainability covers both the set of activities aimed at the appropriate use of resources in such a way as to guarantee the permanence and development of the University as an institution and the effect that the university’s activity can have on the sustainability of society.
Universities continue to have a major responsibility in contributing to a more sustainable world; their actions in favor of sustainability and integrity should be a model for all sectors of society.
Many previous studies have shown the importance of the use of renewable energies within universities to achieve energy, economic, and environmental sustainability.
With the implementation of PVSs in Mexican universities, UNAM contributes both to its own sustainability plan and Mexico’s sustainability.
In our case study, a PVS will be installed at ENES-J, which will be interconnected to the electrical grid and will support the electric demand of the Computer Numerical Control (CNC) type Haas Automation model UMC-750 at the Orthotics and Prosthetics Laboratory (OPL). The CNC will work 5 days a week for 4 h a day, with a peak load of 22.4 kW, and an energy required of 448 kWh per week.
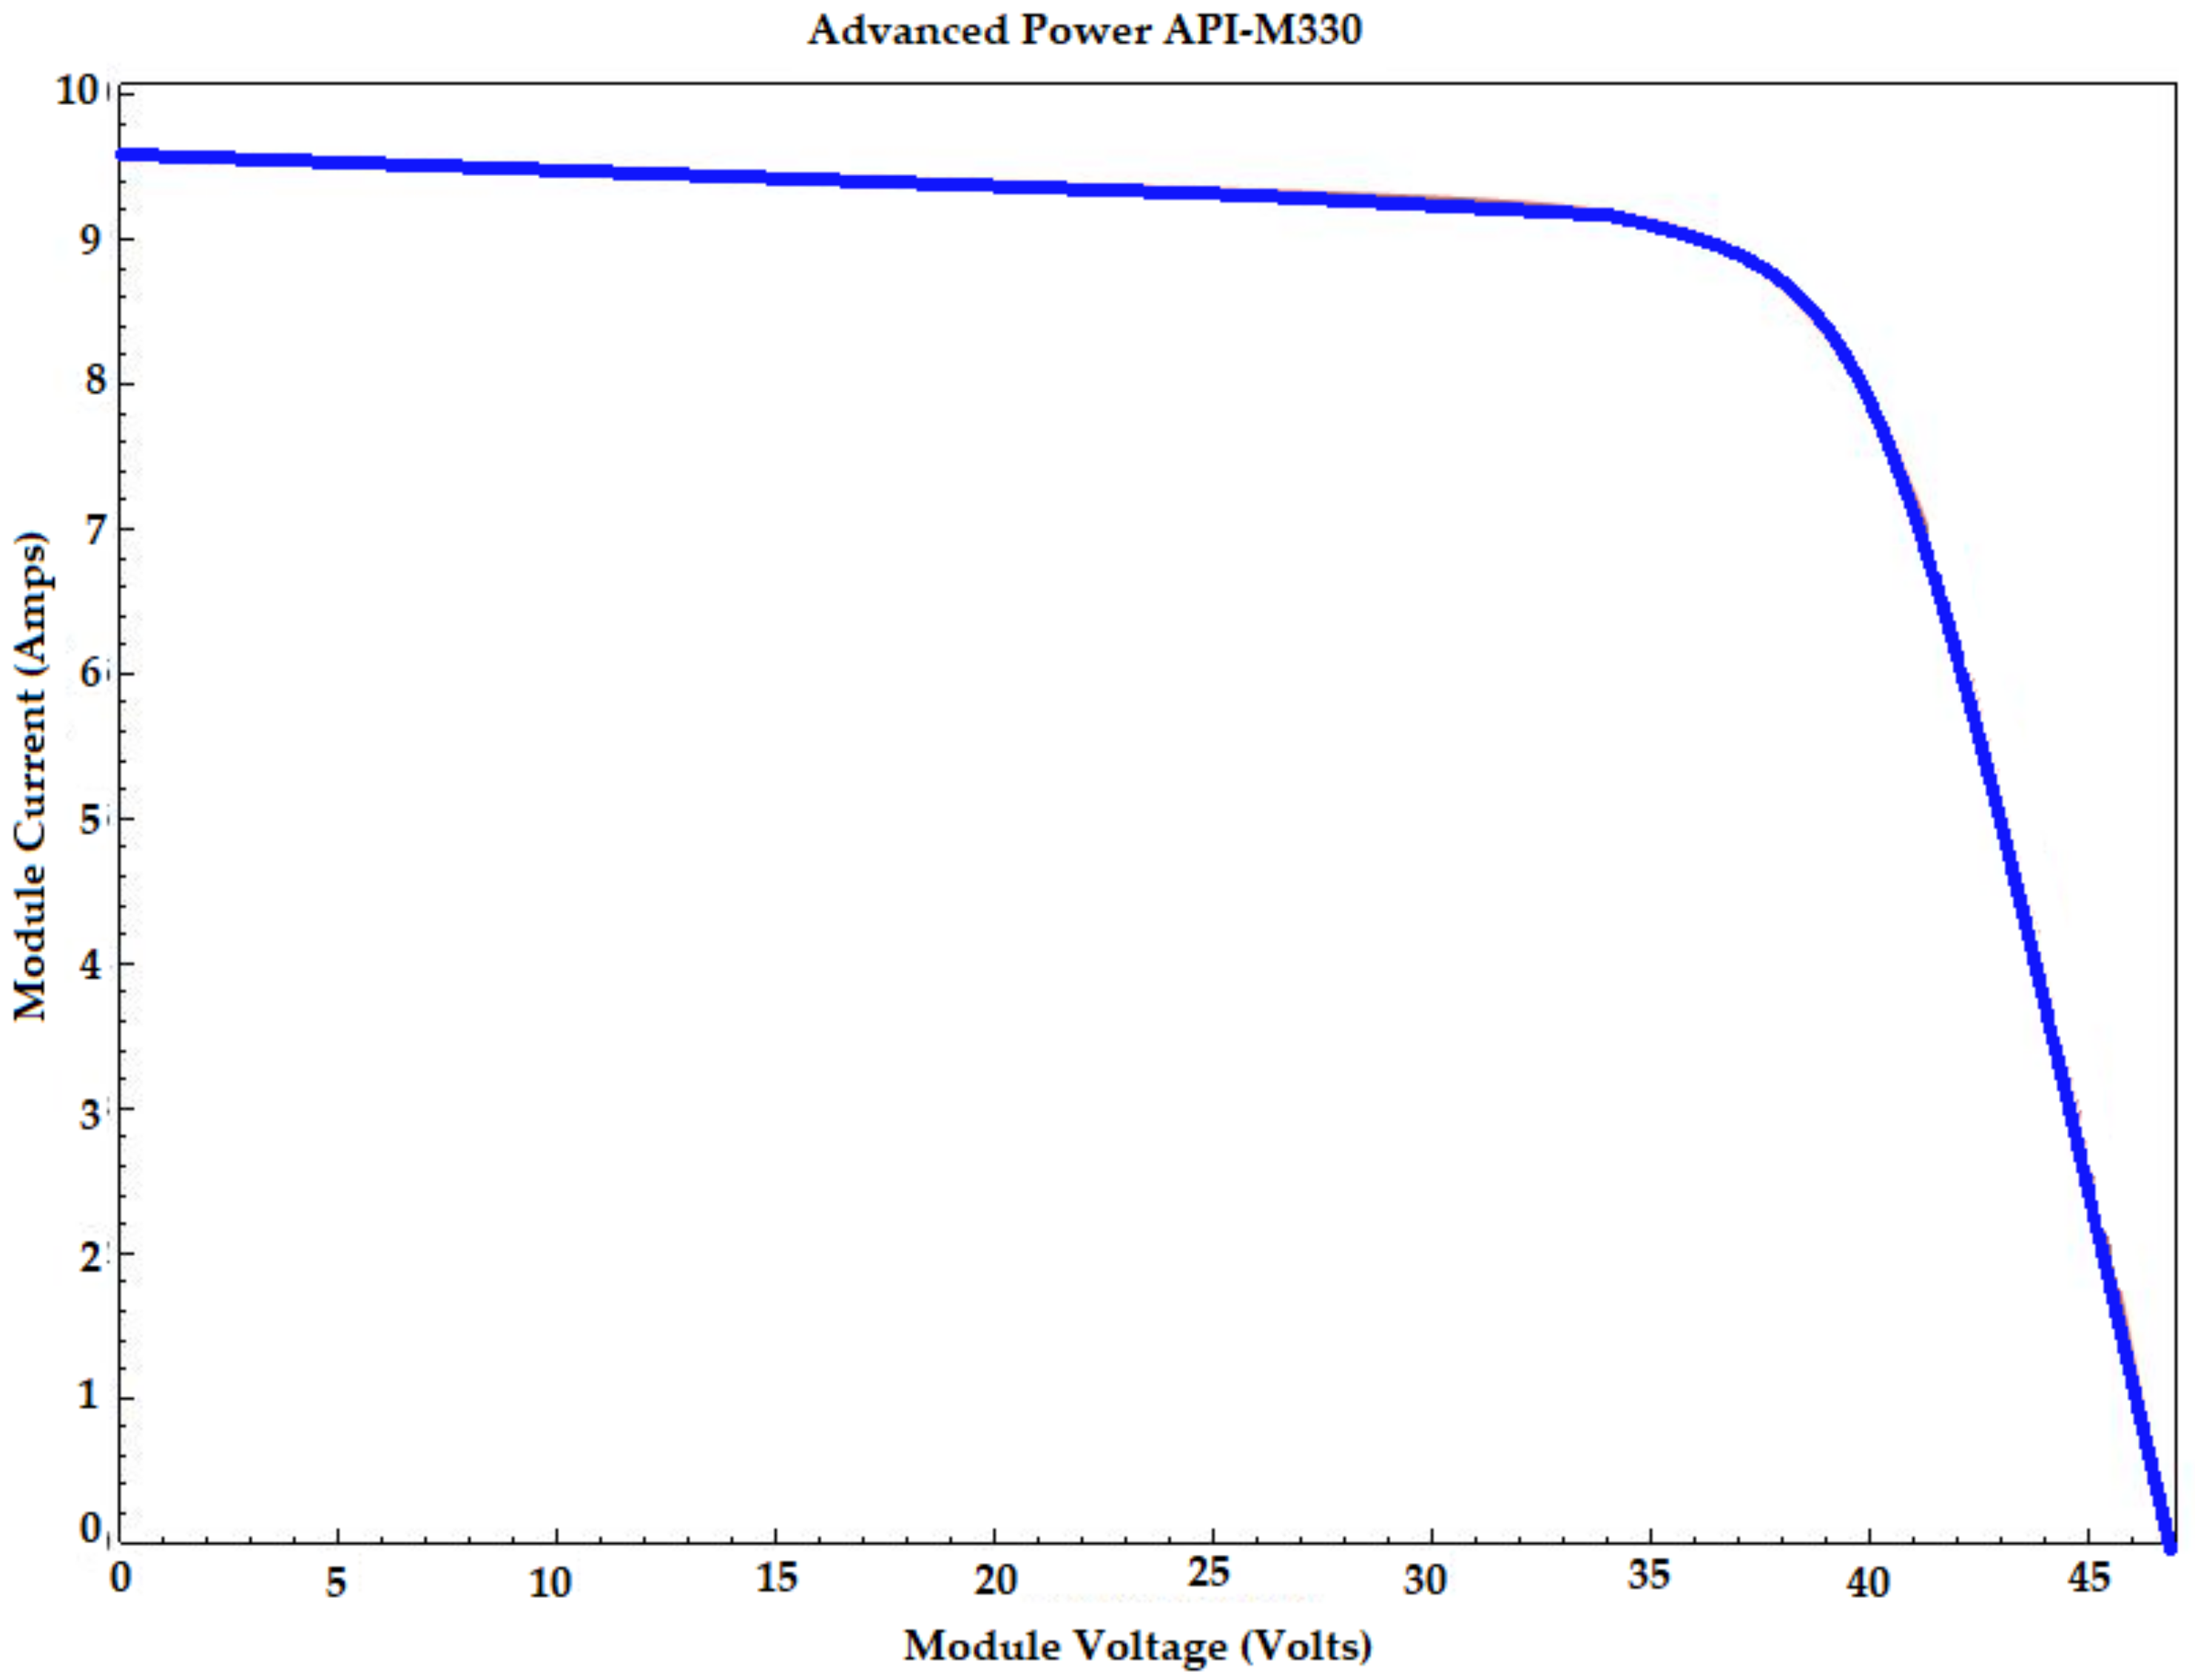
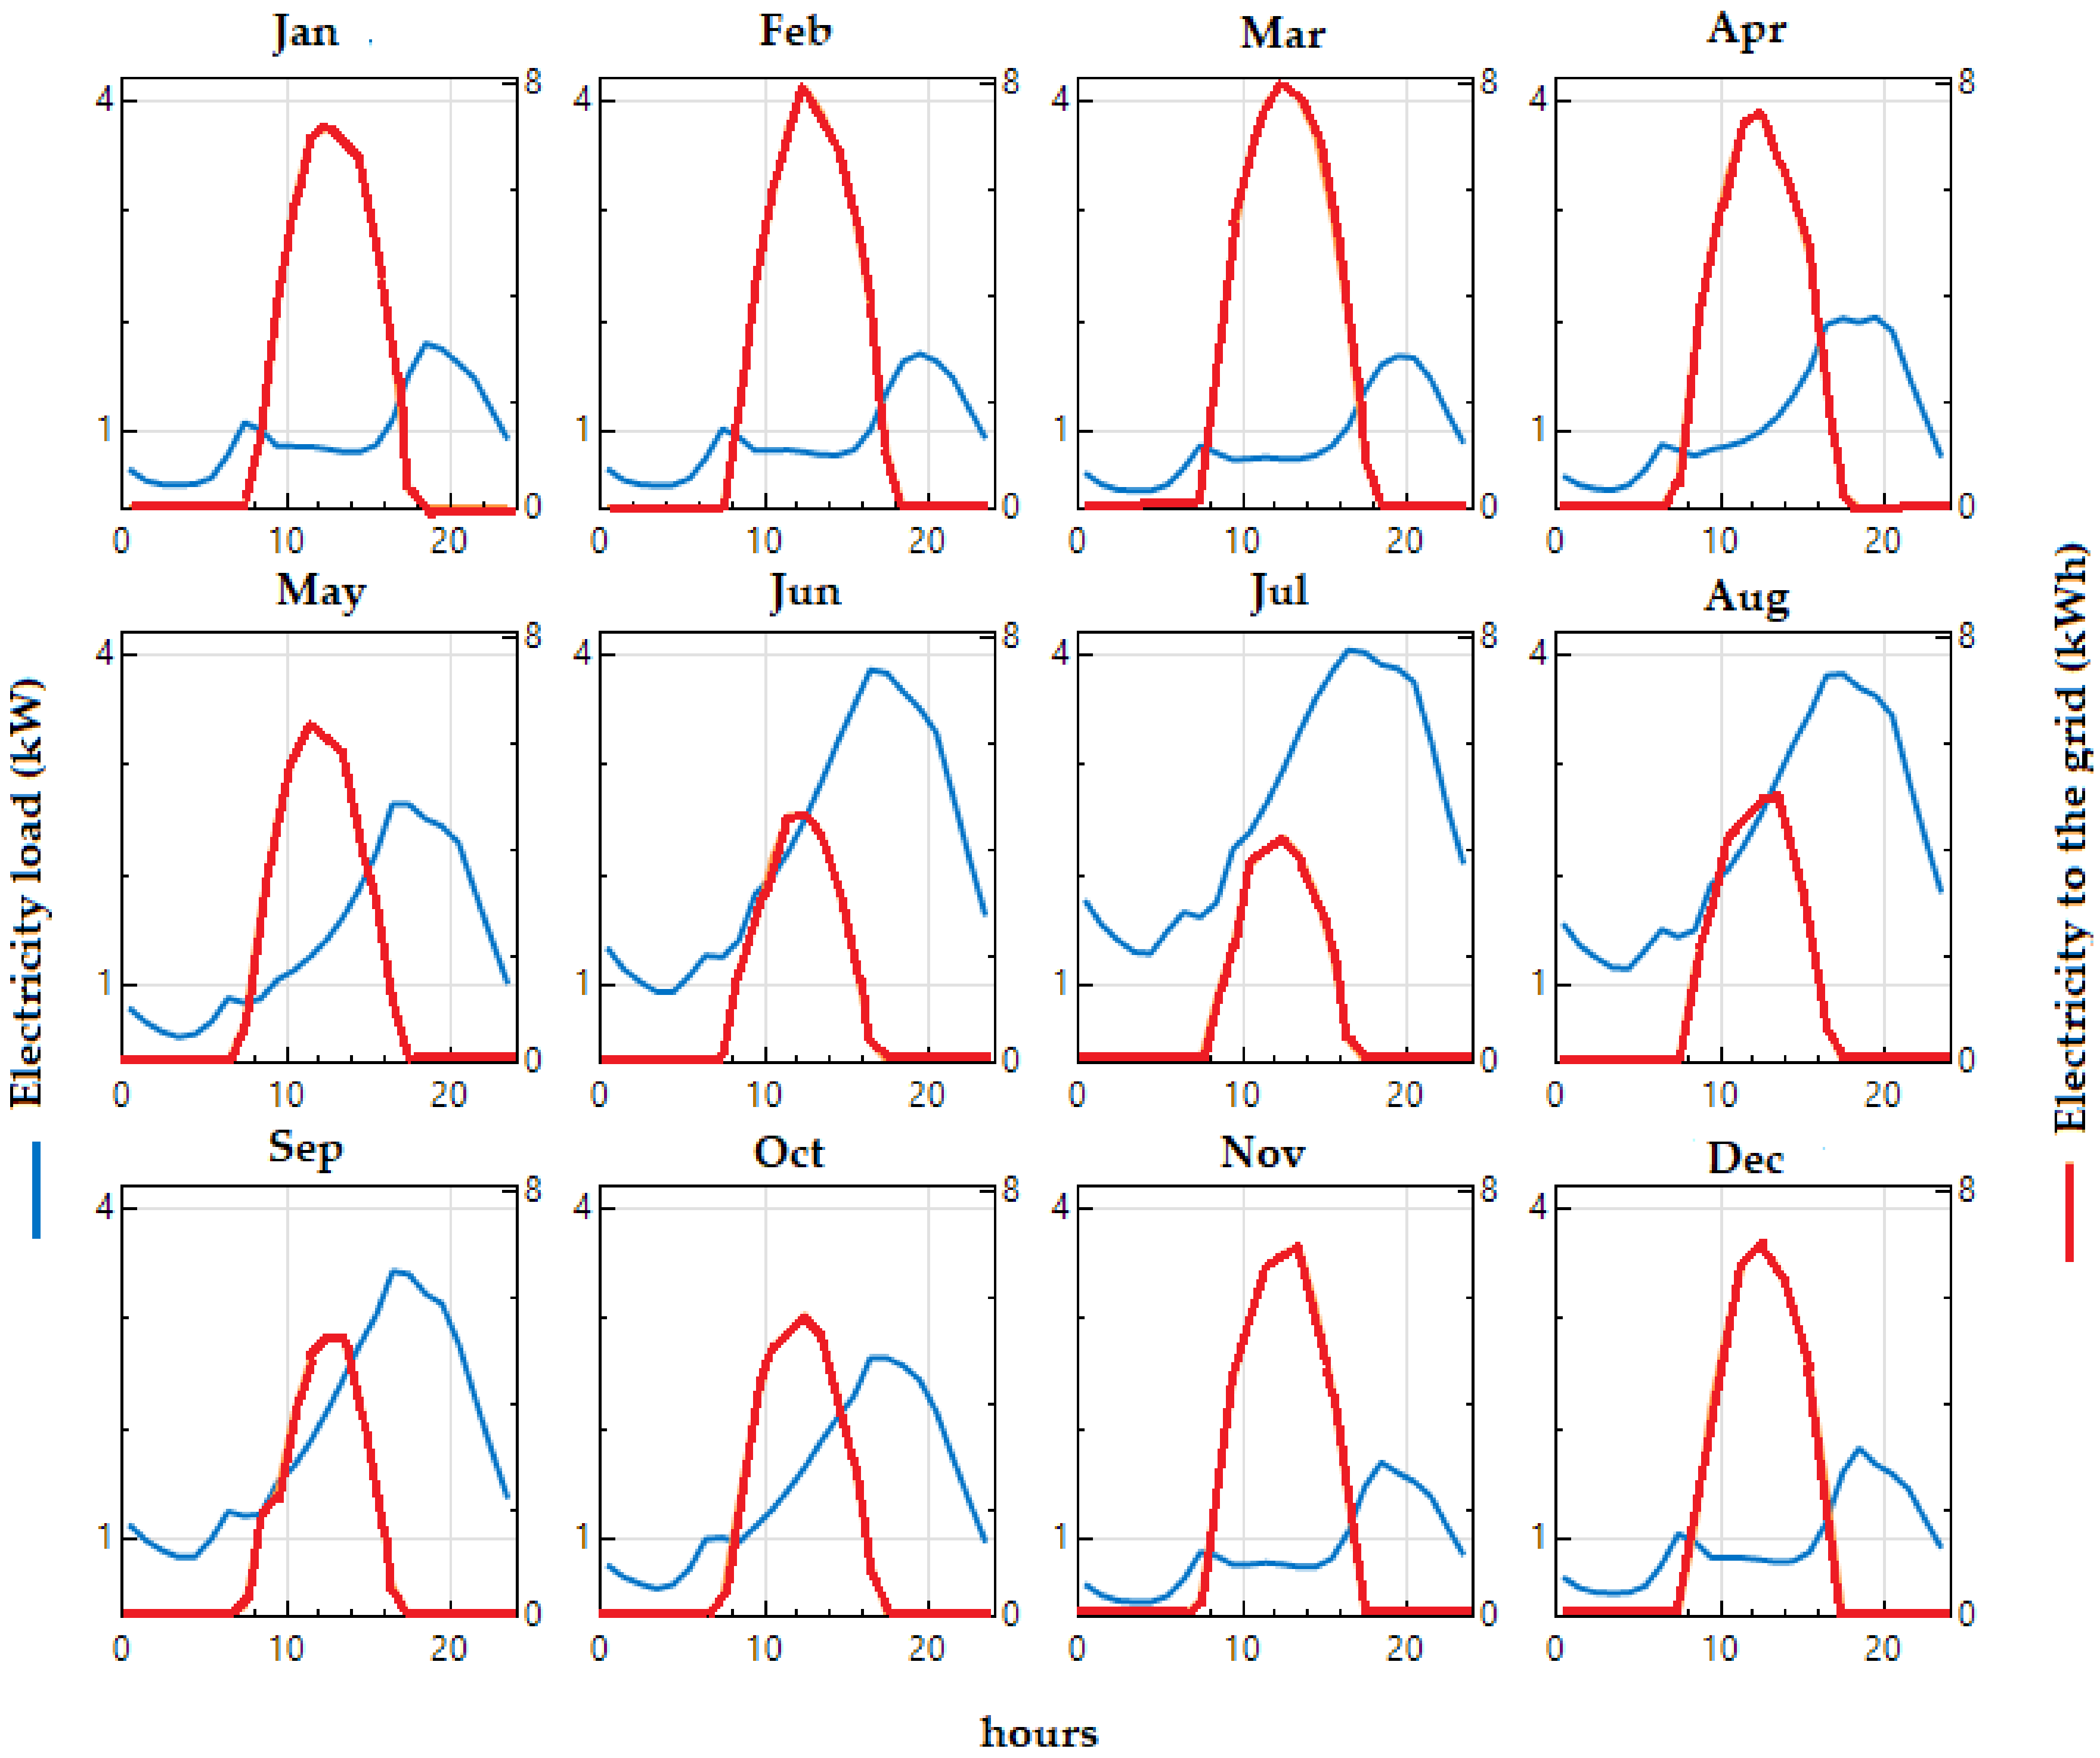
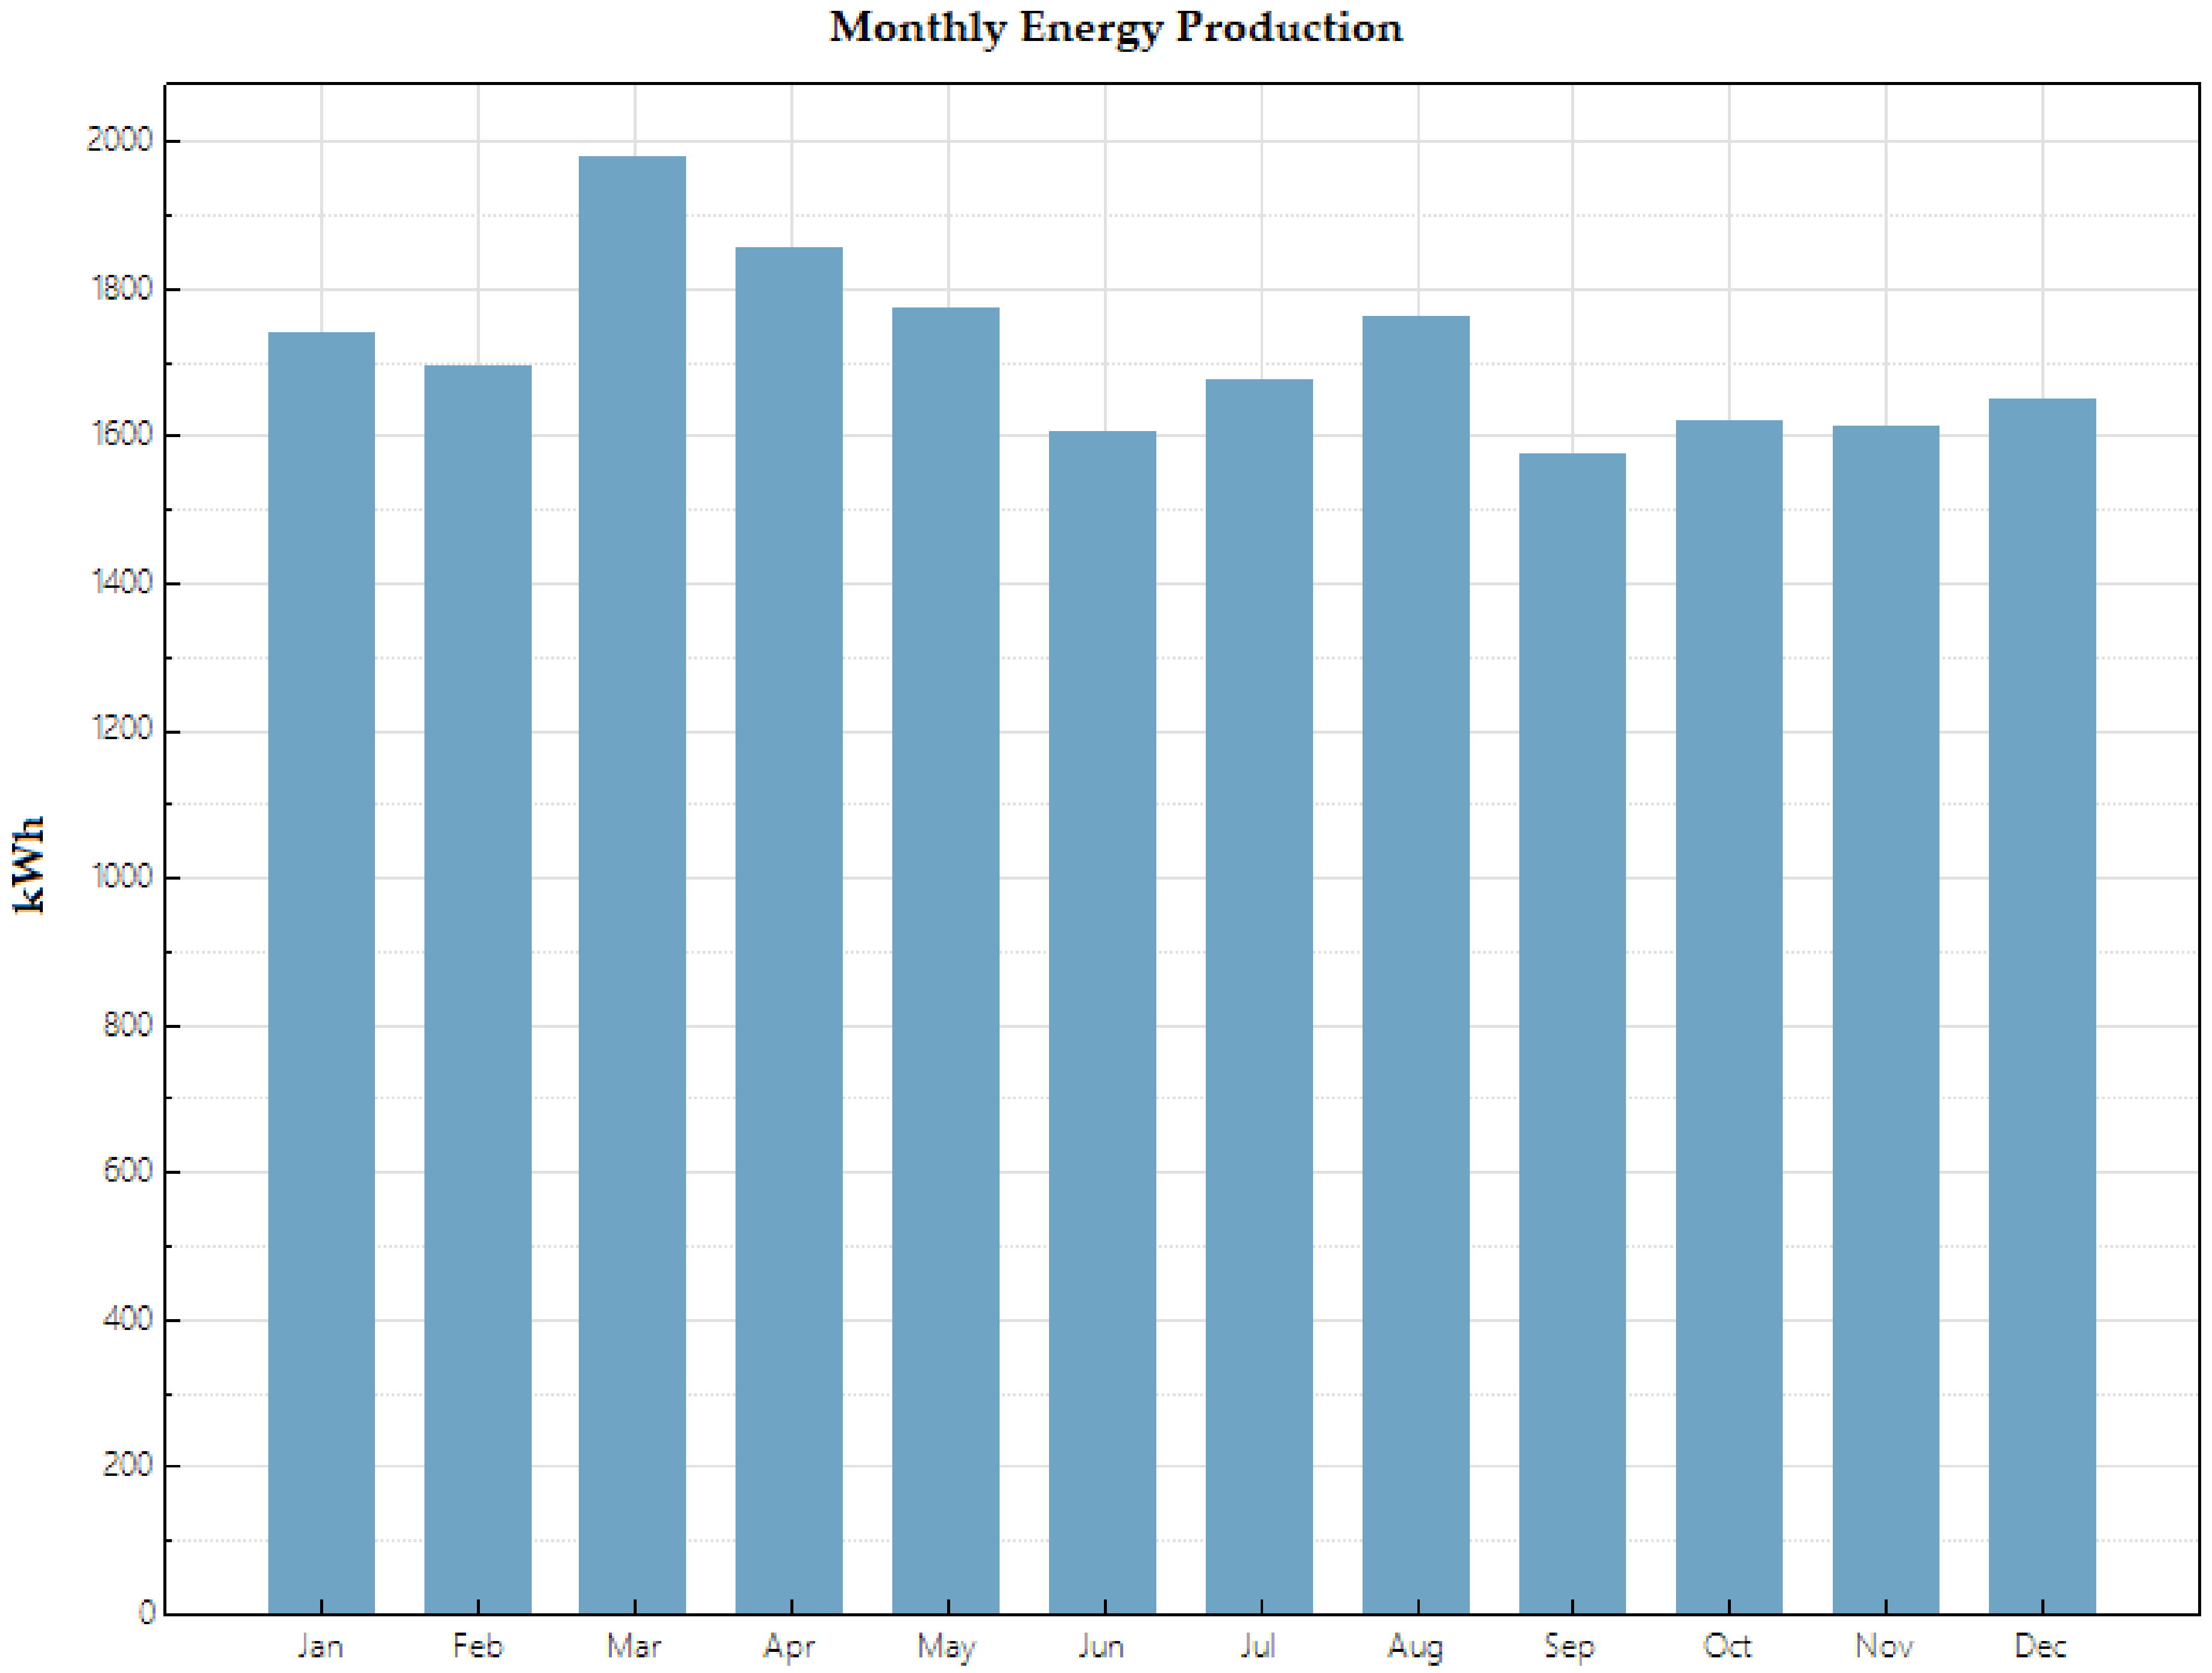
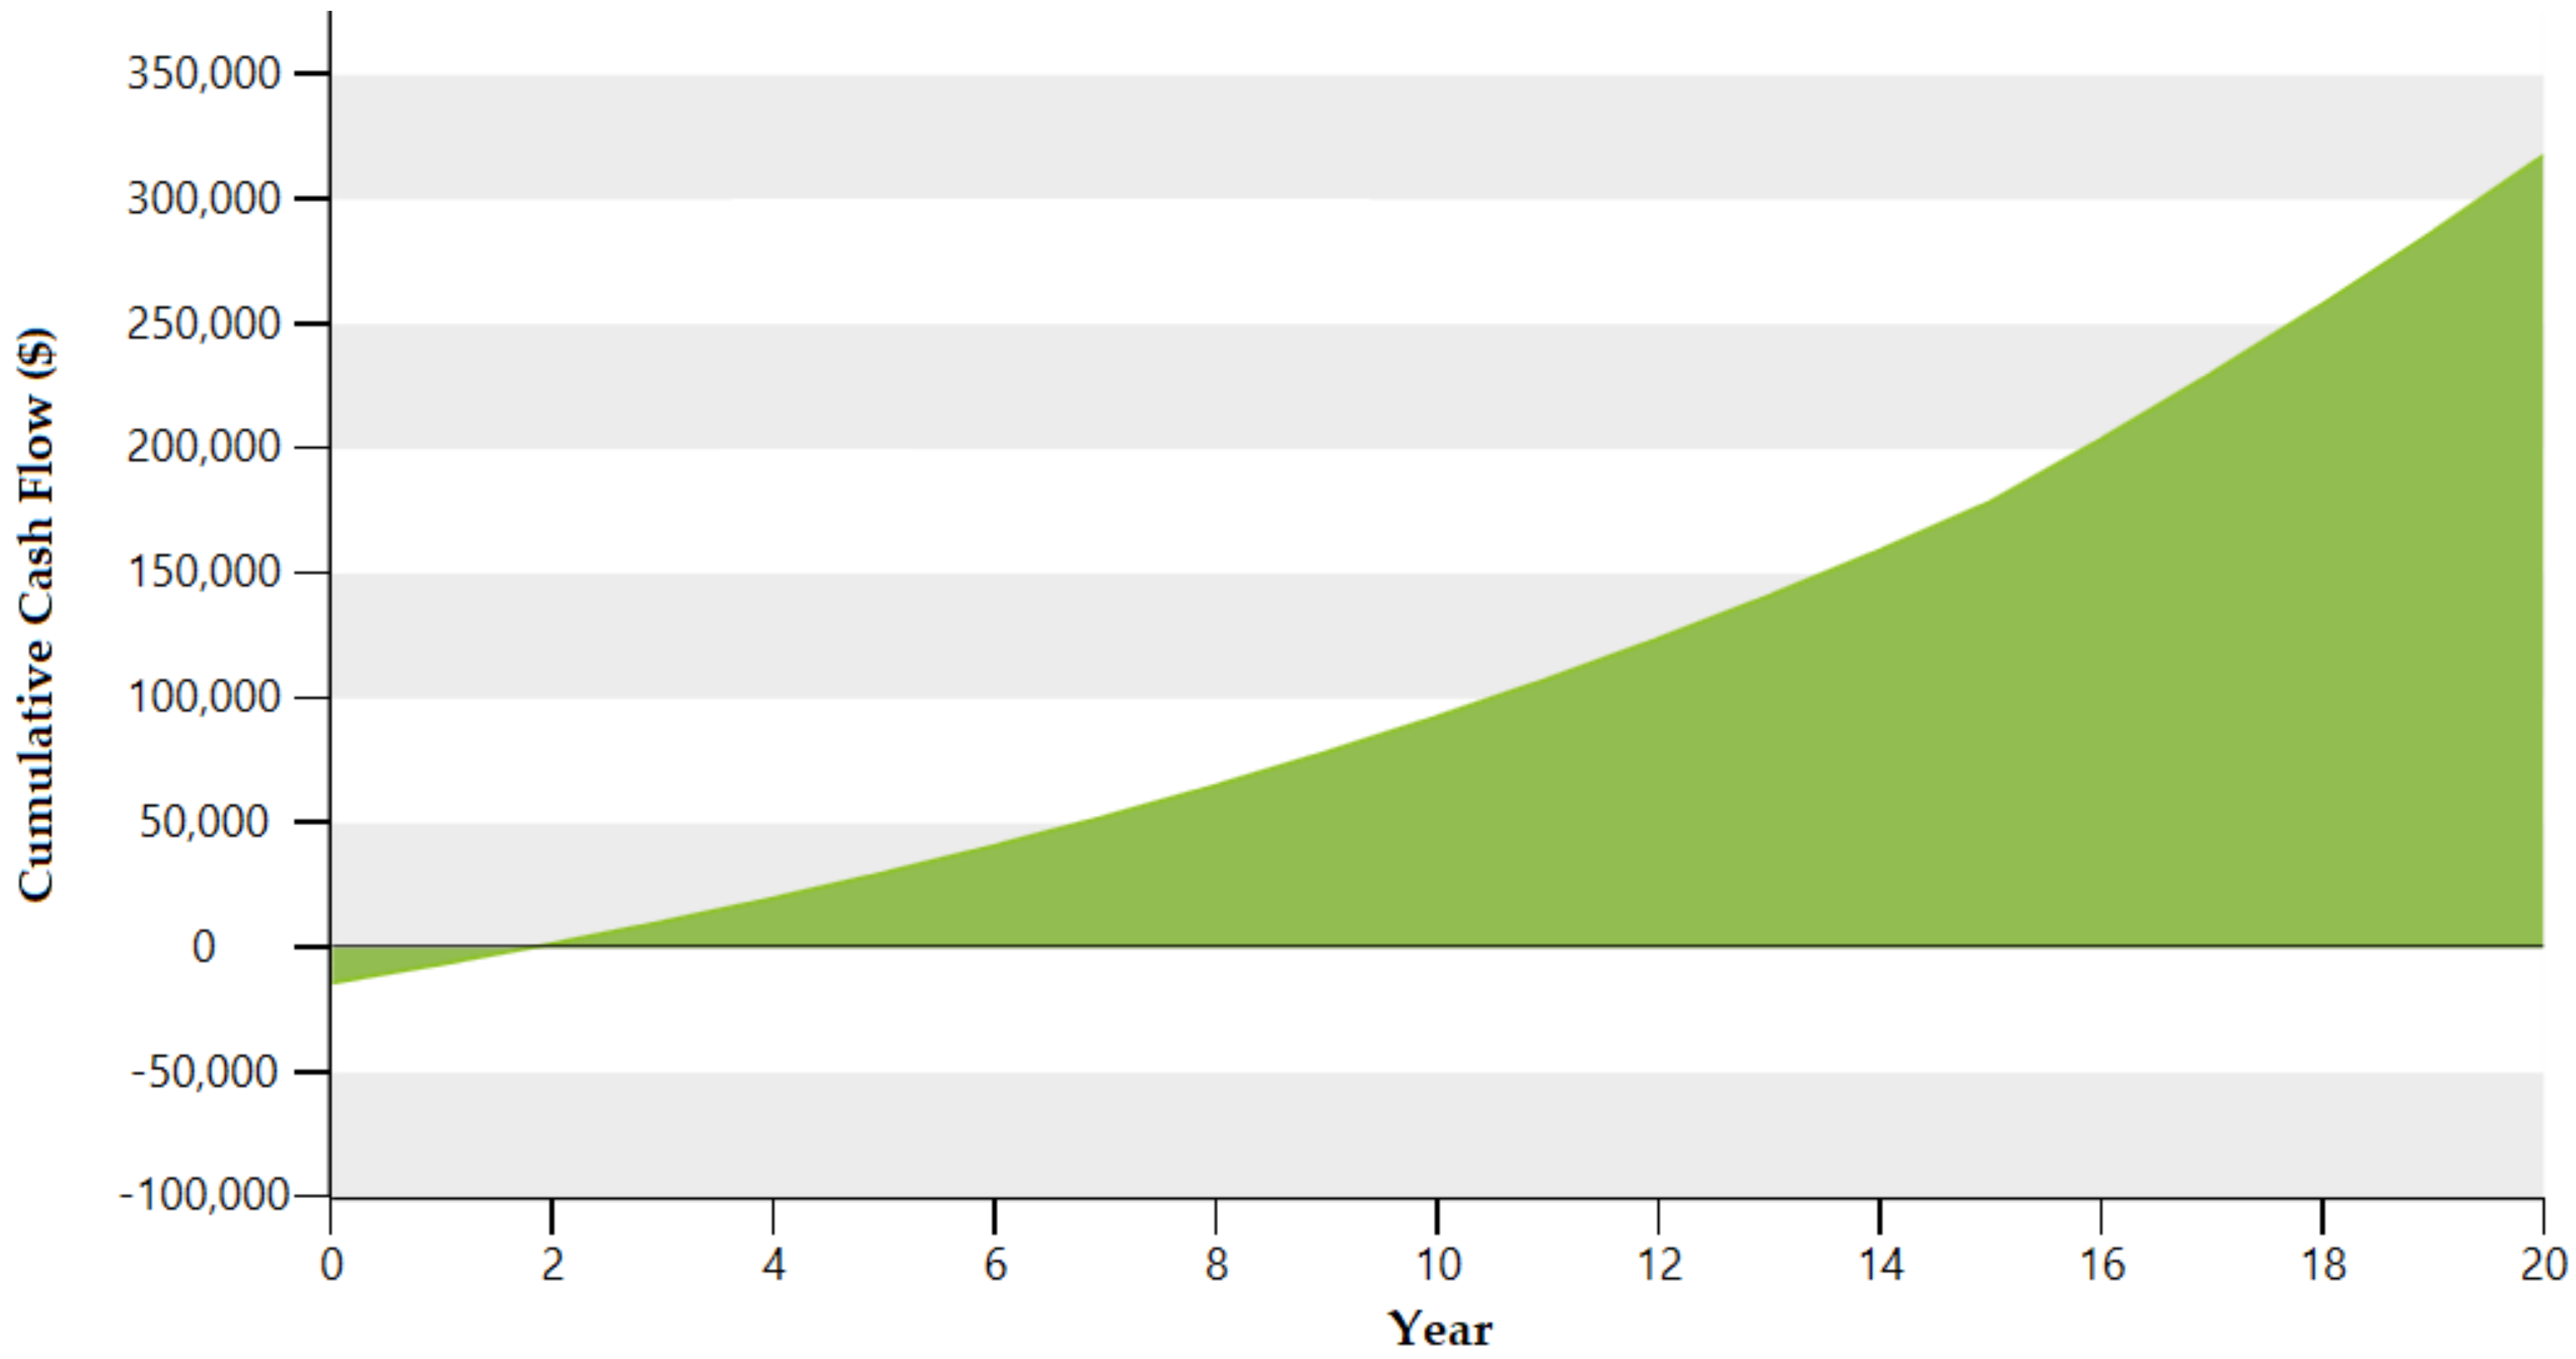
UNAM’s sustainability plan includes energy savings. To help achieve this, in the facilities of ENES-J in Queretaro in an area of 96.7 m2, 50 solar panels of type mono-Si Advance Power API-M330 with an efficiency of 17.83% and a capacity factor of 20.4% will be installed, and they will provide 17.25 kW of power and 345 kWh of energy. The financial assessment shows initial costs of 46,575 $/kW, O&M costs (savings) of 569 $/kW-year, electricity export rate-monthly of 0.10 $/kWh, electricity exported to the grid of 21.5 MWh, and electricity export revenue of $2,145. Using this PVS, the ENES-J will save $12,089 per year, equivalent to 24,566 liters of fuel or 23.6 of barrels of crude oil not consumed. A sensitivity analysis, or what-if analysis, was done between machine hours and electricity price and solar irradiance and electricity exported to the grid. In the first analysis it can be proven that if the CNC machine works more hours per day, the use of PVS can save money; in the second analysis, the electricity exported to grid increases if solar irradiation does, so that if the CNC machine works more than 5 h per day and there are more than 6.1 kWh/m2/day, the PVS will contribute to saving money.
It was found that the levelized cost of electricity (LCOE) is 15.5 cents/kWh, which allows for reducing the costs during the lifetime of the project.
The gross annual reduction in GHG emissions will be 10.2 tCO2, with a GHG emission factor of 0.45 tCO2/MWh. Considering these results, the implementation of the PVS is feasible, contributing to the ENES-J sustainability plan.
Comparing this technology with a combined cycle power plant, the contribution to reducing GHG represents a reduction of CO2 emission factor of 278.9 kg/GJ, or CH4 emission factor of 0.0108 kg/GJ and N2O emission factor of 0.0072 kg/GJ.
As future research, it would be interesting to use other renewable energy sources such as biomass, wind, and thermal energy, not only for individual use, but also to improve energy sustainability at Universities.

 ,
, 


