Assessment of Spatial Accessibility to Residential Care Facilities in 2020 in Guangzhou by Small-Scale Residential Community Data

 ,
,
Abstract
:1. Introduction
2. Literature Review
3. Dataset and Method
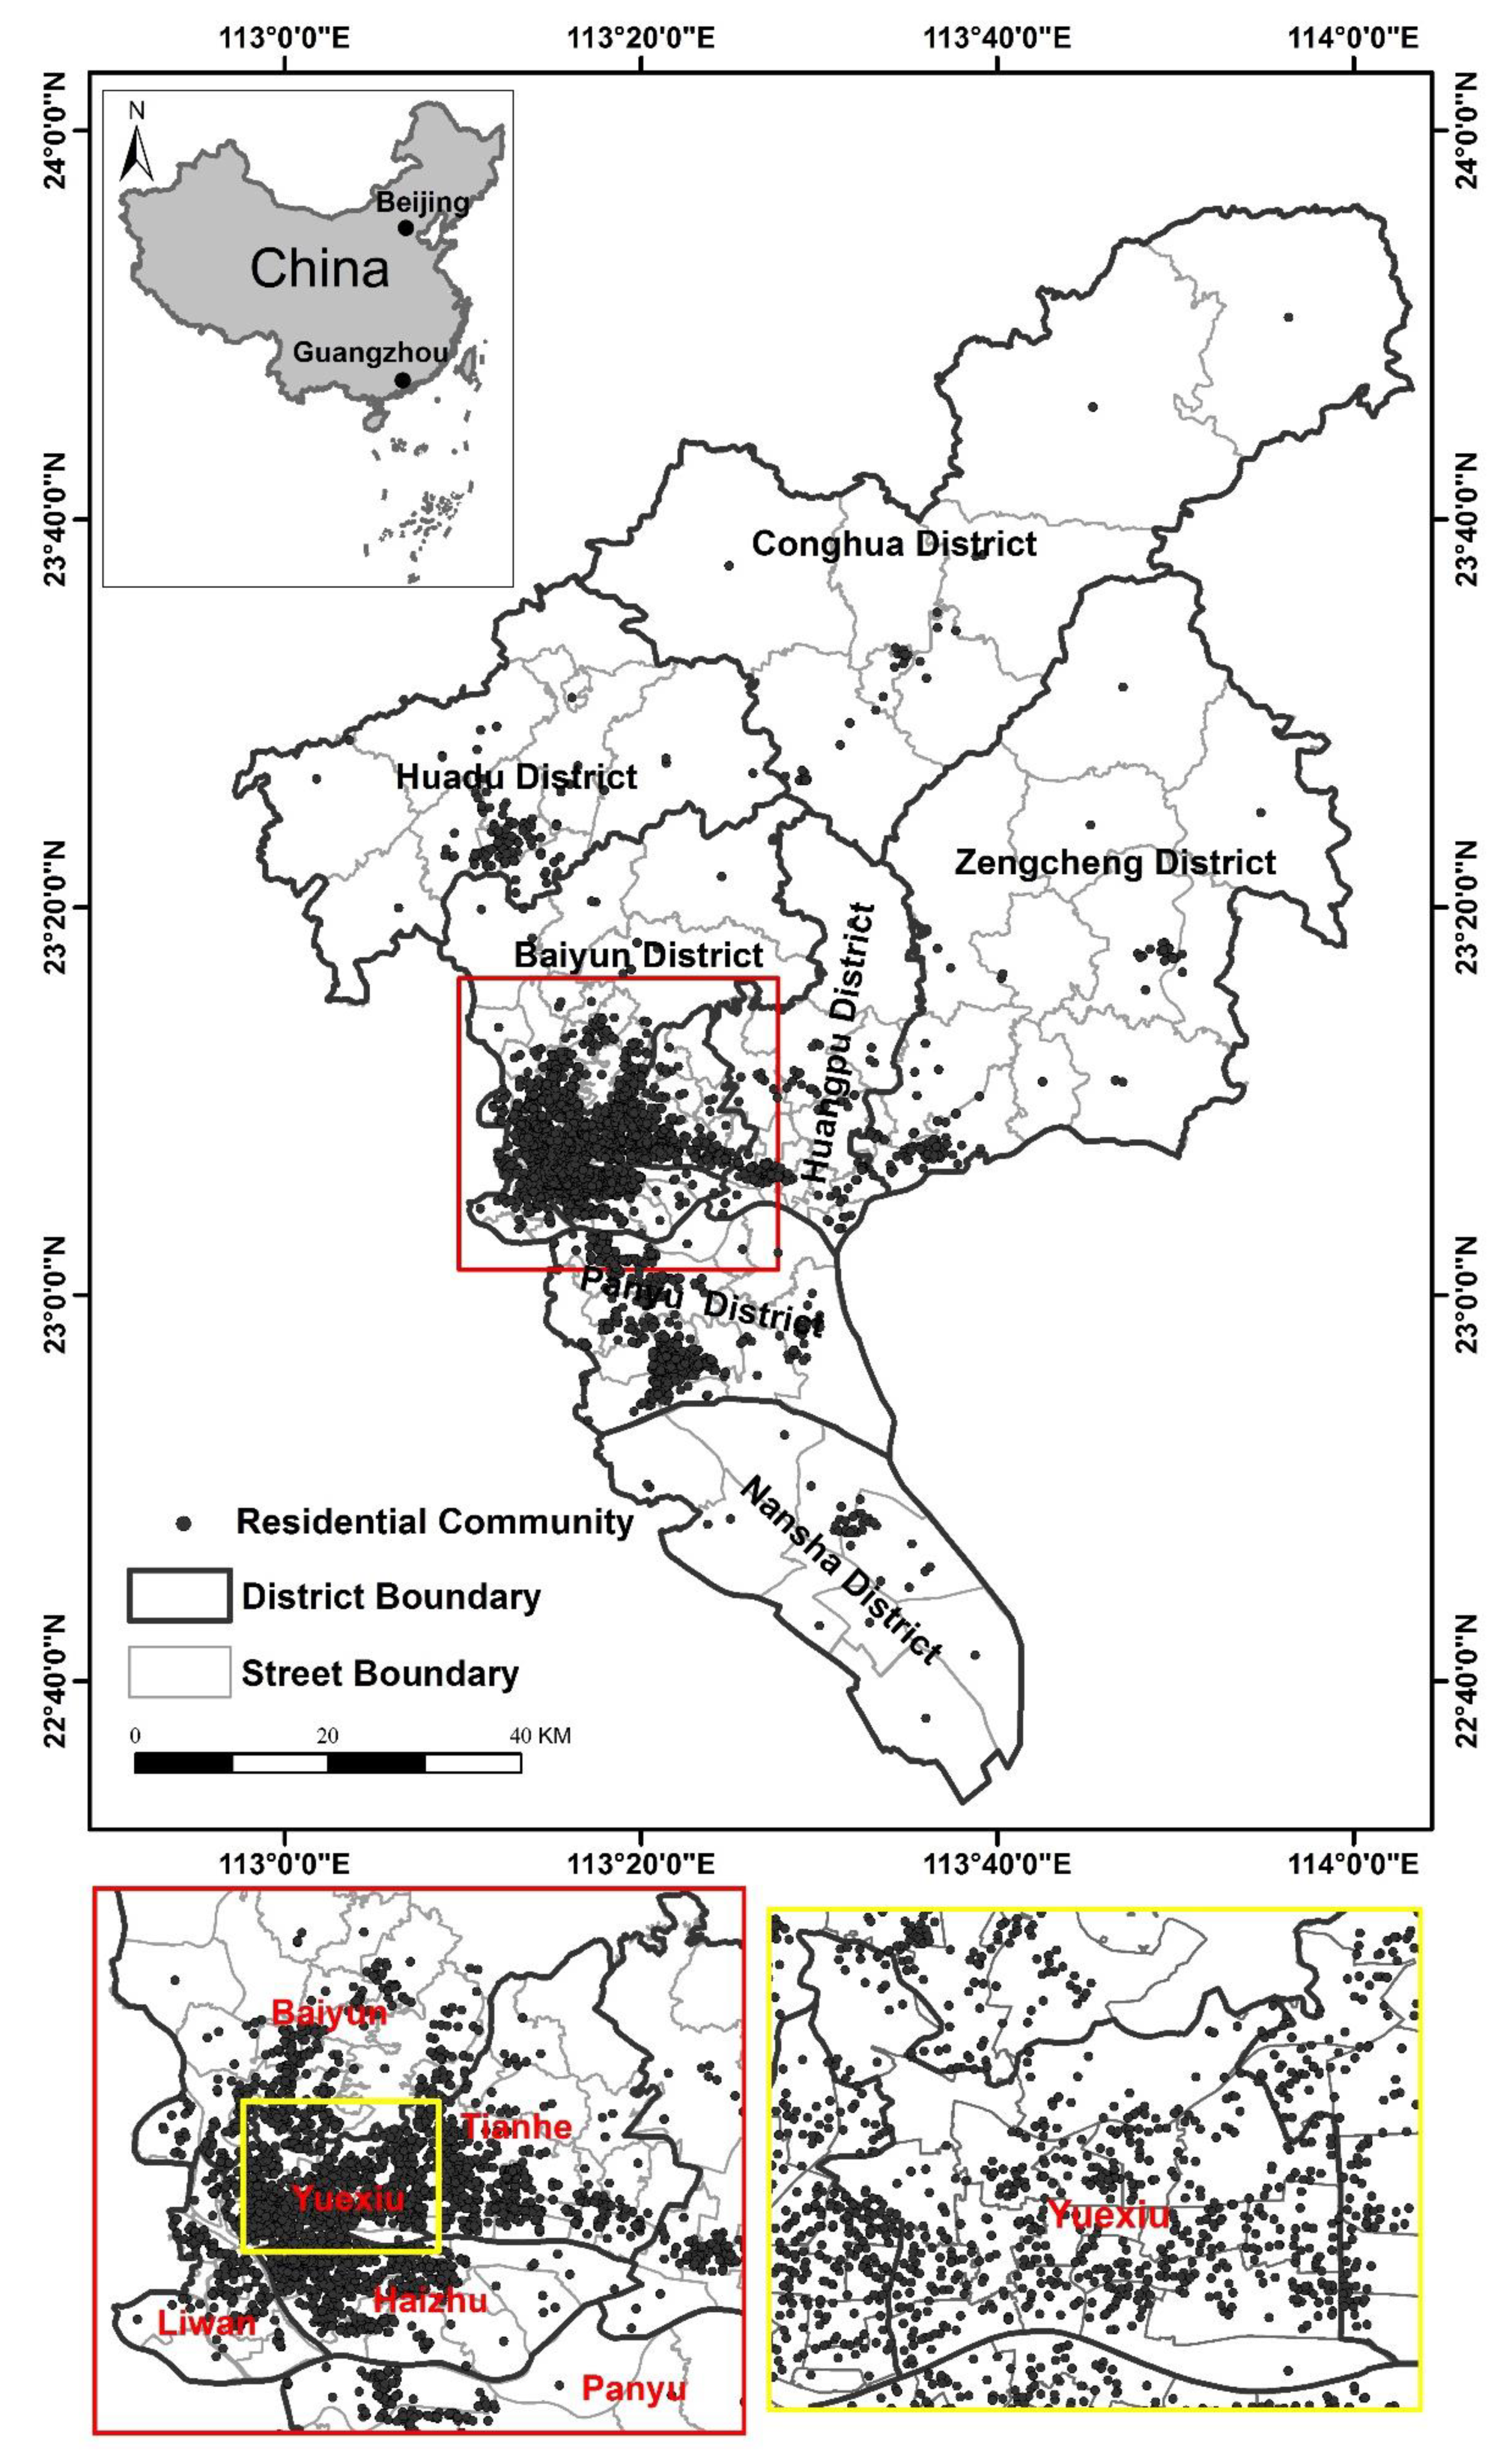
3.1. Study Area
3.2. Data and Preprocessing
3.3. Method of Measuring Spatial Accessibility
4. Results and Discussions
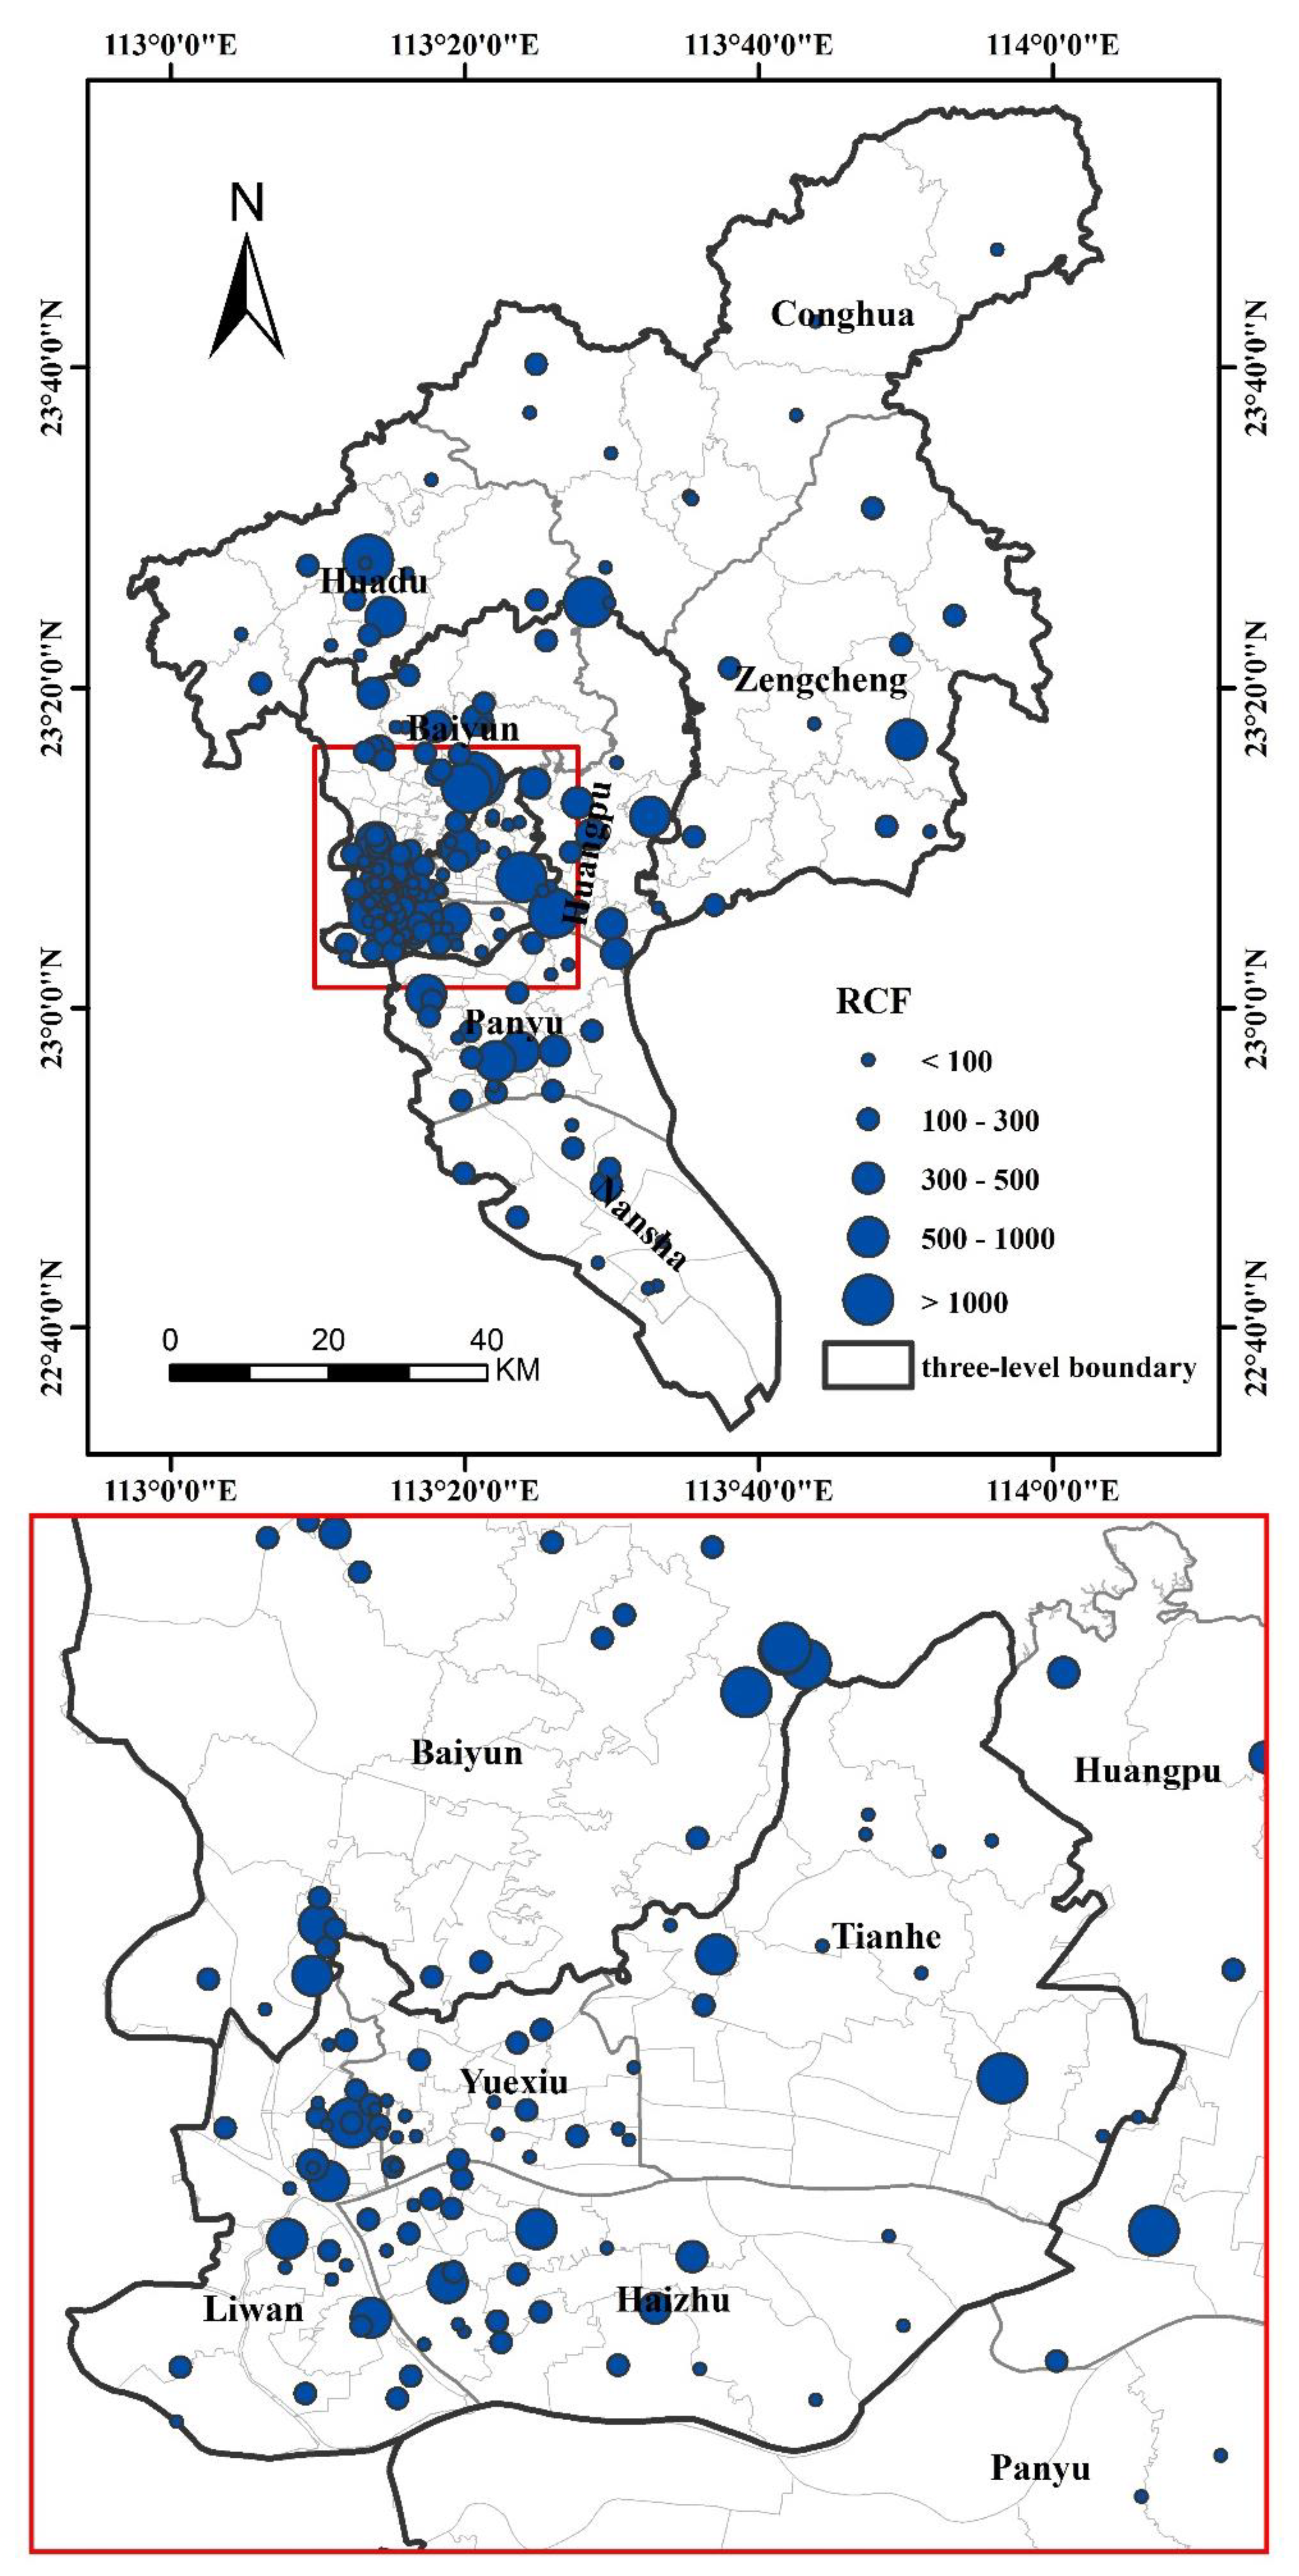
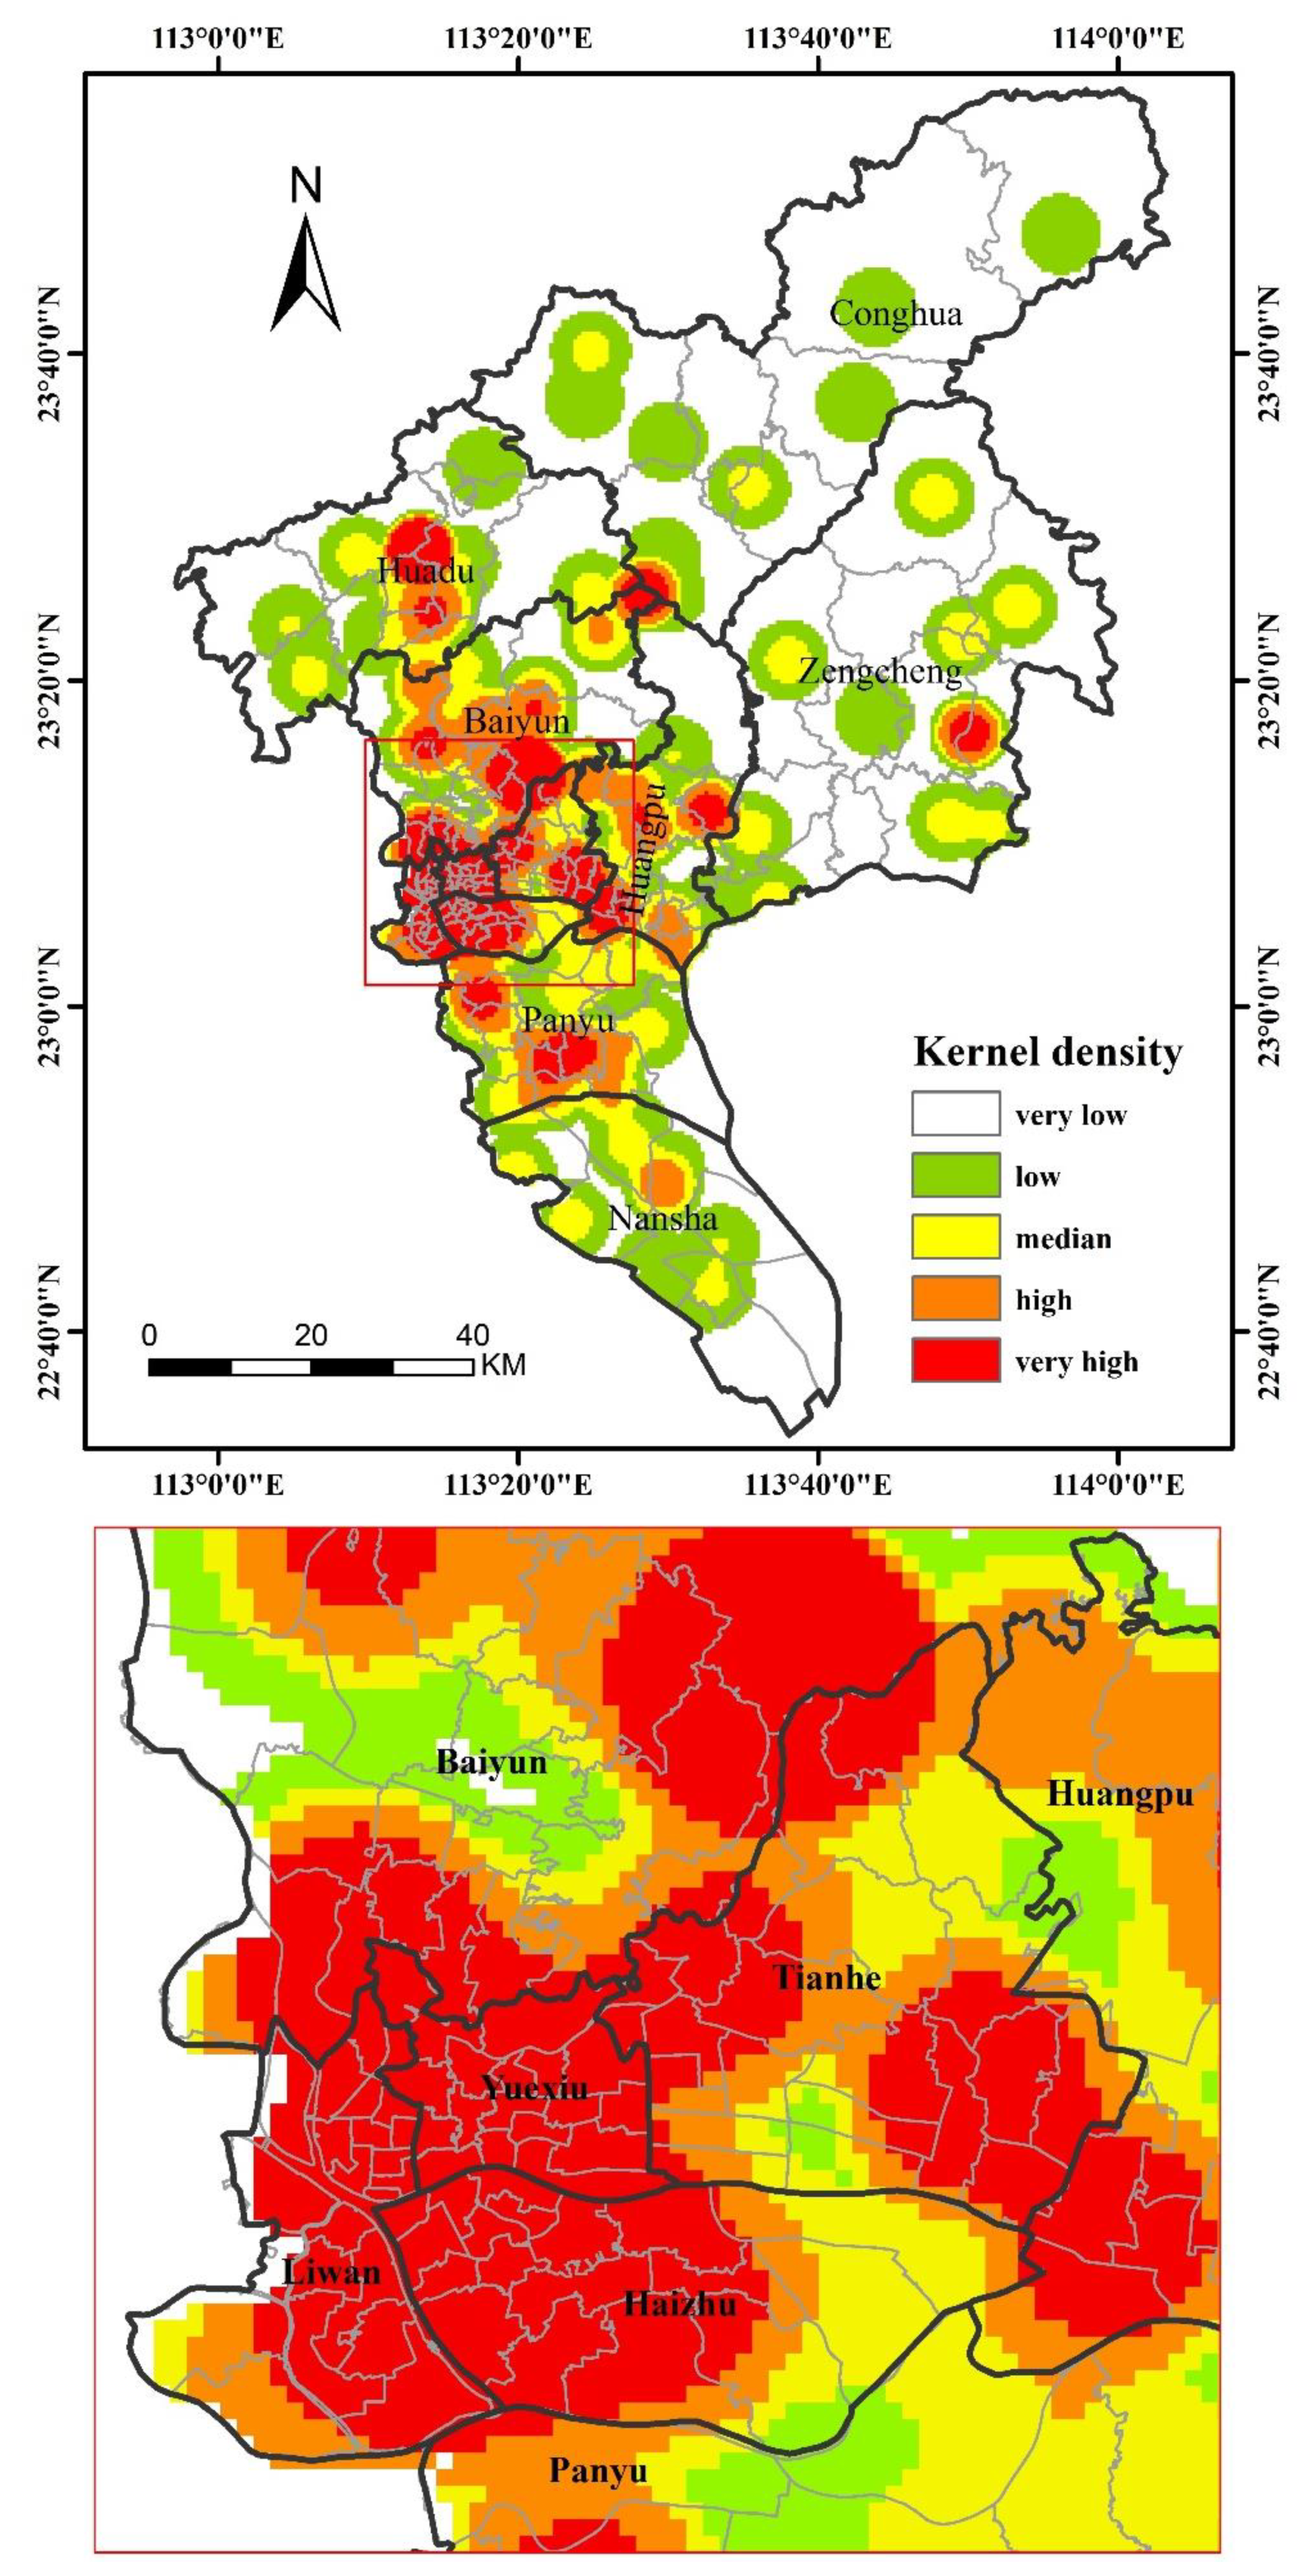
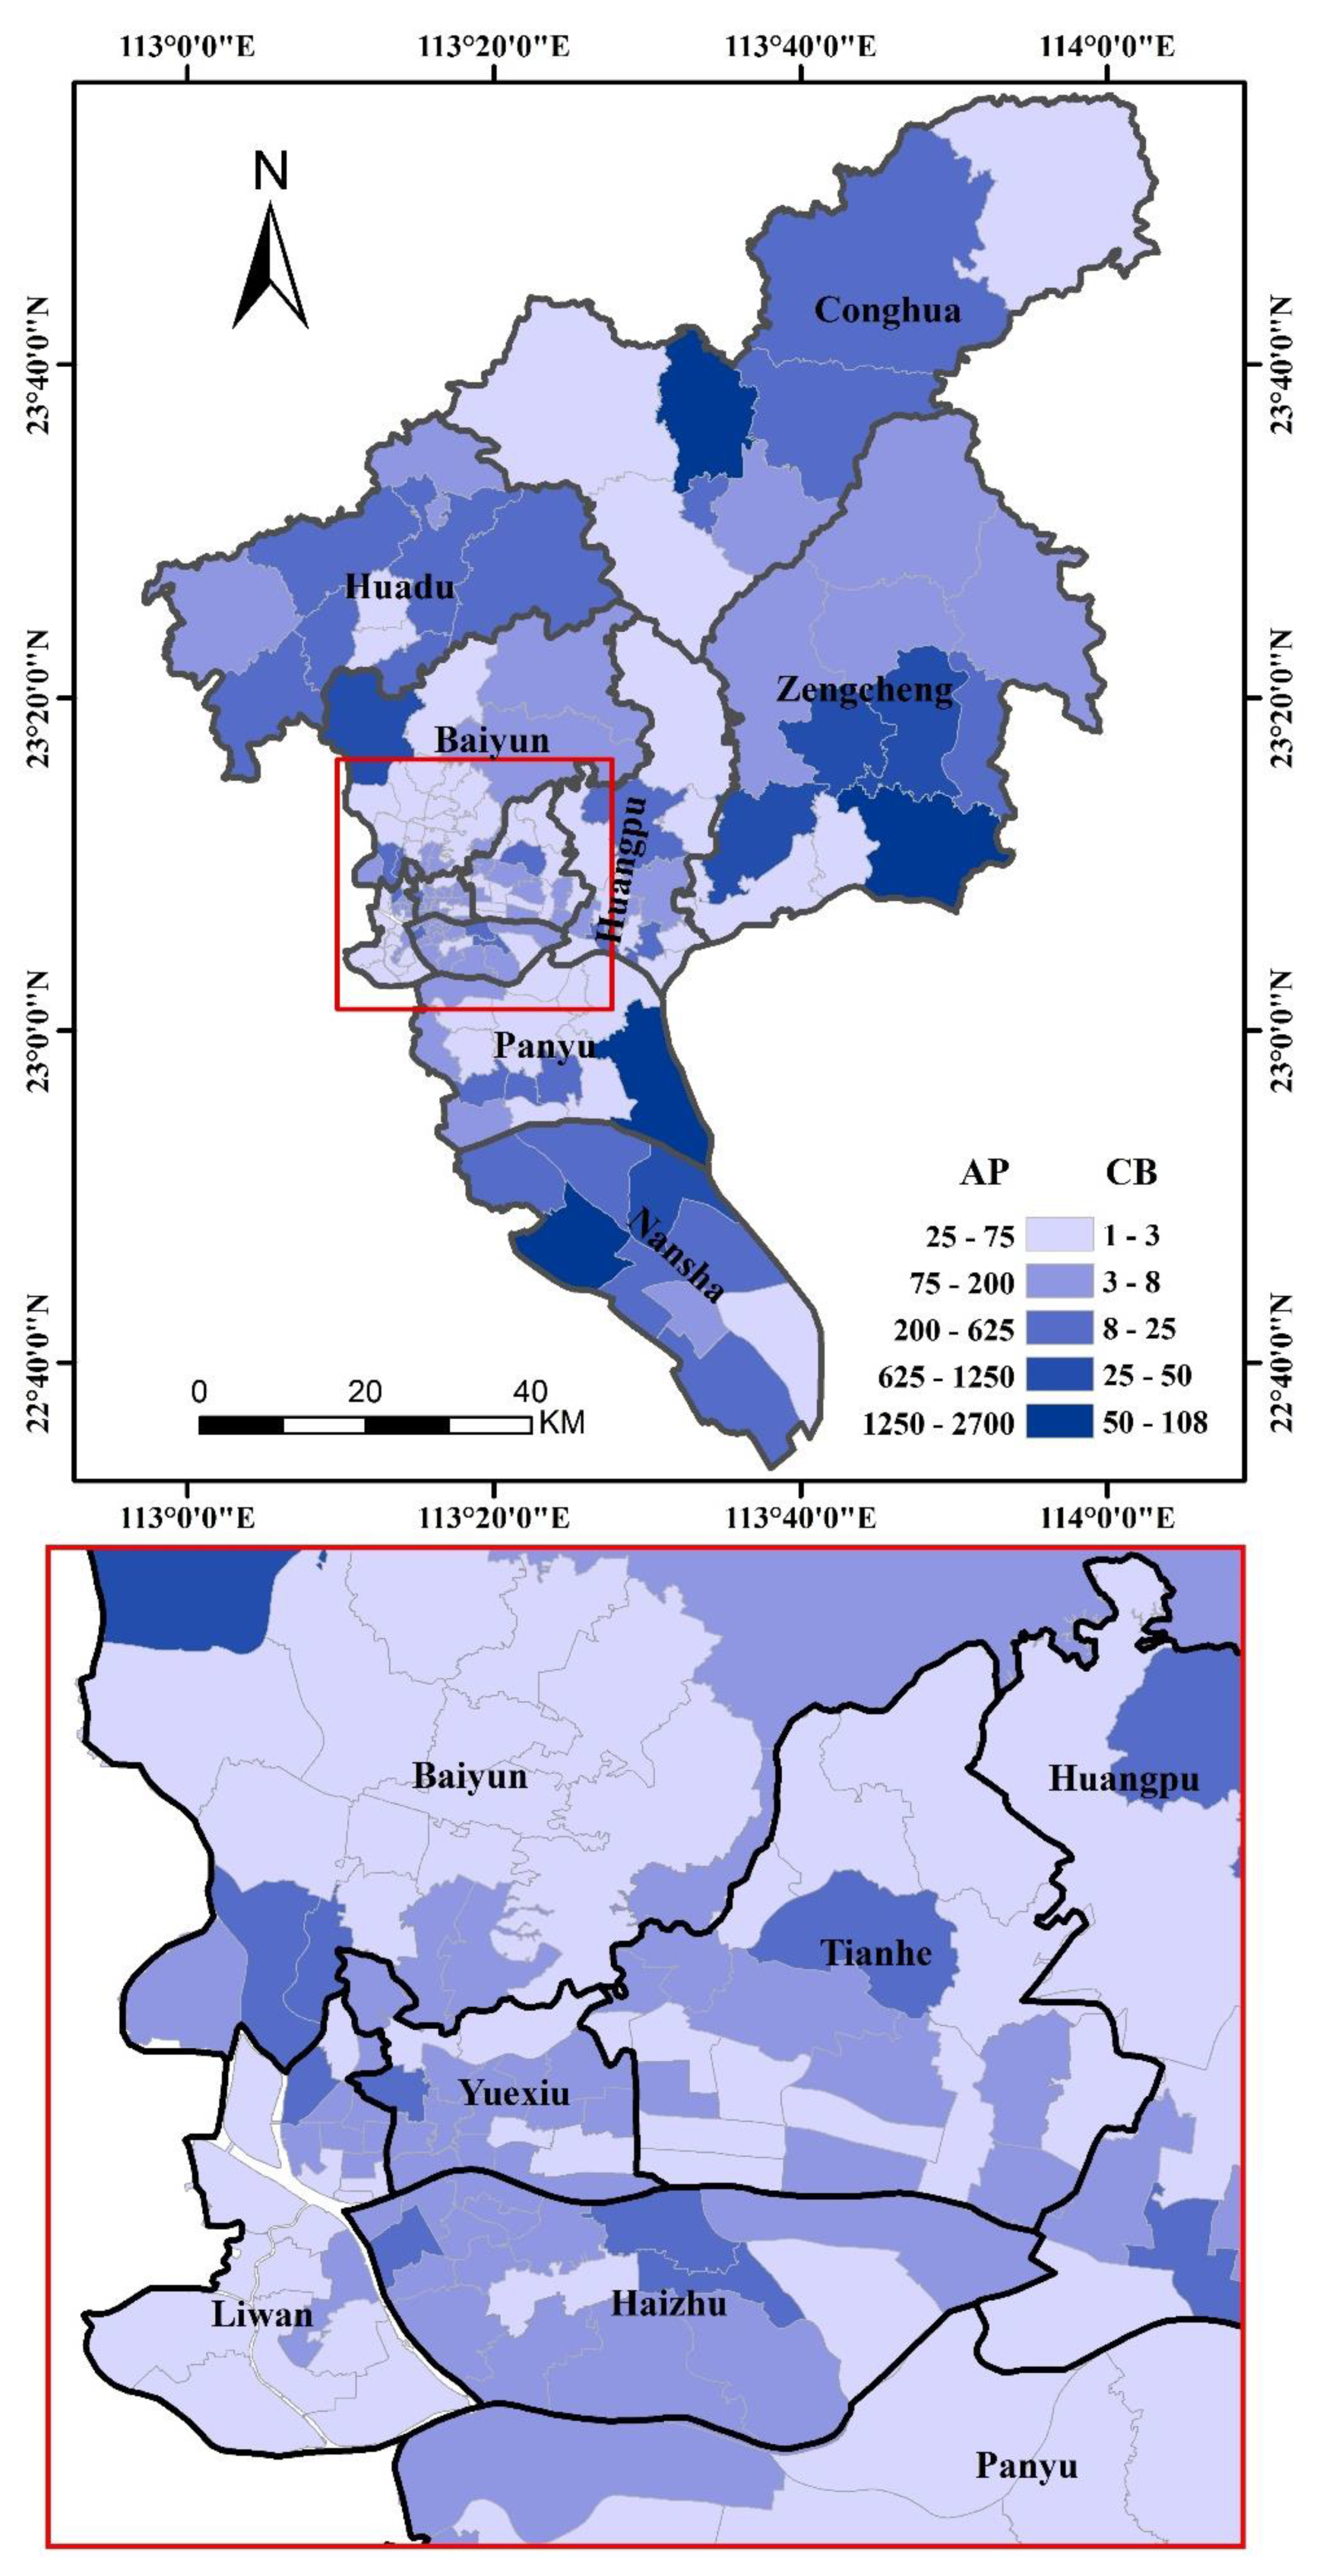
4.1. The Spatial Distribution Characteristics of RCFs in Guangzhou
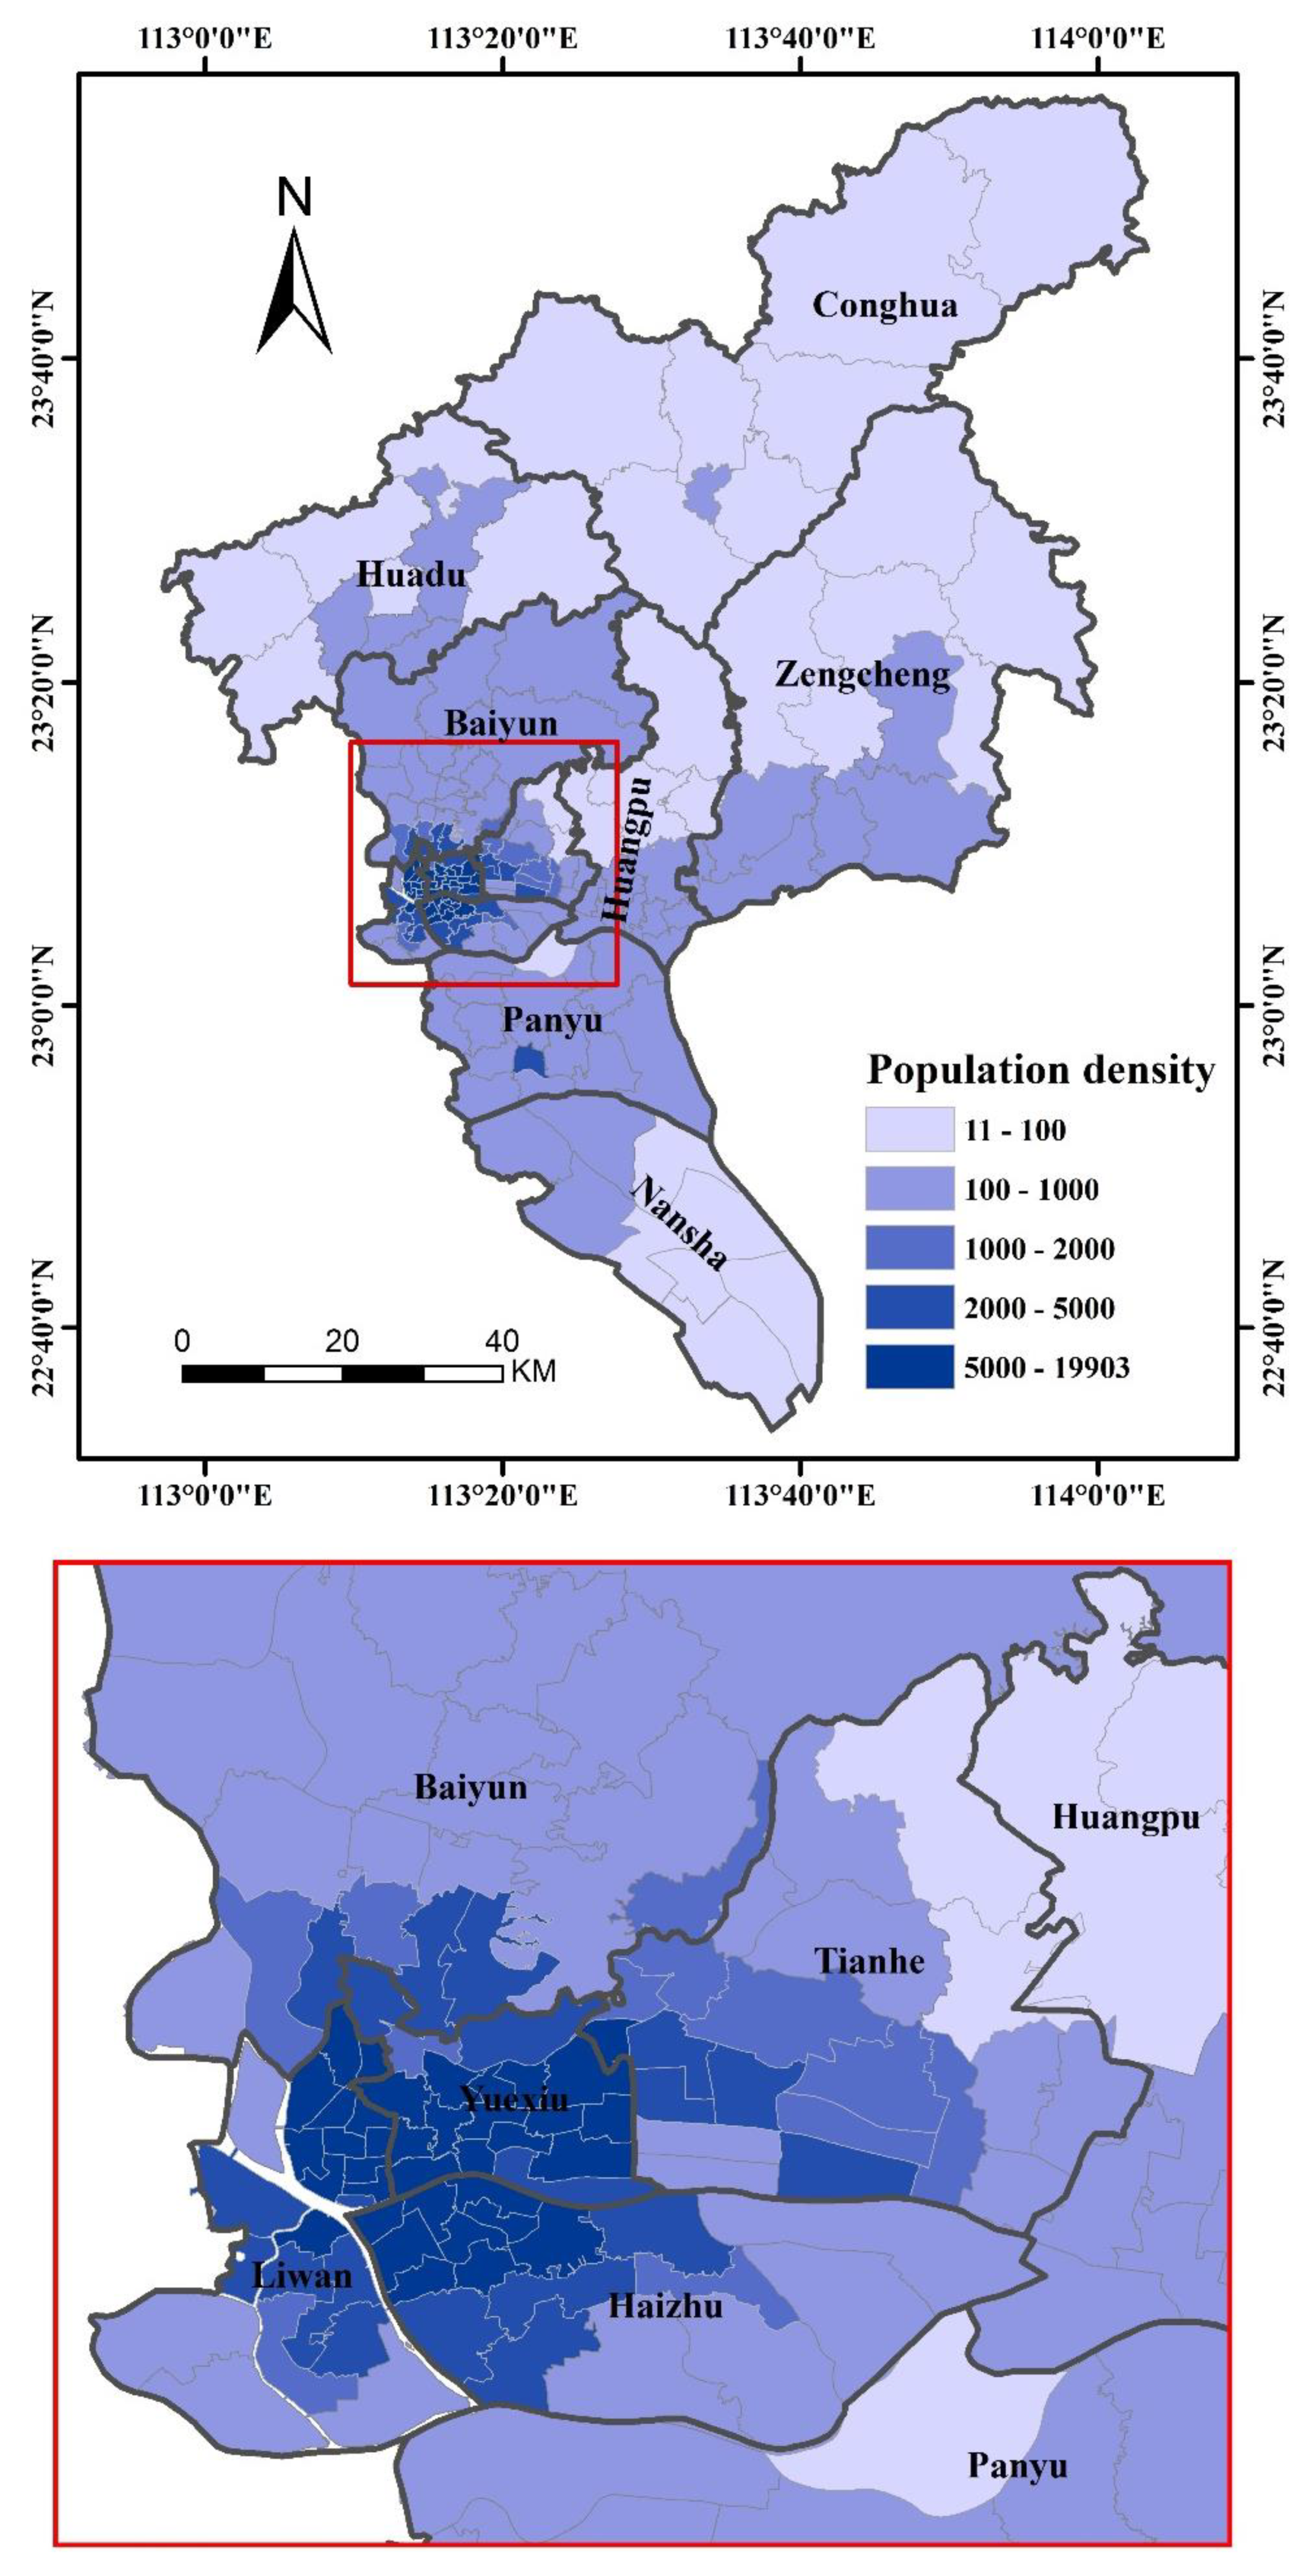
4.2. The Spatial Variations of the Elderly in 2020
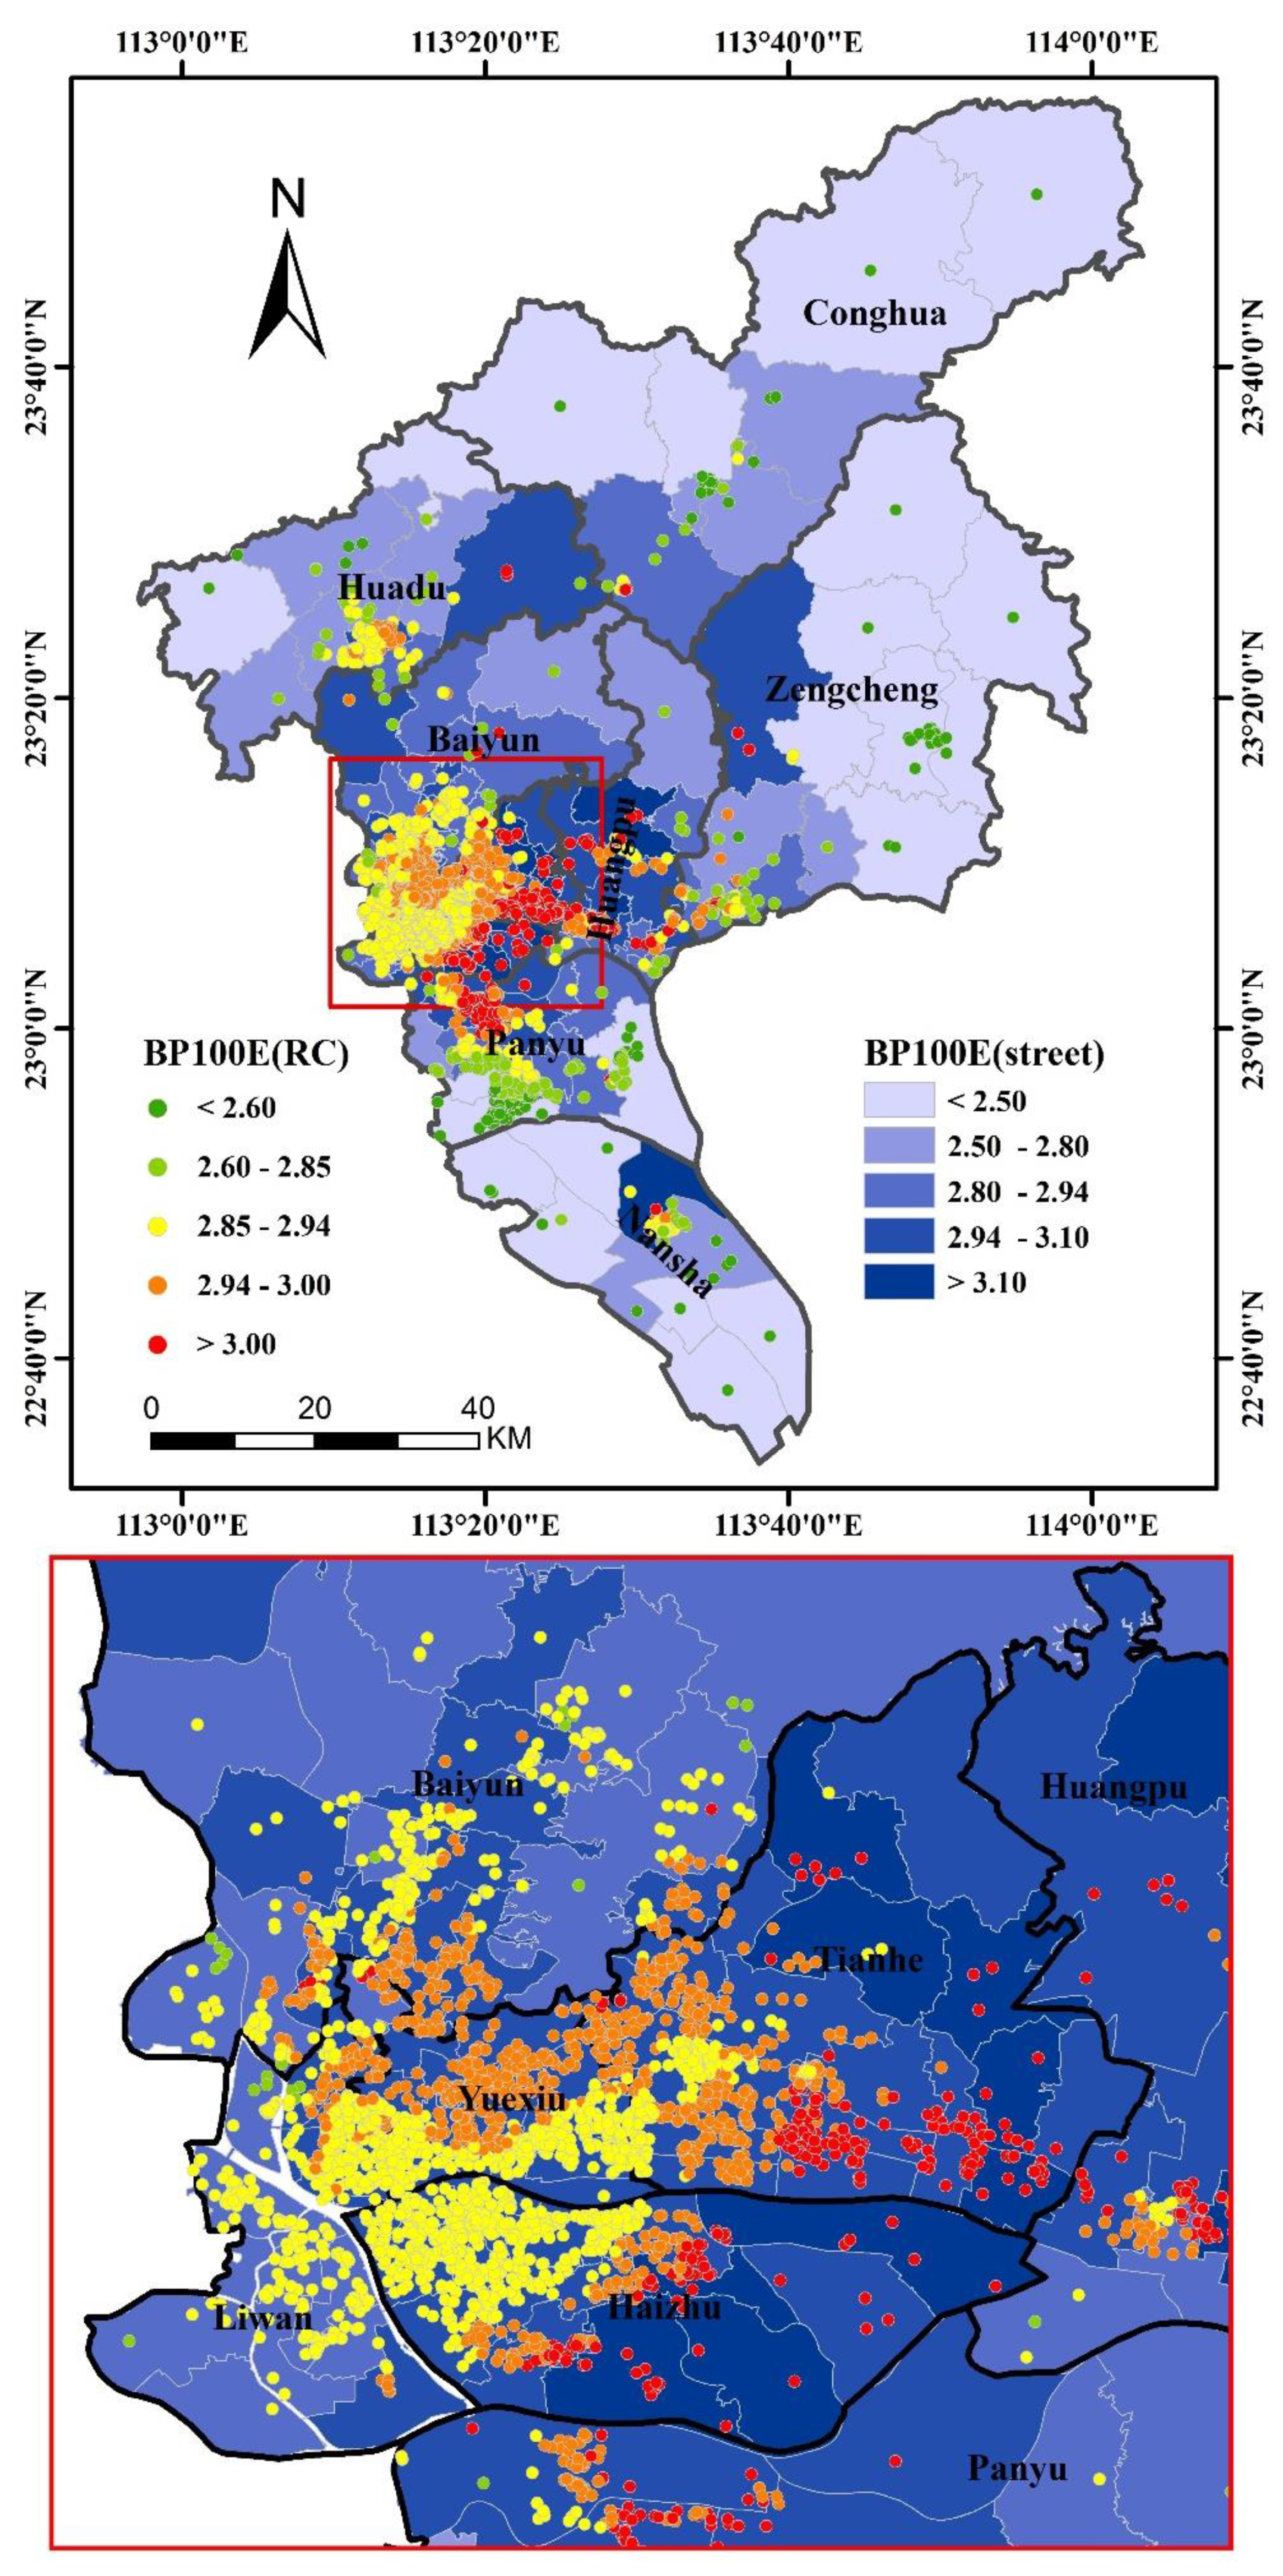
4.3. The Accessibilities to RCFs in Guangzhou on Residential Community and Street Scale
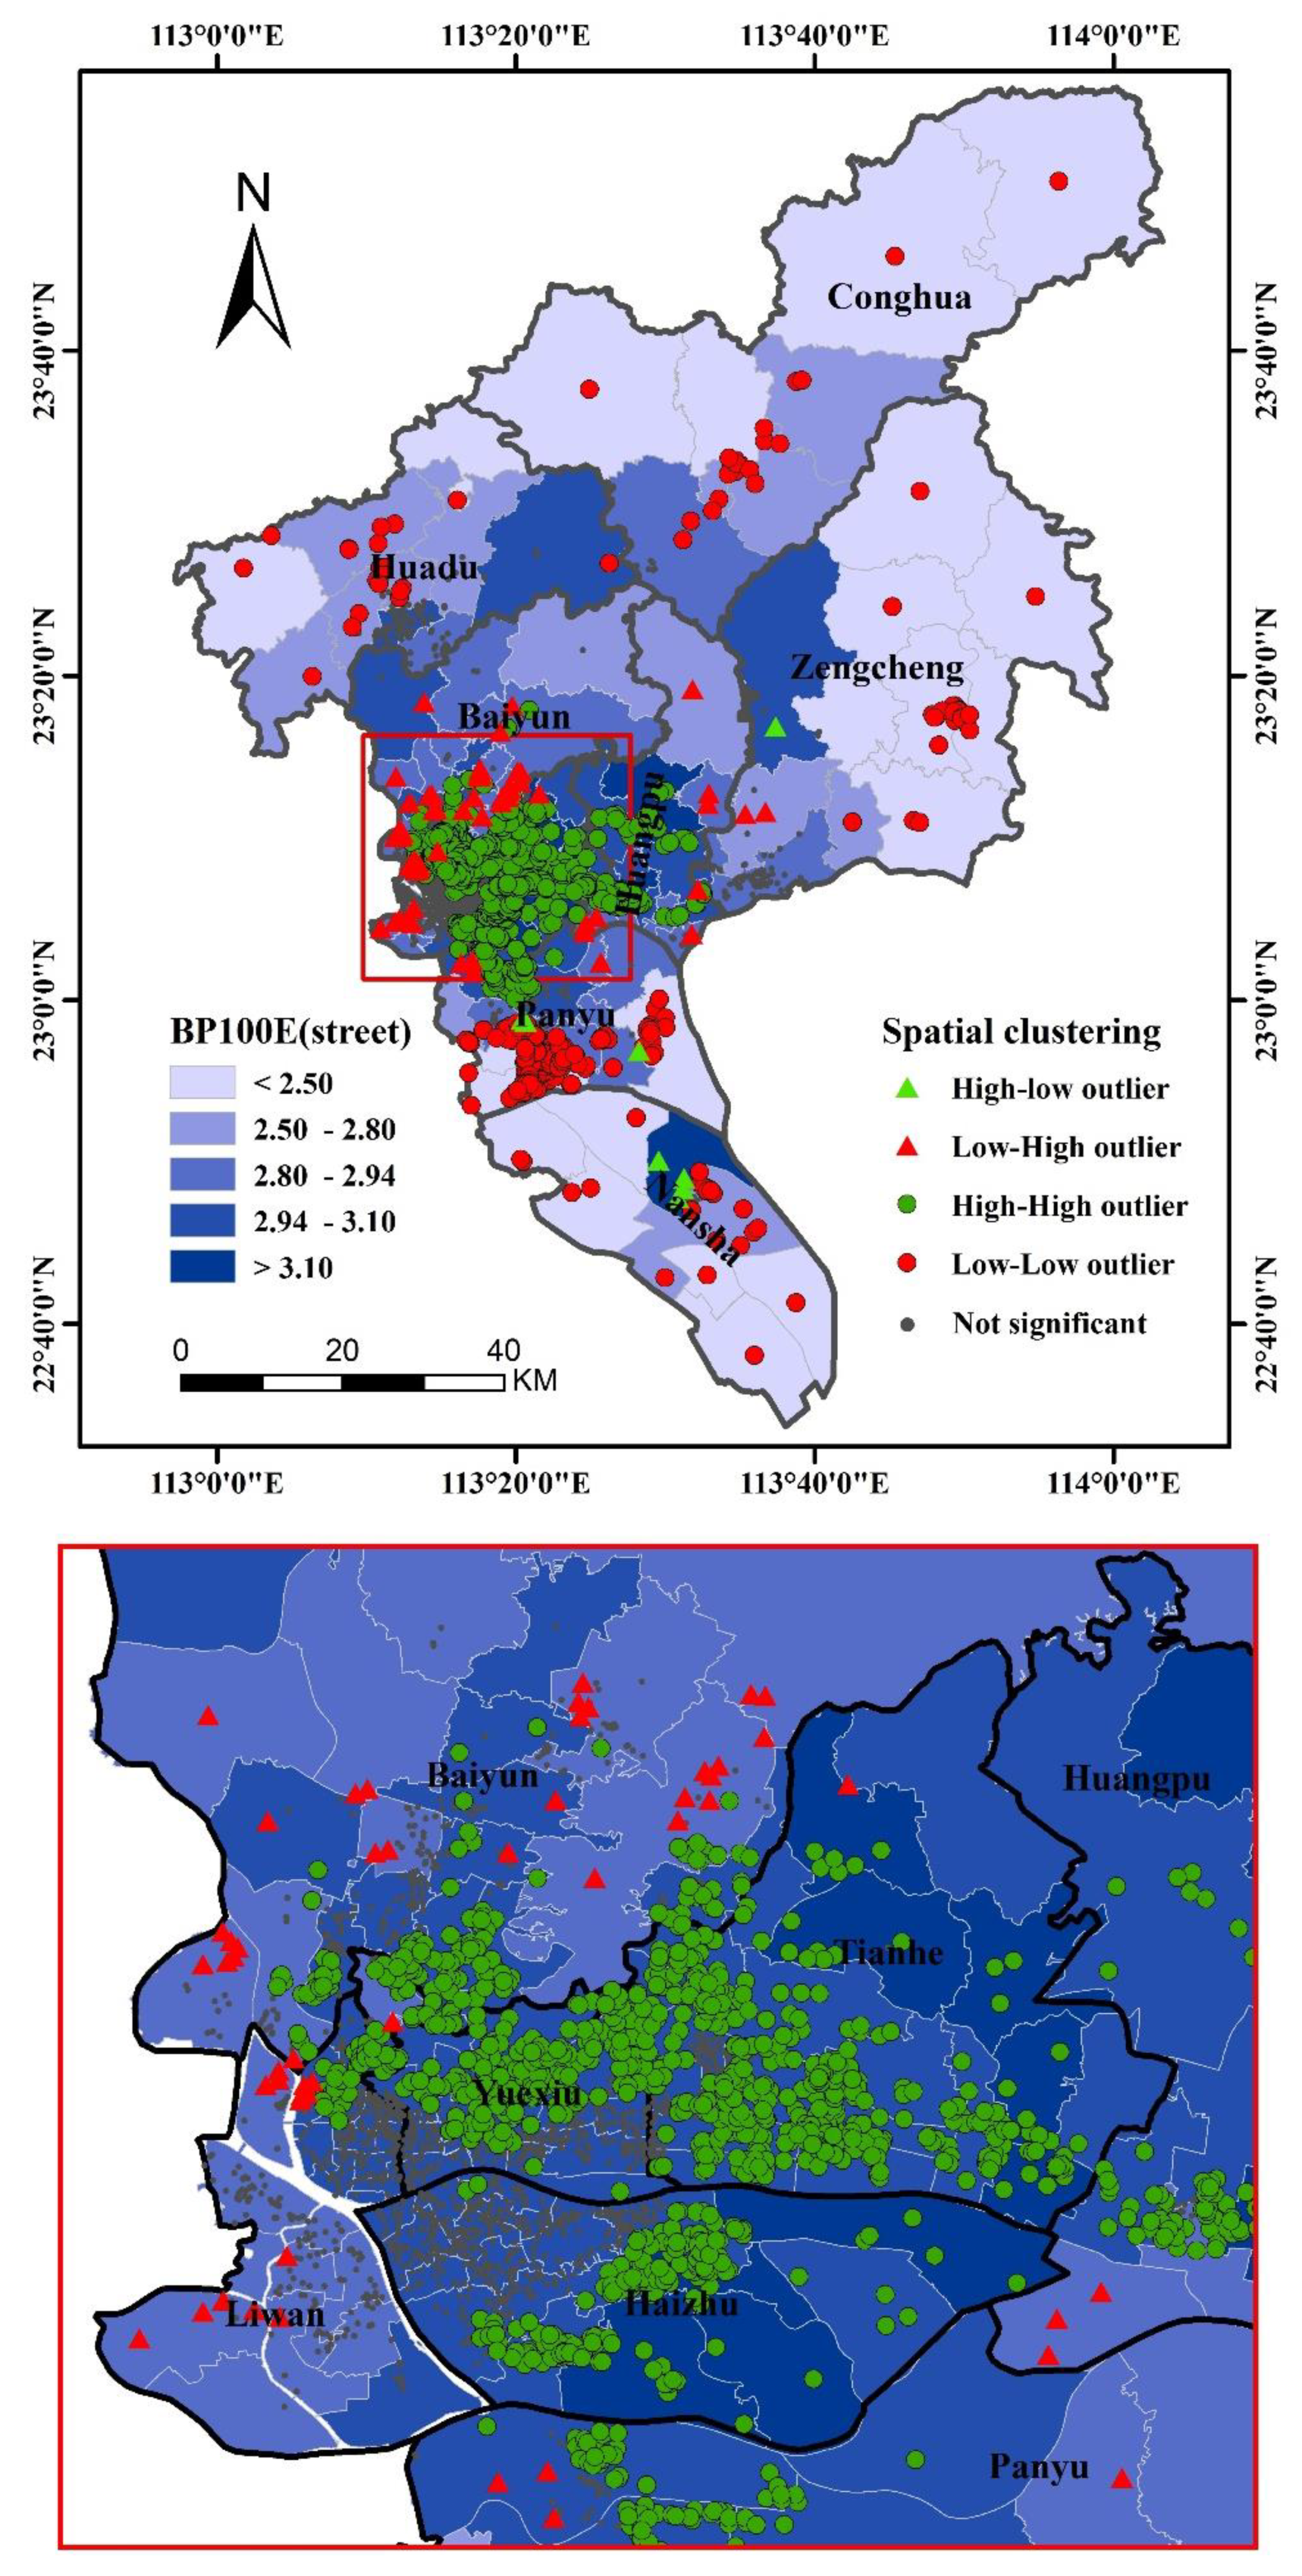
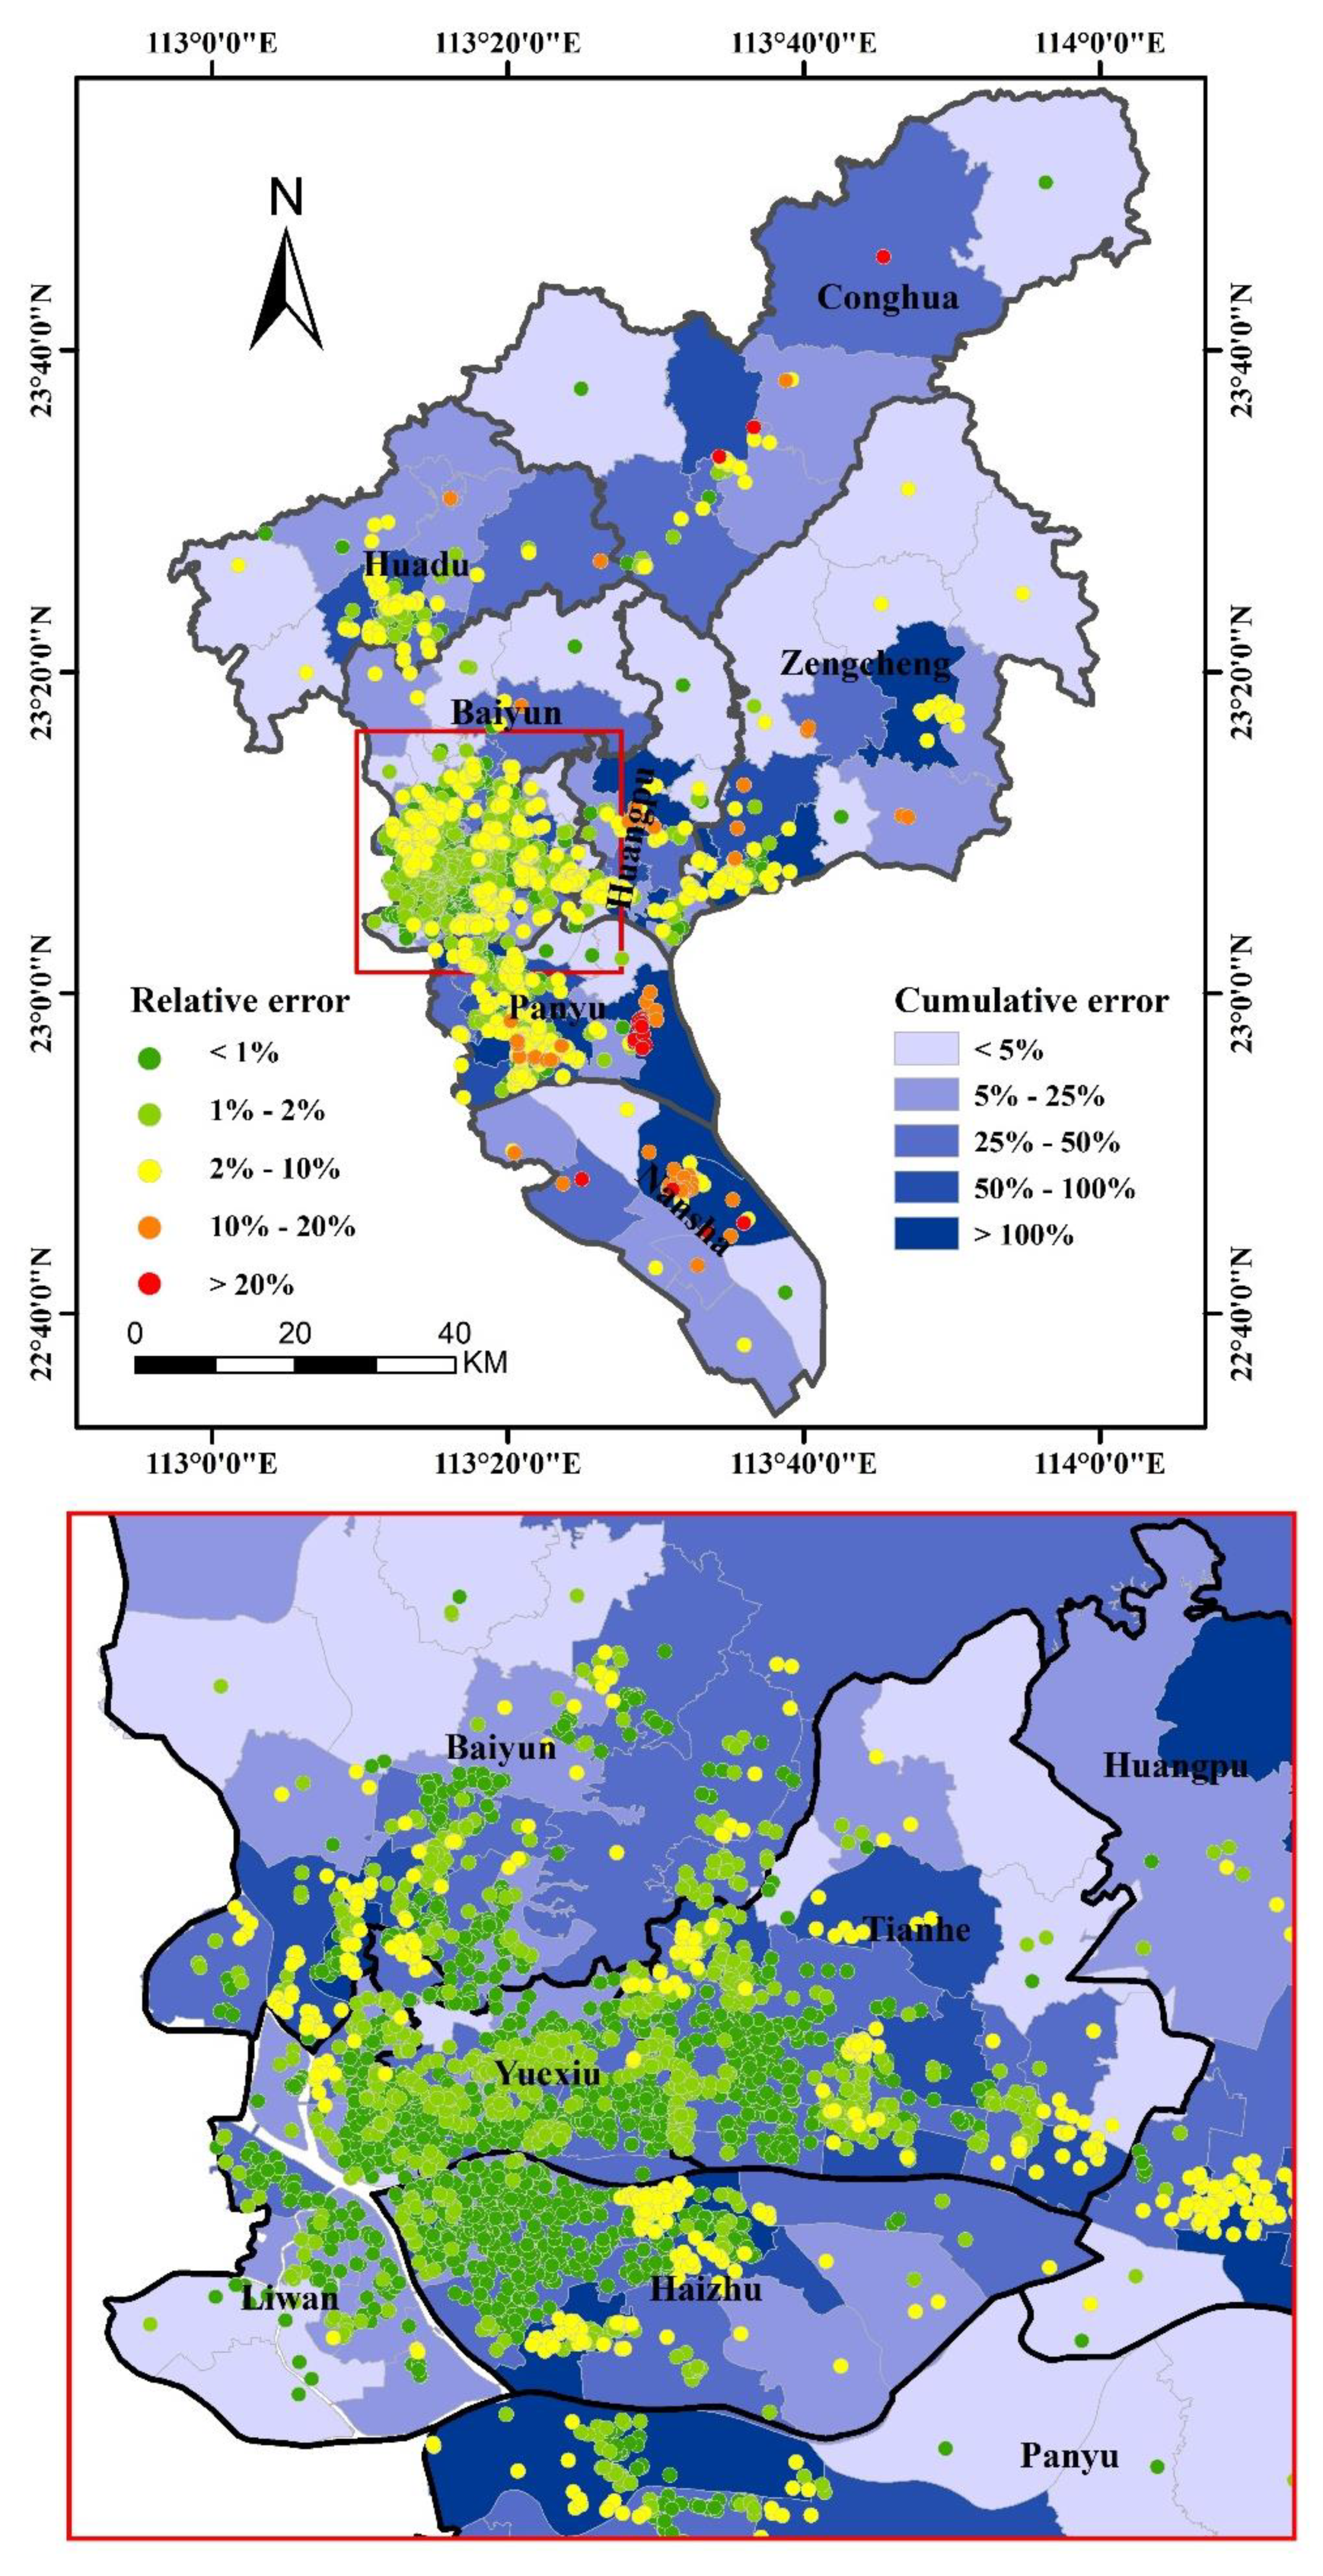
4.4. The Difference of the Accessibilities based on the Two Scales Data
5. Conclusions and Suggestions for Future Urban Planning
Author Contributions
Funding
Acknowledgments
Conflicts of Interest
References
- Zhou, R.; Zhuang, R.; Huang, C. Pattern evolution and formative mechanism of aging in China. Acta Geogr. Sin. 2019, 74, 2163–2177. [Google Scholar]
- Cheng, Y.; Rosenberg, M.; Wang, W.; Yang, L.; Li, H. Aging, health and place in residential care facilities in Beijing, China. Soc. Sci. Med. 2011, 72, 365–372. [Google Scholar] [CrossRef] [PubMed]
- Cheng, Y.; Wang, J.E.; Rosenberg, M. Spatial access to residential care resources in Beijing, China. Int. J. Health Geogr. 2012, 11, 32–42. [Google Scholar] [CrossRef] [PubMed] [Green Version]
- Available online: http://www.gz.gov.cn/zfjgzy/gzswsjkwyh/zdlyxxgk/jbylws/ggws/content/post_2996619.html (accessed on 14 April 2020).
- Available online: http://mzj.gz.gov.cn/gkmlpt/content/4/4460/post_4460876.html (accessed on 14 April 2020).
- Billaudeau, N.; Oppert, J.; Simon, C.; Charreire, H.; Casey, R.; Salze, P.; Badariotti, D.; Banos, A.; Weber, C.; Chaix, B. Investigating disparities in spatial accessibility to and characteristics of sportfacilities: Direction, strength, and spatial scale of associations with area income. Health Place 2011, 17, 114–121. [Google Scholar] [CrossRef]
- Higgs, G.; Langford, M.; Norman, P. Accessibility to sport facilities in Wales: A GIS-based analysis of socioeconomic variations in provision. Geoforum 2015, 62, 105–120. [Google Scholar] [CrossRef] [Green Version]
- Tao, Z.; Cheng, Y.; Dai, T.; Li, X. Spatial optimization of residential care facility locations in 2020 in Beijing: Maximum equity in accessibility. Prog. Geogr. 2015, 34, 1609–1616. [Google Scholar]
- Dennis, K.; Luis, R.; Erick, G.; Rebecca, L.; Patrick, S. Spatial accessibility of drug treatment facilities and the effects on locus of control, drug use, and service use among heroin-injecting Mexican American men. Int. J. Drug Policy 2014, 25, 598–607. [Google Scholar]
- Gharani, P.; Stewart, K.; Ryan, G. An enhanced approach for modeling spatial accessibility for In Vitro fertilization services in the rural Midwestern United States. Appl. Geogr. 2015, 64, 12–23. [Google Scholar] [CrossRef]
- Kayleigh, B.; James, A.; Jacqueline, M.; Kloppd, J. Accessibility across transport modes and residential developments in Nairobi. J. Transp. Geogr. 2019, 74, 77–90. [Google Scholar]
- Bauer, J.; Müller, R.; Brüggmann, D.; Groneberg, D.A. Spatial accessibility of primary care in England: A cross-sectional study using a floating catchment area method. Health Serv. Res. 2018, 53, 1957–1978. [Google Scholar] [CrossRef]
- Chen, X.; Jia, P. A comparative analysis of accessibility measures by the two-step floating catchment area (2SFCA) method. Int. J. Geogr. Inf. Sci. 2019, 33, 1739–1758. [Google Scholar] [CrossRef]
- Guagliardo, M.F. Spatial accessibility of primary care concepts, methods and challenges. Int. J. Health Geogr. 2004, 3, 3–15. [Google Scholar] [CrossRef] [PubMed] [Green Version]
- Radke, J.; Mu, L. Spatial decompositions, modeling and mapping service regions to predict access to social programs. Geogr. Inf. Sci. 2000, 6, 105–112. [Google Scholar] [CrossRef]
- Stentzel, U.; Bahr, J.; Fredrich, D.; Piegsa, J.; Hoffmann, W.; Berg, N. Is there an association between spatial accessibility of outpatient care and utilization? Analysis of gynecological and general care. BMC Health Serv. Res. 2018, 18, 322. [Google Scholar] [CrossRef]
- Tao, Z.; Yao, Z.; Kong, H.; Duan, F.; Li, G. Spatial accessibility to healthcare services in Shenzhen, China: Improving the multimodal two-step floating catchment area method by estimating travel time via online map APIs. BMC Health Serv. Res. 2018, 18, 345. [Google Scholar] [CrossRef]
- Yin, C.; He, Q.; Liu, Y.; Chen, W.; Gao, Y. Inequality of public health and its role in spatial accessibility to medical facilities in China. Appl. Geogr. 2018, 92, 50–62. [Google Scholar] [CrossRef]
- Yu, W.; Ai, T.; Li, J.; Yang, M.; Shuai, Y. Potential change of spatial accessibility to health services with the opening of private streets in Shenzhen, China. IEEE Access 2018, 6, 72824–72835. [Google Scholar] [CrossRef]
- Tao, Z.; Cheng, Y.; Dai, T. Measuring spatial accessibility to residential care facilities in Beijing. Prog. Geogr. 2014, 33, 616–624. [Google Scholar]
- Yang, D.; Goerge, R.; Mullner, R. Comparing GIS-based methods of measuring spatial accessibility to health services. J. Med. Syst. 2006, 30, 23–32. [Google Scholar] [CrossRef]
- KC, K.; Corcoran, J.; Chhetri, P. Measuring the spatial accessibility to fire stations using enhanced floating catchment method. Socio Econ. Plan. Sci. 2020, 69, 100673. [Google Scholar] [CrossRef]
- Tao, Z.; Cheng, Y. Research progress of the two-step floating catchment area method and extensions. Prog. Geogr. 2016, 35, 589–599. [Google Scholar]
- McGrail, M.R.; Humphreys, J.S. Measuring spatial accessibility to primary care in rural areas: Improving the effectiveness of the two-step floating catchment area method. Appl. Geogr. 2009, 29, 533–541. [Google Scholar] [CrossRef]
- Ouko, J.; Gachari, M.; Sichangi, A.; Alegana, V. Geographic information system-based evaluation of spatial accessibility to maternal health facilities in Siaya County, Kenya. Geogr. Res. 2019, 57, 286–298. [Google Scholar] [CrossRef]
- Jia, P.; Shi, X.; Xierali, I. Teaming up census and patient data to delineate fine-scale hospital service areas and identify geographic disparities in hospital accessibility. Env. Monit Assess 2019, 191, 303. [Google Scholar] [CrossRef] [PubMed] [Green Version]
- Song, Z.; Chen, W.; Zhang, G.; Zhang, L. Spatial accessibility to public service facilities and its measurement approaches. Prog. Geogr. 2010, 29, 1217–1224. [Google Scholar]
- Wang, F. Quantitative Methods Applications in GIS; The Commercial Press: Beijing, China, 2011. [Google Scholar]
- Available online: http://www.stats.gov.cn/tjsj/pcsj/rkpc/6rp/indexch.htm (accessed on 14 April 2020).
- Luo, W.; Wang, F.H. Measures of spatial accessibility to health care in a GIS environment: Synthesis and a case study in the Chicago region. Environ. Plan. B Plan. Des. 2003, 30, 865–884. [Google Scholar] [CrossRef] [Green Version]
- Wang, D.; Bao, S.; Wang, C.; Wang, C. Agricultural meteorological disaster grading in Guangdong Province based on data mining. J. Disaster Res. 2016, 12, 187–197. [Google Scholar] [CrossRef]
- Xie, Y.; Sha, Z.; Yu, M.; Bai, Y.; Zhang, L. A comparison of two models with Landsat data for estimating above ground grassland biomass in Inner Mongolia, China. Ecol. Model. 2009, 220, 1810–1818. [Google Scholar] [CrossRef]


| Guangzhou | District | Streets (Towns) | Residential Communities | RCFs (beds < 100, 100–300, >300) | The Elderly Population |
|---|---|---|---|---|---|
| The central city | Yuexiu | 18 | 512 | 19 (10,8,1) | 290,082 |
| Tianhe | 21 | 573 | 12 (9,1,2) | 152,883 | |
| Haizhu | 18 | 618 | 26 (11,11,4) | 297,629 | |
| Liwan | 22 | 382 | 30 (11,14,5) | 205,478 | |
| The main city | Baiyun | 22 | 421 | 31 (4,16,11) | 224,552 |
| Huangpu | 14 | 144 | 10 (2,2,6) | 79,940 | |
| Panyu | 16 | 562 | 17 (4,9,4) | 155,355 | |
| Nansha | 9 | 39 | 10 (5,4,1) | 76,060 | |
| The surrounding city | Huadu | 10 | 115 | 13 (6,5,2) | 127,853 |
| Zengcheng | 11 | 96 | 11 (3,7,1) | 147,673 | |
| Conghua | 8 | 32 | 10 (9,1,0) | 92,495 | |
| Total | 11 | 169 | 3494 | 189 | 1,850,000 |
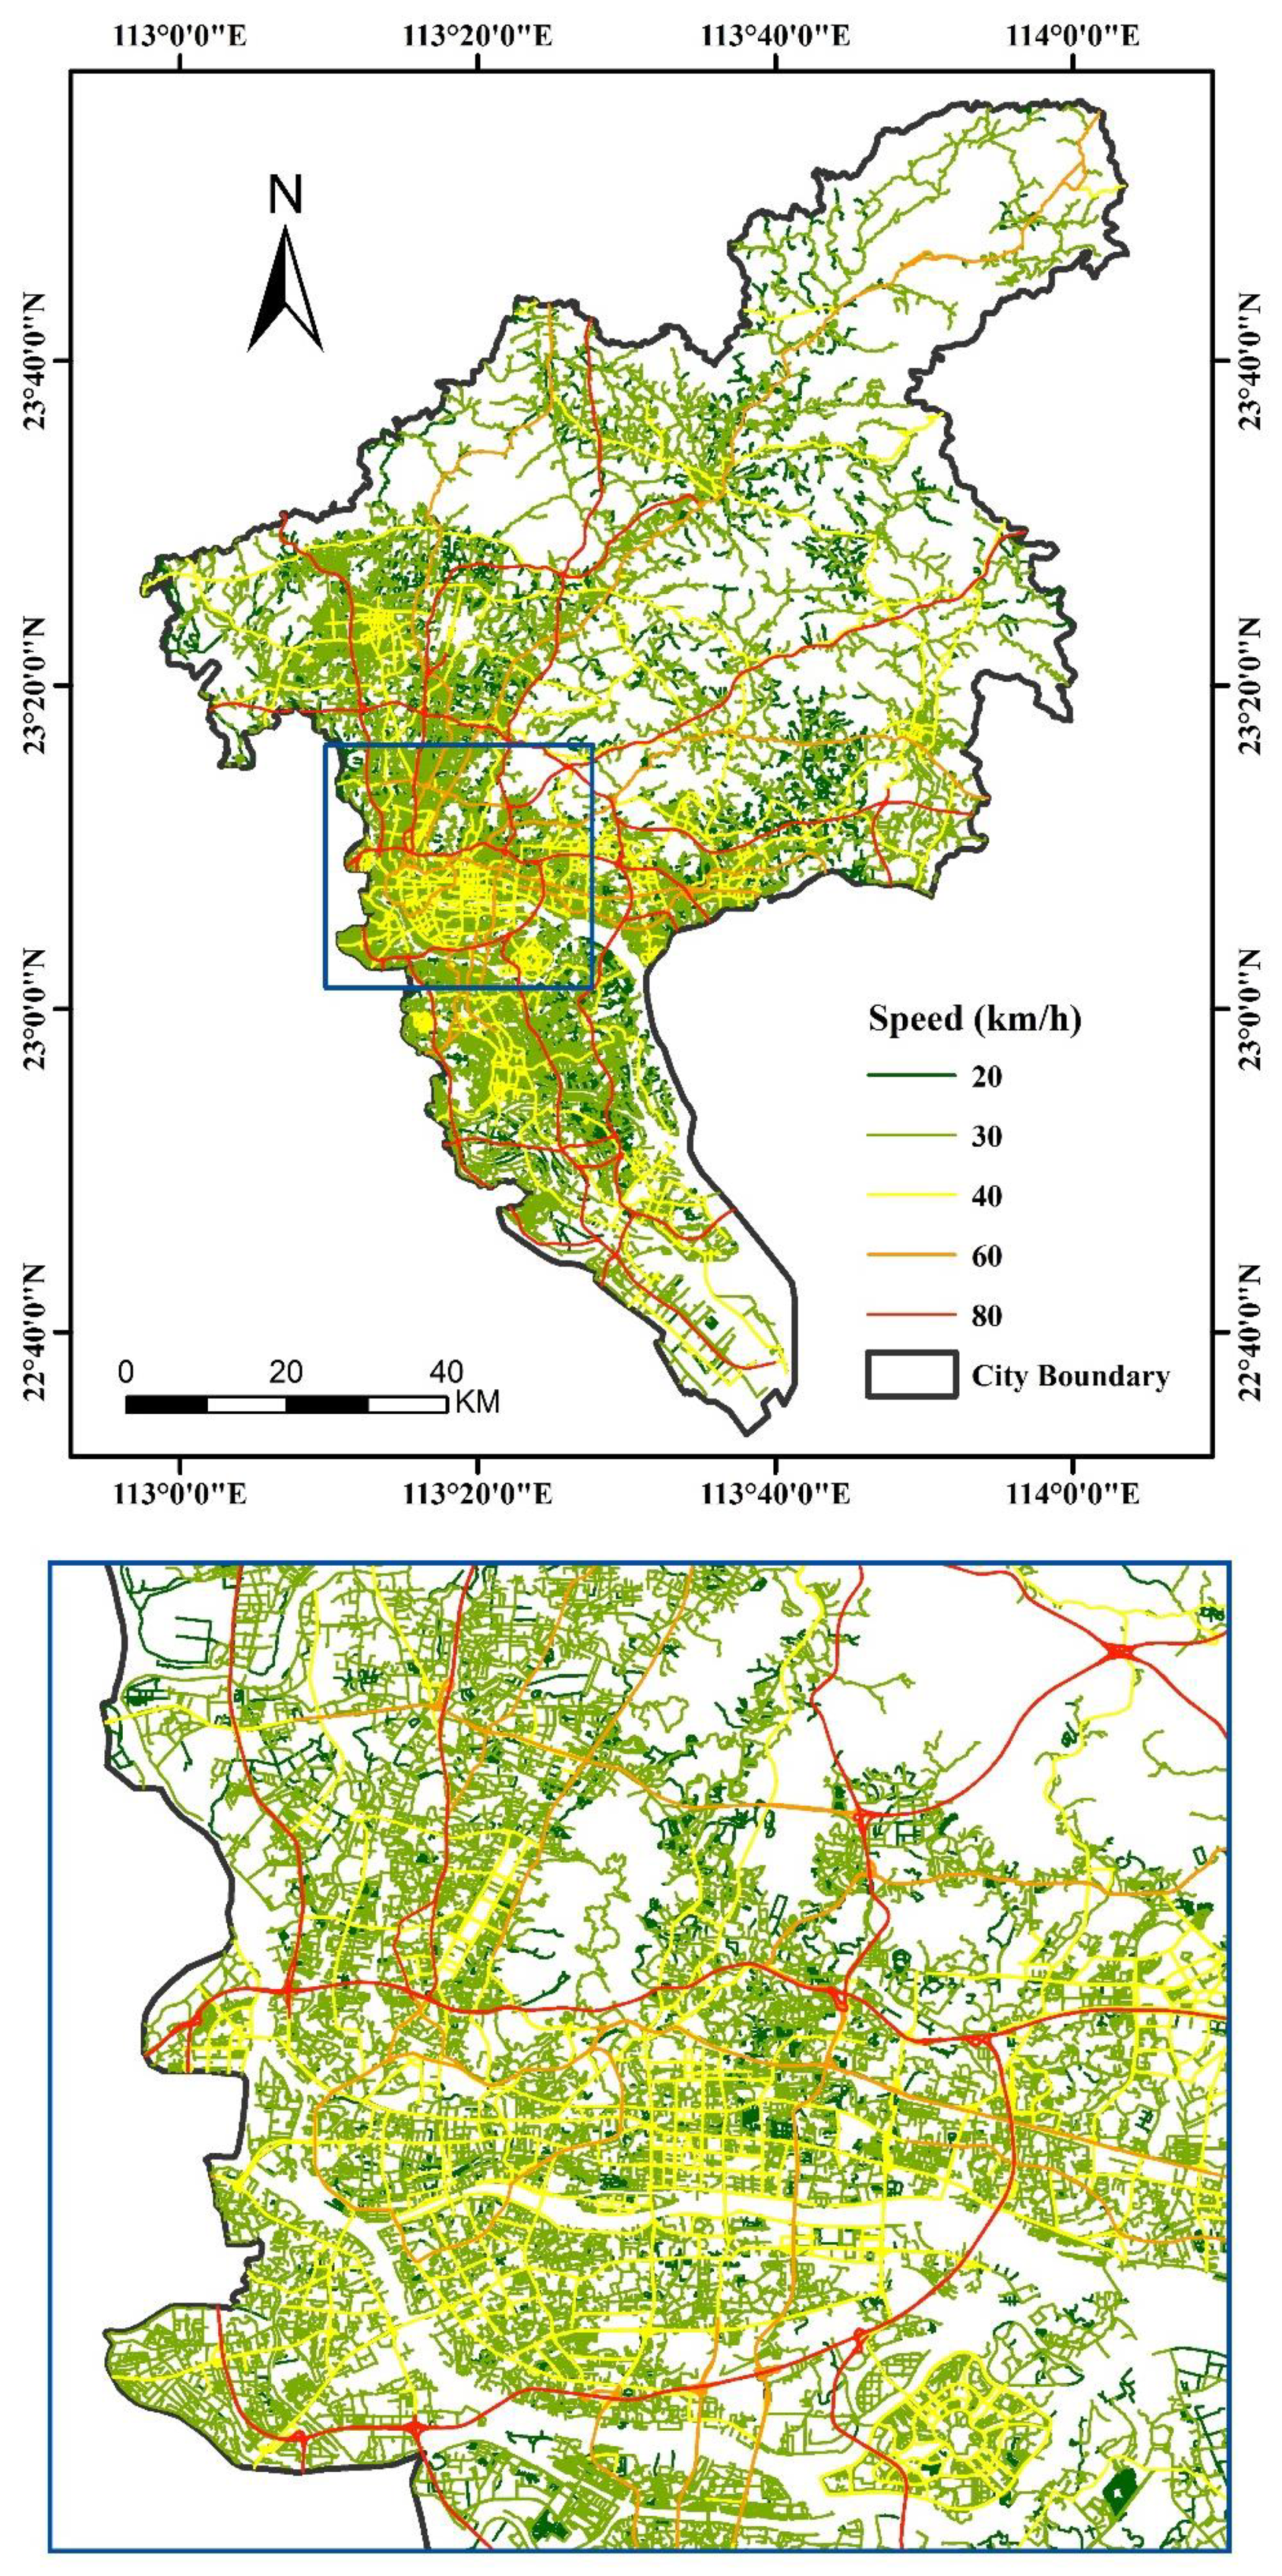
| Type | Highway | State Road | Provincial Road | County Road | Township Road |
|---|---|---|---|---|---|
| Speed (km/h) | 80 | 60 | 40 | 30 | 20 |
| District | BP100E | Streets, Aging Population (%) | Streets Count of Top 50 | |||
|---|---|---|---|---|---|---|
| BP100E < 2.9 | BP100E > 3.0 | |||||
| Yuexiu | 2.88–3.01 | 1 | 3.80 | 1 | 1.25 | 5 |
| Tianhe | 2.95–3.29 | 0 | 0 | 11 | 48.00 | 15 |
| Haizhu | 2.95–3.14 | 0 | 0 | 6 | 14.29 | 7 |
| Liwan | 2.88–3.00 | 4 | 4.46 | 0 | 0 | 3 |
| Baiyun | 2.77–3.03 | 7 | 36.99 | 4 | 23.72 | 6 |
| Huangpu | 2.76–3.32 | 5 | 41.17 | 7 | 43.91 | 8 |
| Panyu | 2.01–3.09 | 12 | 75.61 | 2 | 7.06 | 3 |
| Nansha | 1.05–3.46 | 8 | 89.73 | 1 | 10.27 | 1 |
| Huadu | 2.00–3.08 | 7 | 61.65 | 1 | 15.06 | 1 |
| Zengcheng | 1.41–3.05 | 10 | 91.82 | 1 | 8.18 | 1 |
| Conghua | 0.51–2.86 | 8 | 100 | 0 | 0 | 0 |
| Moran’s Index | Expected Index | Variance | z-Score | p-Value |
|---|---|---|---|---|
| 0.52 | 0.00 | 0.00 | 266.20 | 0.00 |
© 2020 by the authors. Licensee MDPI, Basel, Switzerland. This article is an open access article distributed under the terms and conditions of the Creative Commons Attribution (CC BY) license (http://creativecommons.org/licenses/by/4.0/).
Share and Cite
Wang, D.; Qiao, C.; Liu, S.; Wang, C.; Yang, J.; Li, Y.; Huang, P. Assessment of Spatial Accessibility to Residential Care Facilities in 2020 in Guangzhou by Small-Scale Residential Community Data. Sustainability 2020, 12, 3169. https://0-doi-org.brum.beds.ac.uk/10.3390/su12083169
Wang D, Qiao C, Liu S, Wang C, Yang J, Li Y, Huang P. Assessment of Spatial Accessibility to Residential Care Facilities in 2020 in Guangzhou by Small-Scale Residential Community Data. Sustainability. 2020; 12(8):3169. https://0-doi-org.brum.beds.ac.uk/10.3390/su12083169
Chicago/Turabian StyleWang, Danni, Changjian Qiao, Sijie Liu, Chongyang Wang, Ji Yang, Yong Li, and Peng Huang. 2020. "Assessment of Spatial Accessibility to Residential Care Facilities in 2020 in Guangzhou by Small-Scale Residential Community Data" Sustainability 12, no. 8: 3169. https://0-doi-org.brum.beds.ac.uk/10.3390/su12083169