1. Introduction
1.1. Regional Issues
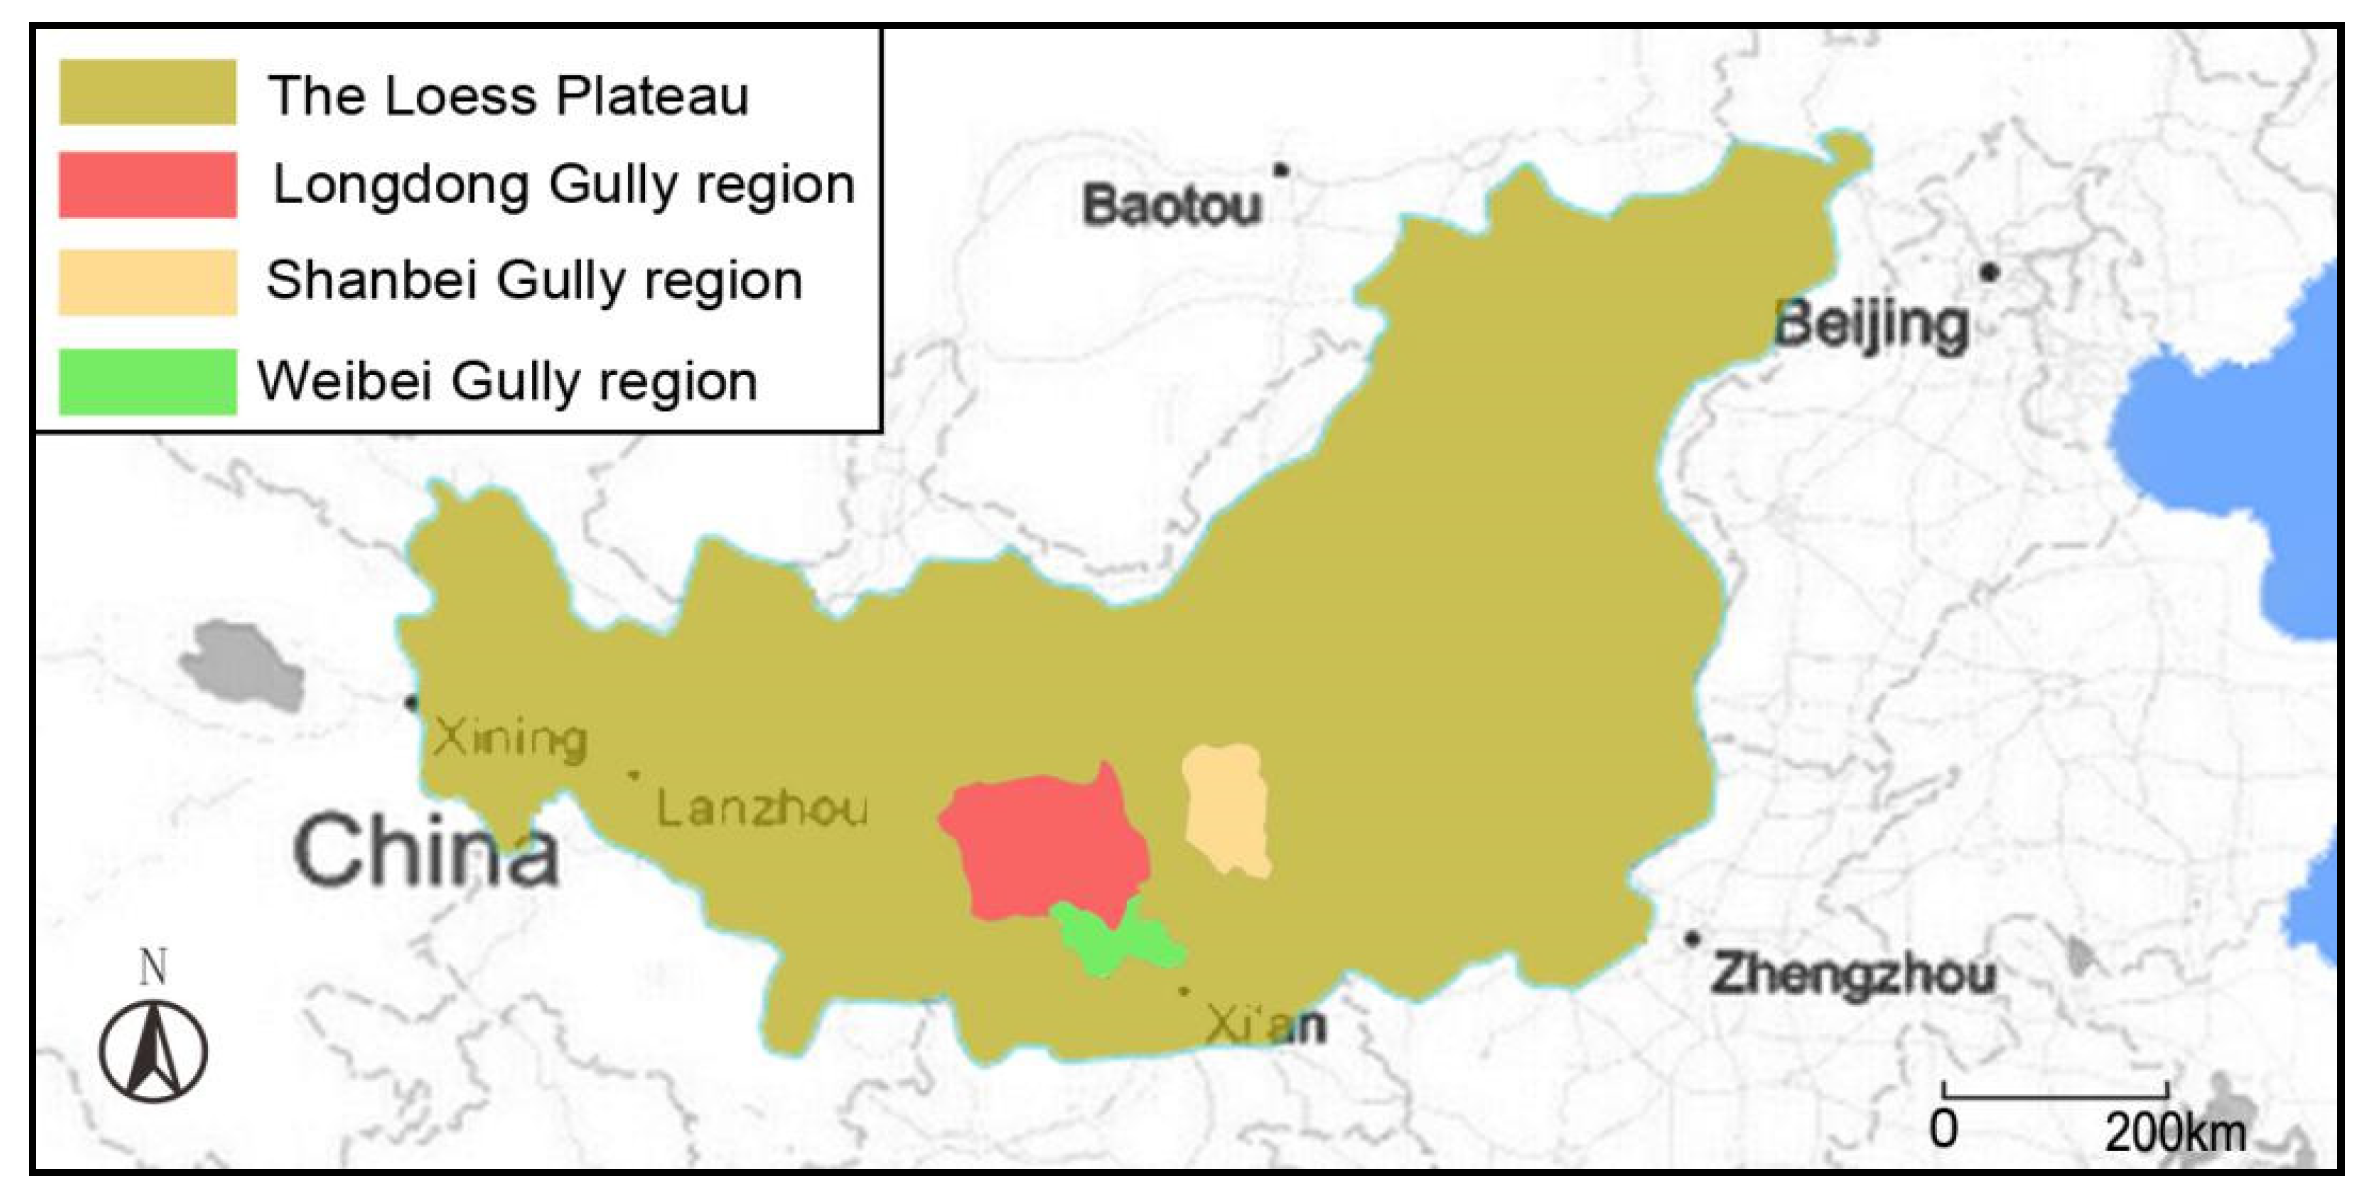
Gully regions of the Loess Plateau mainly refer to Wei Bei Loess Plateau, Shan Bei Loess Plateau, and Long Dong Loess Plateau, including seven cities, 18 counties, a population of approximately 4.3 million, and a total area of about 14.8 thousand square kilometers [
1], as shown in
Figure 1 and
Table 1. In recent years, with the process of China’s rural revitalization, improving the rural settlement environment has been on the agenda. Human settlements in the Loess Plateau have entered a drastic transformation period.
Due to the neglect of ecological carrying capacity analysis and the lack of a scientific method for human settlement planning, there have been a series of social problems in the development of gully villages.
(1) The phenomenon “gully region to tableland area migration” has intensified.
This phenomenon, which we call “gully region to tableland area migration”, means large number of residents living in gullies move to tableland, which leads to a change of demographics and urbanization forms, and will generate a need for the evolution of ecological planning, land planning, industrial layout, residential construction, and transportation for the rural system. Traditional villages generally show two distinct evolution trends: first, a growing number of migrants continue moving to tableland villages, which causes disorder and village distribution fragmentation. Second, gully villages and slope villages are abandoned. This not only causes a substantial waste of valuable land resources on tableland but also results in the abandonment and extinction of traditional villages with unique local history and culture.
(2) Ignorance of the analyses of ecological environmental carrying capacity in the process of Rural Vitalization Strategy of gully villages in the Loess Plateau.
The Rural Vitalization Strategy, which proposed the “large centralized” development model, will naturally put dispersed villages together. In the short term, the development model appears to have outstanding advantages by effectively improving the appearance of villages and realizing the rapid development of the rural economy and society on the surface. However, there are major underlying concerns in this “centralization” development model, because it ignores the developments’ influence on the natural carrying capacity, especially of the fragile ecology environment in gully regions of the Loess Plateau.
1.2. Research Background
Nowadays, existing research on the spatial development model of small towns in China mostly focuses on small towns in developed areas or plains. Studies of small towns in the gully area of the Loess Plateau are relatively insufficient. The spatial development model of small towns in the gully region of the Loess Plateau should be analyzed and can be divided into urban system, urban construction, and urban living environment. In the aspect of urban system, Yu Hanxue (2007) proposed the concept of “loess unit” as the “coordination unit for the ecological construction of human settlements” [
2]. Cao Xiangming and Zhou Ruoqi (2008) analyzed the spatial distribution characteristics of the village and town system in the gully region of the Loess Plateau and took Chunhua County in Shaanxi Province as an example [
3]. Liu Hailong et al. (2015) used Qingyang City as an example to adjust the scale structure of the urban system in this region through a comprehensive evaluation of its ecological carrying capacity and its relationship with the scale structure of cities and towns [
4]. From the perspective of urban construction, Huang Minghua et al. (2016) optimized the expansion method of the strip space in small towns in the gully region of the Loess Plateau. The multi-directional extensibility effectively merged with natural elements such as the solid edge of the mountain and established a symbiotic interdependence between cities and the environment [
5]. In terms of urban living environment, Liu Hui (2005) took the land spatial unit as the core, established the scientific theoretical model of “human settlements in the Loess Plateau”, and proposed three systems of human settlements in the Loess Plateau: a human settlement construction system, a human settlement support system, and a natural support system [
6]. Zhou Ruoqi et al. (2007) put forward the green residential model of a small watershed area in the Loess Plateau [
7], and Zhou Qinghua et al. (2014) put forward the overall framework of human settlements’ spatial system in the Loess Plateau from the perspective of green ecological building, green loess mountain towns, and green fractal landscape ecological security patterns, under the background of new urbanization [
8].
Since the beginning of 1980s, the topics of ecological carrying capacity research about ecological migration have mainly focused on follow-up on the livelihoods of ecological migrants, the land and environmental issues in ecological migration, and the cultural changes and conflicts of ecological migration. In the aspect of follow-up on the livelihoods of ecological migrants, Kai Schmidt–Soltau (2003) reviewed the only ‘official’ relocation program in the region (Korup National Park, Cameroon) and evaluated different approaches of national parks in Equatorial Guinea, Cameroon, Central African Republic, Congo (Brazzaville) and Gabon, and used the Impoverishment Risk and Reconstruction model introduced by Cernea to evaluate the risks faced by the resettled populations, and to elaborate some social and environmental guidelines to mitigate them [
9]. From the perspective of the land and environmental issues of ecological migration, Jenny Springer (2009) proposes that many ecological protection policies consider ecological resettlement more based on compensation mechanisms than preventive mechanisms. The strategy of ecological immigration is to move all the original residents to achieve the purpose of ecological protection [
10]. This measure is highly questionable. As for the cultural changes and conflicts of ecological migration, according to Michael Sernea (2003), the implementation of many ecological protection projects is accompanied by the forced migration process of indigenous peoples. The process of ecological migration is not just abandoning the original land in a simple sense but is also accompanied by survival techniques and sociocultural changes [
11]. Behrooz Morvaridi (2004) shows studies involving “involuntary” immigration have become more pervasive of the forced loss of indigenous natural resources [
12].
These previous studies have important guiding functions for the future exploration of land intensification and developing strategies of countryside construction, but these studies are to some degree macro and mainly focus on the human settlement construction in gully regions of the Loess Plateau; controlled and specific research on villages’ planning and design is still very limited.
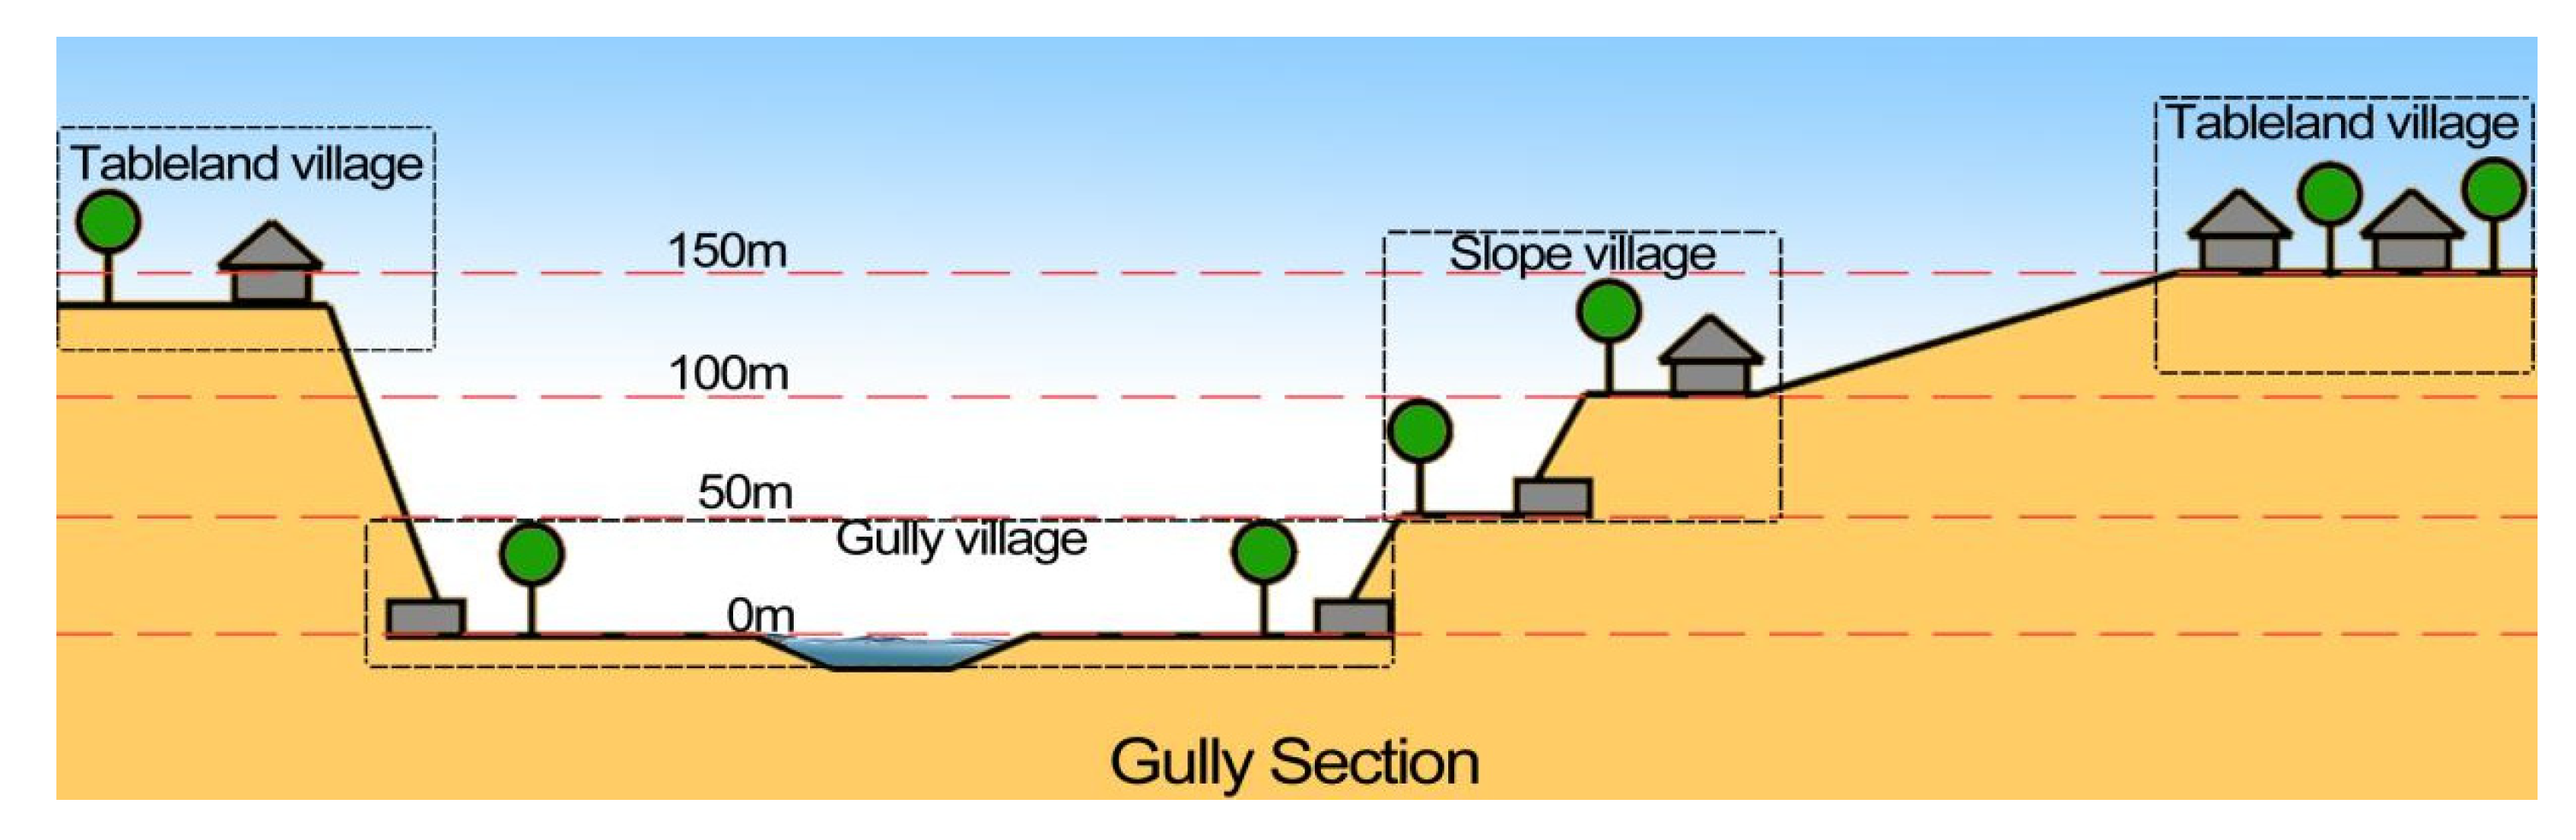
Rural habitats, shown in
Figure 2, as the smallest social unit in gully regions of the Loess Plateau, are home to a large amount of the agricultural population [
13]. Nowadays, large numbers of residents that live in gullies move to tableland [
14]. On the one hand, this has caused the disappearance of the slope villages and gully villages [
2]; on the other hand, it has increased ecological pressure on tableland, which was originally densely populated and made the original weak ecological environment much worse [
15,
16]. Meanwhile, there is a series of social problems in the development of gully villages of the Loess Plateau, such as lack of systematic research on ecological planning concepts and techniques; gaps due to the neglect of ecological carrying capacity analysis; and the lack of a scientific method in human settlement planning. All of these facts force us to figure out a suitable development model and sustainable village planning methods.
Thus, the imminent issues regarding how to conduct ecological and sustainable planning [
17], how to efficiently use and save energy and protect the environment, and how to improve residents’ productivity conditions and living environment [
18] call for solutions that are vital to both the development of rural habitats and the ecological development of whole gully regions.
2. Methodology
2.1. Analysis of Ecological Carrying Capacity of Rural Habitats
The location of the villages, the developing conditions, and the ecological carrying capacity of the surrounding villages have direct and an indirect influence on the development direction of these villages [
19]. The method of ecological carrying capacity analysis, used in the human settlements’ plan and design, is one of the significant bases for the scientific construction of new countryside [
20,
21]. Peng Kang et al. (2010) put forward the green residential model of small watershed area in the Loess Plateau based on ecological carrying capacity [
22]. R.Z. Liu et al. (2011) proposed a comprehensive measurement system for the carrying capacity of the environment, which comprises models of natural resource capacity, environmental assimilative capacity, ecosystem services capacity, and society supporting capacity [
23]. Du Wenpeng et al. (2018) pointed out that current studies solely focus on methods of ecological carrying capacity calculation while neglecting the identification of internal driving mechanisms of ecological carrying capacity [
24].
At present, the common ecological carrying capacity research methods are ecological footprint [
25,
26]; measurement of natural vegetation as first productivity [
27,
28]; supply–demand balance [
29,
30]; the state-space method [
31]; and the model forecast method, which includes the limiting factor method [
32]. Because of the shortage of statistical data and documents on rural habitat in gully regions of the Loess Plateau, ecological footprint, measurement of natural vegetation as first productivity, supply–demand balance, and the state-space method are all unsuitable for accurate measurement. Comparing the advantages and disadvantages of various methods, we finally chose the limiting factor method for our research.
The limiting factor analysis method is the most commonly used method in model forecast method; its main limiting factors are selected within the ecological system in a certain research area, and then these limiting factors can be used to fix the ecological carrying capacity [
33]. On the one hand, through the analysis of the limiting factors, the main factor that influences ecological carrying capacity can be figured out and thus can be used to guide the future planning of these villages. On the other hand, the complex ecological carrying capacity analysis can be simplified into several limiting factors; thus, this method is more feasible [
34].
The analysis of limiting factors on the ecological carrying capacity of a small region is based on the total distribution situation of each limiting factor. Through the analysis of local ecological carrying capacity to analyze and predict the present and future human settlements’ environment, it can be adopted as an important guide for the future development of these villages.
2.2. The Improvement of Limiting Factor Analysis Method Based on Ecological Carrying Capacity
According to the characteristics of human settlement planning, the limiting factors can be categorized into two kinds: one includes factors cannot easily be changed by humans, such as land resources. Another includes the adjustable factors that can be improved, such as infrastructure [
35]. To plan villages based on ecological carrying capacity, is actually to plan based on those unchangeable limiting factors. The human settlement environment of villages can greatly benefit from the improvement of the adjustable factors, and then it can result in green and sustainable development villages in gully regions of the Loess Plateau.
Based on the characteristics of the geology, landform, climate, water, vegetation, and land of the gully regions in the Loess Plateau, the situation of water loss and soil erosion and threats from sand and wind and drought are all very serious. Cultivable land and water resources are the two main factors significantly influencing human settlement in this area; thus, these two factors can be selected as main limiting factors. At the same time, the lagging development of the economy, imperfect infrastructure, and the imbalanced distribution of social resources are also the obvious present situation in gully regions; thus, infrastructure can also be selected as an important limiting factor.
Among the main limiting factors, policy is another factor, which is mainly influenced by national land policy, population planning policy, and environmental protection policy. Water resource factors are closely associated with the construction of main infrastructure and water conservancy facilities. Land resource factors are mainly limited by cultivable land area and construction land area. According to the site survey, the construction land area is relatively smaller than the cultivable land area in most villages; thus, this research solely puts cultivable land into consideration as the land resource factor for the analysis of ecological carrying capacity.
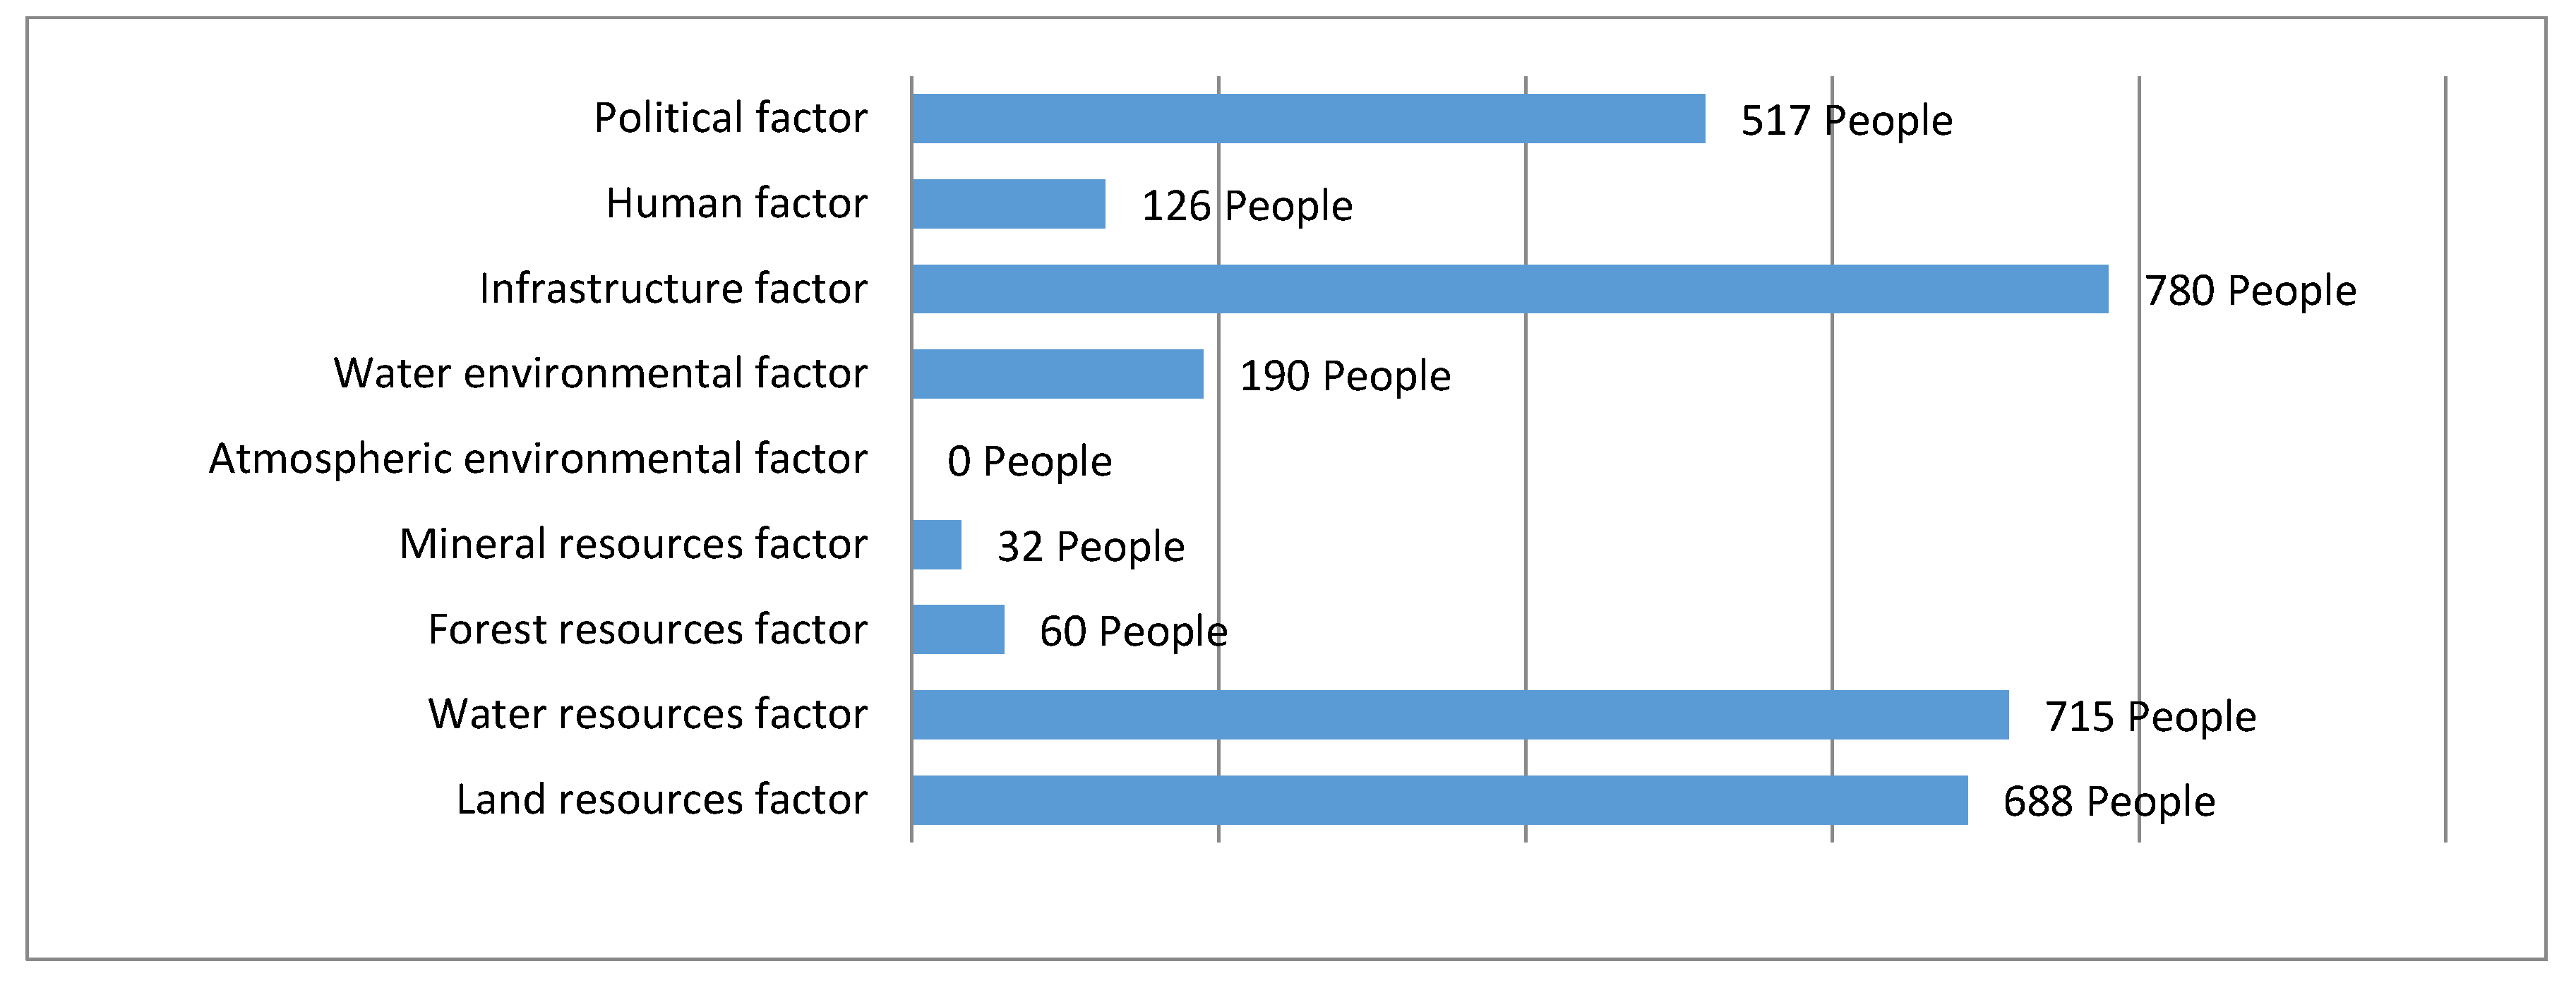
Through field surveys of typical villages in different areas of the gully region of the Loess Plateau, the study has grasped the situation of the villages under construction. The main factors affecting the ecological carrying capacity of the villages were researched and found mainly through the distribution of questionnaires in the field. The area covered by this study covers two provinces, six cities, six districts and counties, and 18 towns and 53 villages in the gully regions of the Loess Plateau. We selected a typical case in the Loess Plateau that can fully illustrate our research methods. The research villages are typical ones, which are representative of this region. The questionnaire survey objects ranged from the staff of the local county government, the township government, and the village construction department of the village government to ordinary villagers. A total of 936 questionnaires were issued, and a total of 780 valid questionnaires were received, as shown in
Figure 3. It is widely agreed that cultivated land, water resources, infrastructure, and governmental policy have a great influence on village construction. These factors can be selected as main factors and should be analyzed comprehensively during the ecological carrying capacity analysis. Our specific survey area can be seen in
Table 2.
2.2.1. Analysis of Carrying Capacity of Cultivable Land Area
Cultivable land, as one of the restricting factors that is hard to change, acted as a direct factor that has an influence on the maximum ecological carrying capacity. According to the amount of population that total cultivable land in a village can support, the cultivable land is used as the limiting factor to perform the estimation of village ecological carrying capacity. The equation is PG = S/Smin. PG means the village ecological carrying capacity, calculated by the cultivable land restricting factor; S means the total cultivable land area in the village; Smin means the minimum cultivatable land per person. Cultivatable land per person can be calculated by the food requirements per person [
36]. The minimum cultivatable land per person can be calculated by relative research or the data released by national departments [
37].
2.2.2. Analysis of Carrying Capacity of Water Resources
The analysis of water carrying capacity is a very complex research system but also includes the influence that comes from society, economy, culture, traditions, and so on [
38]. Nowadays, there is a lot of water resource carrying capacity research, but most of it focuses on cities; therefore, it cannot be used in the analysis of rural areas, and those research results cannot be used to guide the rural human settlement planning [
39].
Gully regions of the Loess Plateau are some of the most water-deficient areas in China. Most of the lands in the gully slope and tableland area are non-irrigated land, totally dependent on natural precipitation [
40]. The natural resource development degree is considerably lower than the national bottom level, and the water supply from artificial wells is very limited, making it even more difficult to supply the water for human living in some villages [
41]. Thus, in this area, analysis of the natural rain and underground water is not enough for the calculation of water resource carrying capacity.
The present water carrying capacity analysis aims to check whether the existing water resources can meet the demand for the present population or an even larger population. The construction of artificial wells directly influences the amount of water supply. Therefore, the water carrying capacity can also be analyzed in terms of the water infrastructure.
2.2.3. Analysis of Carrying Capacity of Infrastructure
Rural infrastructure refers to the materials and technologies applied in rural production, living, and development, including economic infrastructure and social infrastructure, all of which are the developing conditions for rural economic and social development [
42]. Infrastructure is the developmental basis for the rural areas and is also an important component in village planning, so it should be developed with the development of villages [
43].
Theoretically, each basic infrastructure should be analyzed to get the total carrying capacity for a certain population. However, the systematic evaluation of the basic rural infrastructure is not available in the research areas, so the carrying capacity cannot be analyzed systematically.
2.3. Regional System Planning Method of Rural Habitat in Gully Regions
2.3.1. Ecological Carrying Capacity Comprehensive Analyses of Rural Habitats in Small Regions
The analysis of limiting factors for the ecological carrying capacity in small areas is based on the total distribution situation of all the limiting factors, which can be used to research the distribution of ecological carrying capacity of villages in small areas. Based on these analyses, the ecological carrying capacity conditions and the distance of each village can be further researched, and the results can be used as a guideline for the future development of these villages. The detailed analysis can be done by the following four steps, and the following four neighborhood villages are shown here as examples to explain these steps.
• Step 1: Analysis of bearing capacity of cultivable land area
Combining the site research on cultivable land and the data shown in Tables 4–6, the data on cultivable land per capita and the population that these lands can support can be calculated; thus, the villages’ cultivable land carrying capacity can also be calculated.
• Step 2: Analysis of carrying capacity of water resources
According to the document and the water resource distribution situation investigation, the village productivity, lifestyle, water use habits, and artificial water supply volume can also be investigated, the population each village can support can be calculated, and the water resource carrying capacity can also be calculated.
• Step 3: Analysis of carrying capacity of infrastructure
The distribution and service area of infrastructure can be obtained from the investigation. Taking the rural infrastructure classification Tables 8 and 9 as a reference and based on the importance evaluation of infrastructure to meet the requirement of villagers, the carrying capacity of these infrastructures can be classified.
• Step 4: Analysis of the ecological carrying capacity based on each limiting factor
All the limiting factors should be collected. Cultivable land, as one of the limiting factors that is hard to change, acts as a direct factor that has an influence on the maximum ecological carrying capacity. The threshold value can be known by the analysis of cultivable land carrying capacity, and the population threshold value is a very important reference for making decisions on village movement and integration. Water resources and related infrastructure can be considered limiting factors, which can be adjusted according to their requirement. Of the three limiting factors, cultivable land, water resources, and infrastructure, the weakest has the most influence on villages’ ecological current carrying capacity.
2.3.2. Guideline for the Regional System Planning in Rural Habitats
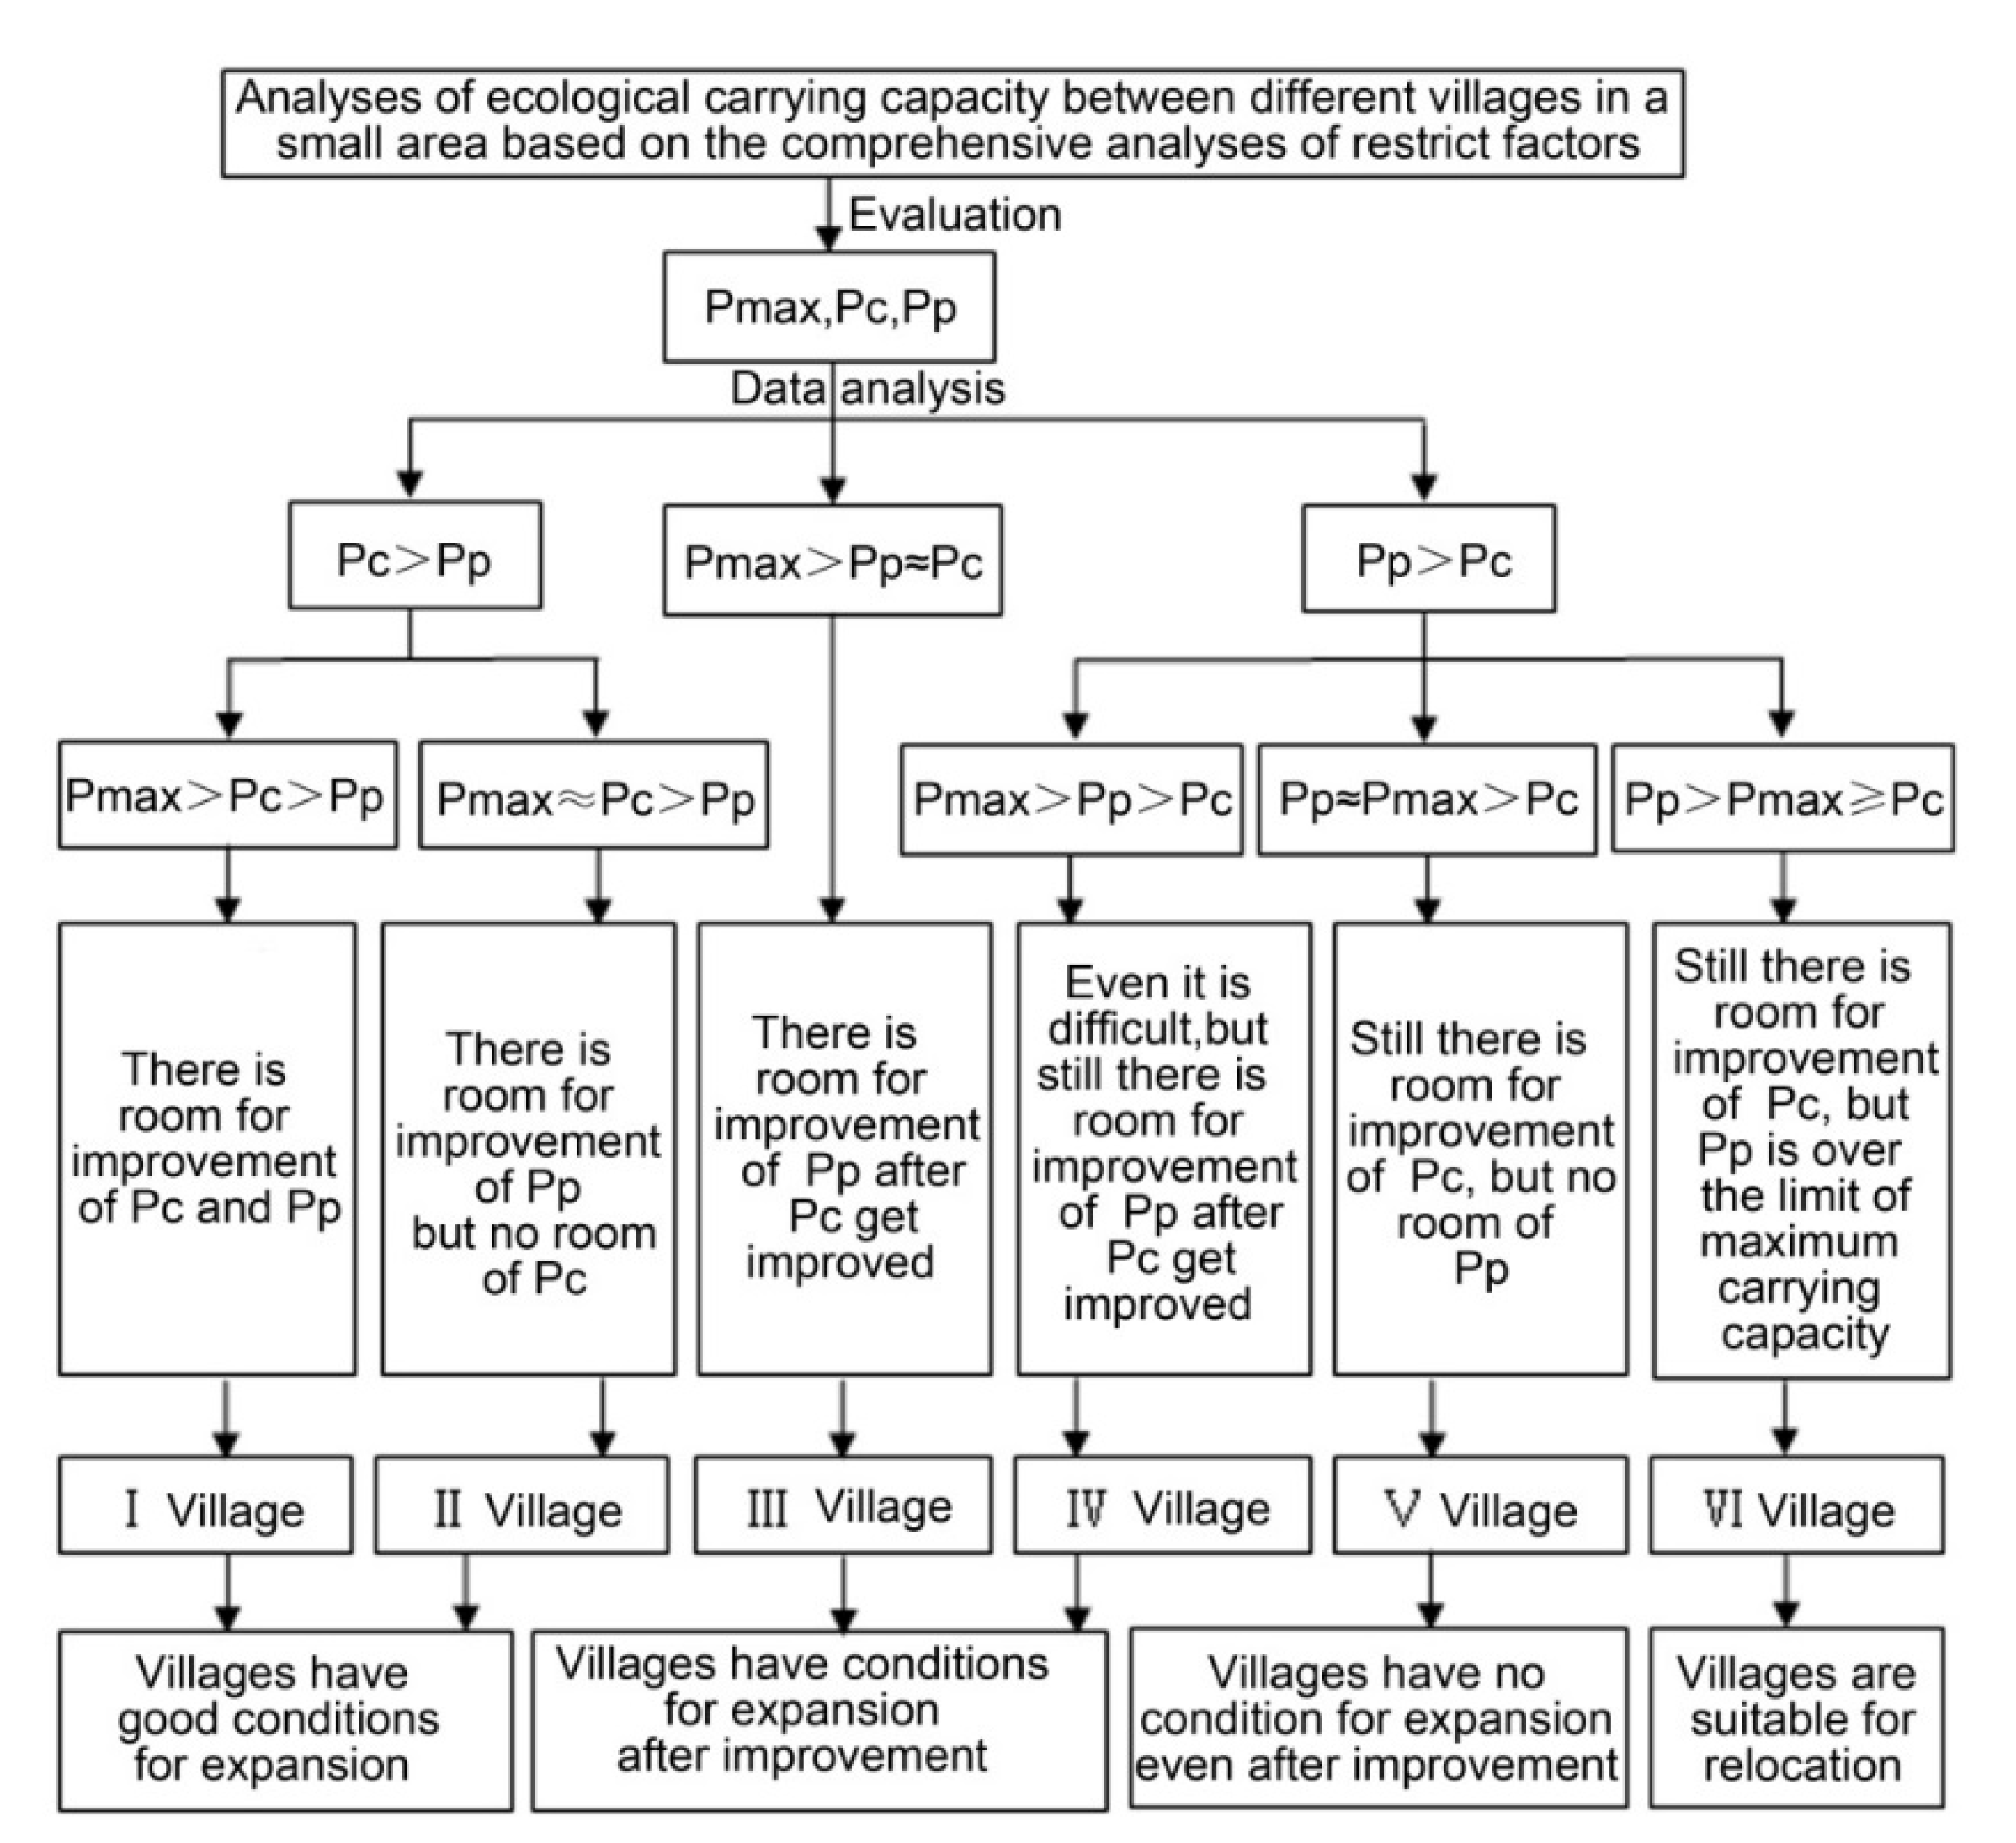
Adopting the ecological carrying capacity analysis as a guideline can avoid the loss of ecological environment and the unnecessary waste of natural resources in the process of un-planning village movement and integration. Comprehensive analysis of ecological carrying capacity via the limiting factors in small-scale areas can roughly obtain the relationship among maximum carrying capacity (Pmax) of the villages, the current ecological carrying capacity (Pc), and current supporting population (Pp) in the research areas. Through the analysis of this relationship, a village is able to support more immigrants, who should be integrated with others to improve the human settlement environment. Finally, the villages’ grades can be fixed, as shown in
Figure 4. According to the ecological carrying capacity, the villages in gully regions can be divided into six grades. Type I and II villages are suitable to be extended; types III and IV can be extended after the improvement of present conditions, and type VI is suggested to be moved.
In order to achieve the aim of national ecological civilization construction and the construction of a new socialist countryside scientifically, it is suggested that regional system planning of villages in gully regions of the Loess Plateau should follow the principles below:
The ecological carrying capacity should be the basis for future village planning. According to the ecological carrying capacity, the villages should be moved and extended, and their grades can be fixed. For example, because of overpopulation, villages (Type VI village) should be moved. When ecological carrying capacity is taken into consideration, Type I villages should be extended.
The improvement of the human settlement environment should always be the basic starting point. The aim of village relocation and combination is to improve the human settlement environment; thus, the natural resources and infrastructure should be taken into consideration to make sure the living conditions and living environment can be improved. For those villages with overpopulation, such as IV, V, and VI, a more suitable method is to move out a certain amount of the population or move the whole village.
Village movement to distant places or neighboring places should be avoided. Energy saving and sustainable development should be proposed. Large-scale movement or long-distance movement not only consume lots of manpower and material resources, but also destroys the original village culture, which causes the loss of traditional culture in villages. Therefore, during the movement, natural resources and infrastructure should be adapted as much as possible to avoid the abandonment of the original buildings and prevent labor and financial waste. According to the six grades of ecological carrying capacity, to decrease manpower, expenditure, and investment, it is necessary to reduce the relocation to type III and type IV villages.
In order to strengthen rural spiritual civilization construction, it is very important to protect traditional cultures. During village movement, the village consanguinity as well as geopolitical aspects and industry relationships should be protected, and traditional culture should be carried forward.
Villagers’ suggestions should also be considered. During the relocation and combination, the villagers’ opinions should be collected and their legal rights should be protected.
3. Application Study
3.1. Application Background
Analysis of the limiting factors method for the ecological carrying capacity can be used in most rural habitat planning in gully regions of the Loess Plateau. We selected several typical cases in the Loess Plateau that can fully illustrate our research methods. Through the selection and analysis of these typical cases, we hope to elaborate the regional system planning method, as this will have common value in the whole Loess Plateau. After analyzing a complete case, we can determine that other similar villages can also be planned according to this method in a similar situation. Thus, we chose eight villages in Qin He town as examples.
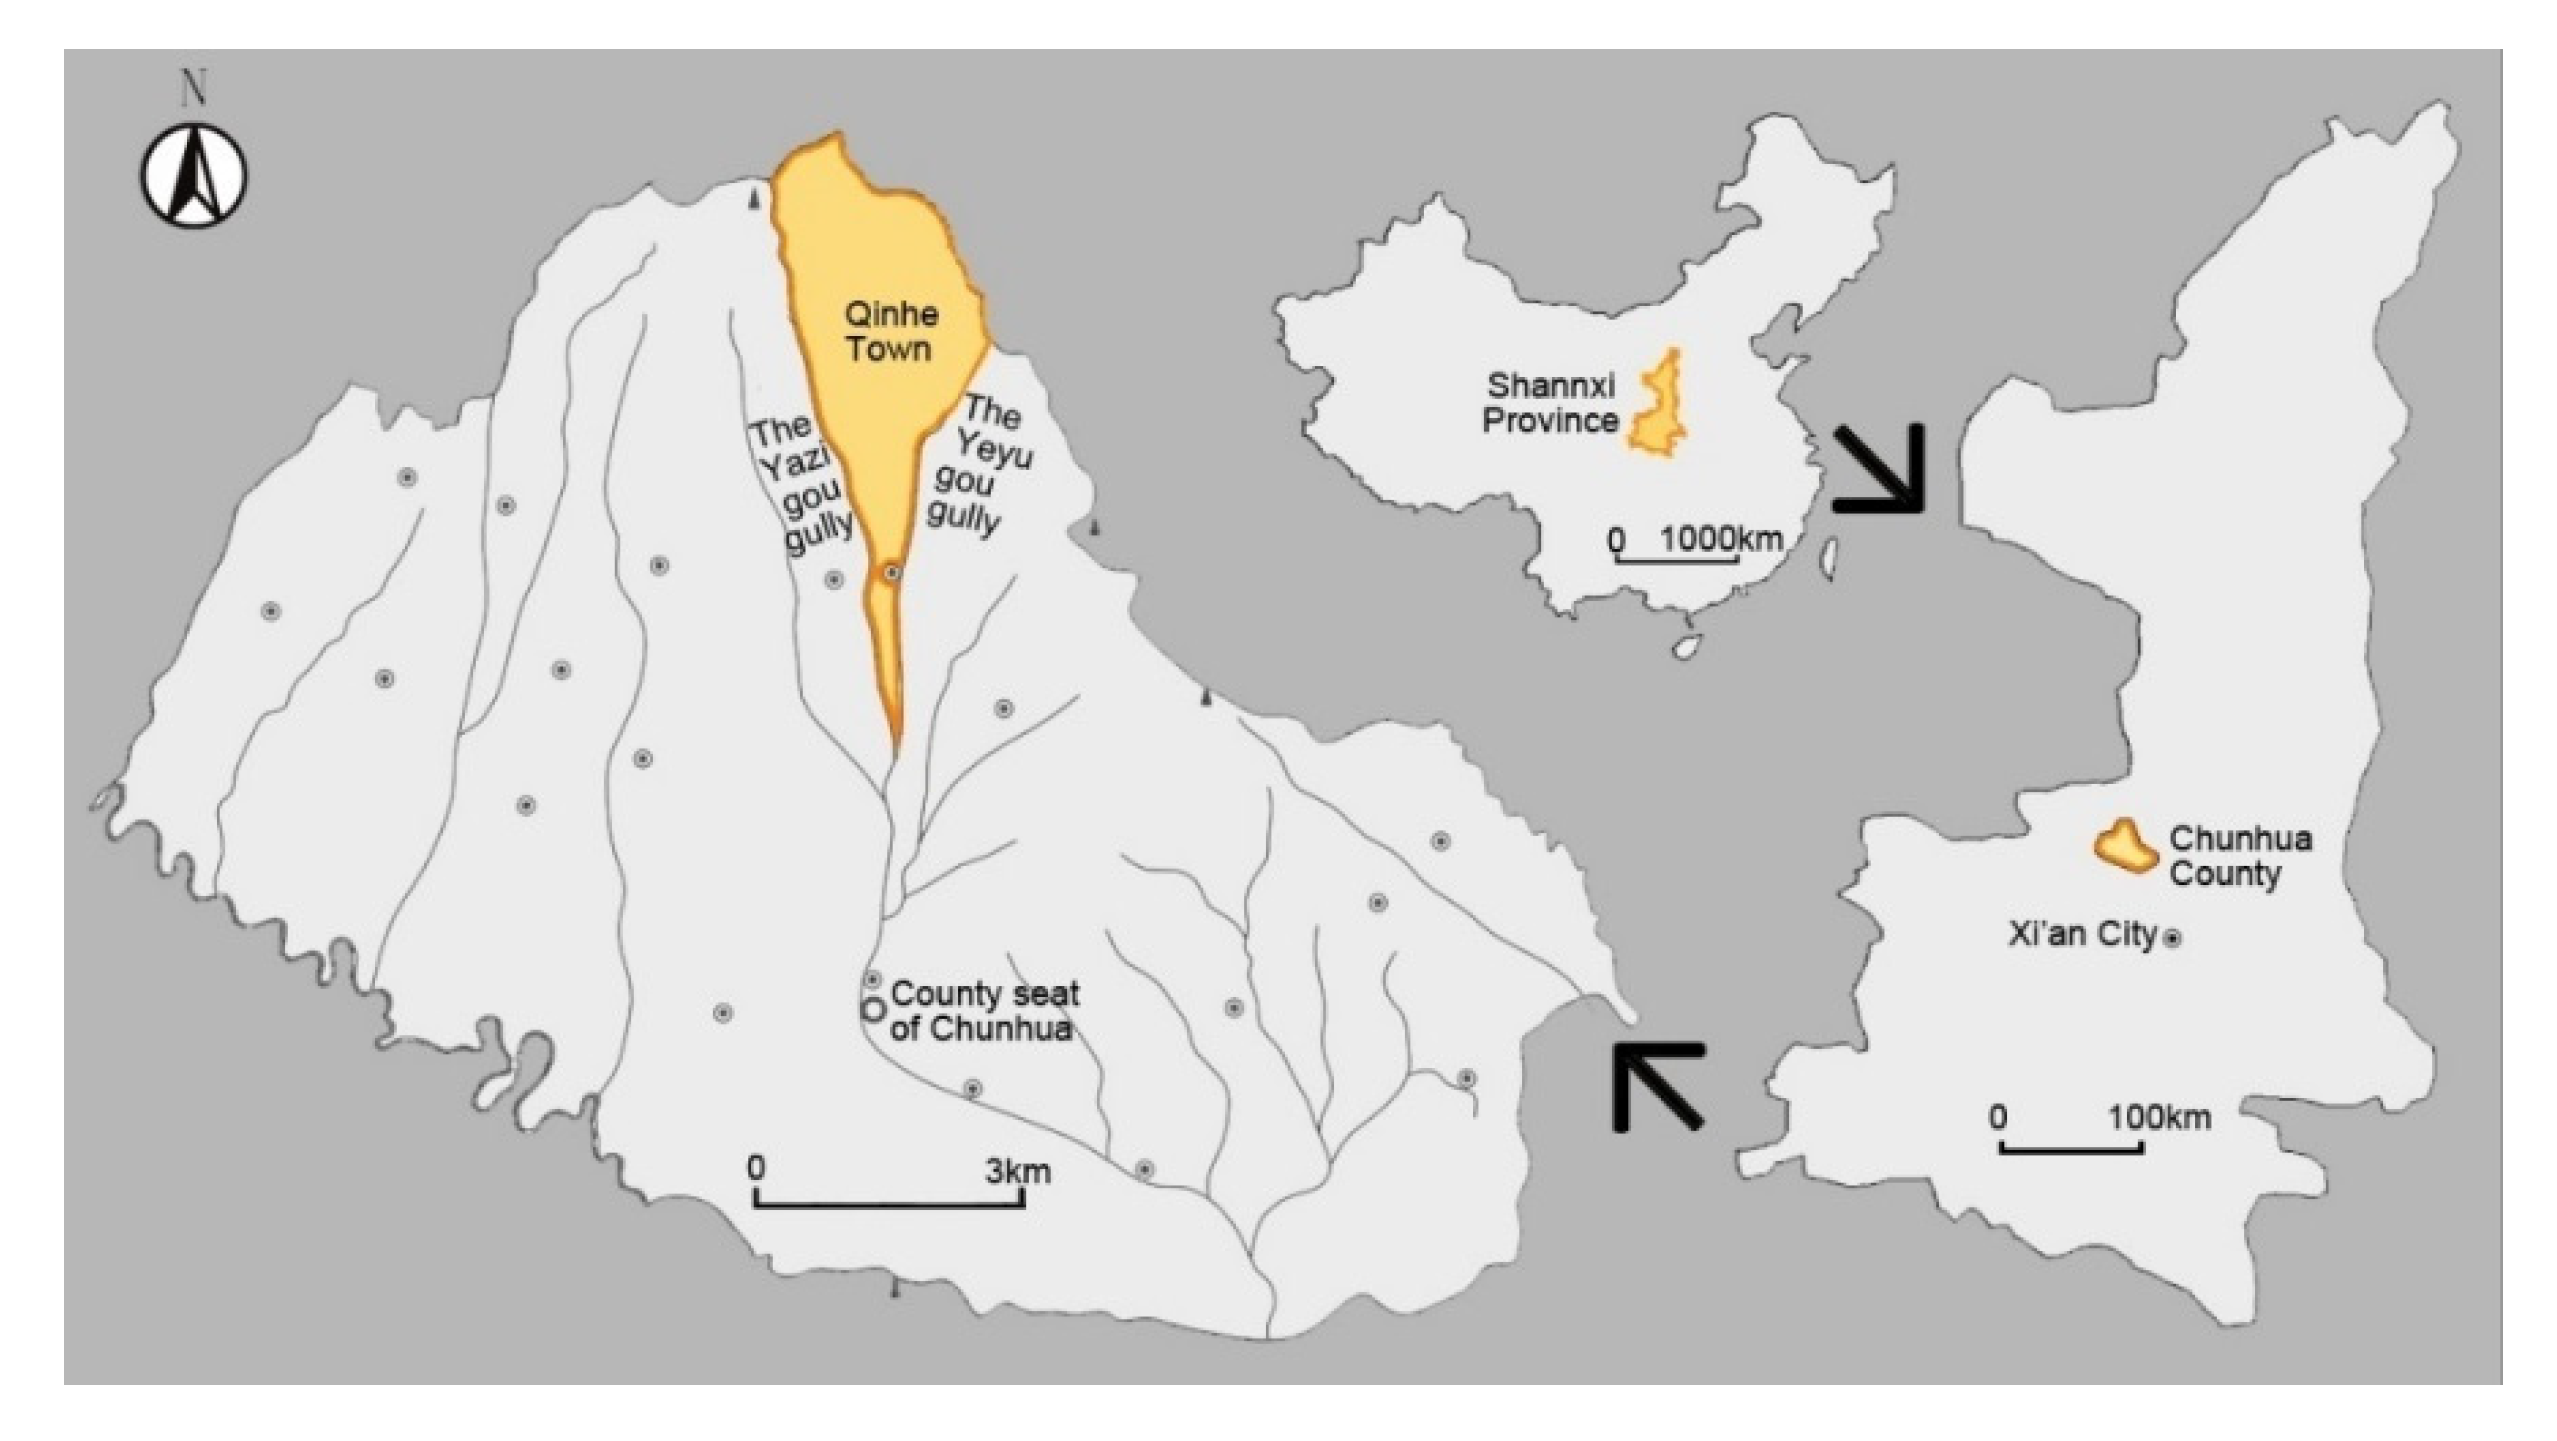
Qin He town in Chun Hua County of Shaanxi Province is located in An Zi tableland, which is the smallest tableland area in the Weibei gully region of the Loess Plateau, and the landscape there is relatively complex, as shown in
Figure 5. There are 14 incorporated villages, including two county-level demonstration villages, 70 unincorporated villages, 1916 families and 8228 people, and the total area is about 136.8 square kilometers [
44]. On the one hand, this includes almost all the landscape characteristics of gully regions in the Loess Plateau. Villages in this research area have significant differences in their ecological carrying capacity, and some of them need to be moved or integrated during new countryside construction. On the other hand, it is easy to collect data and good for the adaptation of analysis results to use an administration town as a research unit, which also has high operability.
3.2. Present Situation of Human Settlement Environmental Construction in the Typical Research Area
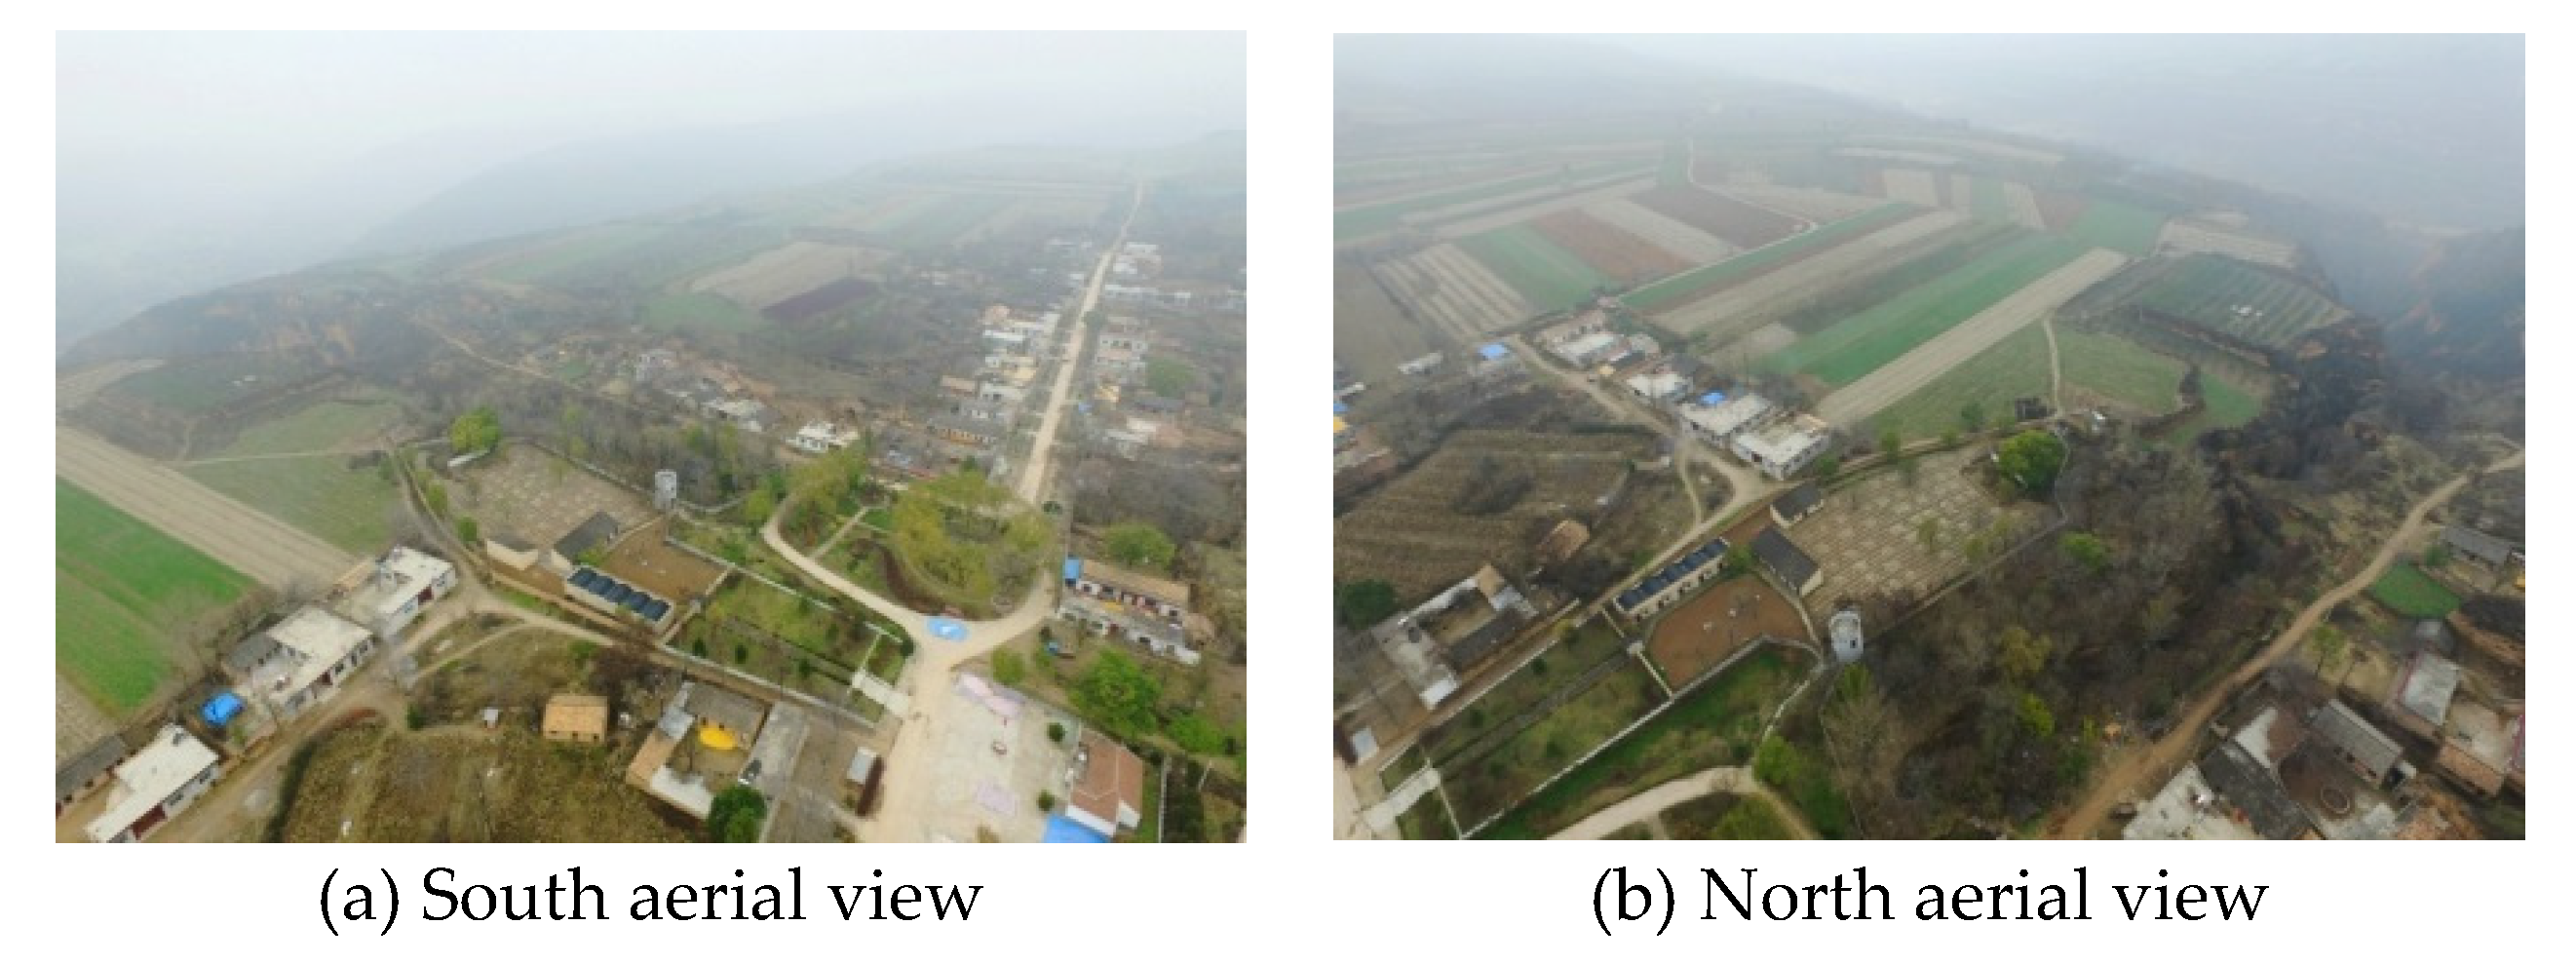
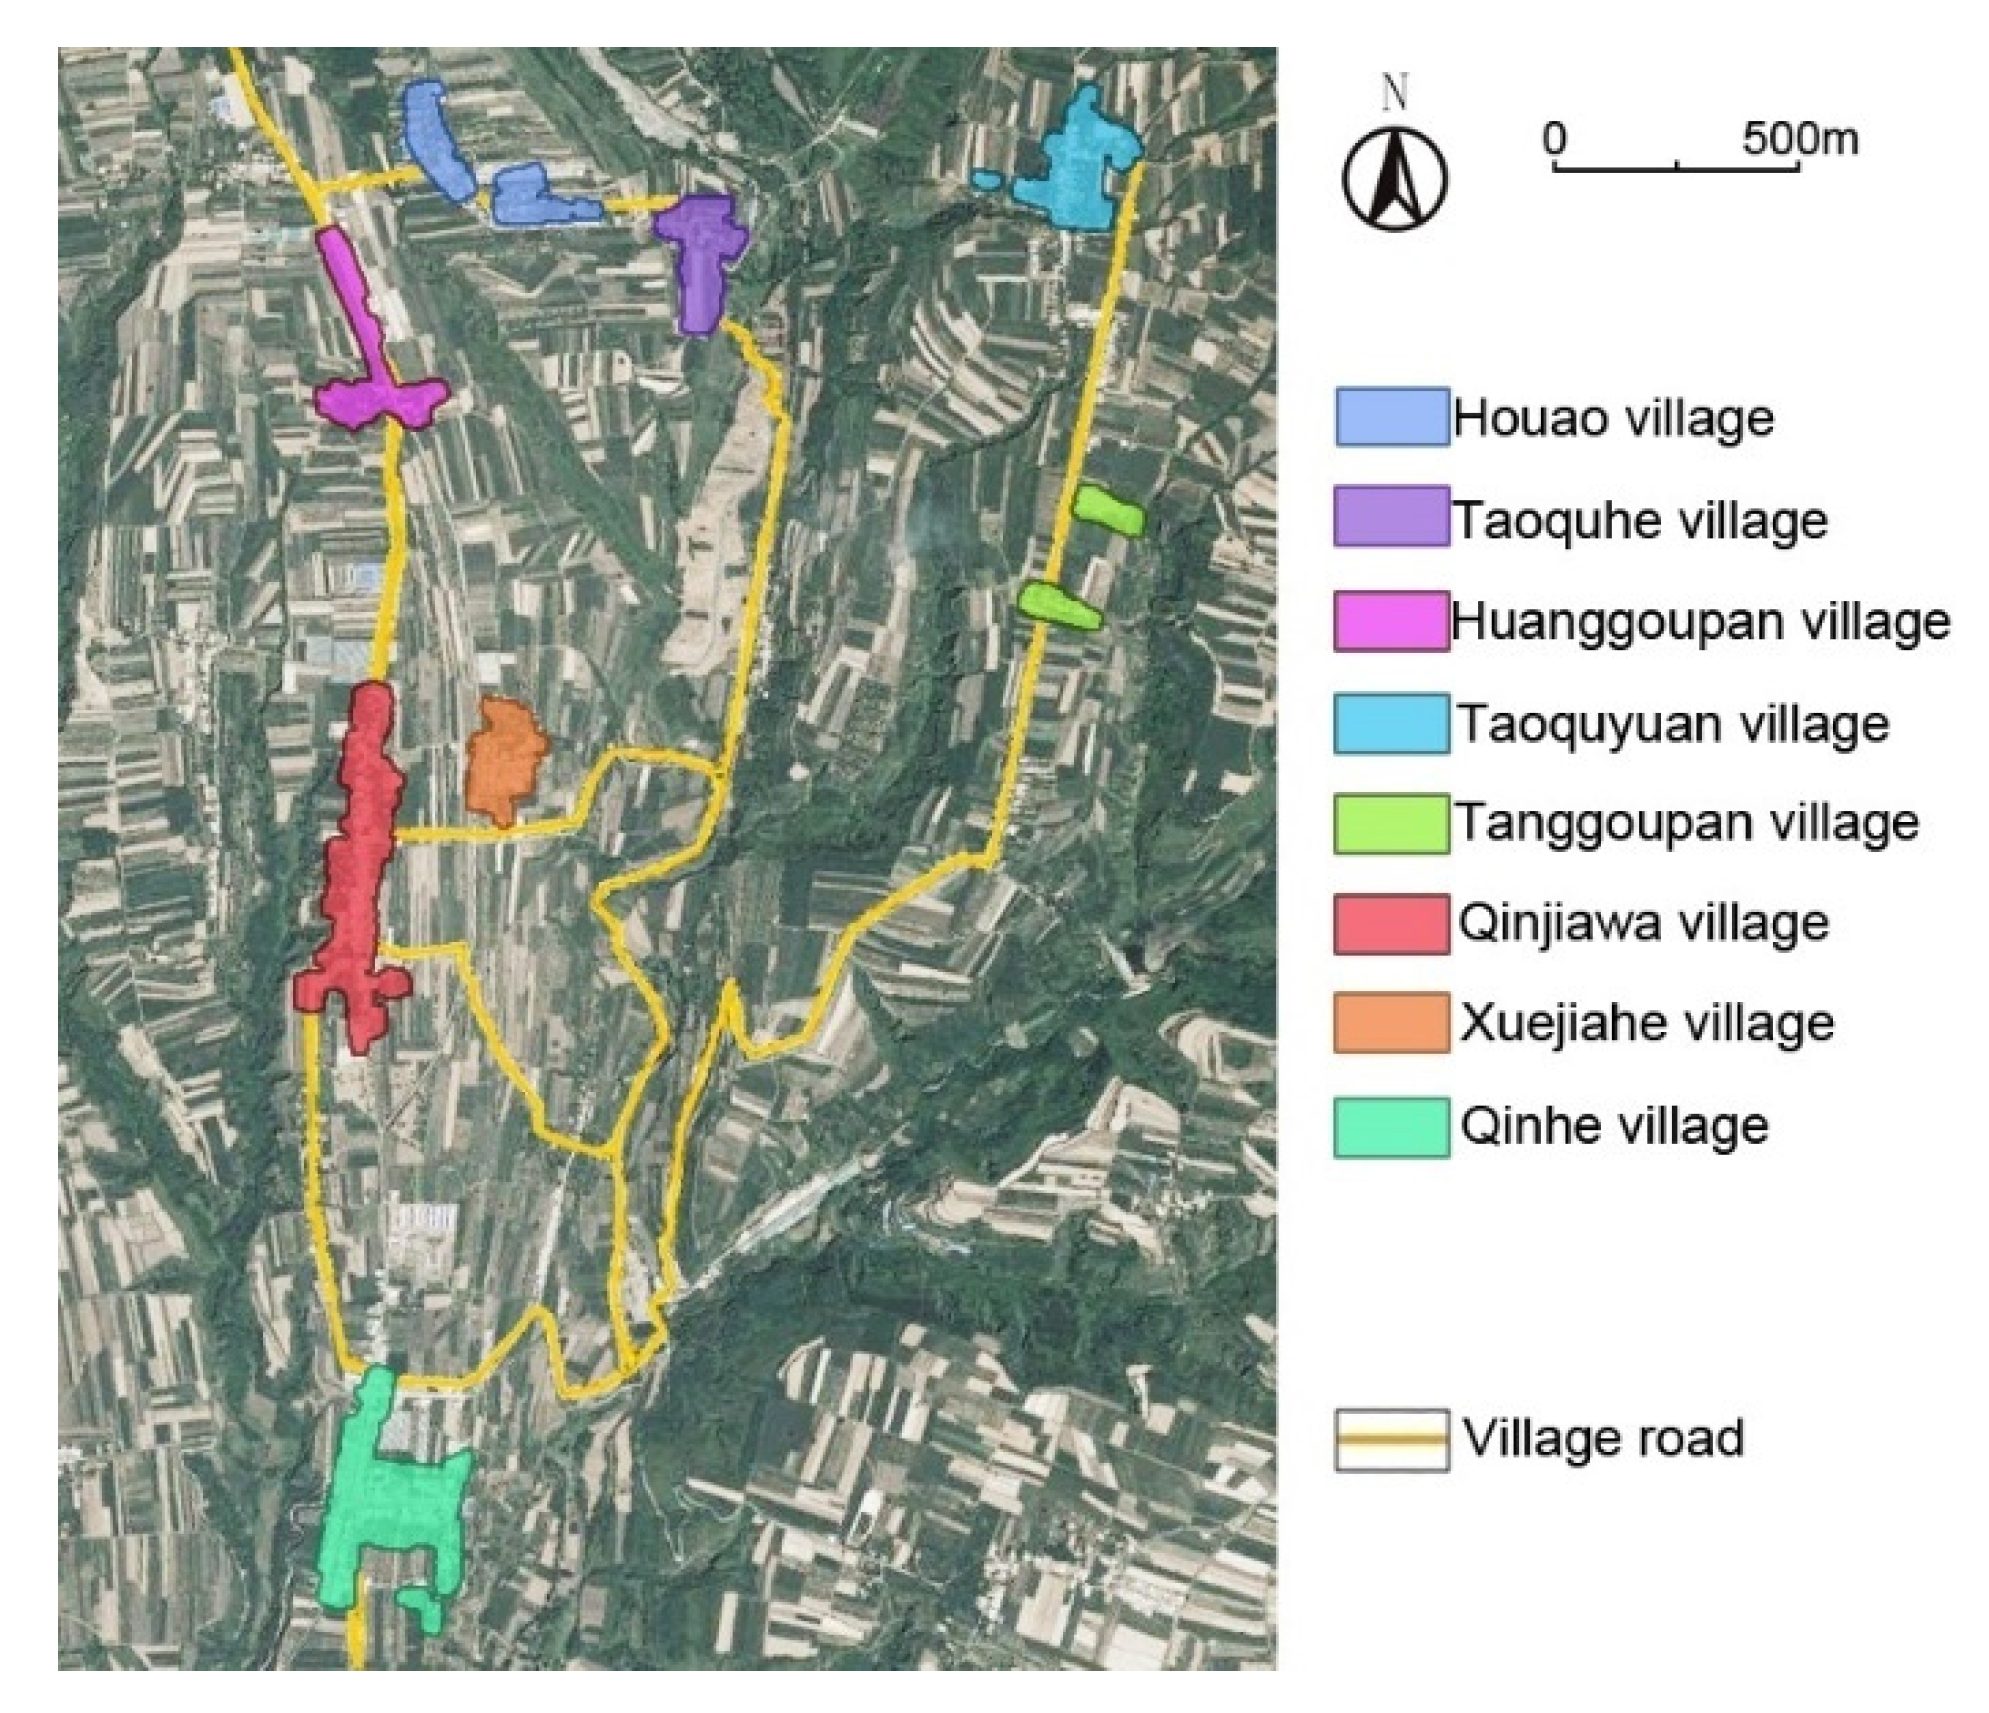
The selection area is located in the middle of Qin He town with a typical landscape of gully regions in the Loess Plateau, as shown in
Figure 6. There are eight small-scale villages, with a population of fewer than 800 people, except Qin He village, as shown in
Figure 7. Qin He village is the town government’s location, and Tao Qu Yuan village is a tourist area.
According to field investigation of the eight villages, the basic information about the present human settlement environment can be shown as the following:
1. Economic development level
The economic conditions in villages of the research area are not good, and the agricultural income of inhabitants per month is less than 4000 CNY (615 USD). Except for in Qin He village, the location of town government, some of the villagers can do business, and Tao Qu Yuan village is a tourist village, while others all depend on agriculture.
2. Situation of cultivable land resources in villages
According to the documents supplied by the Chun Hua Land Resources Bureau, cultivable land per capita is very different in each village. There is much more cultivable land in Tao Qu Yuan village and Qin Jia Wa village than current cultivable land per capita in the Loess Plateau, but there is much less in Tao Qu He village and Huang Gou Pan village. Because of recent national policy on returning grain land to forestry, most of the cultivable lands are centralized in tablelands, and some are on gully slopes.
3. Water resource situation
In the new countryside planning proposed in 2006, Qin He village was supposed to have a water supply of 150 L per day, but this has still not been achieved, and compared with urban water usage of 209 L per day, the village water usage is very low. Most of this area’s water is supplied by artificial pump wells that only just meet the demand for people’s water needs.
4. Infrastructure situation
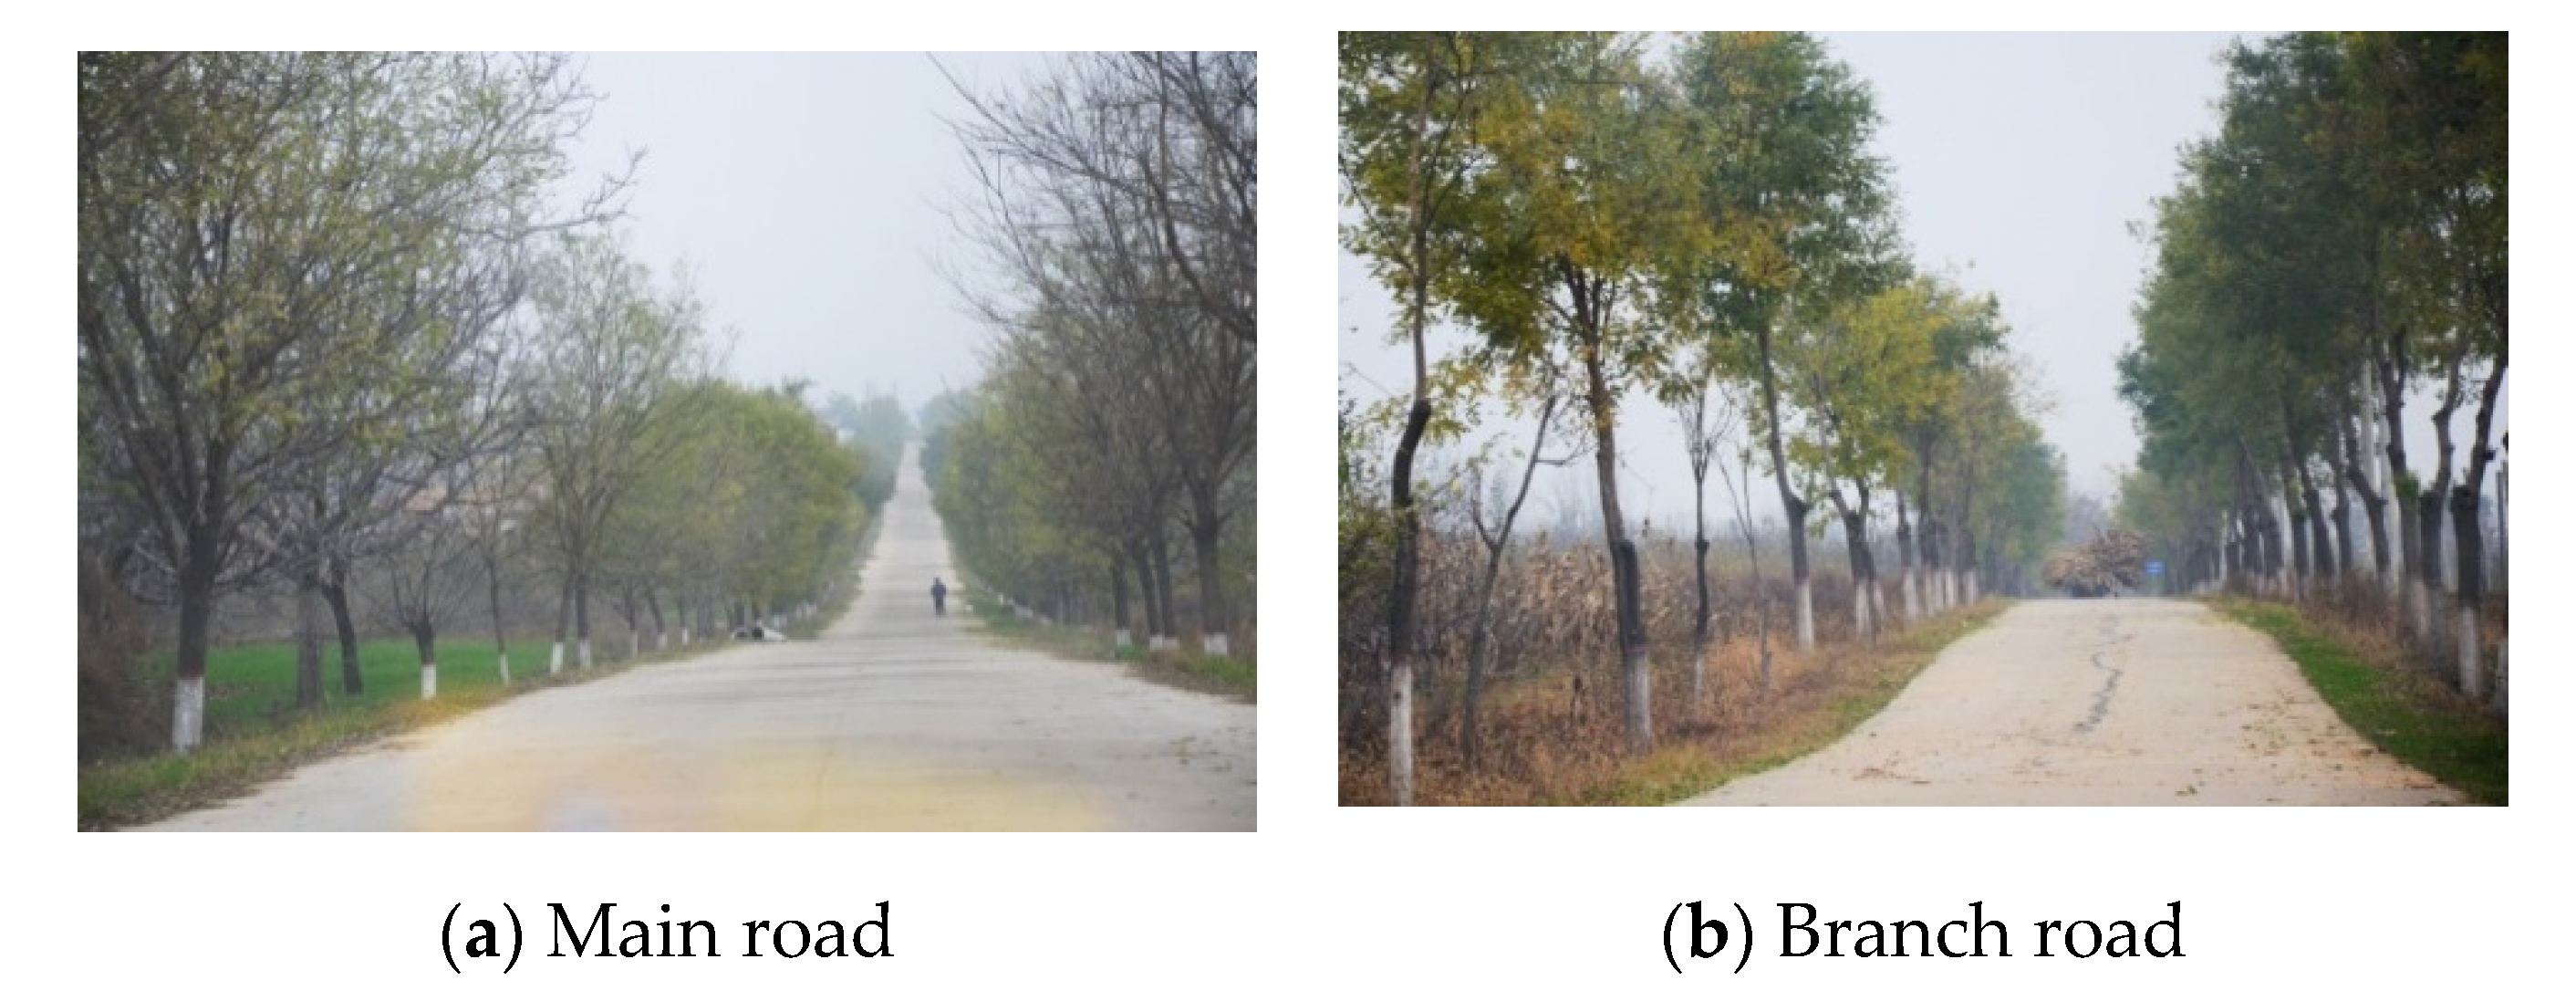
The infrastructure in the research area is underdeveloped. Basic electricity is sufficient, but gas and energy infrastructure are inadequate, and fuel and oil infrastructure is seriously lacking. The transportation system is relatively good and can meet the requirements of the villagers’ common life. There are usually 18 cm-thick concrete roads, and the width of the roads is from four meters to six meters, as shown in
Figure 8. Communication facilities are not good, with no post and telecommunication service sites. Besides the quality inspection institution for agricultural products, there are no industry facilities in these research areas. There are serious shortages of living and ecological infrastructure.
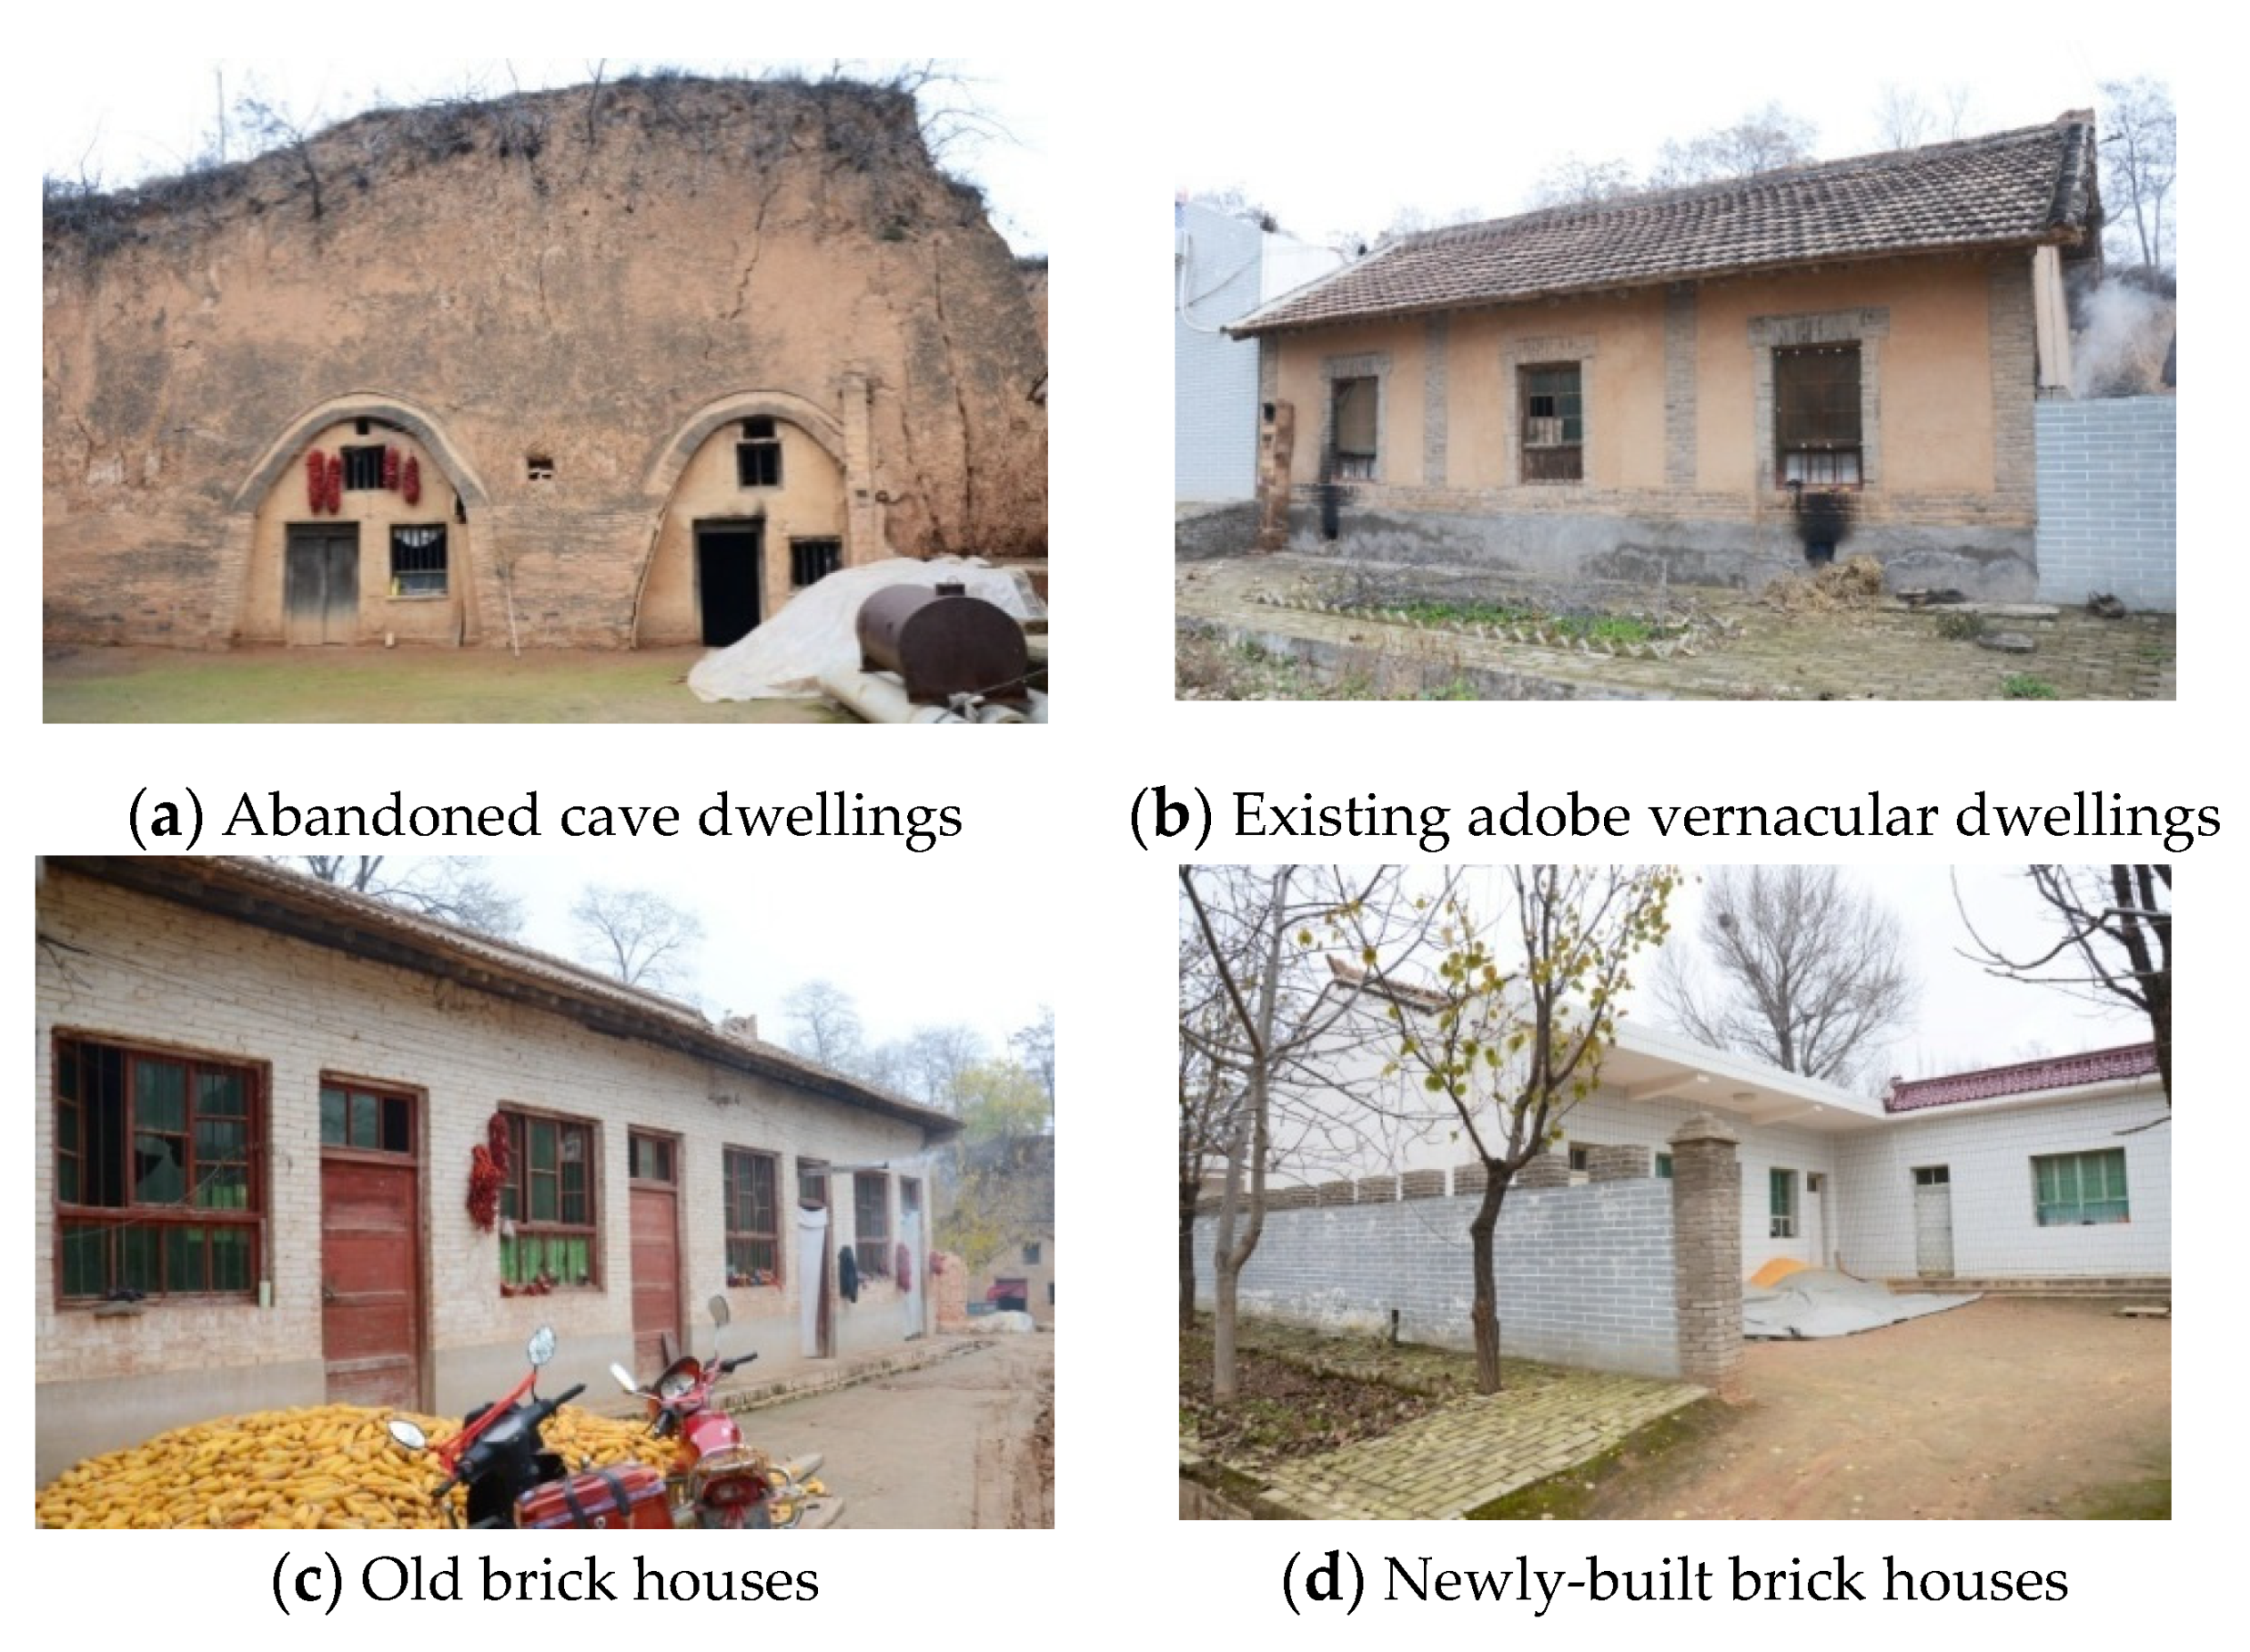
5. Present situation of village planning and vernacular dwelling construction
There are no hollow villages among the eight investigated villages; only a few villagers work in towns, but they still live in their houses in the villages. Around 70% of vernacular dwellings are newly built, and the traditional caving dwellings are almost abandoned; just a few are left as storage space. The existing adobe houses are less than 30% of the vernacular dwellings. The newly built residential buildings are almost one-story brick houses, and facades of new houses are almost the same. The cost of a new brick vernacular dwelling is about 65,000 CNY (10,000 USD) (
Figure 9).
According to an interview with a town governmental leader, most of the current villages’ development in Qin He town is natural without special planning. Tao Qu He village and Tang Gou Pan Village are the only two villages planned by the county planning bureau. For Qin He Village and Tao Yu Yuan Village, there was some planning before, but it was not carried out due to a shortage of funds for about eight years.
3.3. Evaluation of Ecological Carrying Capacity of Villages within the Research Area
3.3.1. Analysis of the Carrying Capacity of Cultivable Land
Before analyzing the cultivated land for its ecological carrying capacity, we need to know the food requirements per person; not only the food required for day-to-day life, but also the national food safety requirements should be considered [
37], as shown in
Table 3.
According to the requirement for per-capita food, the following
Table 4 can be used as a reference to show the per capita cultivable land requirement for the different food demand levels. Thus, the requirements per capita of cultivable land at different times in this area can be known, as shown in
Table 5.
The actual areas of cultivable land in each period can be known by local governments’ land forecasts and their related policy on reverting farmland to forest and grassland. Based on this, the demand proportion of total cultivable land area and cultivable land per capita can be calculated; thus, the ecological carrying capacity in a certain period time can be forecasted.
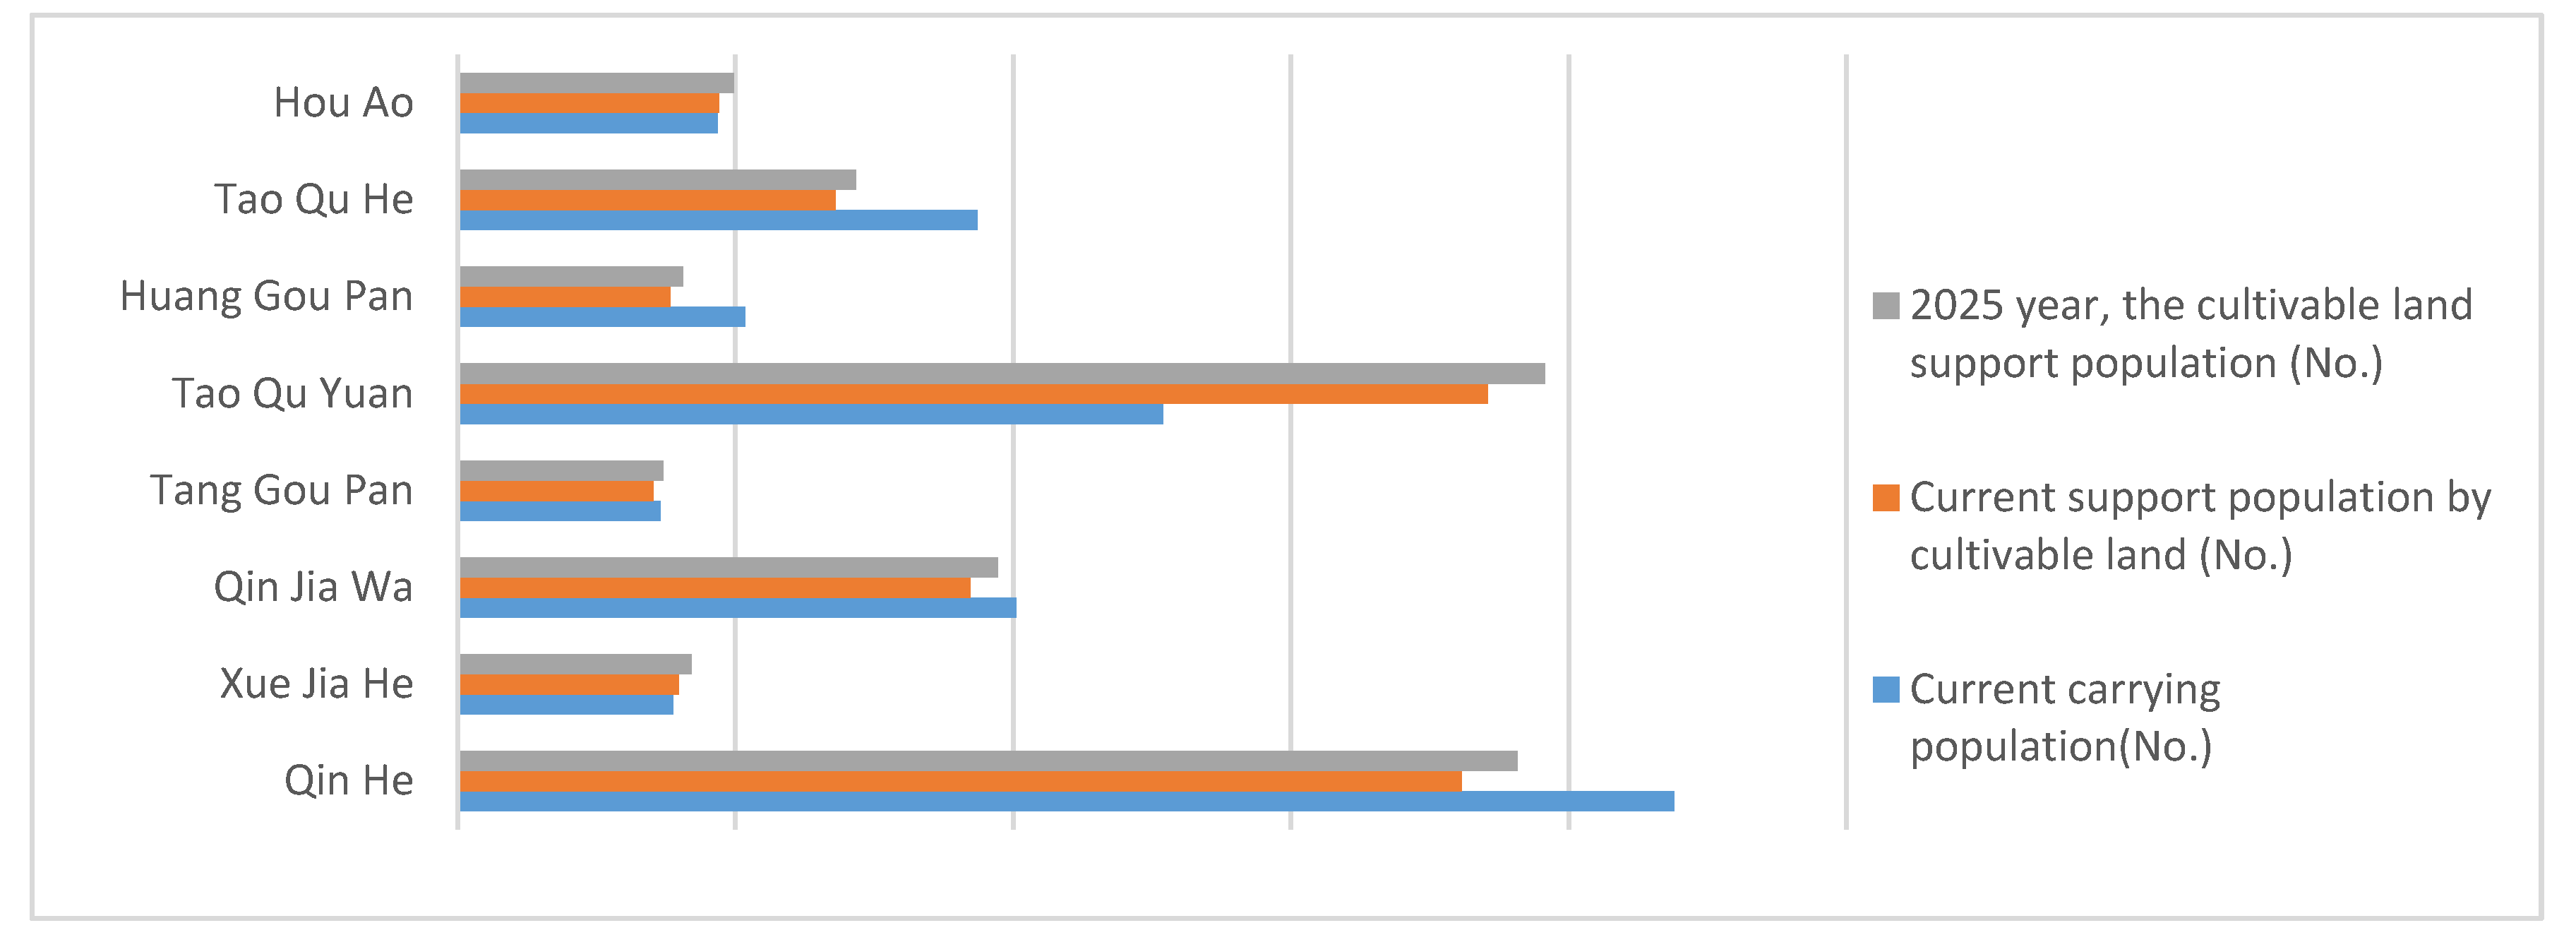
Referring to the requirement of cultivable land per capita in the Loess Plateau, the current needed land per capita is about 3.435 mu (0.229 hectares), and in the year of 2025, it will be 3.255 mu (0.217 hectares). Combining the statistical results of current population and cultivable land and the needed cultivable land per capita in 2025, the population that cultivable land can support in 2025 can be estimated, as shown in
Table 6. Actually, the current needed cultivable land per capita and that in 2025 are different, so the carrying capacity of cultivable land will change even in the same total cultivable land areas.
The results in
Table 6 show the current and 2025 estimates of cultivable land carrying capacity, which are also shown in
Figure 10. If the current population is lower than the cultivable land carrying capacity, it means that the village has the ability to support a larger population. If the current population is over the cultivable land carrying capacity, it means the cultivable land cannot ensure good living quality for current residents.
The above figure shows that the actual populations in Qin He Village, Tao Yu He Village, and Huang Gou Pan Village are far over the cultivable land carrying capacity, and Tao Qu Yuan Village and Xue Jia He Village still can support a larger population.
3.3.2. Analysis of Carrying Capacity of Water Resources
According to the rural water safety and sanitation regulations, the safety level should not be lower than 40–60 L, and the basic needs amount is 20–40 L. In order to improve the living standard in rural areas and realize the integration of urban and rural areas, the urban water requirements can be used as a reference. The average water consumption in urban areas of Shanxi Province is about 209 L per capita per day [
45].
After the field investigation, it was found that the water supply in many counties of gully regions, such as Chun Hua, are only supplied by artificial wells; thus, the analysis of water carrying capacity can be calculated from the water supply of artificial wells and the water demand per capita. Through the site investigation of the eight targeted villages of their water usage in productivity and living, the water resource carrying capacities of these villages are shown in
Table 7. Because the agricultural structure here is relatively singular, the production water consumed can be neglected, and the living water consumed is almost the only thing that needs to be analyzed in the carrying capacity analyses. In the investigation, it was found some villages have individual water supplies, and some villages use a union village centralized water supply. The water supply volume of each village (W
n) can be calculated by pumped wells (W
d) and the support population of all the villages (P
1 + P
2 + … + P
n + … + P
m) and the research village population (P
n), formula is W
n = W
d / (P
1 + P
2 + … + P
n + …+ P
m)·P
n.
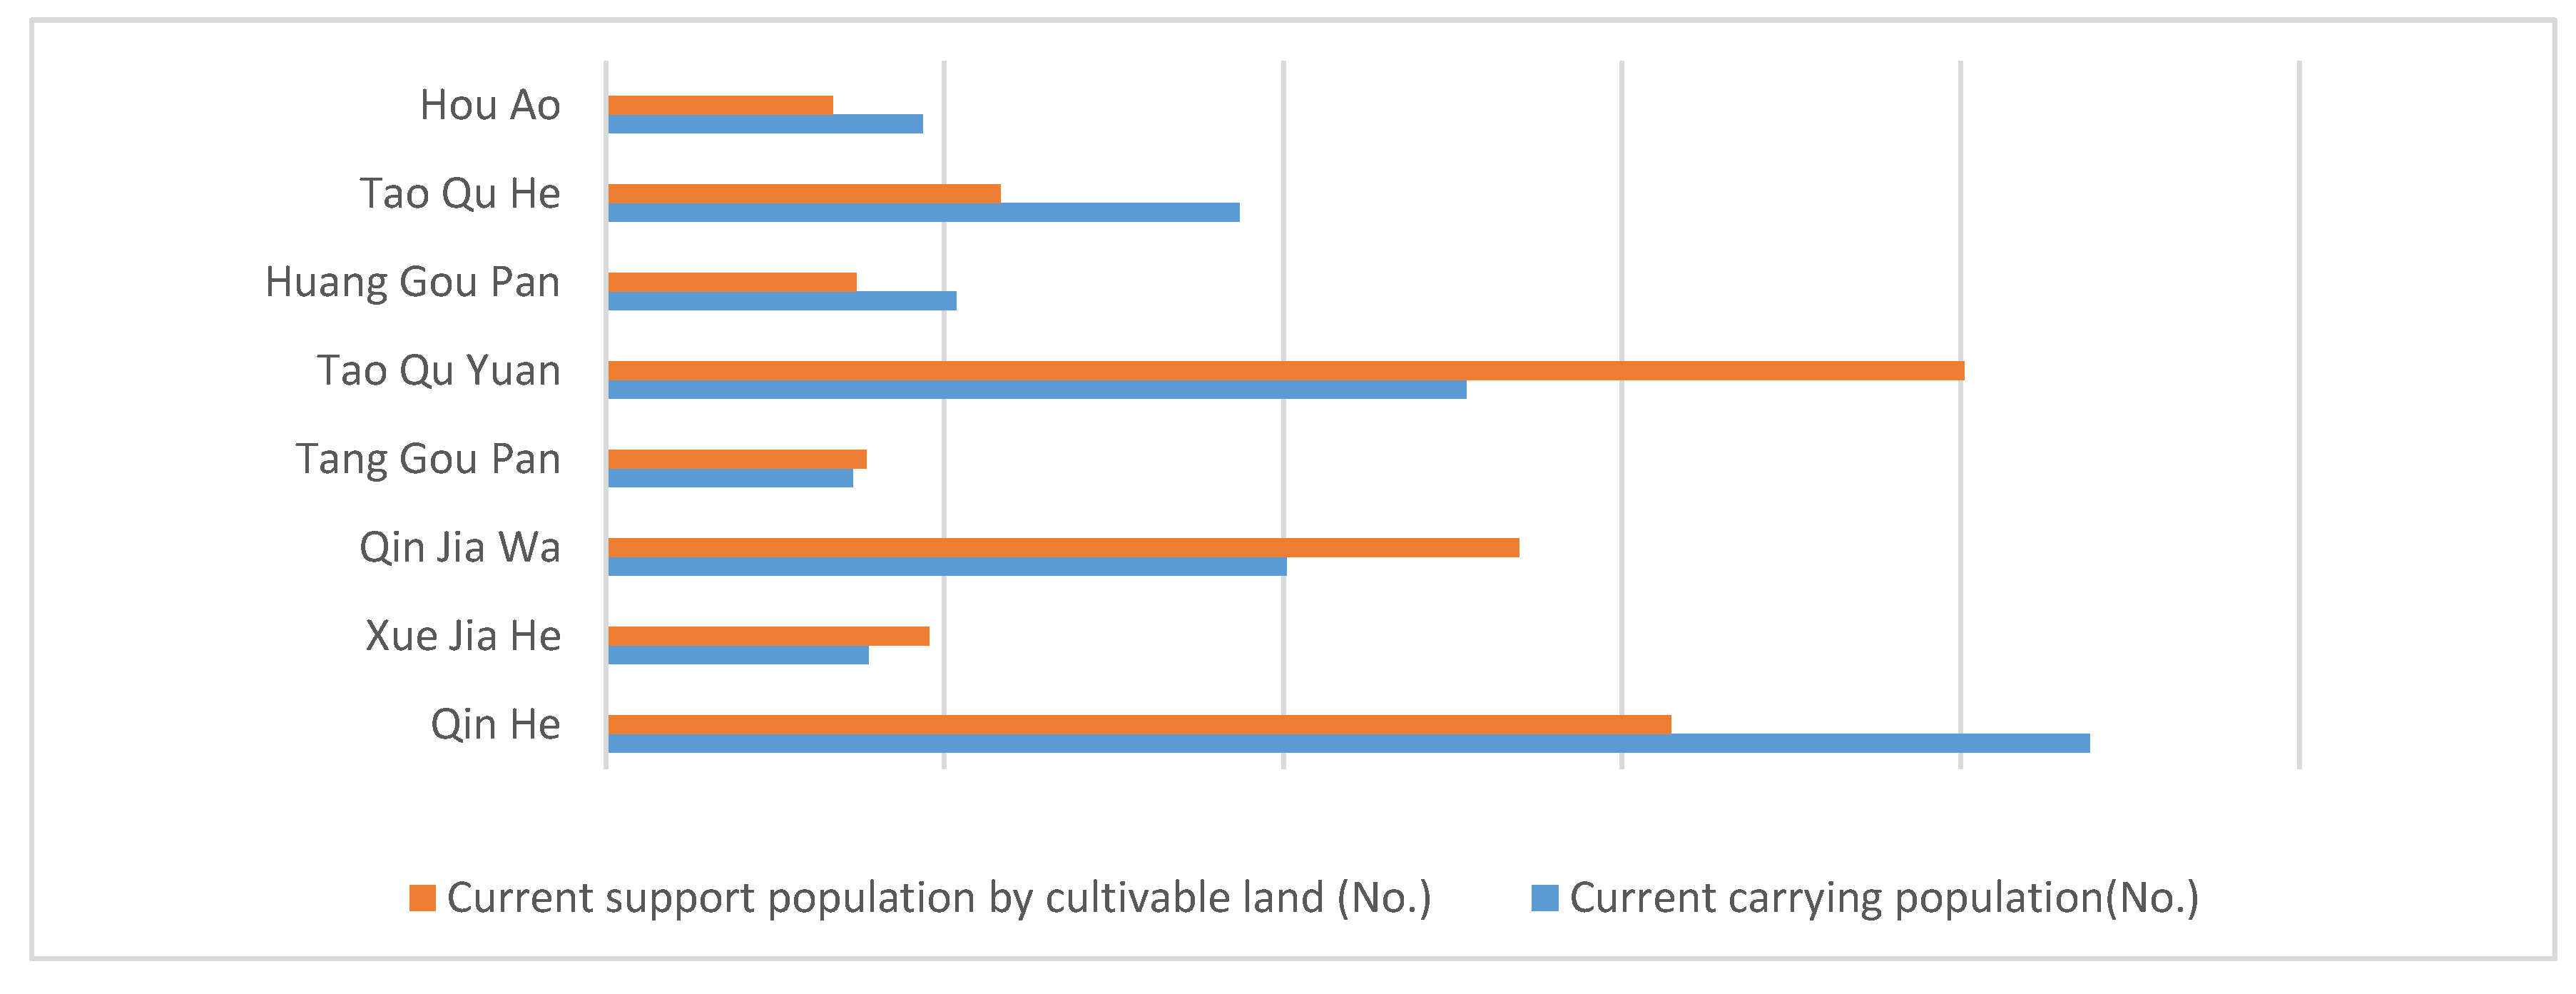
According to the water usage volume per capita in the urban area of Shannxi Province, and combined with
Table 7,
Figure 11 shows the water resource carrying capacity in villages within the research area. The water resource carrying capacities of Tao Yu Yuan Village, Qin Jia Wa Village and Xue Jia He Village are far beyond their current populations’ needs, while other villages lack water supply; for example, the population in Qin He Village and Tao Yu He Village is much larger than its water carrying capacity.
3.3.3. Analysis of Carrying Capacity of Infrastructure
Compared with cultivable land and water resources, it is difficult to perform a quantitative analysis of infrastructure. Analysis of the carrying capacity in the domestic research field still is a research gap. According to the present situation of infrastructure in gully regions of the Loess Plateau, the public service infrastructure shown in
Table 8 and
Table 9 [
46] can be used as one of the most available methods to obtain a calculation of the supporting population.
The movement or integration of villages in gully regions usually refers to natural villages with fewer than 800 people. The above methods are not suitable for analyzing the carrying capacity of infrastructure for such small-scale villages. Thus, in this case, the research also evaluates the carrying capacity of infrastructure according to interview and questionnaire distribution.
In this research, the carrying capacity of village infrastructure is graded and classified by public infrastructure. Through site investigation, the relationship between the infrastructure construction situation and its supporting population can be calculated, and the carrying capacity can be roughly evaluated.
Table 10,
Table 11,
Table 12,
Table 13 and
Table 14 concern public infrastructures, which can be drawn combined with basic infrastructure classification (productivity infrastructure, living infrastructure, and ecological infrastructure).
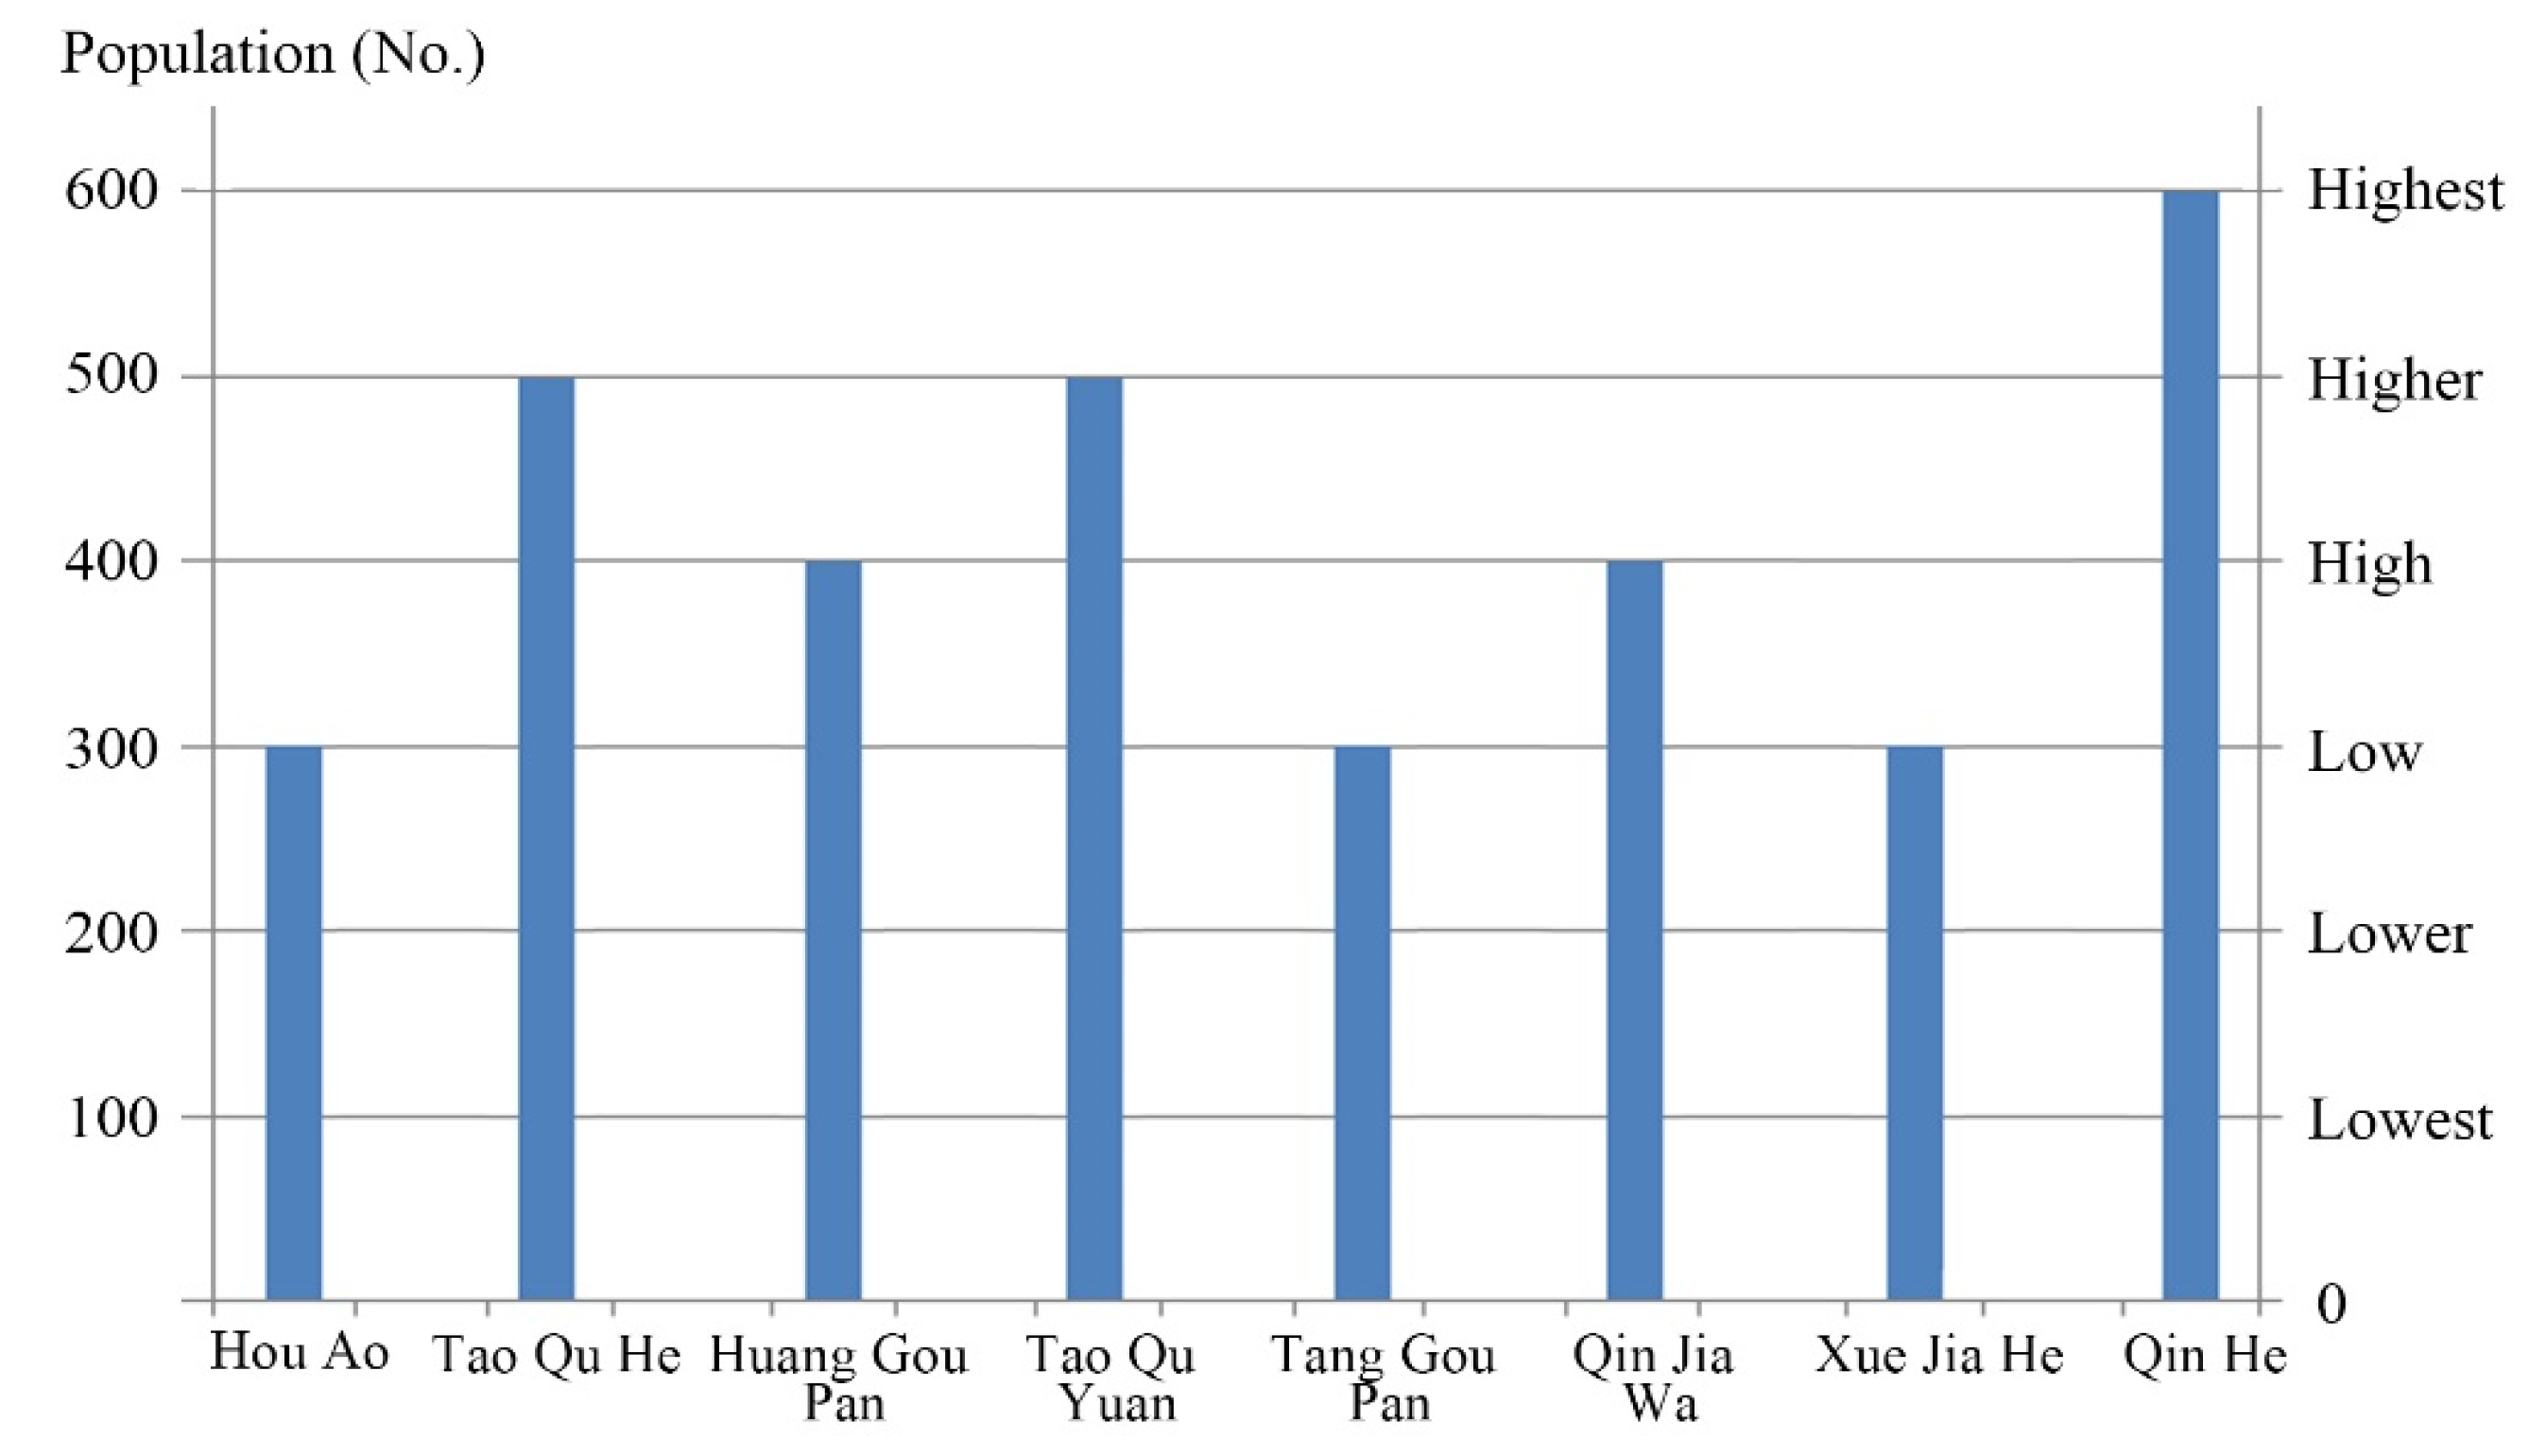
Although the villages’ infrastructure carrying capacity cannot be calculated accurately by the investigation and interviews in villages within research areas, the developing levels of villages’ infrastructure can be divided into six grades; a higher the grade means better infrastructure, as shown in
Figure 12. These research results can be used as valuable references for analysis of village movement and integration.
3.3.4. Comprehensive Analyses of Ecological Carrying Capacity of Villages
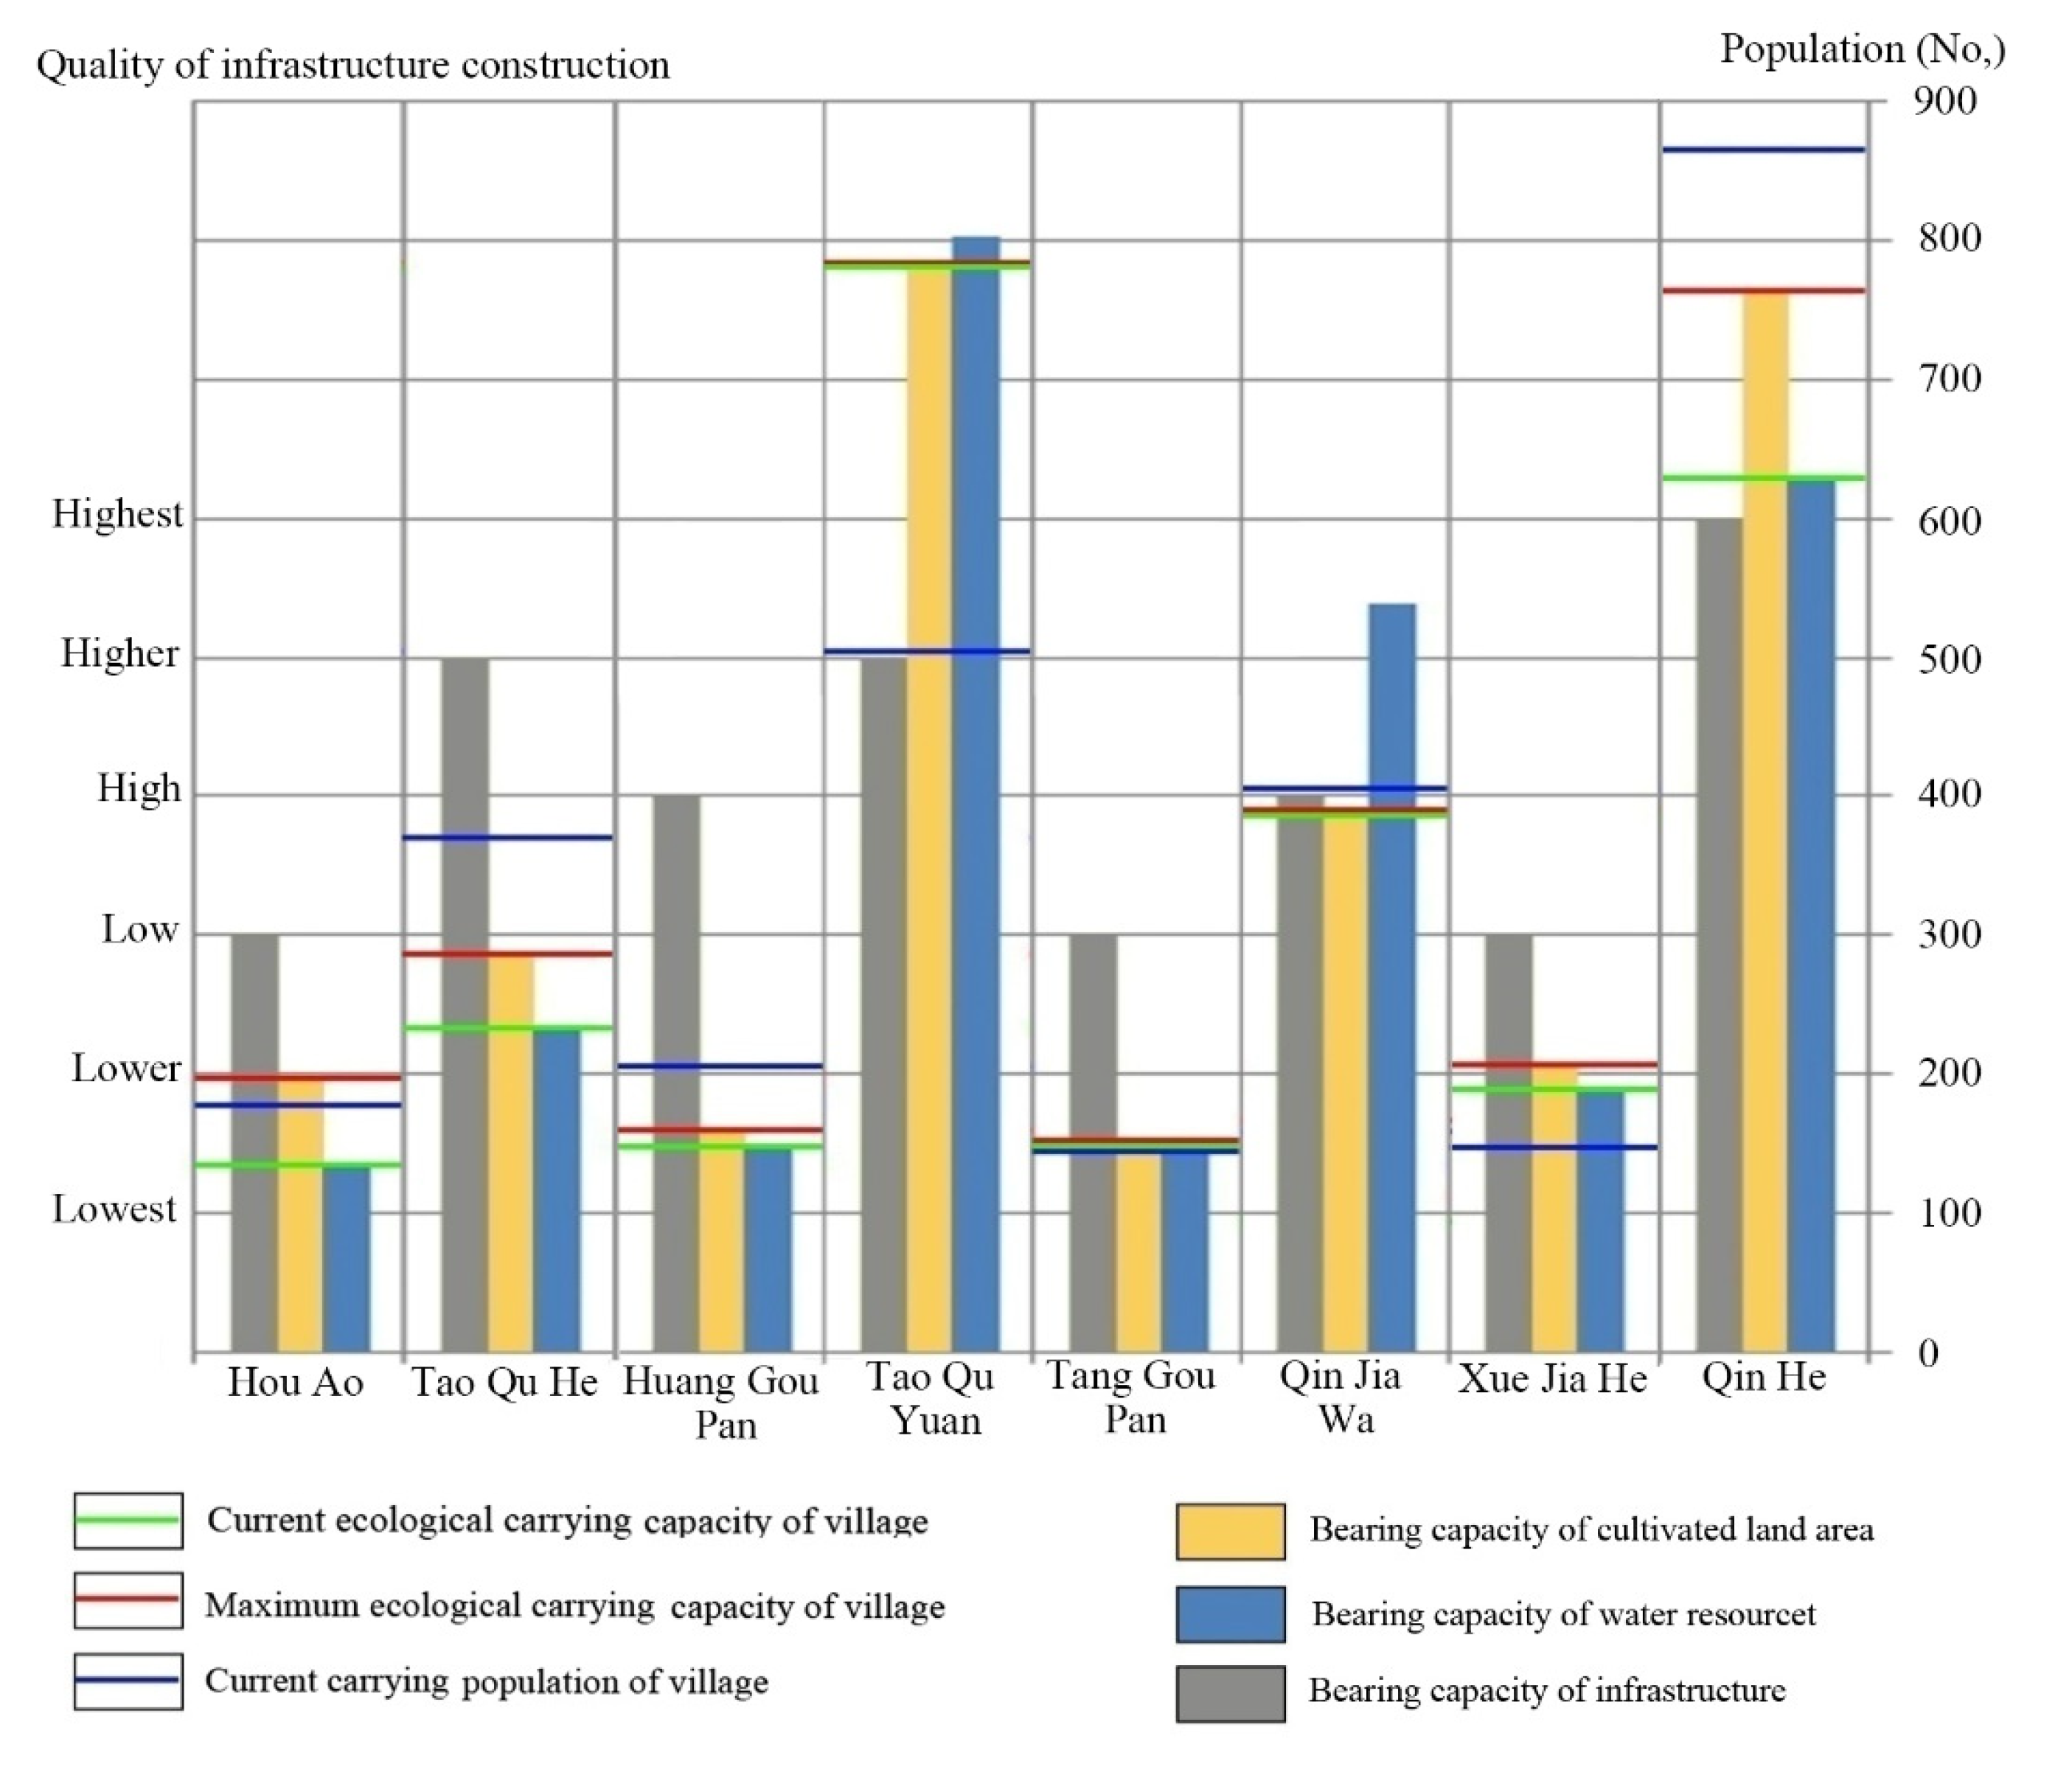
Figure 13 shows the results of analysis of cultivable land, water resource carrying capacity, and infrastructure; it can be used to identify the ecological carrying capacity situation of villages within research areas. Between cultivable land and water resource carrying capacity, the smaller value is the current ecological carrying capacity value. The infrastructure carrying capacity cannot be qualitatively analyzed; thus, it can be used as a reference base for planning the village movement or integration.
According to the analysis results for ecological carrying capacity based on limiting factors in villages within research areas, the relationship among maximum ecological carrying capacity (Pmax), current ecological carrying capacity (Pc), and current supporting population (Pp) can be figured out; thus, they can be used as a basic reference to analyze village population distribution in future village construction and planning.
In
Figure 13, the red line (maximum ecological carrying capacity) is determined by village cultivable land, showing the future population threshold value. The green line (current ecological carrying capacity) refers to the current ecological carrying capacity levels. The blue line (current population) indicates the villages’ current population.
The relationship between the red line and green line shows whether there is some improved space for villages’ ecological carrying capacity or not. The relationship between the red line and the blue line shows the threshold value and that the population has already exceeded its ecological carrying capacity. The relationship between the green line and the blue line shows to what extent the current population is over its ecological carrying capacity.
3.4. Rationality Analysis of Population Distribution in Typical Villages
Through the analysis of ecological carrying capacity, the rationality of each village’s ecological carrying capacity and its supporting population is shown in
Table 15. The populations in Qin He Village, Huang Gou Pan Village, and Tao Qu He Village are far over their carrying capacities; thus, the population size there is not reasonable. The population scale still can be increased in Tao Qu Yuan Village and Xue Jia He Village. For Hou Ao Village, it maintains the current population scale; the current water supply infrastructure should be improved to increase the current ecological carrying capacity value. The population in Tang Gou Pan Village is relatively reasonable but has already reached saturation.
3.5. Village Relocation and Combination Based on the Analysis of Ecological Carrying Capacity
The aim of ecological carrying capacity analysis is to provide a guideline for the future development of rural human settlements. Firstly, villages should be graded by their maximum ecological carrying capacity, current ecological capacity, and current supporting population. Secondly, the suitability of movement or integration should be decided by the villages’ grades. Finally, if village movement is necessary, issues regarding whole village movement or partial movement and where to move should be put into consideration, as demonstrated in
Table 16.
Combining the analysis of villages’ suitability for movement or integration with their infrastructure situation, suggestions can be given for village movement and integration, as shown in
Table 17.
After the comprehensive analysis, Tao Qu Yuan Village can be integrated with other villages to enlarge its population. On the one hand, it can release the pressure on other villages. On the other hand, the centralized society resource can improve local peoples’ living conditions, and city-level tourist resources should be explored. Parts of the population in Tao Qu He Village and Huang Gou Pan Village should be moved to improve the village living conditions. Xue Jia He Village can ignore the immigrating population, thus relieve the nearby village of its population pressure. Qin He Village, Tao Qu He Village, and Hou Ao Village need to establish a new water supply infrastructure to increase their water carrying capacity so as to further improve local peoples’ living quality.
4. Discussion
Previous studies extracting ecological carrying capacity have commonly been based on ecological footprint, measurement of natural vegetation as first productivity, supply–demand balance, the state-space method and the model forecast method, which includes the limiting factor method. Here, in comparison with various methods, the limiting factor method is adopted for our research. Because of the shortage of statistical data and local characteristics—fragile ecological environment, shortage of water, and cultivable land—the measurement results for general ecological carrying capacity do not have great value for local human settlement construction. Combing with the field investigation results, the analysis of limiting factors can be improved. On the one hand, the main factors that influence ecological carrying capacity in the gully regions can be figured out, then can be used to guide the future planning of these villages. On the other hand, the complex ecological carrying capacity analysis used in previous research can be simplified into several limiting factors; thus, this method is more feasible and practical. For accuracy, among the three main limiting factors’ analysis, the analysis results for cultivable land and water resources are much more accurate based on the relative accurate data. While the infrastructure analysis in this paper is a combination of qualitative and quantitative research, its accuracy is insufficient. In order to better adopt the method in future village planning, a more complete, scientific evaluation system for infrastructure needs to be established to perform the symmetric quantities analysis. All in all, in comparison with various methods, the analysis results have the most value for the future planning in gully regions of the Loess Plateau.
In this study, analysis of limiting factors on ecological carrying capacity was applied to a small and typical region in the gully regions of the Loess Plateau; three original limiting factors were selected as the main limiting factors, which were cultivable land, water resources and infrastructure. According to the characteristics of limiting factors, factors can be classified into two kinds. One is the factors that cannot easily be changed by humans, such as land and water resources. Another is the adjustable factors that can be improved, such as infrastructure. To plan villages based on the ecological carrying capacity is actually to plan based on those unchangeable limiting factors. The human settlement environment of villages can greatly benefit from the improvement of the adjustable factors, and this can result in green and sustainable development of villages in gully regions. In this study, cultivable land and water resources were the two main factors significantly influencing human settlement in this area, selected as main limiting factors. At the same time, infrastructure, as one of the most adjustable factors, was also selected as an important limiting factor.
The relationship between the maximum carrying capacity (Pmax) of the villages, the current ecological carrying capacity (Pc), and the current supporting population (Pp) can be obtained after a comprehensive analysis of ecological carrying capacity via the limiting factors within small-scale areas. Through the analysis of this relationship, a village is able to support more immigrants, who should be integrated with others to improve the human settlement environment. Finally, the villages’ grades can be fixed. According to the ecological carrying capacity, the villages in gully regions can be divided into six grades. Type I and II villages are suitable to be extended, types III and IV can be extended after the improvement of present conditions, and types V and VI are suggested to be moved. The application of this method in rural habitat planning of Qin He town in gully regions of the Loess Plateau shows this method is much more practical and feasible and also very effective. Eight small-scale villages were compared and supplied with future development suggestions by doing the comprehensive analyses of ecological carrying capacity through the analyses of each limiting factor. After the analysis, it is possible to do the village classification and improve the current living environment according to the different classification in the future. In summary, employing a field questionnaire investigation, and by actual practice of this method in a specific area of the gully region in the Loess Plateau, suggestions for future development can be submitted.
5. Conclusions
This study focuses on the gully regions of the Loess Plateau, using limiting factor analysis and ecological carrying capacity analysis to conduct the research. For the complexity and the suitability of the calculation of ecological carrying capacity, using limiting factors with the model forecast method may not be very accurate, but it can simplify the calculation process.
After the analysis of limiting factors—cultivable land, water resources and related infrastructure—six grades of ecological carrying capacity villages were graded, which can be used as a standard to determine villages’ classification. Combing with field investigation, it was found that among the eight object villages, three of them had no need to move or increase their population, three needed to move some part of their population, and two could enlarge or slightly increase their population. The research results can be used as a planning guideline for the future regional system planning of rural habitats in gully regions of the Loess Plateau, and further accurate estimation villages’ development direction and development of more effective evaluation methods for rural habitat planning. They can also be used as a rapid and efficient reference for the future human settlement environmental planning.
Due to the lack of relevant statistical data, some of the data used for ecological carrying capacity analysis were obtained through field surveys and interviews with local villagers and village leaders, so there may be some inaccuracies. In addition, this research field is still a gap in the related field; thus, there is still a shortage of analysis of ecological carrying capacity. Based on limiting factors, the analysis of ecological carrying capacity is not perfect currently, as it is limited to the rough evaluation of villages’ ecological carrying capacity and can be used as guideline in regional system planning of rural habitat within research areas. Further related research that can be used as the influence index of infrastructure should be explored. Thus, future research planning is shown as the following:
The infrastructure carrying capacity analysis in this paper is a kind of qualitative research; its accuracy is insufficient. In order to better adopt the method in future village planning, a more complete, scientific evaluation system needs to be established to perform the symmetric quantities analysis.
Regional system planning of rural habitats based on ecological carrying capacity analysis is just at the initial stages, lacking real cases to prove this method. This will certainly lead to many problems during the usage of this method in reality. It is hoped that this method can be improved and be perfected in the new socialist countryside in gully regions of the Loess Plateau.
The results of ecological carrying capacity analysis are mainly used in the process of village movement and integration within the small research areas, which are just a small part of new socialist countryside construction. It is hoped this ecological carrying capacity method also plays an important part in the process of improving human settlement environment.
Author Contributions
Data curation, T.Z., B.D. and Y.L.; Formal analysis, T.Z.; Funding acquisition, T.Z.; Investigation, T.Z. and Q.H.; Methodology, T.Z. and B.D.; Project administration, T.Z. and D.Z.; Resources, T.Z., Q.H., Y.L. and D.Z.; Software, T.Z. and B.D.; Supervision, D.Z., W.G. and H.F.; Writing—original draft, T.Z. and B.D.; Writing—review & editing, T.Z. and Q.H. All authors have read and agreed to the published version of the manuscript.
Funding
This work was supported by the National R&D Infrastructure and Facility Development Program of China, grant number 2007DKA32300-12 and Science and technology research and development project of Shaanxi Province, grant number 2010K01-123.
Conflicts of Interest
The authors declare no conflict of interest.
References
- Zhang, T.Z. Outline of Loess Plateau; Chinese Environmental and Scientific Press: Beijing, China, 1993. [Google Scholar]
- Yu, H.X. A Study of Ecologic Theory and Plan-Designing Methods for Human Habitat in Gully Region on Loess Plateau. Ph.D. Thesis, Xi’an University of Architecture and Technology, Xi’an, China, 22 September 2007. [Google Scholar]
- Cao, X.M.; Zhou, R.Q. The spatial features and leading measures of village system in small watershed in loess plateau gully region—A Case Study on Chunhua County, Shaanxi Province. Hum. Geograghy 2008, 5, 53–56. [Google Scholar]
- Liu, H.L.; Shi, P.J.; Zhang, X.B.; Zhang, H.; Wei, W. Spatial Structure Evolution of Urban System in the Loess Plateau Based on Ecological Carrying Capacity—A Case Study in Qingyang City. Arid Zone Res. 2015, 38, 173–180. [Google Scholar]
- Huang, M.H.; Wang, T.; Zhu, Y.N. Optimization of Urban Spatial Form of Small Towns in Gullied Loess Plateau. Planners 2016, 3, 114–119. [Google Scholar]
- Liu, H. The Regional Small Watershed Units of Human Settlements and the Security Models on the Loess Plateau. Ph.D. Thesis, Xi’an University of Architecture and Technology, Xi’an, China, 20 May 2005. [Google Scholar]
- Zhou, R.Q. Green Building System and Basic Settlement Pattern on the Loess Plateau; Construction Industry Press: Beijing, China, 2007. [Google Scholar]
- Zhou, Q.H.; Bai, Y.; Yang, Y.L. An exploration on urban space development routes in the loess plateau in the background of new urbanization: A case study on Wohu ravine new district of Mi Zhi county. City Plan. Rev. 2014, 11, 72–78. [Google Scholar]
- Schmidt–Soltau, K. Conservation–related Resettlement in Central Africa: Environmental and Social Risks. Dev. Chang. 2003, 34, 525–551. [Google Scholar] [CrossRef]
- Springer, J. Addressing the Social Impacts of Conservation: Lessons from Experience and Future Directions. Conserv. Soc. 2009, 7, 26–29. [Google Scholar] [CrossRef]
- Cernea, M.M. For a New Economics of Resettlement: A Sociological Critique of the Compensation Principle. Int. Soc. Sci. J. 2003, 55, 37–45. [Google Scholar] [CrossRef]
- Morvaridi, B. Resettlement, Rights to Development, and the Ilisu Dam, Turkey. Dev. Chang. 2004, 35, 719–741. [Google Scholar] [CrossRef]
- Shaanxi Province Bureau of Statistics. Shaanxi Province City County Historical Statistical Data Compilation; China Statistics Press: Beijing, China, 2014.
- Yu, H.X.; Zhou, R.Q.; Liu, L.A. Ecological approach to human settlement planning in small watershed gully areas on the loess plateau—With the example of Zaozigou small watershed in north Shaanxi. J. Xi’an Univ. Archit. Technol. 2005, 37, 189–193. [Google Scholar]
- Hai-Long, L.; Pei-Ji, S.; Bo, Y.; Hai-Meng, L.; Wei, W. Hierarchical scale structure’s evolution of urban system based on ecological carrying capacity in loess plateau region: A case of Qing Yang City. Arid Land Geography 2015, 38, 173–181. [Google Scholar]
- Meier, R.L. Urban carrying capacity and steady state considerations in planning for the mekong valley region. Urban. Ecol. 1978, 3, 1–27. [Google Scholar] [CrossRef]
- Gao, W.F.; Zhu, M.L. Preliminary exploration of ecological landscape construction on hill and gully regions of loess plateau. Appl. Mech. Mater. 2014, 4, 584–586. [Google Scholar] [CrossRef]
- Zhao, G.; Mu, X.; Wen, Z.; Wang, F.; Gao, P. Soil erosion, conservation, and eco-environment changes in the loess plateau of china. Land Degrad. Dev. 2013, 24, 499–510. [Google Scholar] [CrossRef]
- Maos, J.O.; Prion, I. The spatial organization of rural services: An operational model for regional development planning. Appl. Geogr. 1988, 8, 65–79. [Google Scholar] [CrossRef]
- Liao, H.X.; Ji, Y.L.; Peng, S.L. Resource and Environment Carrying Capacity and Sustainable Development. Ecol. Environ. Sci. 2016, 25, 1253–1258. [Google Scholar]
- Liu, Y.Y.; Zhou, D. Review on the Living Environment Planning Based on the Ecological Carrying Capacity Analysis. Huazhong Archit. 2014, 3, 22–25. [Google Scholar]
- Kang, P.; Xu, L. The urban ecological regulation based on ecological carrying capacity. Procedia Environ. Sci. 2010, 2, 1692–1700. [Google Scholar] [CrossRef] [Green Version]
- Liu, R.Z.; Borthwick, A.G.L. Measurement and assessment of carrying capacity of the environment in Ningbo, China. J. Environ. Manag. 2011, 92, 2047–2053. [Google Scholar] [CrossRef]
- Wenpeng, D.; Huimin, Y.; Yanzhao, Y.; Fang, L. Evaluation Methods and Research Trends for Ecological Carrying Capacity. J. Resour. Ecol. 2018, 9, 115–125. [Google Scholar] [CrossRef]
- Ester, V.D.V. Books: Our ecological footprint: Reducing human impact on the earth. J. Ind. Ecol. 2010, 3, 185–187. [Google Scholar]
- Wackernagel, M.; Onisto, L.; Bello, P.; Linares, A.C.; Falfán, I.S.L.; García, J.M.; Guerrero, A.I.S.; Guerrero, M.G.S. National natural capital accounting with the ecological footprint concept. Ecol. Econ. 1999, 29, 375–390. [Google Scholar] [CrossRef]
- Zhang, X.S.; Zhou, G.S. Exploration on the model of natural vegetation as first productivity. J. Plant. Ecol. 1995, 19, 193–200. [Google Scholar]
- APALi, D.; Sun, C.; Zhang, X. Modelling the net primary productivity of the natural potential vegetation in china. Acta Bot. Sin. 1998, 40, 560–566. [Google Scholar]
- Wang, J.; Sun, T.; Peijun, L.I.; Fayun, L.I. Research progress on environmental carrying capacity. Chin. J. Appl. Ecol. 2005, 16, 768. [Google Scholar]
- Liu, D.; Feng, Z.; Yang, Y.; You, Z. Spatial patterns of ecological carrying capacity supply-demand balance in china at county level. J. Geogr. Sci. 2011, 21, 833–844. [Google Scholar] [CrossRef]
- Xiong, Y.; Li, Y.M. Application of state space method to provincial development priority zoning—A case study of human province. J. Ecol. Rural Environ. 2010, 26, 109–113. [Google Scholar]
- Gao, L.; Zhang, H.Y. Progress in Research of Ecological Carrying Capacity. China Popul. Resour. Environ. 2007, 17, 19–26. [Google Scholar]
- Gu, K.K. Concepts and assessment methods of ecological carrying capacity. Ecol. Environ. Sci. 2012, 21, 389–396. [Google Scholar]
- Li, Y.; Zhao, G.H.; Zhou, J. Establishment of evaluation index system of ecological carrying capacity in changping district pusalu village. Procedia Environ. Sci. 2011, 11, 899–905. [Google Scholar] [CrossRef] [Green Version]
- Nie, Q.H. A review and preview of prime farmland protection in P.R. China. China Popul. Resour. Environ. 1999, 2, 33–37. [Google Scholar]
- Cai, Y.L.; Ze-Qiang, F.U.; Dai, E.F. The minimum area per capita of cultivated land and its implication for the optimization of land resource allocation. Acta Geogr. Sin. 2002, 57, 127–134. [Google Scholar]
- Chen, B.M.; Zhou, X.P. Explanation of current land use condition classification for national standard of the people’s republic of china. J. Nat. Resour. 2007, 22, 994–1003. [Google Scholar]
- Zhu, Y.Z.; Xia, J.; Tan, G. A Primary Study on the Theories and Process of Water Resources Carrying Capacity. Prog. Geogr. 2002, 21, 180–188. [Google Scholar]
- Zhongmin, X.U. A scenario-based framework for multi-criteria decision analysis in water carrying capacity. J. Glaciolgy Geocryol. 1999, 2. [Google Scholar]
- Jun, F.; Mingan, S.; Quanjiu, W.; Jones, S.B.; Reichardt, K.; Xiangrong, C.; Xiaoli, F. Toward sustainable soil and water resources use in china’s highly erodible semi-arid loess plateau. Geoderma 2010, 155, 93–100. [Google Scholar] [CrossRef]
- Shi, H.; Shao, M. Soil and water loss from the loess plateau in china. J. Arid Environ. 2000, 45, 9–20. [Google Scholar] [CrossRef]
- Shenggen, F.A.N.; Zhang, X. Infrastructure and regional economic development in rural china. China Econ. Rev. 2004, 15, 203–214. [Google Scholar]
- Zhang, M.Y. Research on the relationship between rural infrastructure and new socialist rural areas. Hui Agric. Sci. 2007, 12, 14–29. [Google Scholar]
- Local Chronicles Compilation Committee of Shaanxi Province. Yong Shou County Annals; Shaanxi People’s Publishing House: Xi’an, China, 2015. [Google Scholar]
- Ma, Z.Y.; Xu, Y.D.; Fan, J.J. The distribution utilization and sustainable development of water resource in Shaanxi, China. Northwest. Geol. 2003, 36, 96–100. [Google Scholar]
- Fei, Z.G.; Hou, J.Q. Construction of rural infrastructure project management system. Rural. Econ. 2009, 9, 20–22. [Google Scholar]
Figure 1.
Location of gully regions.
Figure 1.
Location of gully regions.
Figure 2.
Cross section of a rural habitat in gully regions.
Figure 2.
Cross section of a rural habitat in gully regions.
Figure 3.
Statistics results of the main limiting factors.
Figure 3.
Statistics results of the main limiting factors.
Figure 4.
Six kinds of village are graded according to the ecological carrying capacity analysis (Pmax: maximum carrying capacity of the villages, Pc: the current ecological carrying capacity, and Pp: current supporting population in the research areas).
Figure 4.
Six kinds of village are graded according to the ecological carrying capacity analysis (Pmax: maximum carrying capacity of the villages, Pc: the current ecological carrying capacity, and Pp: current supporting population in the research areas).
Figure 5.
Location of Qin He town.
Figure 5.
Location of Qin He town.
Figure 6.
Landscape of typical research area.
Figure 6.
Landscape of typical research area.
Figure 7.
Space distributions of villages in typical research area.
Figure 7.
Space distributions of villages in typical research area.
Figure 8.
Present situation of roads in typical research areas.
Figure 8.
Present situation of roads in typical research areas.
Figure 9.
Present situation of human settlement in typical research areas.
Figure 9.
Present situation of human settlement in typical research areas.
Figure 10.
Current and estimates of cultivable land carrying capacity of the villages in 2025.
Figure 10.
Current and estimates of cultivable land carrying capacity of the villages in 2025.
Figure 11.
Evaluation of carrying capacity of water resources in the villages.
Figure 11.
Evaluation of carrying capacity of water resources in the villages.
Figure 12.
Evaluation of carrying capacity of infrastructure construction in the villages.
Figure 12.
Evaluation of carrying capacity of infrastructure construction in the villages.
Figure 13.
Ecological carrying capacity situation based on limiting factors.
Figure 13.
Ecological carrying capacity situation based on limiting factors.
Table 1.
Space distribution in gully regions of the Loess Plateau.
Table 1.
Space distribution in gully regions of the Loess Plateau.
| Region | Sub-Regions | Provinces | Cities | Land Areas (km2) | Total Population (mil.) |
|---|
| Gully region of Loess Plateau | Gully region of Long Dong Loess Plateau | Gan Su | Qing Yang | 9213 | 4.3 |
| Ping Lang |
| Gully region of Shan Bei Loess Plateau | Shaanxi | Yan’an | 3505 |
| Tong Chuan |
| Wei Nan city |
| Gully regions of Wei Bei Loess Plateau | Shaanxi | Xian Yang | 2058 |
| Bao Ji city |
Table 2.
The questionnaire survey objects.
Table 2.
The questionnaire survey objects.
| Provinces | Cities | Districts and Counties | Number of Towns | Number of Villages |
|---|
| Gansu province | Qingyang City | Xifeng District | 3 towns | 6 villages |
| Gansu province | Pingliang City | Lingtai County | 1 town | 4 villages |
| Shanxi province | Xianyang City | Changwu County | 6 towns | 24 villages |
| Shanxi province | Xianyang City | Chunhua County | 3 towns | 8 villages |
| Shanxi province | Xianyang City | Yongshou County | 3 towns | 12 villages |
| Shanxi province | Baoji City | Qianyang County | 2 towns | 9 villages |
Table 3.
Chinese food safety requirement.
Table 3.
Chinese food safety requirement.
| Strategies | Food Requirement Per Person (kg)
[National Food and Nutrition Consultant Committee (2004)] | Per Capita Food (kg)
[Aims of Food Safety Calculated by Chen Baiming (2002)] |
|---|
| 2010 (Basic well-off society) | 391 | 420 |
| 2020 (All-round well-off society) | 437 | — |
| 2030 (Transition period for rich stage) | 472 | 450 |
| 2050 (Rich stage in all-round) | — | 500 |
Table 4.
The requirement for cultivable land area for different food demands in the Loess Plateau (hm2).
Table 4.
The requirement for cultivable land area for different food demands in the Loess Plateau (hm2).
| Years | S400 | S450 | S500 |
|---|
| A | B | C | A | B | C | A | B | C |
|---|
| 1995 | 0.254 | 0.253 | 0.208 | 0.286 | 0.284 | 0.234 | 0.317 | 0.316 | 0.260 |
| 2020 | 0.204 | 0.203 | 0.163 | 0.230 | 0.229 | 0.183 | 0.255 | 0.254 | 0.203 |
| 2030 | 0.175 | 0.175 | 0.136 | 0.197 | 0.196 | 0.153 | 0.219 | 0.218 | 0.170 |
| 2050 | 0.152 | 0.152 | 0.115 | 0.171 | 0.171 | 0.129 | 0.190 | 0.190 | 0.144 |
Table 5.
The requirement of cultivable land per capita in the Loess Plateau (hm2).
Table 5.
The requirement of cultivable land per capita in the Loess Plateau (hm2).
| Years | A | B | C |
|---|
| 2010 | 0.229 | 0.228 | 0.186 |
| 2020 | 0.217 | 0.216 | 0.173 |
| 2030 | 0.208 | 0.207 | 0.162 |
| 2050 | 0.190 | 0.190 | 0.144 |
Table 6.
Current cultivable land areas and the supporting population in research areas.
Table 6.
Current cultivable land areas and the supporting population in research areas.
| Villages | Current Population
(No.) | Real Cultivable Land Area (mu) | Real Needed Cultivable Land Per Capita (mu) | Current Support Population by Cultivable Land (No.) | 2025 Year, the Cultivable Land Support Population (No.) |
|---|
| Hou Ao | 187 | 647 | 3.46 | 188 | 199 |
| Tao Qu He | 374 | 935 | 2.50 | 272 | 287 |
| Huang Gou Pan | 207 | 526 | 2.54 | 153 | 162 |
| Tao Qu Yuan | 508 | 2550 | 5.02 | 742 | 783 |
| Tang Gou Pan | 146 | 483 | 3.31 | 141 | 148 |
| Qin Jia Wa | 402 | 1266 | 3.15 | 369 | 389 |
| Xie Jia He | 155 | 547 | 3.53 | 159 | 168 |
| Qin He | 876 | 2483 | 2.83 | 723 | 763 |
Table 7.
Statistics of water supply situation of villages within research areas.
Table 7.
Statistics of water supply situation of villages within research areas.
| Villages | Current Water Supply Volume (L) | Ways of Living Water Supply | Actual Water Demand Volume (L) | Water Resource Carrying Capacity (No.) |
|---|
| Hou Ao | 28,000 | Centralized | 39,083 | 134 |
| Tao Qu He | 48,600 | Centralized | 78,166 | 233 |
| Huang Gou Pan | 31,000 | Centralized | 43,263 | 148 |
| Tao Qu Yuan | 167,600 | Separated | 106,172 | 802 |
| Tang Gou Pan | 32,100 | Centralized | 30,514 | 154 |
| Qin Jia Wa | 112,600 | Centralized | 84,018 | 539 |
| Xue Jia He | 40,000 | Centralized | 29,887 | 191 |
| Qin He | 131,400 | Centralized | 183,084 | 629 |
Table 8.
Village classification by the village population and income.
Table 8.
Village classification by the village population and income.
| Villages | Average Income
>6500 RMB/Y
(>1000 USD/Y) | Villages
4000–6500 RMB
615–1000 USD/Y) | Average Income
4000–6500 RMB
(615–1000 USD/Y) |
|---|
| Over 2000 people | G1 | G2 | G1 | G2 |
| 800–2000 People | G3 | G3 | G2 | G3 |
| Less than 800 people | G3 | G4 | G3 | G4 |
Table 9.
Classification of the levels of public infrastructure.
Table 9.
Classification of the levels of public infrastructure.
| | G1 | G2 | G3 | G4 |
|---|
| Village health clinic | ● | ● | ● | ● |
| Service center | ● | ● | ● | ● |
| Senior center | ● | ● | ● | ● |
| Kindergarten | ● | ● | ● | — |
| Market | ● | ● | ● | — |
| Primary school | ● | ● | — | — |
| Village committee | ● | ● | — | — |
| Nursing home | ● | ● | — | — |
| Cultural station | ● | ● | — | — |
| Middle school | ● | — | — | — |
| Bank | ● | — | — | — |
Table 10.
Public service infrastructure situation in the villages.
Table 10.
Public service infrastructure situation in the villages.
| Villages | Clinic | Service Center | Old People Center | Shops | Kindergarten | Primary School | Market | Nursing Home |
|---|
| Hou Ao | — | — | — | ● | — | — | — | — |
| Tao Qu He | ● | ● | ● | ● | — | — | — | — |
| Huang GouPan | ● | ● | — | ● | — | — | — | — |
| Tao Qu Yuan | ● | ● | — | ● | — | — | — | — |
| Tang Gou Pan | ● | ● | — | ● | — | — | — | — |
| Qin Jia Wa | ● | ● | — | ● | — | — | — | — |
| Xue Jia He | | ● | — | ● | — | — | — | — |
| Qin He | ● | ● | — | ● | ● | ● | — | ● |
Table 11.
Situation of roads and bridges in the villages.
Table 11.
Situation of roads and bridges in the villages.
| Villages | Width of Main Road | Surface of Main Road | Width of Branch Road | Surface of Branch Road | Satisfaction Degree on Roads | Parking Area (Parking Lot: Cars) | Bridge |
|---|
| Hou Ao | 4 M | Cement concrete | — | — | General | No | No |
| Tao Qu He | 6 M | Cement concrete | 4 M | Cement concrete | Good | 1:20 | No |
| Huang GouPan | 6 M | Cement concrete | 4 M | Cement concrete | Good | 1:10 | No |
| Tao Qu Yuan | 12 M | Cement concrete | 4 M | Cement concrete | Good | 2:50 | No |
| Tang Gou Pan | 6 M | Cement concrete | 4 M | Cement concrete | Good | No | No |
| Qin Jia Wa | 4 M | Cement concrete | 2.5 M | Soil surface | General | No | 1 |
| Xue Jia He | 4 M | Cement concrete | — | — | General | No | No |
| Qin He | 24 M | Cement concrete | 12 M | Cement concrete | Very good | No | No |
Table 12.
Situation of drainage projects in the villages.
Table 12.
Situation of drainage projects in the villages.
| Villages. | Water Supply Volume | Water Supply Pressure | Water Supply Methods | Water Towers | Disperse Drainage or Not | Rain Water Drainage | Living Waste Water Treatment |
|---|
| Hou Ao | General | General | Centralized | No | Yes | Concreted ditch | No |
| Tao Qu He | Tension | General | Centralized | Yes | Yes | Concreted ditch | No |
| Huang GouPan | General | General | Centralized | No | Yes | Concreted ditch | No |
| Tao Qu Yuan | Adequacy | intensity | Separate | Yes | No | Concreted canal | No |
| Tang Gou Pan | General | General | Centralized | No | Yes | Concreted canal | No |
| Qin Jia Wa | Adequacy | intensity | Centralized | No | Yes | Concreted ditch | No |
| Xue Jia He | Adequacy | intensity | Centralized | No | Yes | Concreted ditch | No |
| Qin He | Tension | General | Centralized | No | No | Concreted canal | Pipes collection |
Table 13.
Situation of waste collection in the villages.
Table 13.
Situation of waste collection in the villages.
| Villages | Water Supply Volume | Water Supply Pressure | Water Supply Methods | Water Towers | Disperse Drainage or Not | Rain Water Drainage |
|---|
| Hou Ao | Yes | No | No | Once three weeks | No | Incineration |
| Tao Qu He | Yes | No | Yes | Once two weeks | Yes | Landfill |
| Huang Gou Pan | Yes | No | No | Once three weeks | No | Incineration |
| Tao Qu Yuan | Yes | No | No | Once two weeks | No | Landfill |
| Tang Gou Pan | Yes | No | Yes | Once three weeks | No | Composing |
| Qin Jia Wa | Yes | No | No | Once three weeks | No | Incineration |
| Xue Jia He | Yes | No | Yes | Once three weeks | No | Landfill |
| Qin He | Yes | No | Yes | Once one weeks | Yes | Landfill |
Table 14.
Situation of other infrastructures.
Table 14.
Situation of other infrastructures.
| Villages | Indoor or Outdoor Toilet | Toilet Types | Have Septic Tank or Not | Major
Energy | Popularizing Rate of Solar Energy | Culture Heritage |
|---|
| Hou Ao | A majority of Indoor | A majority of dry toilet | No | Coal | 15% | No |
| Tao Qu He | A majority of Indoor | A majority of dry toilet | No | Coal | 15% | No |
| Huang GouPan | A majority of Indoor | A majority of flush toilet | No | Coal | 30% | No |
| Tao Qu Yuan | A majority of Outdoor | A majority of dry toilet | No | Coal | 20% | City level heritage |
| Tang Gou Pan | A majority of Outdoor | A majority of dry toilet | No | Coal | 10% | No |
| Qin Jia Wa | A majority of Outdoor | A majority of dry toilet | No | Coal | 10% | No |
| Xue Jia He | A majority of Indoor | A majority of dry toilet | No | Coal | 10% | No |
| Qin He | A majority of Indoor | A majority of flush toilet | No | Coal | 30% | No |
Table 15.
Analysis of ecological carrying capacity and population scale.
Table 15.
Analysis of ecological carrying capacity and population scale.
| Villages | Relationship among Pmax, Pc and Pp | Rationality Analysis on Population |
|---|
| Hou Ao | Pmax > Pp > Pc | Current population is less than the maximum ecological carrying capacity, but the low carrying capacity, if need to increase the population, the current ecological carrying capacity should be improved firstly. |
| Tao Qu He | Pp > Pmax > Pc | Current population is far over its ecological carrying capacity threshold, too much population |
| Huang Gou Pan | Pp > Pmax > Pc | Current population is far over its ecological carrying capacity threshold, too much population |
| Tao Qu Yuan | Pmax ≈ Pc > Pp | Current supporting population is much less than current ecological carrying capacity, and current ecological carrying capacity is near the maximum, thus there are big space for enlarge the population. |
| Tang Gou Pan | Pmax ≈ Pc > Pp | Current population is little bit less than current ecological carrying capacity, and current ecological carrying capacity is near the maximum, thus the population is reasonable. |
| Qin Jia Wa | Pp ≈ Pmax = Pc | Current population is little bit over the maximum ecological carrying capacity, and the population has reached “saturation”. |
| Xue Jia He | Pmax > Pc > Pp | Current population is less than current ecological carrying capacity, and current ecological carrying capacity still can be improved, thus the population can be suitably increased. |
| Qin He | Pp > Pmax > Pc | Current population is far over its ecological carrying capacity threshold, too much population |
Table 16.
Analysis of the suitability of village relocation and combination.
Table 16.
Analysis of the suitability of village relocation and combination.
| Villages | Relationship among Pmax, Pc and Pp | Construction Grades | Pmax − Pp
(No.) | Pmax − Pc
(No.) | Pc − Pp
(No.) |
|---|
| Hou Ao | Pmax > Pp > Pc | IV | 12 | 65 | −53 |
| Tao Qu He | Pp > Pmax > Pc | VI | −87 | 54 | −141 |
| Huang Gou Pan | Pp > Pmax > Pc | VI | −45 | 14 | −59 |
| Tao Qu Yuan | Pmax = Pc > Pp | II | 275 | 0 | 275 |
| Tang Gou Pan | Pmax = Pc > Pp | II | 2 | 0 | 2 |
| Qin Jia Wa | Pp ≈ Pmax = Pc | V | −13 | 0 | −13 |
| Xue Jia He | Pmax > Pc > Pp | I | 65 | 17 | 48 |
| Hou Ao | Pp > Pmax > Pc | VI | −113 | 134 | −247 |
Table 17.
Suggestions for villages’ future development.
Table 17.
Suggestions for villages’ future development.
| Villages | Analysis of Ecological Carrying Capacity | Evaluation of Infrastructure | Marks | Suggestions |
|---|
| Hou Ao | Current population beyond the current ecological carrying capacity. If the carrying capacity can be improved by increasing water resource, it will meet the demand of current population. | 3 | No | No need to movement; Population cannot be increased; Improve the supply water. |
| Tao Qu He | Current population is far beyond it ecological carrying capacity threshold value. If the carrying capacity can be improved, it still cannot support current population. | 5 | No | Appropriately move some parts of population and increase water supply. |
| Huang Gou Pan | Current population is over ecological carrying capacity threshold value, and the capacity can be improved. | 4 | No | Appropriately move some parts of population |
| Tao Qu Yuan | The ecological carrying capacity level is high and near to maximum, the supporting population can be increased. | 5 | Have city-level tourist resource | Appropriately enlarge population |
| Tang Gou Pan | Current population is near maximum capacity and current capacity | 3 | No | No need to move and increase population |
| Qin Jia Wa | Ecological carrying capacity level is relatively high and a little bit beyond the maximum capacity that can support large population. | 4 | No | No need to move and increase population |
| Xue Jia He | Ecological carrying capacity level is relatively low, but still can support small parts of population | 3 | No | Increase small parts of population |
| Qin He | Ecological carrying capacity level is relatively high, but the supporting population is far beyond its capacity threshold. The difference between current ecological carrying capacity and current population can be less by improvement of water resource. | 6 | Town government is located there, and own part non-agriculture population. | Appropriately move some parts of population, and the water supply infrastructure should be improved. |
© 2020 by the authors. Licensee MDPI, Basel, Switzerland. This article is an open access article distributed under the terms and conditions of the Creative Commons Attribution (CC BY) license (http://creativecommons.org/licenses/by/4.0/).

 ,
, 


