Article

Soil Quality and Its Potential Indicators under Different Land Use Systems in the Shivaliks of Indian Punjab

by
Bharat Bhushan Vashisht
1,*,
Bijesh Maharjan
2,
Sandeep Sharma
1 and
Samanpreet Kaur
3
1
Department of Soil Science, Punjab Agricultural University, Ludhiana, Punjab 141004, India
2
Department of Agronomy and Horticulture, University of Nebraska–Lincoln, Panhandle Research and Extension Center (PREC), Scottsbluff, NE 69361, USA
3
Department of Soil and Water Engineering, Punjab Agricultural University, Ludhiana, Punjab 141004, India
*
Author to whom correspondence should be addressed.
Sustainability 2020, 12(8), 3490; https://0-doi-org.brum.beds.ac.uk/10.3390/su12083490
Submission received: 28 March 2020 / Revised: 17 April 2020 / Accepted: 20 April 2020 / Published: 24 April 2020
(This article belongs to the Special Issue Sustainable Soil Health Management)

Abstract

:
The present study assessed the overall state of the soil based on the most sensitive soil attributes under different land uses—i.e., rainfed agriculture, mixed forest, afforestation and non-arable lands—in the lower Shivaliks of Indian Punjab. The soil parameters—i.e., erosion ratio, bulk density and water retention characteristics—and fertility parameters were integrated under different land uses to identify potential soil quality indicators.The overall state of the soil, based on a weighted average of primary soil functions under different land uses through fuzzy modeling, was deemed best for agricultural land use (0.515), followed by forests (0.465) and non-arable lands (0.456), and deemed worst under afforestation (0.428). Among the different land use systems, principal component analysis (PCA) clearly separated the agriculture and forest samples from afforestation and non-arable lands samples. The contribution of potential indicators such as erosion ratio (ER), phosphorus (P) and potassium (K) toward the soil quality index (SQI) was substantial. The order of contribution of the selected indicators to the SQI was 53.5%, 34.3% and 19.9% for ER, P and K, respectively. These indicators are most influential for studying real time soil health and ecological processes in the future, under various land use systems in degraded agroecosystems like the Shivaliks.

1. Introduction

The Shivaliks region, in the lower Himalayas of India, is characterized by its susceptibility to land degradation because of many topographic and land cover characteristics. The young, unconsolidated low Shivaliks hills, which were once dotted with perennial springs and gentle streams, were converted into a tract of ever widening and deepening torrent beds, which bring flash floods from the barren hills [1]. This region receives 800 to 1000 mm of rainfall, which is almost 1.5 times that of the alluvial plain of Punjab, but about 80 percent of the rainfall occurs in three monsoon months, and the major part ends in runoff. In the remaining months, the availability of water for drinking, livestock, domestic use and field crops is extremely limited. The overexploitation and mismanagement of soil resources through deforestation, overgrazing and land clearing for agriculture has resulted in the ecological degradation of the Shivalik hills and contributed immensely toward excessive silt load in rivers of the foothill, reduced recharge of ground water and an overall decline in land productivity, which has also affected the socio-economic conditions of the inhabitants [2,3].This region faces a serious problem in terms of the decline in the soil organic carbon (SOC) pool, primarily due to deforestation, land use changes, soil erosion and fertility decline [4]. This region is designated as one of the eight most degraded and fragile ecosystems in the country [5]. In the Shivaliks, about 60 percent of the total area is under agriculture, 27 percent under forests, and about 2 percent under horticulture crops. The soils of the Shivaliks with different land uses are vulnerable to erosion hazards and require proper management strategies for their conservation and sustained production. Soil loss varied from 10–15 Mg ha−1yr−1 in the areas under agricultural use and mixed forests; however, it varied from 15–22 and 20–25 Mg ha−1yr−1 under afforestation and non-arable lands, respectively [6]. It is important to assess the current state of the soil in the region, in order to devise management strategies that would reduce soil erosion risk and provide sustainable land use practices.
The concept of soil quality has emerged during the last decades and is used to assess land or soil quality under various systems [7,8,9,10]. It is suggested that, for practical purposes, soil quality can be used to evaluate the impacts on crop yield, erosion, ground and surface water status and quality, and food and air quality [11]. For the evaluation of soil quality, it is desirable to select indicators that are directly related to soil quality. A soil quality indicator is a measurable soil property that affects the capacity of a soil to perform a specified function [12,13]. Several attempts have also been made in submontane Punjab to monitor different soil quality parameters [14]. In the lower Shivaliks of Punjab, the highest soil quality index was reported for forest land use, followed by grassland, horticulture, cultivated and bare land uses [15]. Soil organic carbon, potassium, electrical conductivity (EC), plant available water, K-factor of universal soil loss equation (K-USLE) and clay content were identified as key indicators affecting the soil quality in a micro-watershed in the vicinity of the Punjab Shivaliks [15]. Most of the findings on soil quality in the Shivaliks were limited to few soil attributes or sites.
The objectives of the present study were to assess the soil quality index under different land uses by integrating the effects of different soil characteristics in different locations of the Punjab Shivaliks and to generate a minimum data set on soil quality indicators as a quick tool to frame a strategy to quantify soil quality. The latter will help mitigate the accelerated environmental degradation by performing a principal component analysis (PCA) for soil management and sustained production.

2. Materials and Methods

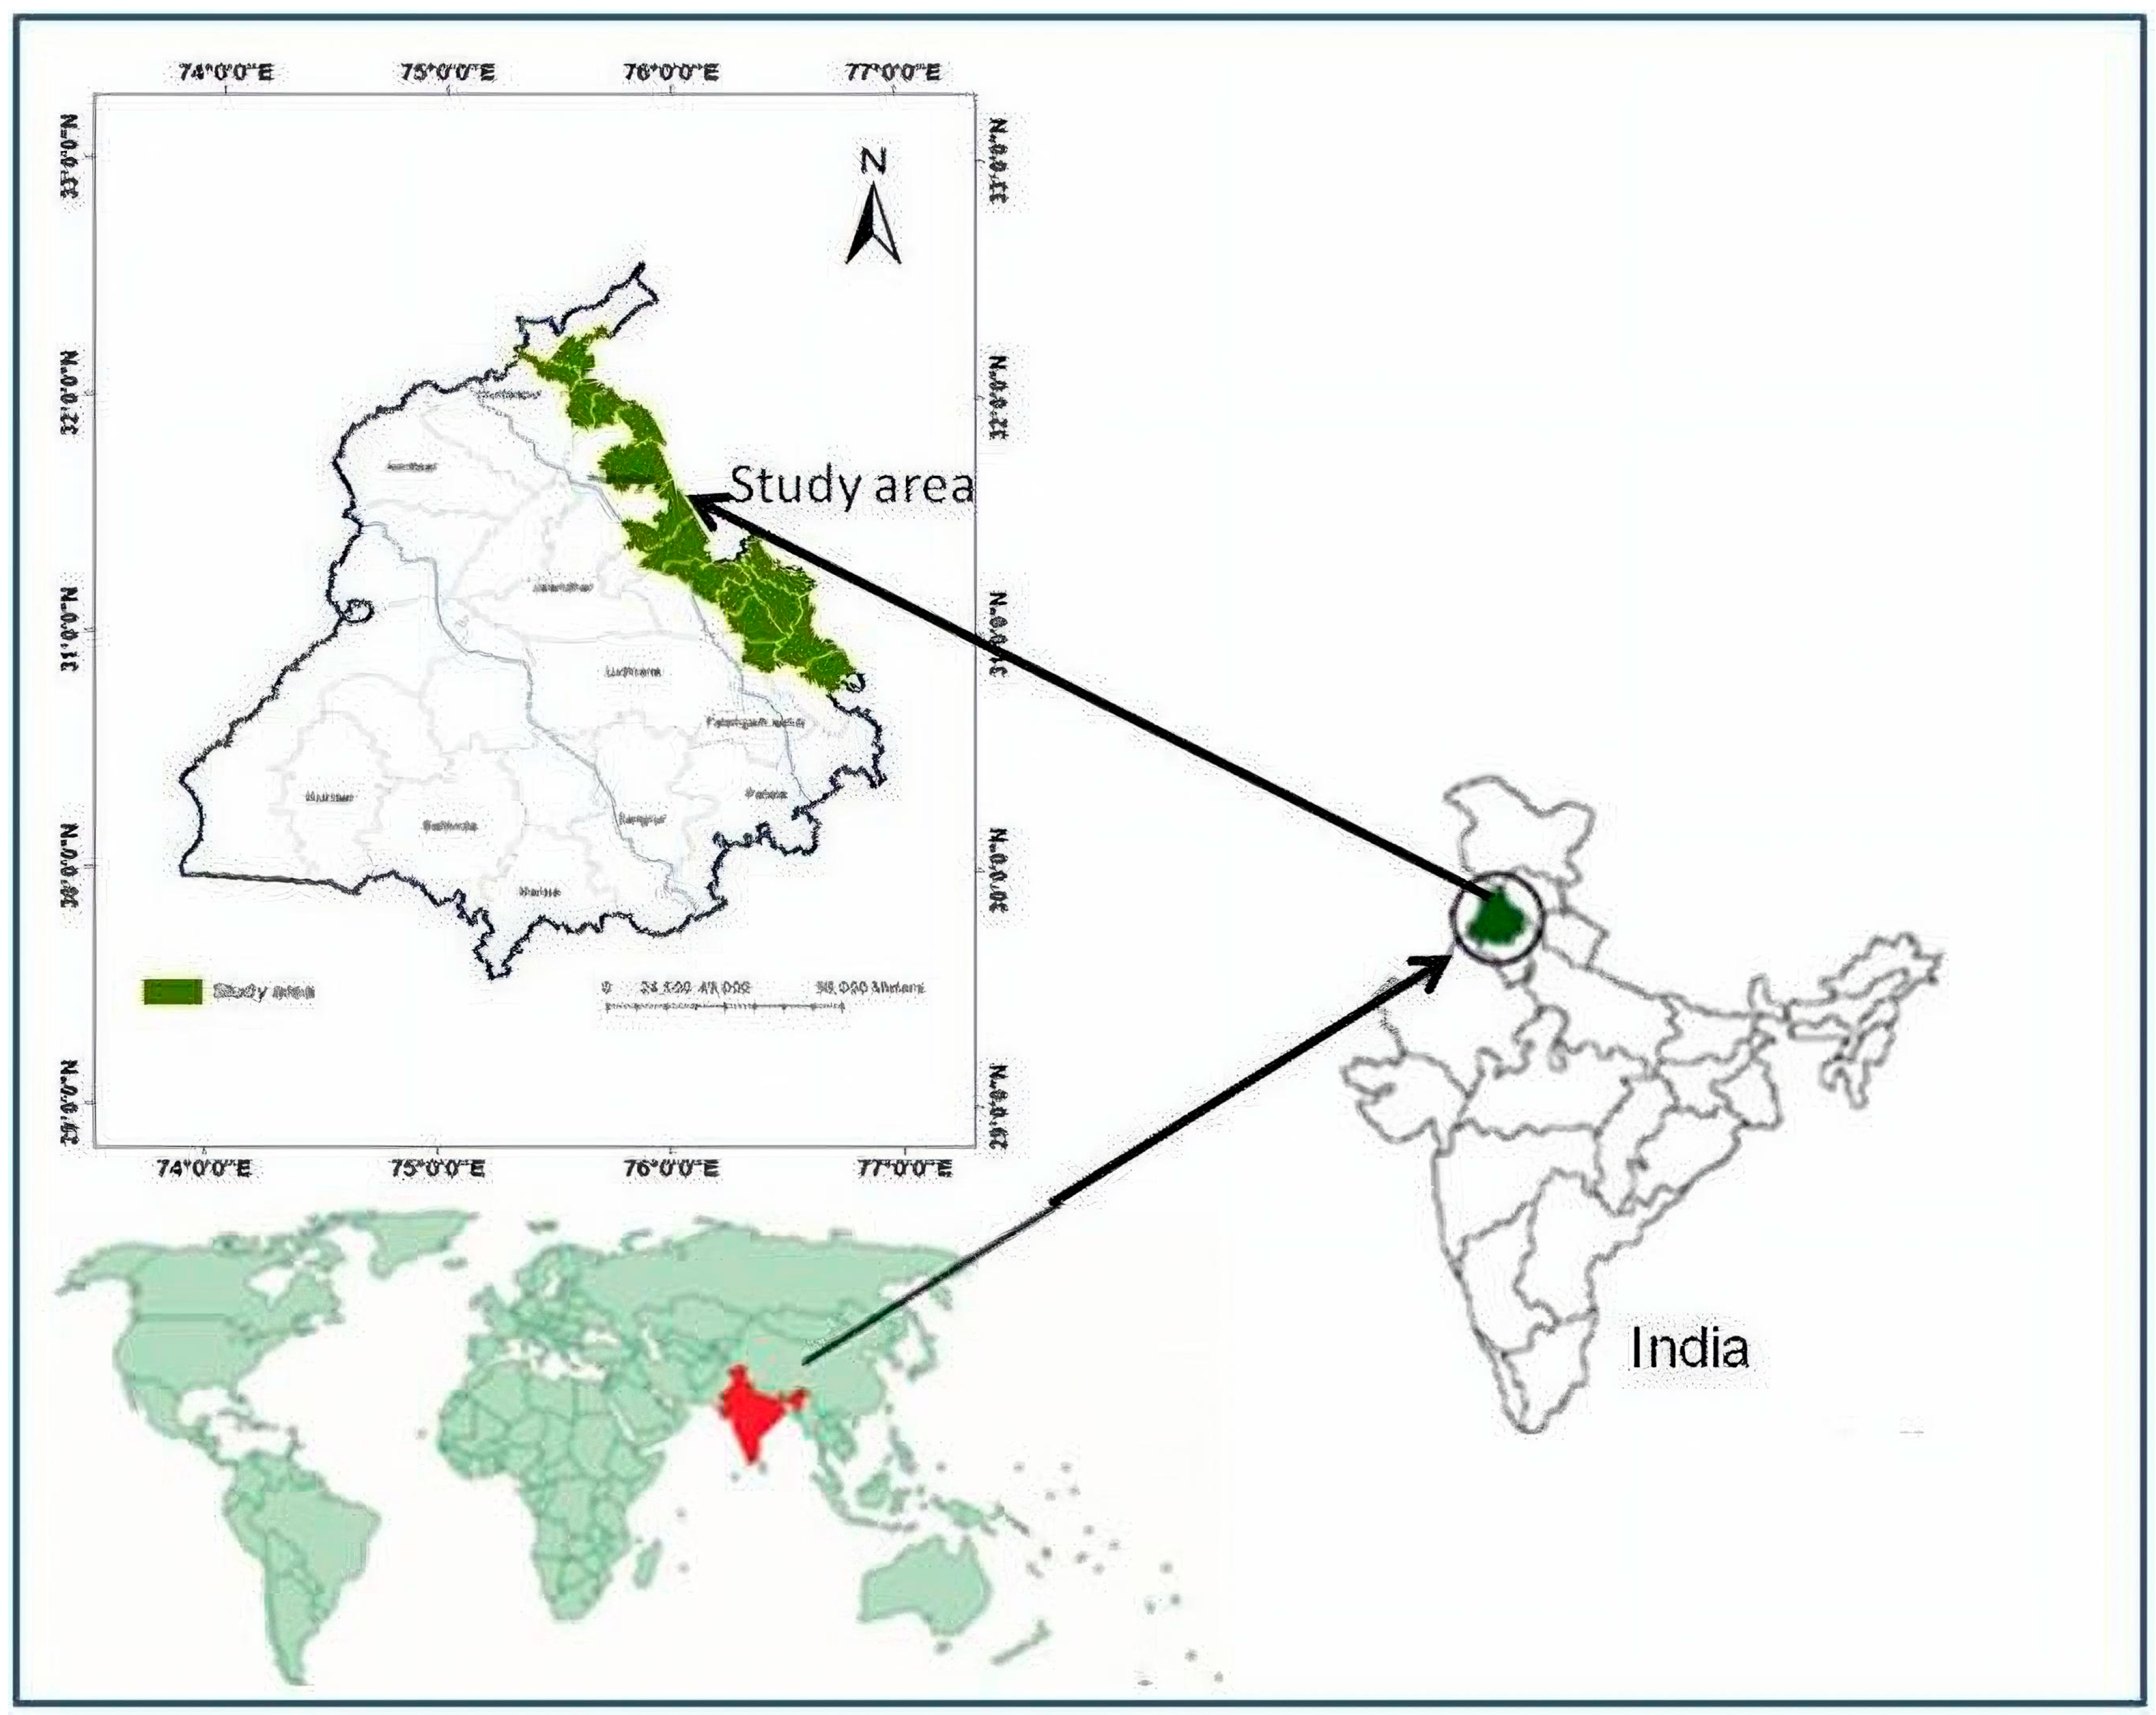
2.1. Study Site Description

The study area lies between 30°40′ to 32°05′ N latitude and 75°25′ to 76°58′ E longitude, and its elevation varies from 250 to 350 m above mean sea level (Figure 1). The topography of the area is undulating to rolling, with the angle of the slopes ranging from 5 to 15 degrees. The total area of this belt is 497,520 ha, constituting about 9.88 percent of the geographical area covering the five districts of the Punjab state. The soils occur on the foothill belt of the Shivalik hills known as the kandi area (piedmont area) of Punjab. The benchmark soils of this region have been characterized as deep, imperfectly drained, coarse-loamy and non-calcareous [16]. The soils were classified following the criteria of soil taxonomy [17]. The color of the typifying pedon of the soils is dark brown on the surface horizon and dark yellowish brown on the subsurface horizons. The soils appear to have developed on stratified parent material, as the texture changes with depth (Table 1). The texture varies from sandy loam through silty loam to loamy sand or sand, from surface to depth. There is no structural development associated with pedogenesis. The organic carbon content also changes irregularly with depth, suggesting the fluventic or stratified nature of soils.
The climate of the study area is semi-arid, with a mean annual air temperature of 23.7 °C and a mean annual rainfall around 875 mm. More than half of the rainfall just ends in runoff because of the inadequate vegetation cover on the hilly forest and arable sloping land. The soils are mostly erodible and belong to an ustic moisture regime and to a hyperthermic temperature regime. The temperature regime is hyperthermic. These soils are a member of the coarse-loamy, mixed, hyperthermic family of Typic Ustifluvents. Maize–wheat is the main cropping system of the region. Some areas are under green fodder, pulses and fruit plants.

2.2. Sample Collection and Analysis

The soil samples (0–0.15 m) were collected from four land use systems, namely rainfed agriculture, mixed forests, afforestation and non-arable lands in the Lower Shivaliks of Punjab. The soil samples were collected from different micro-watersheds depending upon the percentage of area under different land use. A total of 60 composite samples were collected, i.e., 40 from the Agriculture ecosystem (mostly under the Maize-wheat cropping system), 10 from Forests (Mixed forests with moderate to high slopes), 5 from each area prone to afforestation (forest cover reduced to almost zero) and non-arable lands (lands not under use, mostly barren). A higher grid size was kept for Agriculture as compared to other land uses. Composite samples were prepared by taking surface soil samples from random spots (15–20) using a push probe auger from sites with the different land uses in different parts of the Shivaliks. These composite samples were air-dried at room temperature and ground to pass through a 2 mm sieve after removing all visible residues. They were subsequently stored in a moisture-free environment for the determination of their physico-chemical properties. Dichromate oxidizable SOC was estimated by the rapid titration method, using a diphenyl amine indicator [18]. The pH and EC of the soil suspension—i.e., 1:2 (soil:water)—were measured by a pH meter and a conductivity meter, respectively. The soil samples were analyzed for Olsen P and ammonium acetate (NH4OAc)-extractable K by the methods described by Olsen et al. 1954 [19] and Knudsen et al. 1982 [20], respectively. The particle size distribution—i.e., sand, silt and clay contents—was determined by the Pipette method and the bulk density with core method [21]. The soil texture of the study area varied from loamy sand to sandy loam (Agriculture & Afforestation land use), loamy sand (Forest) and sandy loam to loam (Non-arable). The soil moisture characteristic, i.e., field capacity, and the permanent wilting point, i.e., water held at 0.33 and 15 bar of suction, respectively, were determined by the use of a Pressure Plate membrane apparatus [22]. The erosion ratio (ER) was computed by using the relationships suggested by Middleton 1930 [23]. Middleton found that soilshaving anerosion ratio greater than 10 were most frequently susceptible toerosion. It was determined as the ratio of dispersion to the percentage of clay in the moisture equivalent. Dispersion ratio was determined as the ratio of the percentage of silt plus clay in undispersed soil to the percentage of silt plus clay in dispersed soil.

2.3. Overall State of Soils

Based on the primary functions of the soils, the relevant indicators were selected for indexing the overall state ofthesoils under different land uses (Table 2). The observed values of soil attributes (potential soil quality indicators) were converted into a unit less score of 0–1 through fuzzy modeling, using different scoring curves [24]. The detail of this methodology is given elsewhere [2,25].
The notion that “lower is better” was used for the erosion ratio and bulk density, as the low values of these factors indicates a better resistance to erosion. On other hand, inthecase of soil moisture constants and plant growth parameters, that notion that “higher is better” was used. The ranges of indicators and converted scores are presented in Table 2. The relevant indicators were apportioned weights dependent upon their comparative importance (Table 3). The uppermost weight (0.30) was allocated to physical degradation/erodibility, i.e., erosion ratio. Soil compaction and water retention were assigned a weight of 0.20 (bulk density) and 0.08 (field capacity and permanent wilting point), respectively. A weight of 0.15 was assigned to the organic carbon content, and 0.05 to pH, N, P and K. After this, the individual rating (q) and assigned weights (W) of different soil functions were multiplied to obtain the weighted scores (0 to 1 scale), which were then summed up to get the aggregated score (Q) representing the soil’s state or condition (Equation (1)).
Q = qerWer + qbdWbd + qwrWwr + qocWoc + qpgWpg
where er represents the erosion ratio; bd the bulk density; wr the water retention; oc the organic carbon; and pg the plant growth functions (pH, N, P and K).

2.4. Data Analysis

A principal component analysis (PCA) was employed to define the most significant and important soil properties influenced by the varying state of soils in different land uses. PCA is a mathematical technique that converts a number of correlated variables into a smaller number of uncorrelated or independent variables, based on the eigenvector decomposition of the covariance [26,27]. Each PC explained a certain amount (%) of the variation in the total dataset. The PCs with higher eigen values and variables which had high factor loading were considered as the best representatives of the system’s attributes. The correlations among the indicators were assessed by the determination ofthePearson correlation coefficients (r) and probabilities. In all the analyses, significance was accepted at a level of probability (p) of <0.05.
The data were statistically analyzed with the analysis of variance (ANOVA) technique using locally developed software [28]. The means for treatment effects were separated based on Fisher’s protected least significant difference (LSD) at p < 0.05.

3. Results and Discussion

3.1. Characteristics of the Soils

The ranges of the selected indicators/soil attributes—i.e., erosion ratio, bulk density, water retention characteristics and fertility parameters—under different land uses are presented in Table 4. The erosion ratio has generally been recognized as the most suitable index to characterize soils according to their erodibility [29]. It is useful for predicting soil’s susceptibility to erosion. Particle size distribution and organic matter content are the two most important indicators of erodibility. The erosion ratios in the studied soils ranged from 24.6 to 86.7 in rainfed agriculture lands, 24.5 to 43.0 in forests soils, 51.0 to 51.4 in the afforestation area and 33.8 to 62.6 in non-arable lands. Forest soils have a low value of erosion ratio compared to other land uses [30]. The erosion indices among different land uses [31] in the lower Shivaliks were reported in the following sequence: barren (0.97), cultivated (0.84), grassland (0.74) and forest (0.63). Considering the upper limit oftheerosion ratio as 10 for non-erosive soils [23], all the soils in the Shivaliks are susceptible to erosion. However, the mean value oftheerosion ratio was low in the soils under forests. This may be due to the litter fall and higher root biomass incorporation [30]. Singh et al. 2006 [32] also reported the low value of the erosion ratio for soils under forests and grasslands in southeastern Rajasthan. Due to an increasing demand for timber, pasture and food and to residential dwindling, forests are being degraded or converted to cropland, which results in lower soil quality and, consequently, decreased productivity [33].
A huge variation in bulk density values was observed in the soil samples collected from different land uses. The mean bulk density under different land uses varied from 1.35 to 1.50 Mg m−3. The soils of forest areas showed higher values of bulk density as compared to soils under cultivated conditions and other land uses. This is probably due tothe loss of the soils’organic matter, combined with greater sand content and poorer aggregation; moreover, trampling by grazing livestock on the surface layer resulted in higher bulk density in the natural forests. Higher values of bulk density were observed in torrent-affected areas of the Shivalik–Himalayan region in India, because of a very poor organic carbon content and poor soil aggregation [2]. The soils were foundto bepoor in organic carbon content under all land uses. However, the content was higher in the soils under non-arable (0.30%) and agricultural lands (0.29%), followed by forest soils (0.20%). Variations in organic carbon in soils under various land uses were observed due to varying leaf litter and their rate of decomposition [34]. Forests had a higher basal soil respiration than the other land use systems due to a relatively dense structure of plants and the continuous deposition of organic matter through leaf litter and fine roots [35]. In eroded forest soils of the outer Himalayas, a negative correlation between bulk density with organic carbon and clay content has been reported [36,37]. The higher organic carbon content under cultivated conditions may be ascribed to the application of farm yard manure and the decomposition of crop residues.
The soils under non-arable and cultivated lands exhibited higher water retention than the areas under afforestation and mixed forests. In general, soil water constants—i.e., the field capacity and permanent wilting point of the soils—ranged from 7.0 to 20.8 and from 2.0 to 7.0%, respectively. The arable lands were mostly under the maize-wheat cropping system. The application of farm yard manure and mulching with locally available material helped increase crop productivity, available moisture as well as soil health [38]. For non-arable lands—which are mostly the government’s lands, with locally grown wild grasses—water retention was also high due to the fine texture, and slopes were low as compared to forests and other areas under afforestation. In a study on a micro-watershed in the Shivaliks [15], the highest value of moisture retention at field capacity was observed in grassland areas (21.2%). This value was significantly at par with that of cultivated areas (17.7%), followed by horticulture (12.4%), bare areas (12.6%) and forests (11.4%). The soils under study were neutral to alkaline (pH 6.5–9.4). The mean pH was near neutral in forest soils and alkaline in afforestation and non-arable lands, indicating a better nutrient status. The available nitrogen, phosphorus and potassium contents were low in all land uses. However, N, P and K were higher in non-arable lands (185.0 kg ha−1), agriculture (10.1 kg ha−1) and forests (123.0 kg ha−1), respectively. The afforested areas maintained the lower values of N (103.5 kg ha−1), P (3.2 kg ha−1) and K (108.8 kg ha−1). This might be due to the coarser soil texture in the areas prone to afforestation.

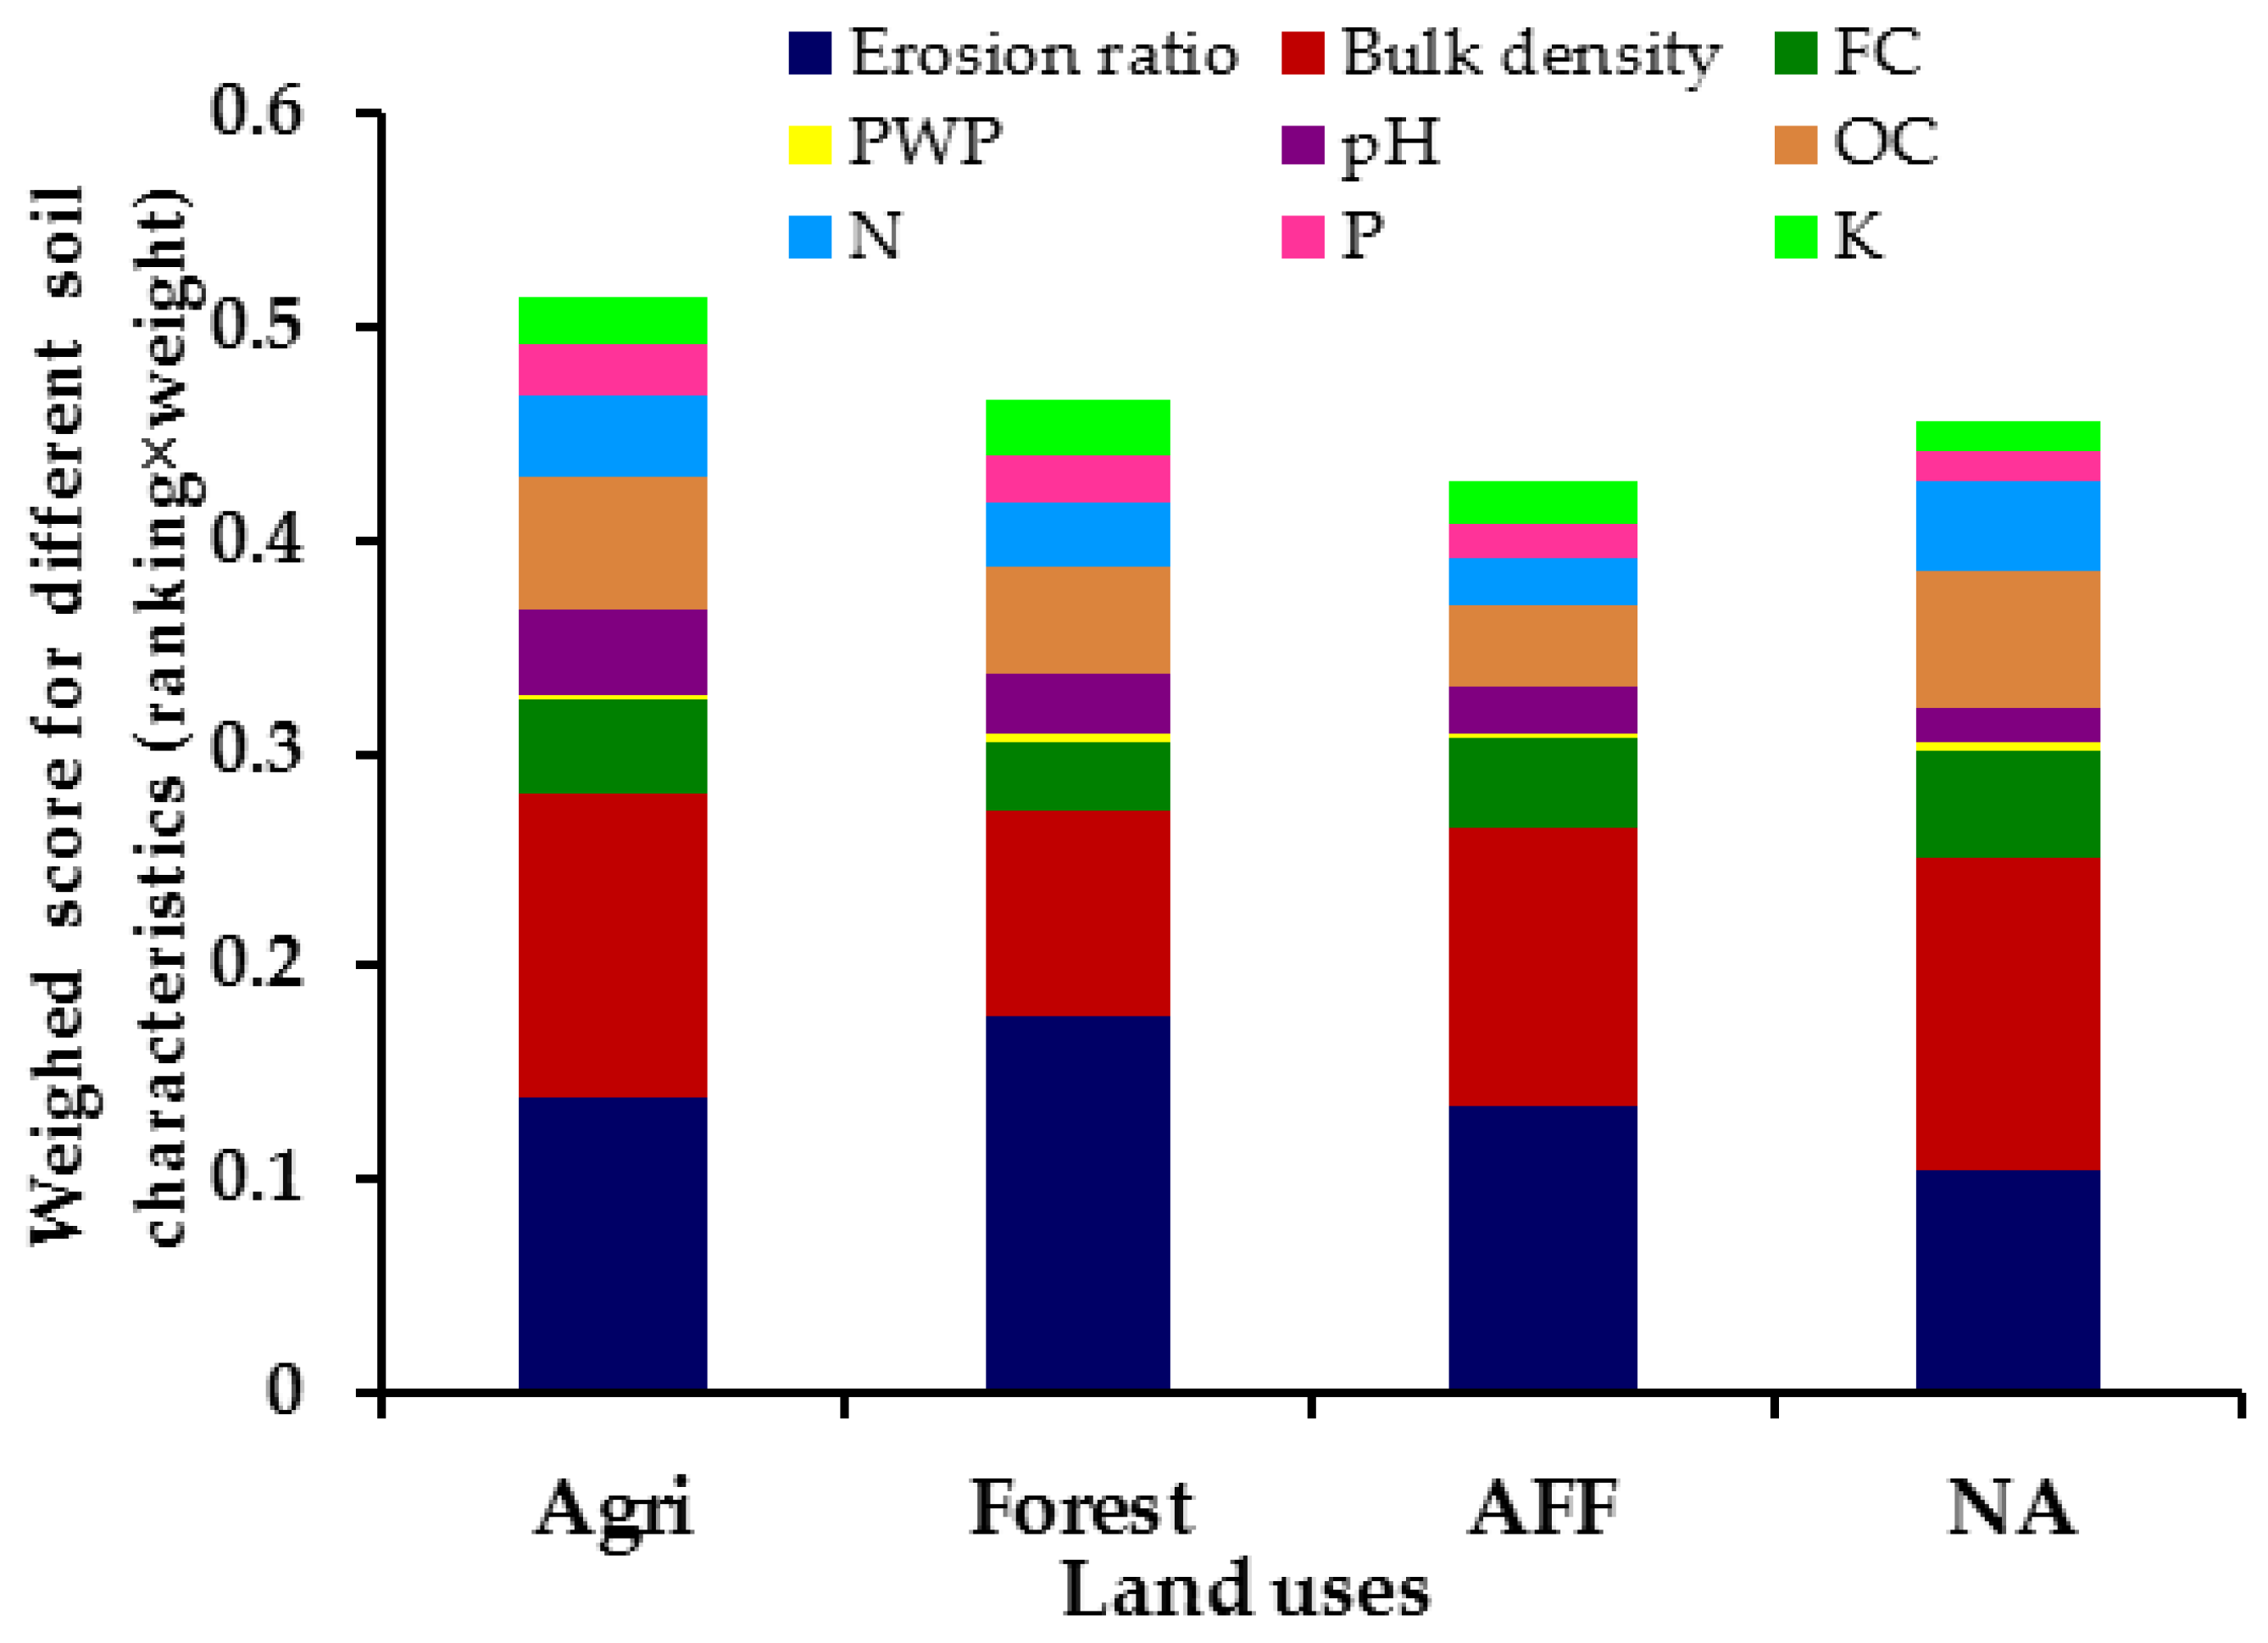
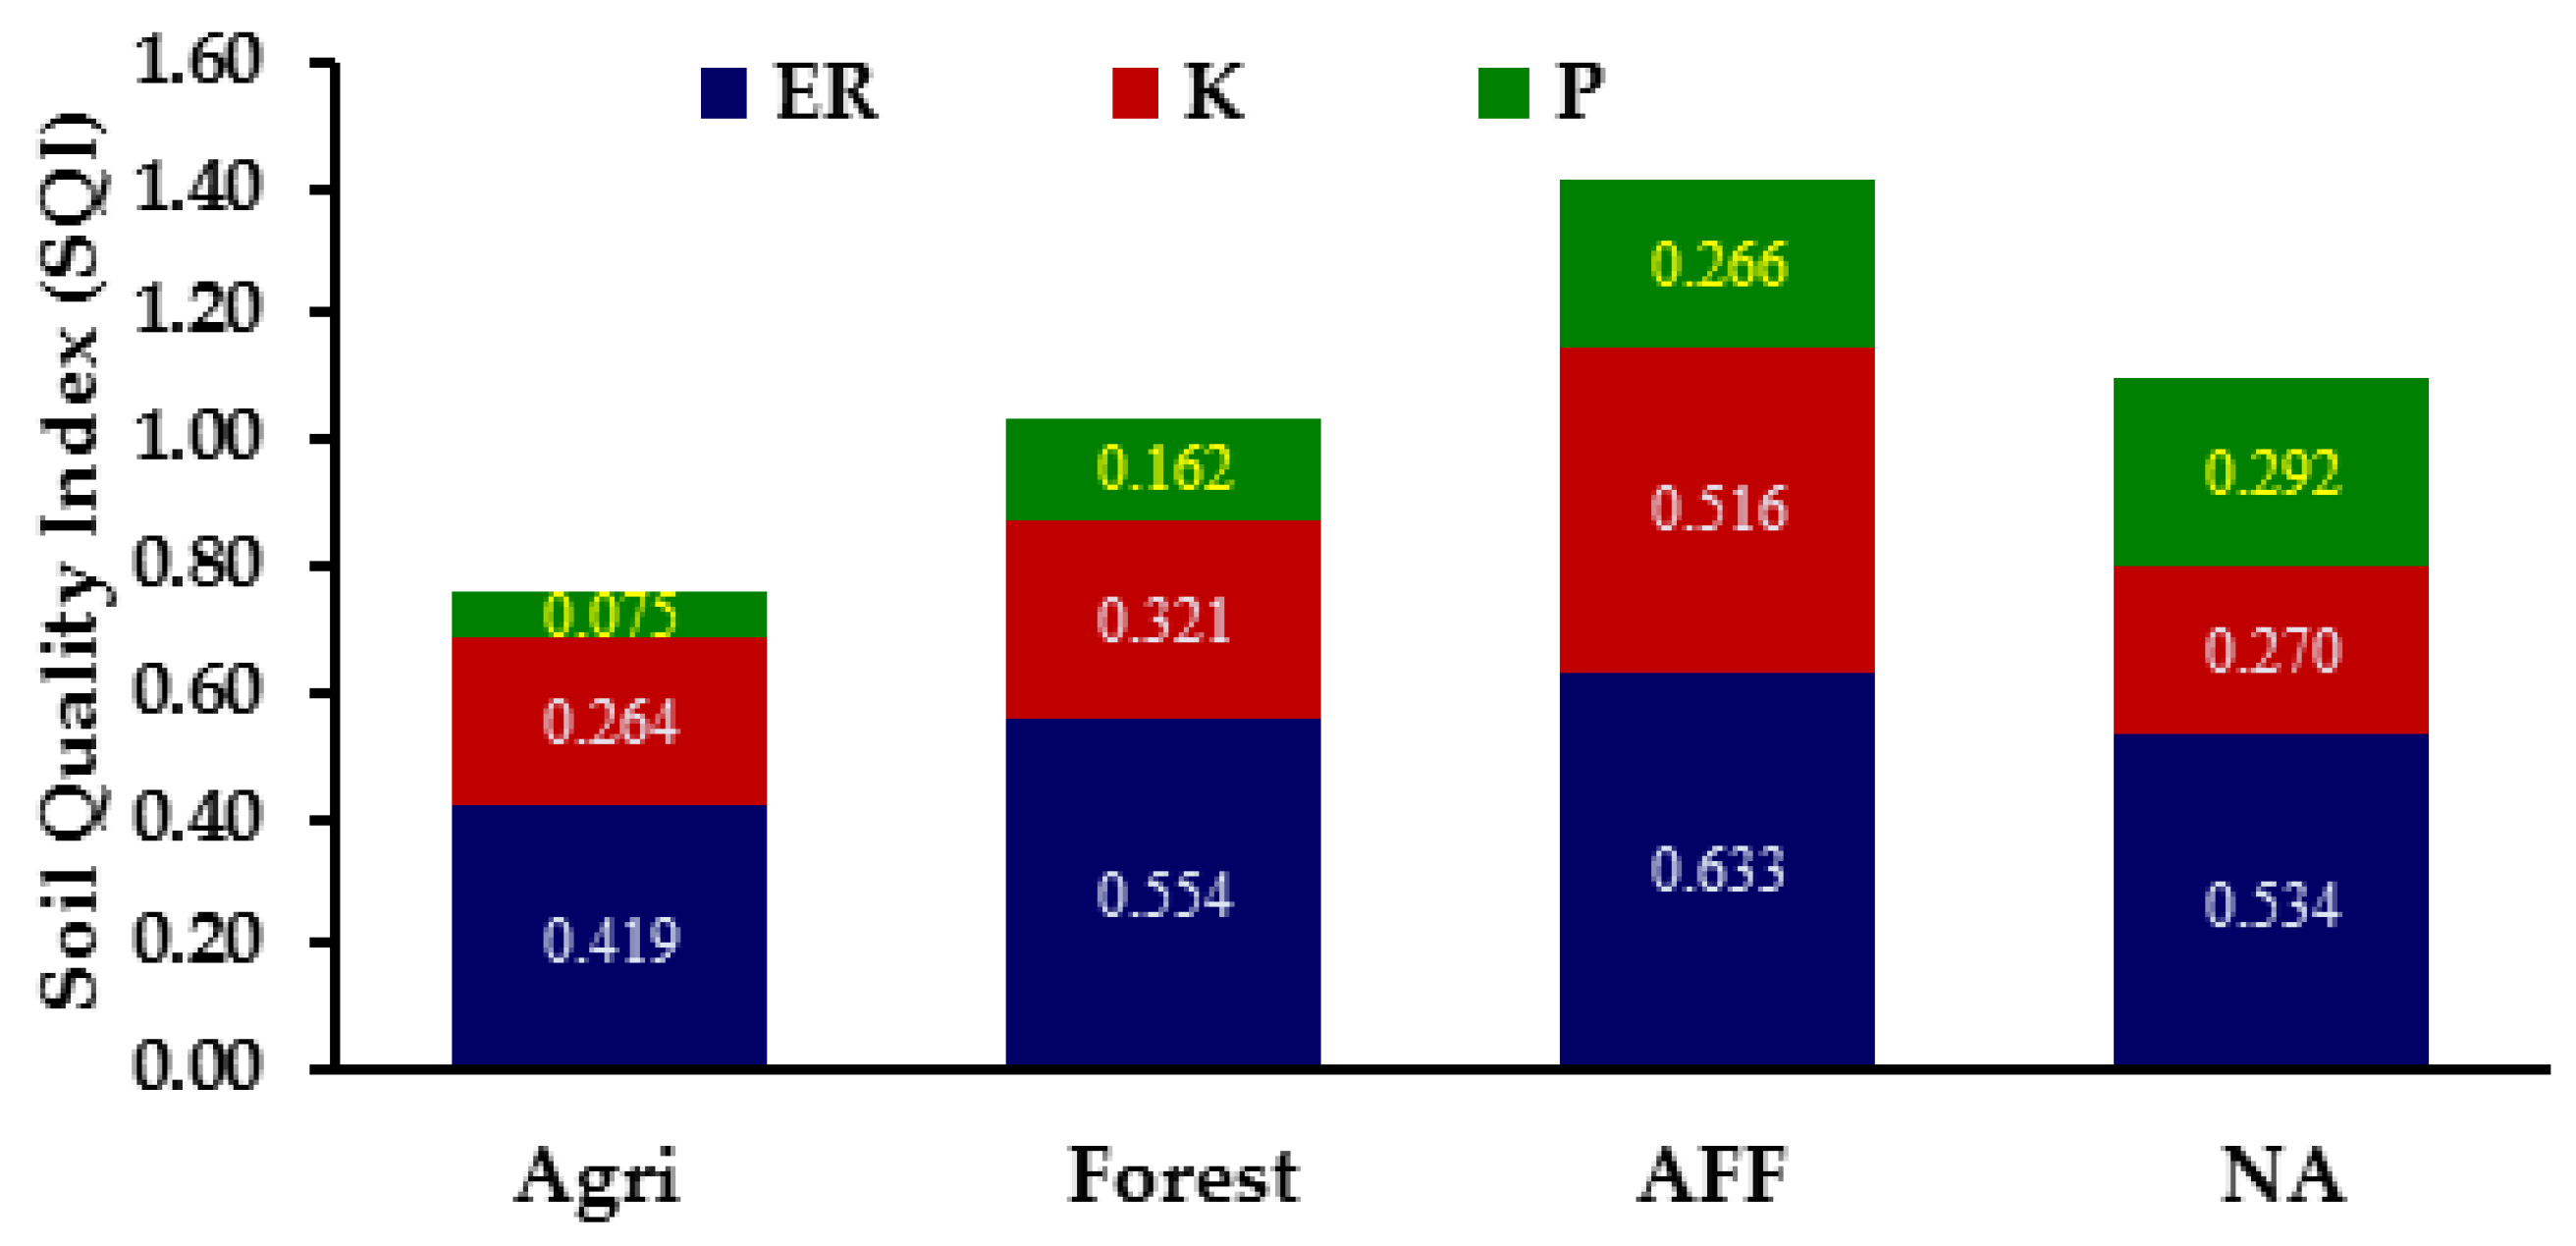
3.2. Overall State of Soils under Different Land Uses

The aggregated score (Q) representing the overall state or condition of the soils under different land uses varied from 0.359 to 0.900 (Figure 2, Table 4). Soils under agriculture use had the highest mean aggregated value (Q) of 0.515, followed by forests (0.465), non-arable lands (0.456) and afforestation (0.428). This result aligns with those reported by Bhattacharya et al. 2008 [2], where in an aggregate score was reported to range from 0.41 to 0.77 for different physiographic units of Punjab. The aggregated low scores of the afforestation and non-arable lands indicate variability in the soil’s resilience. Regarding the soil state, in terms of the weighted score of different potential indicators, the erosion ratio (Figure 2) maintained higher values in forests (0.176), followed by agriculture (0.139), afforestation (0.135) and non-arable lands (0.105). The erodibility was found to vary directly with sand and inversely with clay. Forest Soils were coarser in texture in forests and afforestation ecosystems, compared to other ecosystems. Many of the forest sites are located on steep slopes, where the finer soil particles have been selectively removed by erosion, thereby increasing the proportion of coarse particles in the soils [39]. The highest value of bulk density, 0.145, was found in non-arable areas, followed by agriculture (0.141), afforestation (0.130) and forests (0.097). The converted scores of field capacity and permanent wilting point were highest in non-arable areas (0.051 and 0.004) and lowest in forests (0.033 and 0.003).
Soil organic matter has been reported as the most powerful indicator for assessing the soil quality index in different regions of the world under varied land uses and management interventions [33,40]. The highest score of organic carbon was observed in non-arable and agricultural lands (0.064 and 0.063) and the lowest under afforestation (0.038). It was reported that deforestation and subsequent cultivation decreased organic matter by 48.8% [41]. The converted values were higher in agricultural lands for pH, N, P and K. The aggregated score indicates that the soil’s limitations under all the land uses were moderate to low, and that they can be managed with suitable conservation measures to maintain optimum productivity. This conversion of natural forests to other uses, such as cultivation, has created a severe degradation of soil quality, which may lead to a permanent degradation of land productivity [42]. Areas with these degraded soils require urgent protection and should not be cultivated. The soils under afforestation are more sensitive to soil erosion and require suitable and immediate soil conservation measures. Preferably, these areas should be brought under permanent vegetation or planted to cover crops.

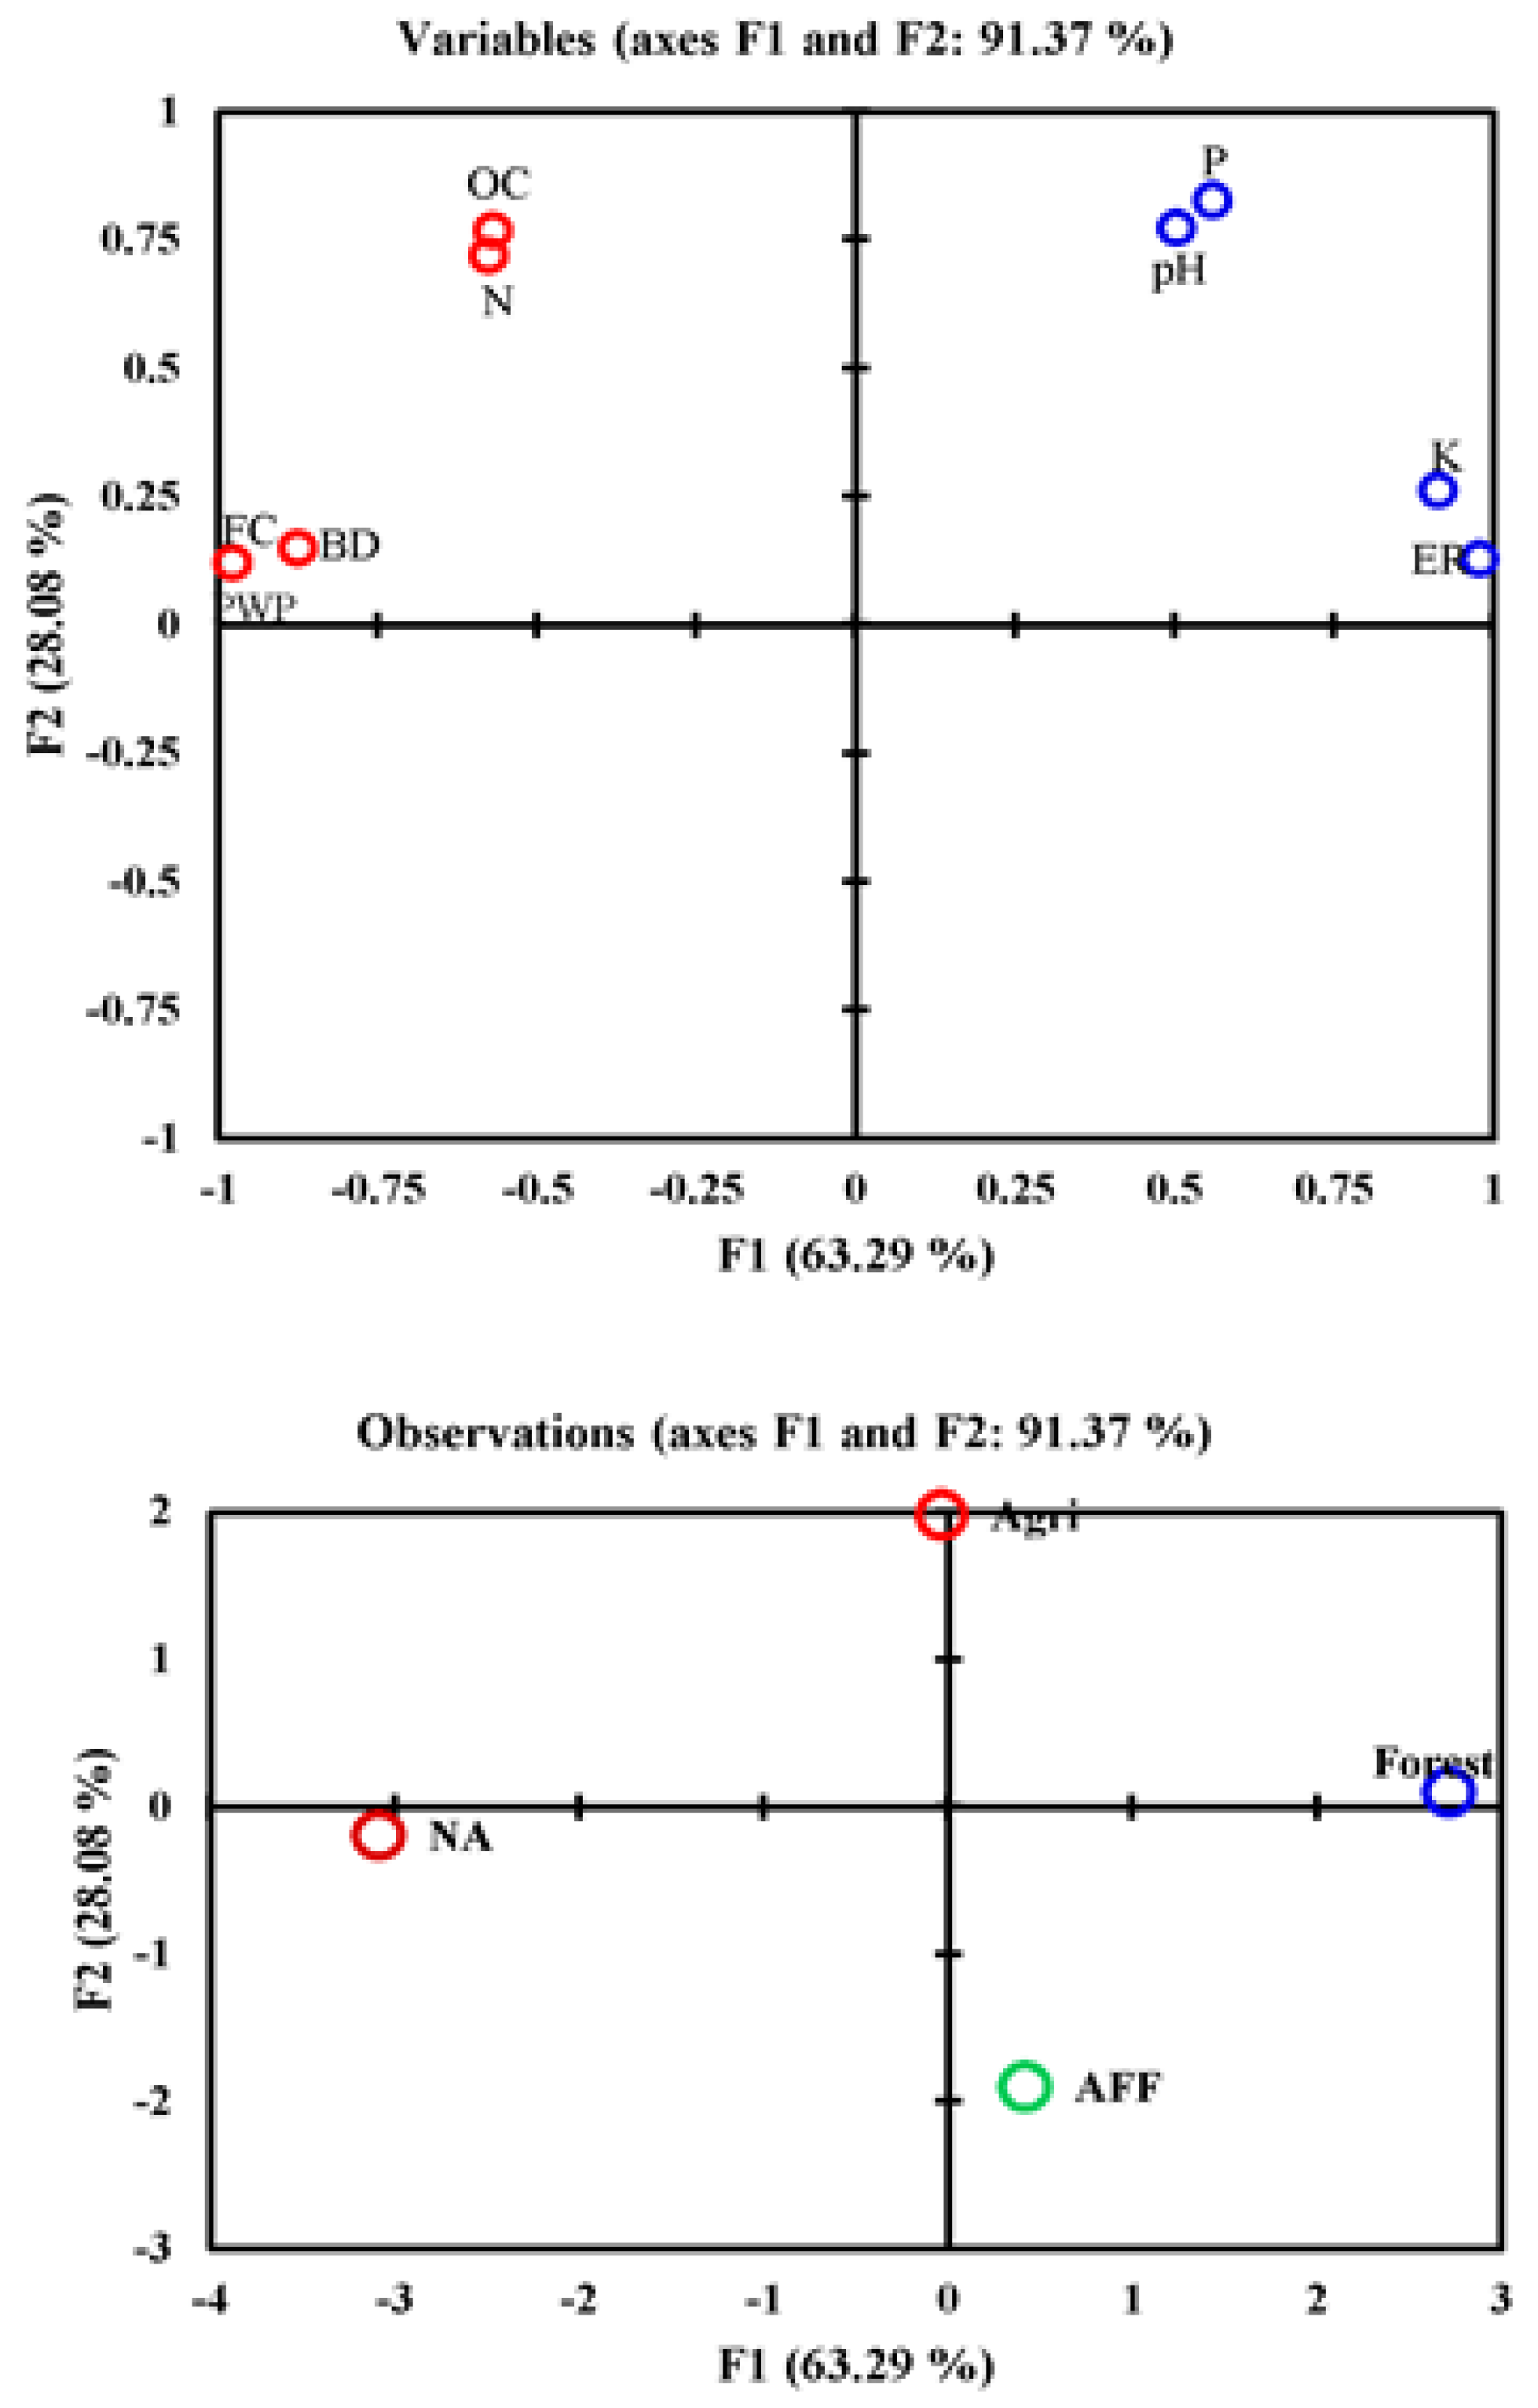
3.3. Principal Component Analysis

The amount of variability explained by PC1 was 63.3%, with an eigenvalue of 5.69, which includes the ER with the highest positive factor loading value, i.e., 0.979, and K, i.e., 0.914 (Figure 3, Table 5). The second component (PC2) explained about 28.1% of variance, with an eigenvalue of 2.53 and the highest positive loading value for P with positive factor loading, i.e., 0.828, and pH, i.e., 0.773. The weight of each PC on the basis of the percentage of variance to total variance ranged from 0.31 to 0.69. The weighted factor for the minimum data set (MDS) had the following trend: PC1 (0.9) > PC2 (0.31).
In rainfed land use systems, the PCA identified the carbon management index (28.9%), metabolic potential (9.8%) and total organic carbon (5.4%) as the three most dominant and reliable indicators of soil health [43]. Under different land uses in submontane Punjab, organic carbon contributed the mostto soil quality (28.5%), followed by the available K (19.4%), electrical conductivity (18.3%), K-factor of universal soil loss equation (USLE) (14.9%), plant available water (10.5%), and clay (8.3%) [15]. In the present study, the contribution of potential indicators like ER, P and K toward the soil quality index (SQI) was substantial. ER plays a dominant role in identifying, based on the soil’s characteristics, the areas that may require more careful land management techniques. Particle size distribution and organic matter content are the two most important indicators of erodibility. Nair (1984) [44] reported that agro-forestry, agro-horticulture and grassland systems have the potential to reduce both the runoff and erosion, and to maintain better soil organic matter, which in turn will help improve the fertility status of the soil. The available K is important for osmotic regulations. Potassium provides much of the osmotic pull that draws water into plant roots. Plants that are K-deficient are less able to withstand water deficits, mostly because of their inability to make full use of the available water. The malfunctioning of stomata due to a deficiency of this nutrient has been related to lower rates of photosynthesis and a less efficient use of water, which is a discouraging feature for moisture stress situations in drylands. Further, tillage practices are known to influence K availability by modifying other factors such as oxygen or aeration, temperature, soil moisture and the positional availability of applied K. Despite medium soil test values (<290 kg ha−1) and no application of K fertilizer in the present study, K emerged as a key indicator, contributing 34.3% to the SQI.
Among the different land use systems, PCs clearly separated the agriculture and forest samples from the afforestation and non-arable lands samples. The SQI obtained under each land use was maximum under afforestation (1.41), followed by non-arable (1.07), forestry (1.04) and agriculture (0.758), respectively (Figure 4). This showed that the contribution of ER to the SQI was highest under afforestation (0.633), followed by forestry (0.554), NA (0.534) and agriculture (0.419). For K, the maximum contribution to the SQI was observed under afforestation (0.516), followed by forestry (0.321) and non-arable lands (0.271), and the minimum was observed under agriculture (0.264). P contributed most to the SQI under non-arable lands (NA) (0.292) and least under agriculture (0.075).
The order of contribution of the selected indicators to the SQI was 53.5%, 34.3% and 19.9% for ER, P and K, respectively. This clearly indicates the importance of weighted factor attributes in the PCA. The high weight of ER indicated its highest variability in the data set. The specific contribution of the minimum data set (MDS) to the SQI is presented through radar plot (Figure 5).

4. Conclusions

The overall state of the soil based on the most sensitive soil indicators under different land uses was highest under agricultural land use, followed by forests and non-arable lands, and lowest under afforestation. Among the different land use systems, PCs clearly separated the agriculture and forest samples from the afforestation and non-arable lands samples.ER, P and K contents were the most sensitive/main indicators to affect the soil quality in the lower Shiwaliks of northwestern India. The usefulness of ER lies mainly in identifying, based on the soil’s characteristics, the areas that may require more careful land management techniques. The contribution of the selected indicators to the SQI was highest for ER, followed by P and K. These indicators may be used by researchers for the real-time monitoring of soil health and ecological processes in the future, under various land use systems in degraded agroecosystems. On the basis of the overall state of the soil, a quantitative model can be developed for assessing the site-specific soil loss tolerance limit for sustaining plant growth in the Shivaliks.

Author Contributions

Conceptualization, B.B.V.; methodology, B.B.V. and S.K.; software, B.B.V. and S.S.; formal analysis, B.B.V., S.S. and S.K.; investigation, B.B.V.; resources, B.B.V.; data curation, B.B.V. and S.S.; writing—original draft preparation, B.B.V.; writing—review and editing, B.B.V., B.M. and S.S.; visualization, B.B.V. and B.M.; supervision, B.B.V.; funding acquisition, B.M. All authors have read and agreed to the published version of the manuscript.

Funding

This research received no external funding.

Conflicts of Interest

The authors declare no conflict of interest.

References

  1. Grewal, S.S. Hoshiarpur torrents—Their extent, causes, characteristics and control measures. In Torrent Menace, Challenges and Opportunities; Sastry, G., Sharda, V.N., Guyal, G.P., Samra, J.S., Eds.; Publication of the Central Soil and Water Conservation Research and Training Institute: Dehradun, India, 1995. [Google Scholar]
  2. Bhattacharyya, P.; Bhatt, V.K.; Mandal, D. Soil loss tolerance limits for planning soil conservation measures in Shivalik–Himalayan region of India. Catena 2008, 73, 117–124. [Google Scholar] [CrossRef]
  3. Sidhu, G.S.; Walia, C.S.; Sachdev, C.B.; Rana, K.P.C.; Dhankar, R.P.; Singh, S.P.; Velayutham, M. Soil resources of N–W Shivaliks for perspective land use planning. In Fifty Years of Research on Sustainable Resource Management in Shivaliks; Mittal, S.P., Aggarwal, R.K., Samra, J.S., Eds.; CSWCRTI, Research Centre: Chandigarh, India, 2000; pp. 23–34. [Google Scholar]
  4. Sitaula, B.K.; Bajracharya, R.M.; Singh, B.R.; Solberg, B. Factors affecting organic carbon dynamics in soils of Nepal/Himalayan region—A review and analysis. Nutr. Cycl. Agroecosyst. 2004, 70, 215–229. [Google Scholar] [CrossRef]
  5. GOI. Integrated Watershed Development Project (Hills): An analytical overview and future strategies. In Proceedings of the National Workshop on Watershed Approach to Rainfed Farming: Strategies for Integrated Watershed Development for Hill Regions, Vigyan Bhawan, New Delhi, India, 1–2 May 1998. [Google Scholar]
  6. Kumar, R.; Sharma, B.D.; Sidhu, P.S. Soils of Zonal Research Station for Kandi Area, Ballowal Saunkhri, Distt. Nawanshahr; Punjab Agricultural University: Ludhiana, India, 1995; p. 49. [Google Scholar]
  7. Ezeaku, P.I. Evaluation of agro-ecological approach to soil quality assessment for sustainable land use and management system. Sci. Res. Essays 2015, 10, 501–512. [Google Scholar]
  8. Kalu, S.; Koirala, M.; Khadka, U.R.; Anup, K.C. Soil quality assessment for different land use in the Panchase area of western Nepal. Int. J. Environ. Prot. 2015, 5, 38–43. [Google Scholar] [CrossRef]
  9. Lima, A.C.R.; Hoogmoed, W.; Brussaard, L. Soil quality assessment in rice production systems: Establishing a minimum data set. J. Environ. Qual. 2008, 37, 623–630. [Google Scholar] [CrossRef] [PubMed]
  10. Singh, A.K.; Bordoloi, L.J.; Kumar, M.H.; Parmar, B. Land use impact on soil quality in eastern Himalayan region of India. Environ. Monit. Assess. 2013, 185, 314–325. [Google Scholar] [CrossRef]
  11. Wang, Z.; Chang, A.C.; Wu, L.; Crowley, D. Assessing the soil quality of longterm reclaimed wastewater-irrigated cropland. Geoderma 2003, 114, 261–278. [Google Scholar] [CrossRef]
  12. Karlen, D.L.; Mausbach, M.J.; Doran, J.W.; Cline, R.T.; Harris, R.F.; Schuman, G.E. Soil quality: A concept definition and framework for evaluation. Soil Sci. Soc. Am. J. 1997, 90, 644–650. [Google Scholar]
  13. Carter, M.R.; Gregorich, E.G.; Angers, D.A.; Donald, R.G.; Bolinder, M.A. Organic C and N storage and organic C fractions in adjacent cultivated and forested soils of eastern Canada. Soil Till. Res. 1998, 47, 253–261. [Google Scholar] [CrossRef]
  14. Singh, M.J.; Khera, K.L.; Priyabrata, S. Selection of soil physical quality indicators in relation to soil erodibility. Arch. Agron. Soil Sci. 2012, 58, 657–672. [Google Scholar] [CrossRef]
  15. Chandel, S.; Hadda, M.S.; Mahal, A.K. Soil quality assessment through minimum data set under different land uses of submontane Punjab. Commun. Soil Sci. Plant Anal. 2018. [Google Scholar] [CrossRef]
  16. Jassal, H.S.; Kumar, R.; Sharma, B.D. Description of benchmark soils. In Annual Progress Report of Research Scheme—Elemental Association in Relation to Mineralogical Assemblage of the Benchmark Soils of Punjab; Punjab Agricultural University: Ludhiana, India, 2008. [Google Scholar]
  17. Soil Survey Staff. Keys to Soil Taxonomy, 12th ed.; USDA-Natural Resources Conservation Service: Washington, DC, USA, 2014.
  18. Walkley, A.; Black, C.A. An examination of the digestion method for determining soil organic matter and a proposed modification of the chromic acid titration method. Soil Sci. 1934, 37, 29–38. [Google Scholar] [CrossRef]
  19. Olsen, S.R.; Cole, C.V.; Waternabe, F.S.; Dean, L.A. Estimation of available phosphorous in soil by extraction with sodium bicarbonate. USDA Circ. 1954, 939, 919. [Google Scholar]
  20. Knudsen, D.; Peterson, G.A.; Pratt, P.F. Lithium, sodium and potassium. In Methods of Soil Analysis Part 2. Chemical and Microbiological Properties; Page, A.L., Miller, R.M., Keeney, D.R., Eds.; American Society of Agronomy, Crop Science Society of America: Madison WI, USA, 1982; pp. 225–246. [Google Scholar]
  21. Jalota, S.K.; Khera, R.; Ghuman, B.S. Methods in Soil Physics; Narosa Publishing House: New Delhi, India, 1998. [Google Scholar]
  22. Richards, L.A. Physical condition of water in soil. In Methods of Soil Analysis—Part 1; Black, C.A., Ed.; American Society of Agronomy, Crop Science Society of America: Madison WI, USA, 1965; pp. 128–151. [Google Scholar]
  23. Middleton, H.E. Properties which Influence Soil Erosion; Technical Bulletin No. 178; USDA: Washington, DC, USA, 1930.
  24. Wymore, A.W. Model Based Systems Engineering: An Introduction to the Mathematical Theory of Discrete Systems and to the Tricotyledon Theory of System Design; CRC Press: Raton, FL, USA, 1993. [Google Scholar]
  25. Lakeria, B.L.; Biswas, H.; Mandal, D. Soil loss tolerance values for different physiographic regions of Central India. Soil Use Manag. 2008, 24, 192–198. [Google Scholar] [CrossRef]
  26. Wold, S.; Esbensen, K.; Geladi, P. Principal component analysis. Chemom. Intell. Lab. Syst. 1987, 2, 37–52. [Google Scholar] [CrossRef]
  27. Andrews, S.; Karlen, D.; Mitchell, J. A comparison of soil quality indexing methods for vegetable production systems in Northern California. Agric. Ecosyst. Environ. 2002, 90, 25–45. [Google Scholar] [CrossRef]
  28. Cheema, H.S.; Singh, B. CPCS1—A Computer Program Package for the Analysis of Commonly Used Experimental Designs; Punjab Agricultural University: Ludhiana, India, 1990. [Google Scholar]
  29. Sharma, R.R.; Biswas, N.R.D. Erodibility of hill soils of Sutlej catchment area in Himachal Pradesh. Indian J. Agric. Sci. 1972, 42, 161–169. [Google Scholar]
  30. Dabral, P.P.; Murry, R.L.; Lollen, P. Erodibility status under different land uses in Dikrong river basin of Arunachal Pradesh. Indian J. Soil Conserv. 2001, 29, 280–282. [Google Scholar]
  31. Singh, M.J.; Khera, K.L. Soil erodibility indices under different land uses in lower Shiwaliks. Trop. Ecol. 2008, 49, 113–119. [Google Scholar]
  32. Singh, R.; Singh, K.D.; Parandiyal, A.K. Characterisation and erodibility of soils under different land uses for their management and sustained production. Indian J. Soil Conserv. 2006, 34, 226–228. [Google Scholar]
  33. Ajami, M.; Khormali, F.; Ayoubi, S.; Omrani, R.A. Changes in soil quality attributes by conversion of land use on a loess hillslope in Golestan province, Iran. In Proceedings of the 18th International Soil Meeting (ISM) on Soil Sustaining Life on Earth, Maintaining Soil and Technology, Şanlıurfa, Turkey, 22–26 May 2006; pp. 501–504. [Google Scholar]
  34. Ray, R.; Mukhopadhyay, K.; Biswas, P. Soil aggregation and its relationship with physic-chemical properties under various land use systems. Indian J. Soil Conserv. 2006, 34, 28–32. [Google Scholar]
  35. Ashura Ally, D. Soil Aggregation and Organic Carbon Fractions under Different Land Uses in Submontane Punjab. Master’s Thesis, Punjab Agricultural University, Ludhiana, India, 2015. [Google Scholar]
  36. Sharma, P.D.; Qahar, A.Q. Characterization of some outer Himalayan protected and eroded forest soils. J. Indian Soc. Soil Sci. 1989, 37, 113–120. [Google Scholar]
  37. Gupta, R.D.; Arora, S.; Gupta, G.D.; Sumberia, N.M. Soil physical variability in relation to soil erodibility under different land uses in foothills of Siwaliks in N-W India. Trop. Ecol. 2010, 51, 183–197. [Google Scholar]
  38. Vashisht, B.B.; Sidhu, B.S.; Singh, S.; Biwalkar, N. Effect of different mulches on soil erosion and carry-over of residual soil moisture for sowing of Rabi crop in maize-wheat cropping sequence in rainfed Shivaliks of Punjab. Indian J. Soil Conserv. 2013, 41, 136–140. [Google Scholar]
  39. Wang, X.; Liu, M.; Liu, S.; Liu, G. Fractal characteristics of soils under different land-use pattern in the arid and semiarid region of the Tibetan Platue, China. Geoderma 2006, 134, 56–61. [Google Scholar] [CrossRef]
  40. Shukla, M.K.; Lal, R.; Ebinger, M. Determining soil quality indicators by factor analysis. Soil Till. Res. 2006, 87, 194–204. [Google Scholar] [CrossRef]
  41. Evrendilek, F.; Çelik, I.; Kilic, S. Changes in soil organic carbon and other physical soil properties along adjacent mediterranean forest, grassland, and cropland ecosystems in Turkey. J. Arid Environ. 2004, 59, 743–752. [Google Scholar] [CrossRef]
  42. Islam, K.R.; Weil, R.R. Soil quality indicator properties in mid-atlantic soils as influenced by conservation management. J. Soil Water Conserv. 2000, 55, 2269–2284. [Google Scholar]
  43. Maini, A.; Sharma, V.; Sharma, S. Assessment of soil carbon and biochemical indicators of soil quality under rainfed land use systems in North Eastern region of Punjab, India. Carbon Manag. 2020. [CrossRef]
  44. Nair, P.K.R. Role of trees in soil productivity and conservation. In Soil Productivity Aspects of Agroforestry; The International Council for Research in Agro-Forestry: Nairobi, Kenya, 1984; p. 85. [Google Scholar]
Figure 1. Location of the study area.
Sustainability 12 03490 g001
Figure 2. Weighted score-State of soil in different land uses. Notes: ER—Erosion ratio, BD—Bulk density, FC—Field capacity, PWP—Permanent wilting point, pH—Soil reaction, OC—Organic carbon, N—Nitrogen, P—Phosphorus, K—Potassium; Agri—Agriculture, Forest—Forest, AFF—Afforestation, NA—Non arable.
Sustainability 12 03490 g002
Figure 3. Principal component analysis (PCA) scoring plots (A) and loading plots (B) under different land use systems. Notes: The percent variance explained by each component is given in parenthesis. ER—Erosion ratio, BD—Bulk density, FC—Field capacity, PWP—Permanent wilting point, pH—Soil reaction, OC—Organic carbon, N—Nitrogen, P—Phosphorus, K—Potassium; Agri—Agriculture, Forest—Forest, AFF—Afforestation, NA—Non-arable.
Sustainability 12 03490 g003
Figure 4. Average effect of land use system on soil quality index and the individual contribution of each of the key indicators. Notes: ER—Erosion ratio, P—Phosphorus, K—Potassium; Agri—Agriculture, Forest—Forest, AFF—Afforestation, NA—Non-arable.
Sustainability 12 03490 g004
Figure 5. Radar graph depicting the percent contribution of selected key indicators to soil quality as influenced by land use systems. Notes: ER—Erosion ratio, P—Phosphorus, K—Potassium; Agri—Agriculture, Forest—Forest, AFF—Afforestation, NA—Non-arable.
Sustainability 12 03490 g005
Table 1. Physico-chemical characteristics of the benchmark soil of the study area.
HorizonDepth (cm)Sand (%)Silt
(%)
Clay
(%)
pH
(1:2)
EC
(dS m−1)
OC
(%)
CEC
(cmol kg−1)
Ap0–2869.122.98.08.150.160.355.28
C128–4971.623.05.48.130.130.096.13
C249–6566.128.15.88.050.150.234.93
C365–8143.551.15.48.250.160.185.66
C481–9983.113.13.88.350.120.074.15
C599–12387.19.33.68.200.110.026.40
C6123+72.216.411.48.020.130.905.39
Wt. mean 71.522.26.38.160.140.275.47
Table 2. Potential indicators (soil attributes) and their ranking.
Soil Attribute/Rank12345
ER<10
(1)
10–30
(0.8)
30–50
(0.5)
50–70
(0.3)
>70
0.2
BD (Mg m−3)<1.40
(1)
1.40–1.48
(0.8)
1.49–1.55
(0.5)
1.56–1.63
(0.3)
>1.63
(0.2)
C (%)<5.0
(0.2)
5.0–10.0
(0.3)
10.0–15.0
(0.5)
15.0–20.0
(0.8)
>20.0
(1)
PWP (%)<1.5
(0.2)
1.5–3.0
(0.3)
3.0–4.5
(0.5)
4.5–6.0
(0.8)
>6.0
(1)
OC (%)<0.15
(0.2)
0.15–0.3
(0.3)
0.3–0.45
(0.5)
0.45–6
(0.8)
>6
(1)
pH<5.0
>9.0
(0.2)
5.0–5.5
8–8.5
(0.3)
5.5–6.0
8.5–9.0
(0.5)
6.0–6.5
7.5–8.0
(0.8)
6.5–7.5
(1)
N (kg ha−1)<50
(0.2)
50–100
(0.3)
100–150
(0.5)
150–200
(0.8)
>200
(1)
P (kg ha−1)<2.5
(0.2)
2.5–5.0
(0.3)
5.0–10.0
(0.5)
10.0–25.0
(0.8)
>25.0
(1)
K (kg ha−1)<60
(0.2)
60–100
(0.3)
100–140
(0.5)
140–280
(0.8)
>280
(1)
Figures in parenthesis are Rankings, which are used for the transformation of soil properties forthe0–1 scale. ER—Erosion ratio, BD—Bulk density, FC—Field capacity, PWP—Permanent wilting point, pH—Soil reaction, OC—Organic carbon, N—Nitrogen, P—Phosphorus, K—Potassium.
Table 3. Potential indicators of different soil functions relevant to the overall state of the soil.
Soil FunctionPotential IndicatorWeights
Resistance to physical degradation/erodibility indexER0.30
Water transport and retentionBD0.20
FC0.08
PWP0.08
Resistance to biochemical weatheringOC0.15
Plant growthpH0.05
N0.05
P0.05
K0.05
ER—Erosion ratio, BD—Bulk density, FC—Field capacity, PWP—Permanent wilting point, pH—Soil reaction, OC—Organic carbon, N—Nitrogen, P—Phosphorus, K—Potassium.
Table 4. Soil characteristics under different land uses in the Shivaliks of Punjab.
Soil ParameterAgriculture (n = 40)Forest
(n = 10)
Afforestation (n = 5)Non–Arable Lands (n = 5)LSD (0.05)
ER24.6–86.7 (43.7±13.8)24.5–43.0 (34.5±4.75)41.0–51.4 (45.1±3.9)33.8–62.6 (50.9±12.4)5.30
BD (Mg m−3)1.35–1.58 (1.47±0.06)1.40–1.59 (1.53±0.04)1.37–1.58 (1.49±0.08)1.41–1.51 (1.45±0.05)0.05
FC (%)7.2–20.8 (13.81±3.9)7.0–18.8 (10.47±4.0)8.8–18.6 (13.4±4.9)8.6–18.4 (15.43±4.6)1.60
PWP (%)2.3–6.9
(4.8±1.5)
2.0–5.9
(3.2±1.2)
2.1–6.3
(3.9±1.9)
2.6–7.0
(5.6±2.0)
0.90
OC (%)0.03–0.75 (0.29±0.16)0.03–0.45 (0.20±0.14)0.12–0.33 (0.17±0.04)0.12–0.72 (0.30±0.29)0.60
pH6.9–9.4
(8.4±0.8)
6.5–9.2
(7.9±0.9)
8.2–9.3
(8.6±0.3)
8.6–9.4
(9.0±0.3)
0.49
N (kg ha−1)50.2–225.8 (165.4±36.9)62.7–174.6 (139.6±29.2)75.3–175.6 (103.5±12.0)112.9–263.4 (185.0±66.7)18.80
P (kg ha−1)3.0–41.8 (10.1±11.1)3–12.9
(6.7±3.4)
2.3–4.6
(3.2±0.4)
3.8–4.6
(4.6±0.2)
2.10
K (kg ha−1)42–300 (114.6±61.3)60–264 (123.0±67.4)75–189 (108.8±34.9)36–96
(74.3±17.6)
34.10
Mean weighted score0.394–0.900 (0.515±0.121)0.384–0.635 (0.465±0.088)0.359–.0490 (0.428±0.066)0.399–0.555 (0.456±0.071)
Figures in parenthesis are mean ± standard deviation. ER—Erosion ratio, BD—Bulk density, FC—Field capacity, PWP—Permanent wilting point, pH—Soil reaction, OC—Organic carbon, N—Nitrogen, P—Phosphorus, K—Potassium.
Table 5. Correlation matrix (Pearson (n–1)).
Variables *ERBDFCPWPpHOCNPK
ER1
BD−0.9111
FC−0.9690.9521
PWP−0.9690.9521.0001
pH0.530−0.146−0.333−0.3331
OC−0.4120.4800.6010.6010.1951
N−0.4090.4330.5850.5850.1160.9941
P0.648−0.347−0.441−0.4410.9370.3050.2561
K0.879−0.618−0.810−0.8100.782−0.409−0.4580.7421
Values in bold are significant at * p< 0.05. * ER—Erosion ratio, BD—Bulk density, FC—Field capacity, PWP—Permanent wilting point, pH—Soil reaction, OC—Organic carbon, N—Nitrogen, P—Phosphorus, K—Potassium.

