Optimization of Design Parameters for Office Buildings with Climatic Adaptability Based on Energy Demand and Thermal Comfort


Faculty of Environmental Engineering, The University of Kitakyushu, Kitakyushu 808-0135, Japan
*
Author to whom correspondence should be addressed.
Sustainability 2020, 12(9), 3540; https://0-doi-org.brum.beds.ac.uk/10.3390/su12093540
Submission received: 28 March 2020
/
Revised: 22 April 2020
/
Accepted: 22 April 2020
/
Published: 26 April 2020
(This article belongs to the Collection Urban Planning and Built Environment)
Abstract
:According to a Chinese building energy demand report of 2016, building consumption is accelerating at a spectacular rate, especially for urban public buildings. In this study, various design parameters that meet the principle of climate adaptation are proposed to achieve the unity of energy utilization and indoor thermal comfort level. According to the local energy conservation codes, five typical benchmark geometric models were established in Open Studio (Sketch-Up plug-in) for sites representative of various climates, meanwhile, adopting the engine of Energy Plus (EP-Launch) to calculate the instrument definition file (IDF), respectively, for assessing the coupling relationship between energy consumption as well as thermal comfort. Results implied that based on the time proportion (8760 h) that met the level 1 comfort range, total energy reductions of different Chinese climate regions were different. Among them, the severe cold zone (SCZ—Changchun) and hot summer and cold winter zone (HSCW—Shanghai) appeared to have the greatest energy saving potential with 18–24% and 16–19%, respectively, while the cold zone (CZ—Beijing) and mild zone (MZ—Kunming) approximately equaled 15% and 12–15%, and the saving space of the hot summer and warm winter zone (HSWW—Haikou) appeared relatively low, only around 5–7%. Although the simulation results may be limited by the number of parameter settings, the main ones are under consideration seriously, which is further indication that there is still much room for appropriate improvements in the local public building energy efficiency codes.
1. Introduction
1.1. Background
Demand for energy is increasing at a spectacular rate with the acceleration of urbanization and the innovation of technological levels [1,2,3,4]. In 2014, the primary energy demand for buildings all around China was approximately 814 million tons of coal equivalents (Mtce), which equals 19.12% of total energy demand. In addition, energy utilization for public buildings occupies a larger part (nearly 40%) than urban and rural residential buildings among the total energy consumption [5]. Furthermore, the requirement value had also increased from 118 Mtce in the year of 2001 to 312 Mtce in 2014 for public buildings, which is shown in Figure 1, and is projected to continue growing. Above all, the energy efficiency is deemed as the crucial factor of reaching the carbon emission target in 2030.
1.2. Research Content
For the sake of evaluating the standard of energy utilization, a better view of compromise between upfront investment costs, energy demand, and indoor thermal comfort should be paid enough attention [6]. Building energy demand is influenced by numerous elements, which can be saved to a great extent if the passive technology is considered at the early design stage, due to the fact that climate conditions vary from the north to the south in China and the climatic adaption makes design parameters more diverse and complex. In addition, building’s end-use loads are determined by complex indoor situations, such as the activity level of people, lighting, electrical equipment, and air infiltration rate [7], and it is also influenced by the outer environment, including solar radiation, air temperature, relative humidity, and wind of heating exchange with the facades [8,9,10], therefore, the optimization of building envelope (one of the parameters as an example) plays a significant role in energy conservation—if the envelope parameters are properly chosen at the preliminary design stage, the building energy efficiency can be effectively improved [11]. Thus, the change of building energy demand (heating/cooling/total) under the influence of different parameters has been studied in this paper.
On the basis of building energy conservation, satisfying the thermal comfort of the human body to a greatest extent is another significant aspect, because it affects occupants’ satisfaction, health, and productivity [12,13]. People spend the majority of their time (about 80%) indoors, it was observed that the working efficiency increased by 15% when they are satisfied with the indoor environment [14]. This paper focused mainly on the usage period of office buildings. The predicted mean vote and predicted percentage dissatisfied were selected as the evaluation metrics of thermal condition, and the coupling analysis of energy demand and thermal comfort was performed to explore the optimal passive strategies for different climate regions in China.
1.3. Scientific Originality
The originality of this research lies in the fact that coupling quantifies the relationship between energy utilization and thermal comfort for urban public buildings that are located in the different Chinese climatic latitudes, and the establishment of multiple benchmark cases with local climatic adaptions breaks the limitation of traditional analyses (which only focus on one model) and also takes the year-round climate change into consideration, which can be deemed as a new research approach for searching the optimization results of this building type. The application of this method can directly calculate the specific energy saving parameters and guarantee the indoor thermal comfort condition at the proper range. Therefore, the simulation results based on the benchmark cases of public buildings in this study could fill the gap of this kind of research to some extent.
1.4. Target of This Research
The target of this research was to explore the effect of different design parameters on building energy demand (heating/cooling/total) as well as the indoor thermal environment, based on the benchmark cases of urban office buildings, and by comparing the results the optimal selection of parameter scheme and energy saving potential are proposed for each climate zone. The findings of this study may provide references on the concept of energy saving for newly built urban public buildings, as well as making a proposal for improving the existing local energy conservation codes.
2. Methodology
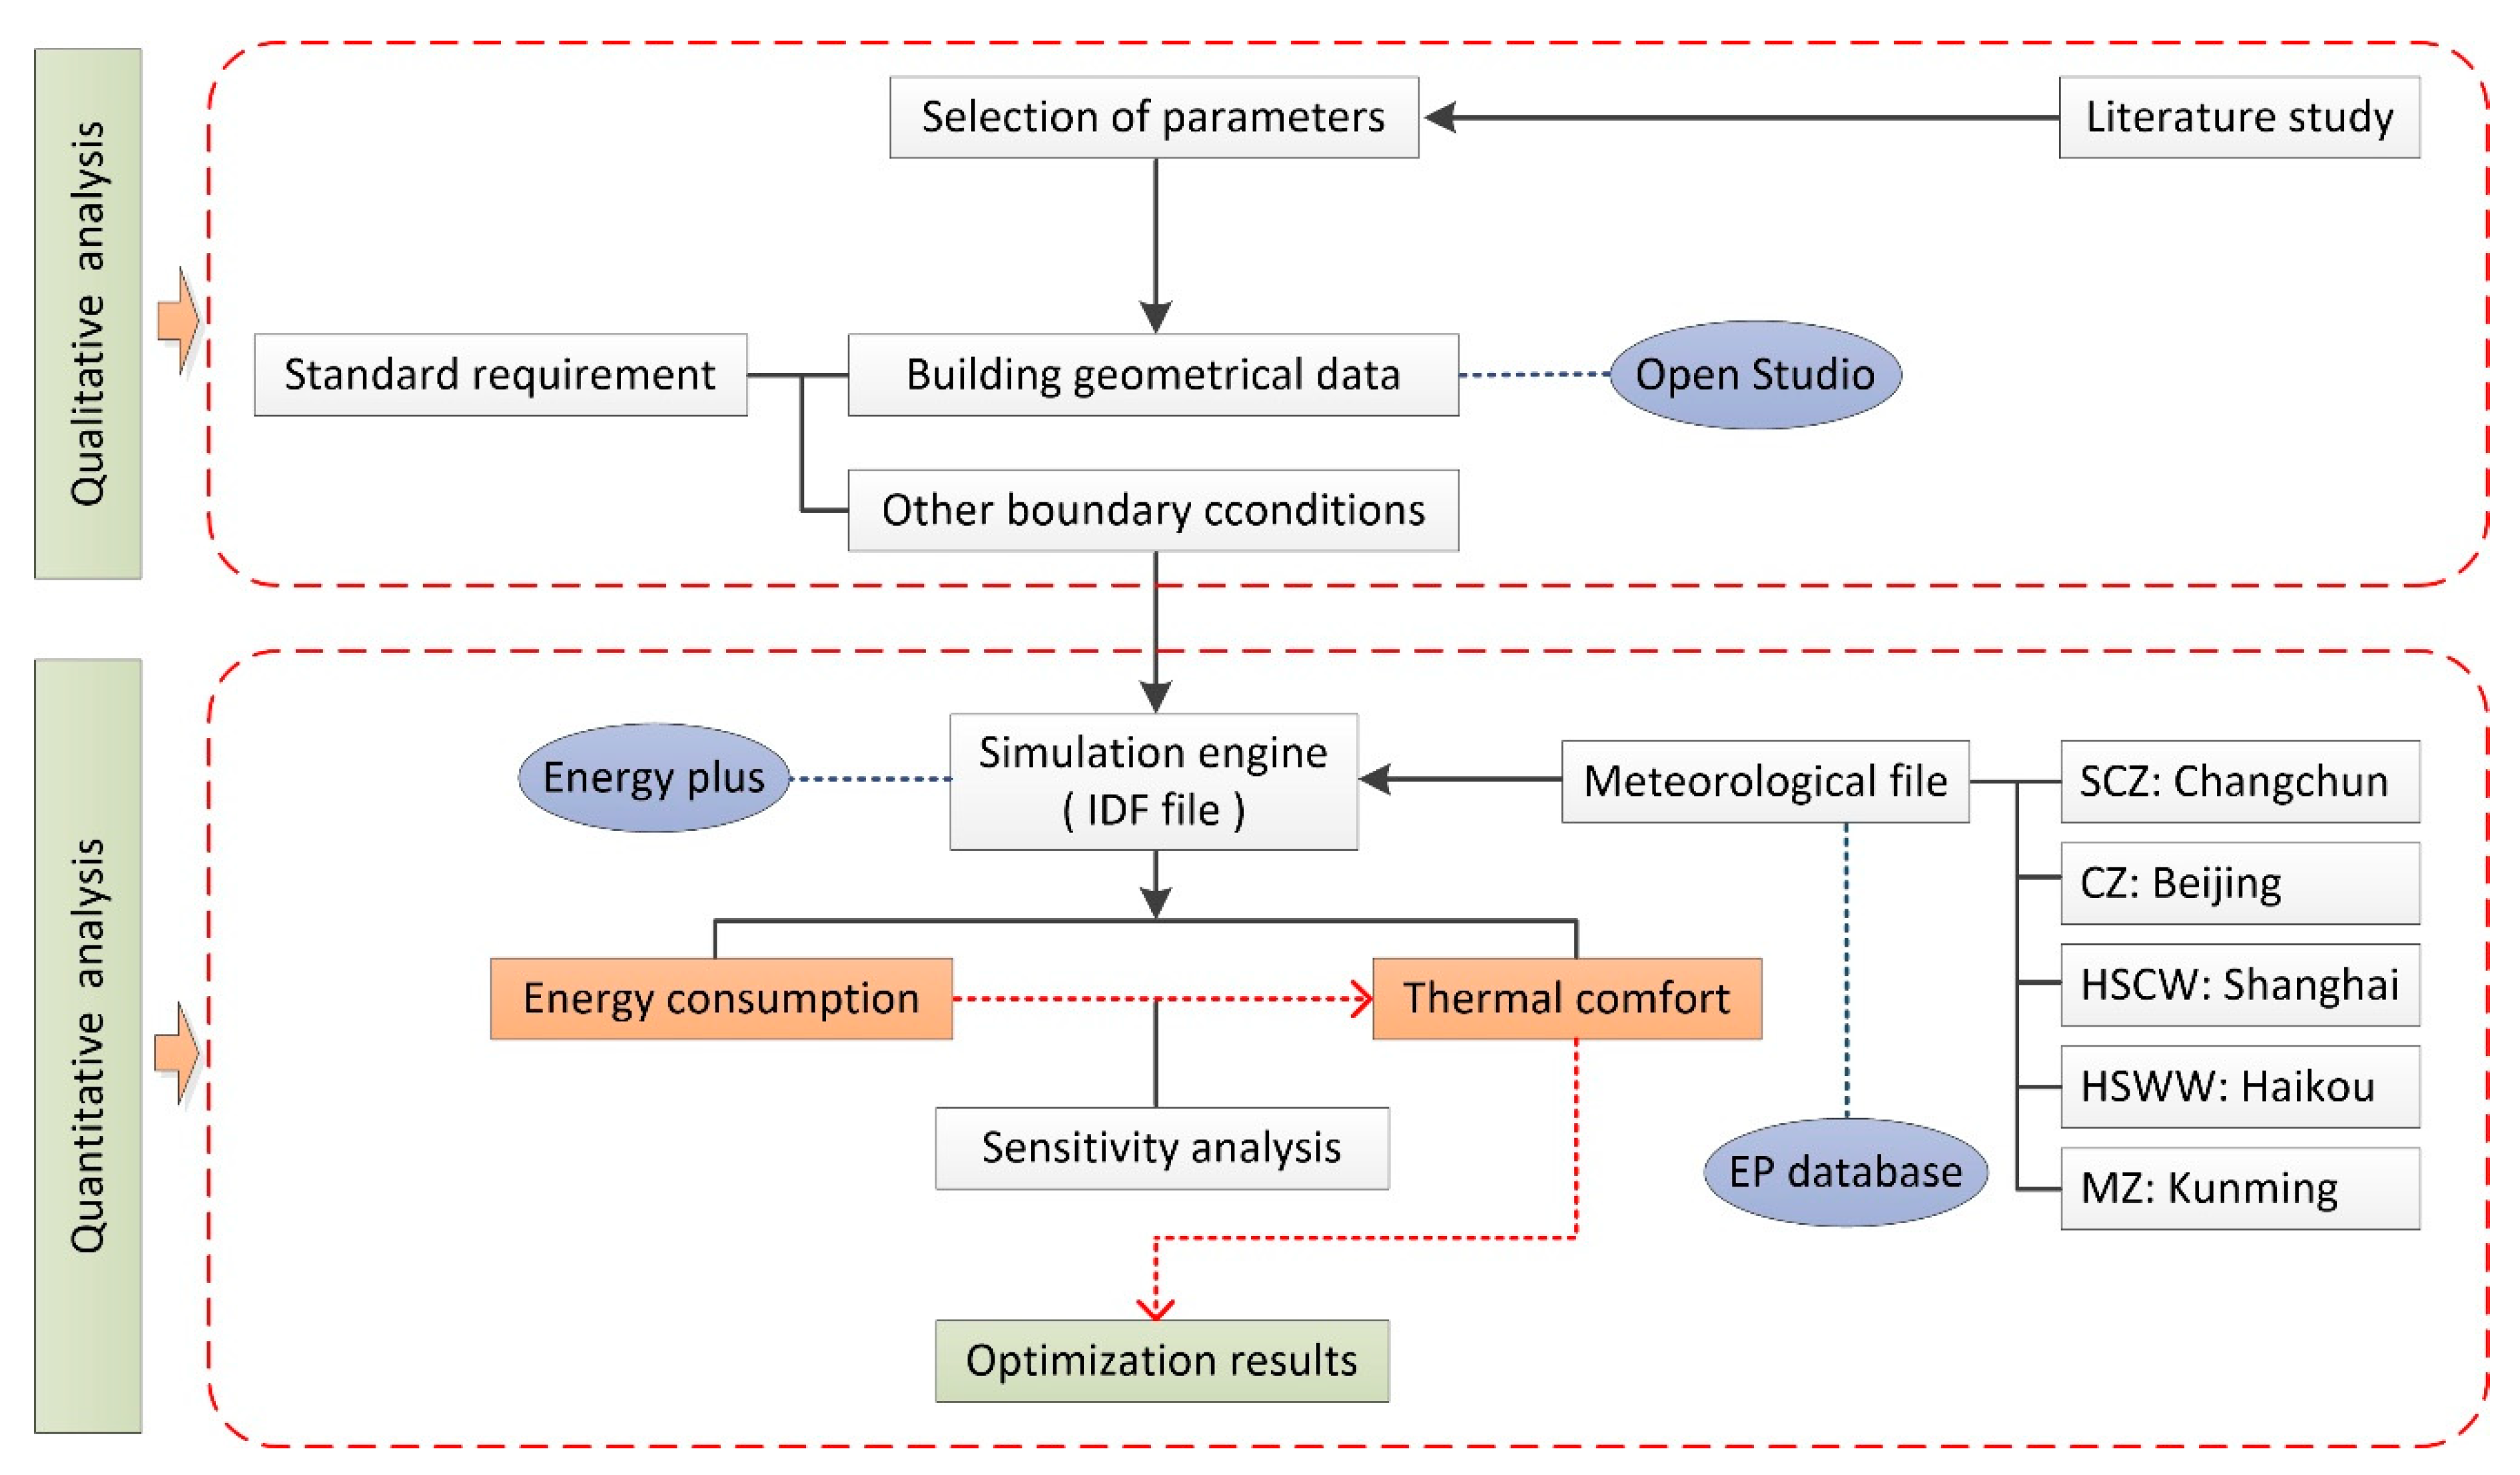
Due to several essential design parameters that should be taken into account seriously at the preliminary design stage, this paper adopted the combination of qualitative and quantitative analyses with numerous numerical simulations carried out, to search for the best design strategies under the energy and thermal comfort requirement. The specific study flow is shown in Figure 2.
2.1. Climate Condition
2.1.1. Climate Classification
Climate plays a significant role in building energy demand and climate division is widely considered to be a reasonable approach to describe the regional climate characteristics [15,16]. China is a vast geographical area from south to north with different climate conditions. On the basis of the Chinese national standard, the climate regions were developed according to the meteorological data measured from 1951 to 1985, which mainly considered heating exchange and the corresponding thermal insulations. Generally speaking, it includes the five types of climate regions below: severe cold zone (SCZ), cold zone (CZ), hot summer and cold winter zone (HSCW), hot summer and warm winter zone (HSWW), and mild zone (MZ), shown in Figure 3, the regionalization indicators of which are based on the mean air temperature in the coldest (tmin·m)/hottest (tmax·m) month throughout the year and the number of days that the mean air temperature is below 5 °C (d ≤ 5) or above 25 °C (d ≥ 25) [17,18]. Although the main climate zones are further divided into 11 subzones, this study only focused on the five typical climate zones above.
2.1.2. Chosen Location
In carrying out the parametric simulation, five typical representative sites in China were chosen, respectively: SCZ—Changchun, CZ—Beijing, HSCW—Shanghai, HSWW—Haikou, and MZ—Kunming, see Figure 3, and the geographical data are shown in Table 1. The principle of city selection mainly lay upon three points as follows:
- (1)
- Climate data should be measured in the database of Energy Plus;
- (2)
- The cities must have typical weather features of each climate zone;
- (3)
- Weather condition should have a reasonable geographical distribution.
2.2. Pre-Evaluation of Various Design Parameters
A truly energy-efficient building collects and stores energy by itself and forms a self-circulation system with the surrounding environment, so as to narrow down the energy demand of heating, cooling, lighting, and air-conditioning [19,20,21]. Through the classification of existing research, which can be divided into two major categories: one is the influence of single/multiple design parameters on building energy consumption (single-objective optimization) and the other is the combined analysis of single/multiple parameters on energy saving potential and thermal comfort (multi-objective optimization).
For the first aspects, Peng et al. [22] researched the influence of window to wall ratio (WWR) with sunshades in low latitude regions of China on energy demand (considering day-lighting requirements), from which they found that comprehensive sunshades had better results than horizontal and vertical ones, and the largest WWR could be designed as 0.55 for south–north buildings and 0.7 for west–east buildings with 1.8 m comprehensive sunshades. A similar study was conducted by Hui Shen et al. [23], which explored the impact of interior roller shades with various glazing properties on energy requirements, as well as pointed out the optimal design strategies for each orientation and location. Also, when the envelope optimization of nearly zero energy demand buildings in north China was analyzed [24], the outcome suggested that the heat transfer coefficient of opaque and transparent envelopes are 0.096 W/(m2 K) and 0.780 W/(m2 K), and the solar heat gain coefficient (SHGC) was at least set as 0.474. It is not difficult to find that even the changing of a single parameter will change the energy utilization to some extent. Furthermore, the energy saving potential can also be achieved under the influence of multiple parameters in different climate regions, for example, Susorova et al. [25] investigated the influence of geometry factors on the external transparent envelope (WWR, window orientation, shape factors) energy performance in office buildings to summarize the saving potential in six climate regions of US, which included that the highest energy savings with window geometry (totally 14% overall savings) can be reached in hot climate zones while energy savings in cold and temperate climate zones are marginal. For the different European climate zones, an analysis of optimal WWR and orientation in office buildings and the implications on total energy saving level was conducted in [26], the results indicated that optimal WWR values considering orientation can only be found in a narrow range (0.30 < WWR < 0.45), while, the south-oriented facades in severe cold and severe warm climate zones require WWR values out of this range, and the total energy consumption may decrease by 5–25% when adopting optimal values. Mosha et al. [27] also searched for the energy demand with vital design parameters (WWR, SHGC, shape factors, etc.) in different Chinese climate regions and the results showed that the improvement of the sensitive design parameters for each climate region resulted in the maximum total energy demand reductions below: 75 kWh/(m2·a) in SCZ, 40 kWh/(m2·a) in CZ and HSCW, 50 kWh/(m2·a) in HSWW, and 35 kWh/(m2·a) in MZ. Although these studies were for residential buildings, the method is still adaptable to other types of buildings.
For other aspects, the multiobjective analysis of energy consumption and comfort adaption has been carried out by multiple researchers in recent years, and since heating, ventilation, and air conditioning (HVAC) systems account for most of the building’s energy consumption, the parameters of these are extracted for evaluating the thermal comfort. Zhibin Wu et al. [28] focused on 11 split air-conditioned office buildings to study the applicability of thermal comfort standards and determine the energy efficiency by comparing with the predicted mean vote - predicted percentage dissatisfied (PPV-PPD)—95% of occupants were satisfied with the adjusted model while 8.6% of cooling demand could be saved during the summer period. A parallel study by Jasmin Anika Gartner et al. [29] was also conducted with the consideration of thermal comfort and energy saving potential by comparing three HVAC systems (mechanical ventilation, radiant ceiling, and thermally active systems). Their studies both indicated that various HVAC design parameters played a significant role for energy efficiency as well as thermal adaption. Ru Ming [30] and Daniel Sanchez-Garcia [31] placed emphasis on the need for a time dimension that would take the seasonal replacement node (latter spring, early/middle/latter cooling period, early autumn) and climate change (2020, 2050, 2080) into account as they all believed that changes in time or season have an impact on body adaptability and behavioral energy saving. Furthermore, the multiobjective analysis of energy demand, thermal comfort, and cost that focused on a single parameter (building envelop) had been studied by Ran Wang [32] by comparing it with the base-case building to getting the optimal value range of the target parameter.
In conclusion, according to the previous literature review, there is no doubt that the design parameters have a significant role on building energy demand as well as indoor thermal comfort. However, numerous researchers’ optimization processes were based on a limited number of parameter variations and neglected the correlation of factors themselves, which may have led to the one-sidedness of the results. Therefore, a more detailed interval division of metrics was carried out in this research. Table 2 is considered to show the different influence levels of parameters in various climate regions of China, there were, in total, six parameters extracted from the literature above, which were identified as the most significant factors to this study, and the specific parameter optimization scheme is introduced in Section 2.3.4.
2.3. Simulation Studies
For evaluating the influence level of parameters on energy demand as well as indoor thermal comfort, the benchmark and adjusted cases for each climate region were established in Open Studio Sketch-Up plug-in, meanwhile, using the engine of Energy Plus (EP-Launch) to calculate the instrument definition file (IDF) files, respectively. The benchmark cases adopted the Chinese design standard for energy efficiency of public buildings, and the energy demand of benchmark cases provided the comparative prototype for other cases with optimization.
2.3.1. Mathematical Model and Evaluation Criteria
Energy Consumption Model
In numerical simulation processes, the thermal balance method is adopted for calculating the end-use energy demand and total annual loads. The core of this method is that heat is transferred between different systems until the energy states are the same, and the law of conservation of energy is followed throughout the heat exchange process. In this study, the energy loads algorithm in Energy Plus was based on Equation (1) [22,33], the basic assumption was that the room air temperature was uniform as well as the temperature of building envelope surfaces. By calculating the heat transfer of the envelope under the heat disturbance at each time step, the thermal performance of the whole building can be calculated, such as the heating/cooling loads and indoor air temperature.
where Cb (W/m2 °C) is the black sphere radiation constant, which equals 5.68; εik (−) is the blackening between the internal surface i and k; ψik (−) is the radiation angle of internal surface from i to k; ti (n) (°C) and tk (n) (°C) are internal surface temperatures; qi (n) (W/m2) is the heat flux gained from the internal surface i; qi r (n) (−) is the solar heat gained of the internal surface i; ωi c (W/m2 °C) is the convective heat transfer coefficient of the internal surface; tr (n) (°C) is the indoor air temperature.
∑ Cb εik ψik {[tk (n) /100]4 − [ti (n) /100)4]} + qi (n) + qi r (n) +ωi c [tr (n) − ti (n)] = 0
Due to the fact that the building exterior envelopes (outer wall and roof) are always in contact with the outside environment, the envelope heat transfer is a three-dimensional unsteady process. Thus, the most crucial issue is to solve the rule of temperature and heat flow field changing with time. In this paper’s simulation process, the new solution contained elements that are called conduction transfer functions (CTFs), which are used to calculate the unsteady heat transfer of the building envelope [34]—the thermal characteristic of the building is separated from the external disturbance and the response coefficient is considered to be the thermal characteristic of the envelope itself, as long as the reaction coefficient of the building and instantaneous/historical values of the disturbance are known, it can calculate the heat flow at that time.
There is no doubt that most of the energy exchange between inside and outside of the building during the day comes from the solar radiation, which mainly contains direct solar radiation and diffuse radiation. Although the error in calculating the total solar radiation under clear sky conditions is minimal, it cannot be ignored that there are a lot of overcast conditions throughout the year; in other words, diffuse radiation is also an important problem because there exists a lot of cloud cover in such conditions, which has a significant correlation with the sum of solar radiation. Therefore, the solar radiation model, which considers both cloud cover and temperature difference, was adopted in this study and the algorithm is based on Equation (2) [35,36]:
where G (MJ/m2) is the total daily radiation; G0 (MJ/m2) is the total daily astronomical radiation; a, b (−) represent empirical coefficients, which equal 0.75 and 1.23, respectively; Tmax (°C) is atmospheric maximum temperature; Tmin (°C) is atmospheric minimum temperature; and C (%) is total cloud cover.
G = G0 [a√(Tmax − Tmin) + b√(1 − C/8)] + C
Thermal Comfort Model
The indoor thermal environment directly affects the body comfort [37,38]. The coupling relationship among air temperature, relative humidity, mean radiation temperature, and air speed should be comprehensively analyzed instead of considering a specific indicator. ISO 7730 recommended taking the equations of predicted mean vote and predicted percentage dissatisfied (PMV-PPD), which was founded by Dr. Fanger, to evaluate the thermal comfort index [39]. Predicted mean vote (PMV) represents the mean value of votes through a 7-point thermal sensation index from the people in the same environment, see Table 3. However, considering the thermal sensation difference of individual groups, adopting the joint evaluation of predicted percentage dissatisfied (PPD) and the former is regarded as having a higher degree of credibility [40,41,42].
Based on the evaluation standard for indoor thermal environments in civil buildings (GB 50785-2012) and the assessment standard for healthy buildings (T/ASC 02-2016) in China [43,44], the comfort index is divided into 3 levels: it is comfortable when PMV varies between −0.5 and +0.5; it is acceptable between −1 and −0.5/+0.5 and +1; and it is uncomfortable when the value is below −1 or above +1, see Table 4. Thus, in this paper, take it as the evaluation standard for simulation results.
2.3.2. Basic Simulation Assumptions
Several appropriate assumptions were made in order to simplify the simulation process (accelerate calculation speed) as well as reduce the errors from the results, which mainly lay upon 4 points as follows:
- (1)
- The rooms with similar functions in the building’s geometrical model were merged into the same thermal zone (thermal zone 1: office cell; thermal zone 2: meeting space; thermal zone 3: equipment room, etc.);
- (2)
- The inner walls (three surfaces), floor, and inner ceiling are adiabatic—heat transfers between the room and outside environment only through the exterior wall with fenestration;
- (3)
- Direct solar radiation is mainly absorbed by the floor, which equals 75%; the other 25% is absorbed by the interior surfaces, and the reflected direct radiation from the surfaces is absorbed by all inner surfaces according to their absorptivity; meanwhile, diffuse solar radiation is all absorbed by the inner surfaces;
- (4)
- The heating demand consumes natural gas with an overall system efficiency of 82%, and the cooling demand consumes electricity with the coefficient of performance (COP), which was 5.6.
2.3.3. Benchmark Case Geometrical Model
Given that different climate regions in China have various living customs and also architectural design principles, it is unreasonable and inaccurate to use the same model with all simulations. Thus, in this paper, five typical office building models adapted to local climate conditions were established for each climate zone. In order to simplify the models, adjacent rooms with the same functions were merged to decrease the thermal zones of the building. Basic information of the geometrical models are listed in Table 5.
2.3.4. Envelope and Boundary Conditions
Since the building envelope is in contact with outdoor environment all the time, heat loss through the opaque/transparent facades should be taken into account seriously, especially in the cold season at night. Therefore, only the insulation design of the envelope can provide a better indoor thermal environment and reduce the energy consumption of the building. Generally speaking, it mainly contains two points: opaque envelope structure (exterior wall and roof) and transparent envelope (exterior window), the specific considerations are as follows.
Firstly, as the opaque part of the outer envelope, mainly the cold protection and heat insulation should be taken into consideration due to the various climate characteristics. In this study, the brick masonry with low thermal conductivity was selected for the envelope structure in order to increase the adiabatic performance. In addition, thermal insulation materials as a key factor, such as expanded polystyrene (EPS), extruded polystyrene (XPS), rock wool board, and adhesive powder polystyrene insulation, have been widely applied in China nowadays, especially for EPS with its excellent performance and lower price. Thus, this kind of material was also chosen and different thicknesses were set according to the local code so as to find the best result under the premise of satisfying the economic condition.
In addition, in terms of the transparent envelope, it was also important to take adiabatic design for exterior windows into account. Although the larger glass windows can efficiently absorb solar radiation during the day to reduce electrical and heating demand, they are the weakest link in the maintenance structure, which still lose lots of heat at night. Therefore, the double vacuum glazing is a setting that two valuation parameters in this paper regarded as having a significant role: U-value of fenestration and SHGC; only a better combination between these two values could minimize the heat loss from the window. One thing worth mentioning is that, since the amount of solar radiation varies across the whole country, SHGC value is not required to be limited in SCZ due to the higher latitude with lower height angle of midday sun, but this should be strictly restricted in other sites on account of the fact that cooling in summer should be focused on reducing the air-conditioning loads. The summary of building envelope conditions for benchmark cases is listed in Table 6.
Lastly, other important boundary conditions are given in Table 7. According to [45], the indoor design temperature in winter and summer should not be lower than 18 °C or higher than 26 °C. However, due to the individual differences and various self-regulation mechanisms, such a wide range of temperature fluctuations is not considered to be comfortable [46,47]. Thus, an optimal interval of 20.5 °C for winter and 25.6 °C for summer was selected in simulation process. Also, traditional architectural thermal disturbance mainly includes people, lighting, and electric equipment loads [48,49], but it has to mention that the air tightness still continuously influences the indoor thermal environment, which is an essential control index to ensure the stability of thermal insulation performance of external fenestration and directly related to the heat loss of cold air infiltration. S. Chen et al. [50] discovered that the heating energy demand would be reduced by 12.6% if the air tightness changed from 1.0 h−1 to 0.5 h−1, so the influence of infiltration rate on simulation results was considered in this paper.
2.3.5. Optimization Scheme
Just as the previous section discussed, the dependent variables of the parametric analysis were heating, cooling, and total consumption of the whole building, as well as the thermal comfort index; meanwhile, the following parameters as control variables were optimized with the simulation: ① orientation, ② layer of insulation board, ③ U-value of exterior fenestration, ④ SHGC, ⑤ WWR, and ⑥ infiltration rate. The value codomain of these parameters are concluded in Table 8.
3. Results and Discussion
3.1. Energy Demand
Since there is always an uncontrollable error between weather conditions in a database (average values of a standard year) and local actual meteorological information (random value), the absolute values are not an accurate description of energy utilization; however, a relative variation tendency may be more reliable to reflect the impact of parameter changes on energy demand. Therefore, the percentage deviation of each input parameter with benchmark cases were carried out in Section 3.1.1, Section 3.1.2, Section 3.1.3, Section 3.1.4, Section 3.1.5 and Section 3.1.6.
3.1.1. Orientation
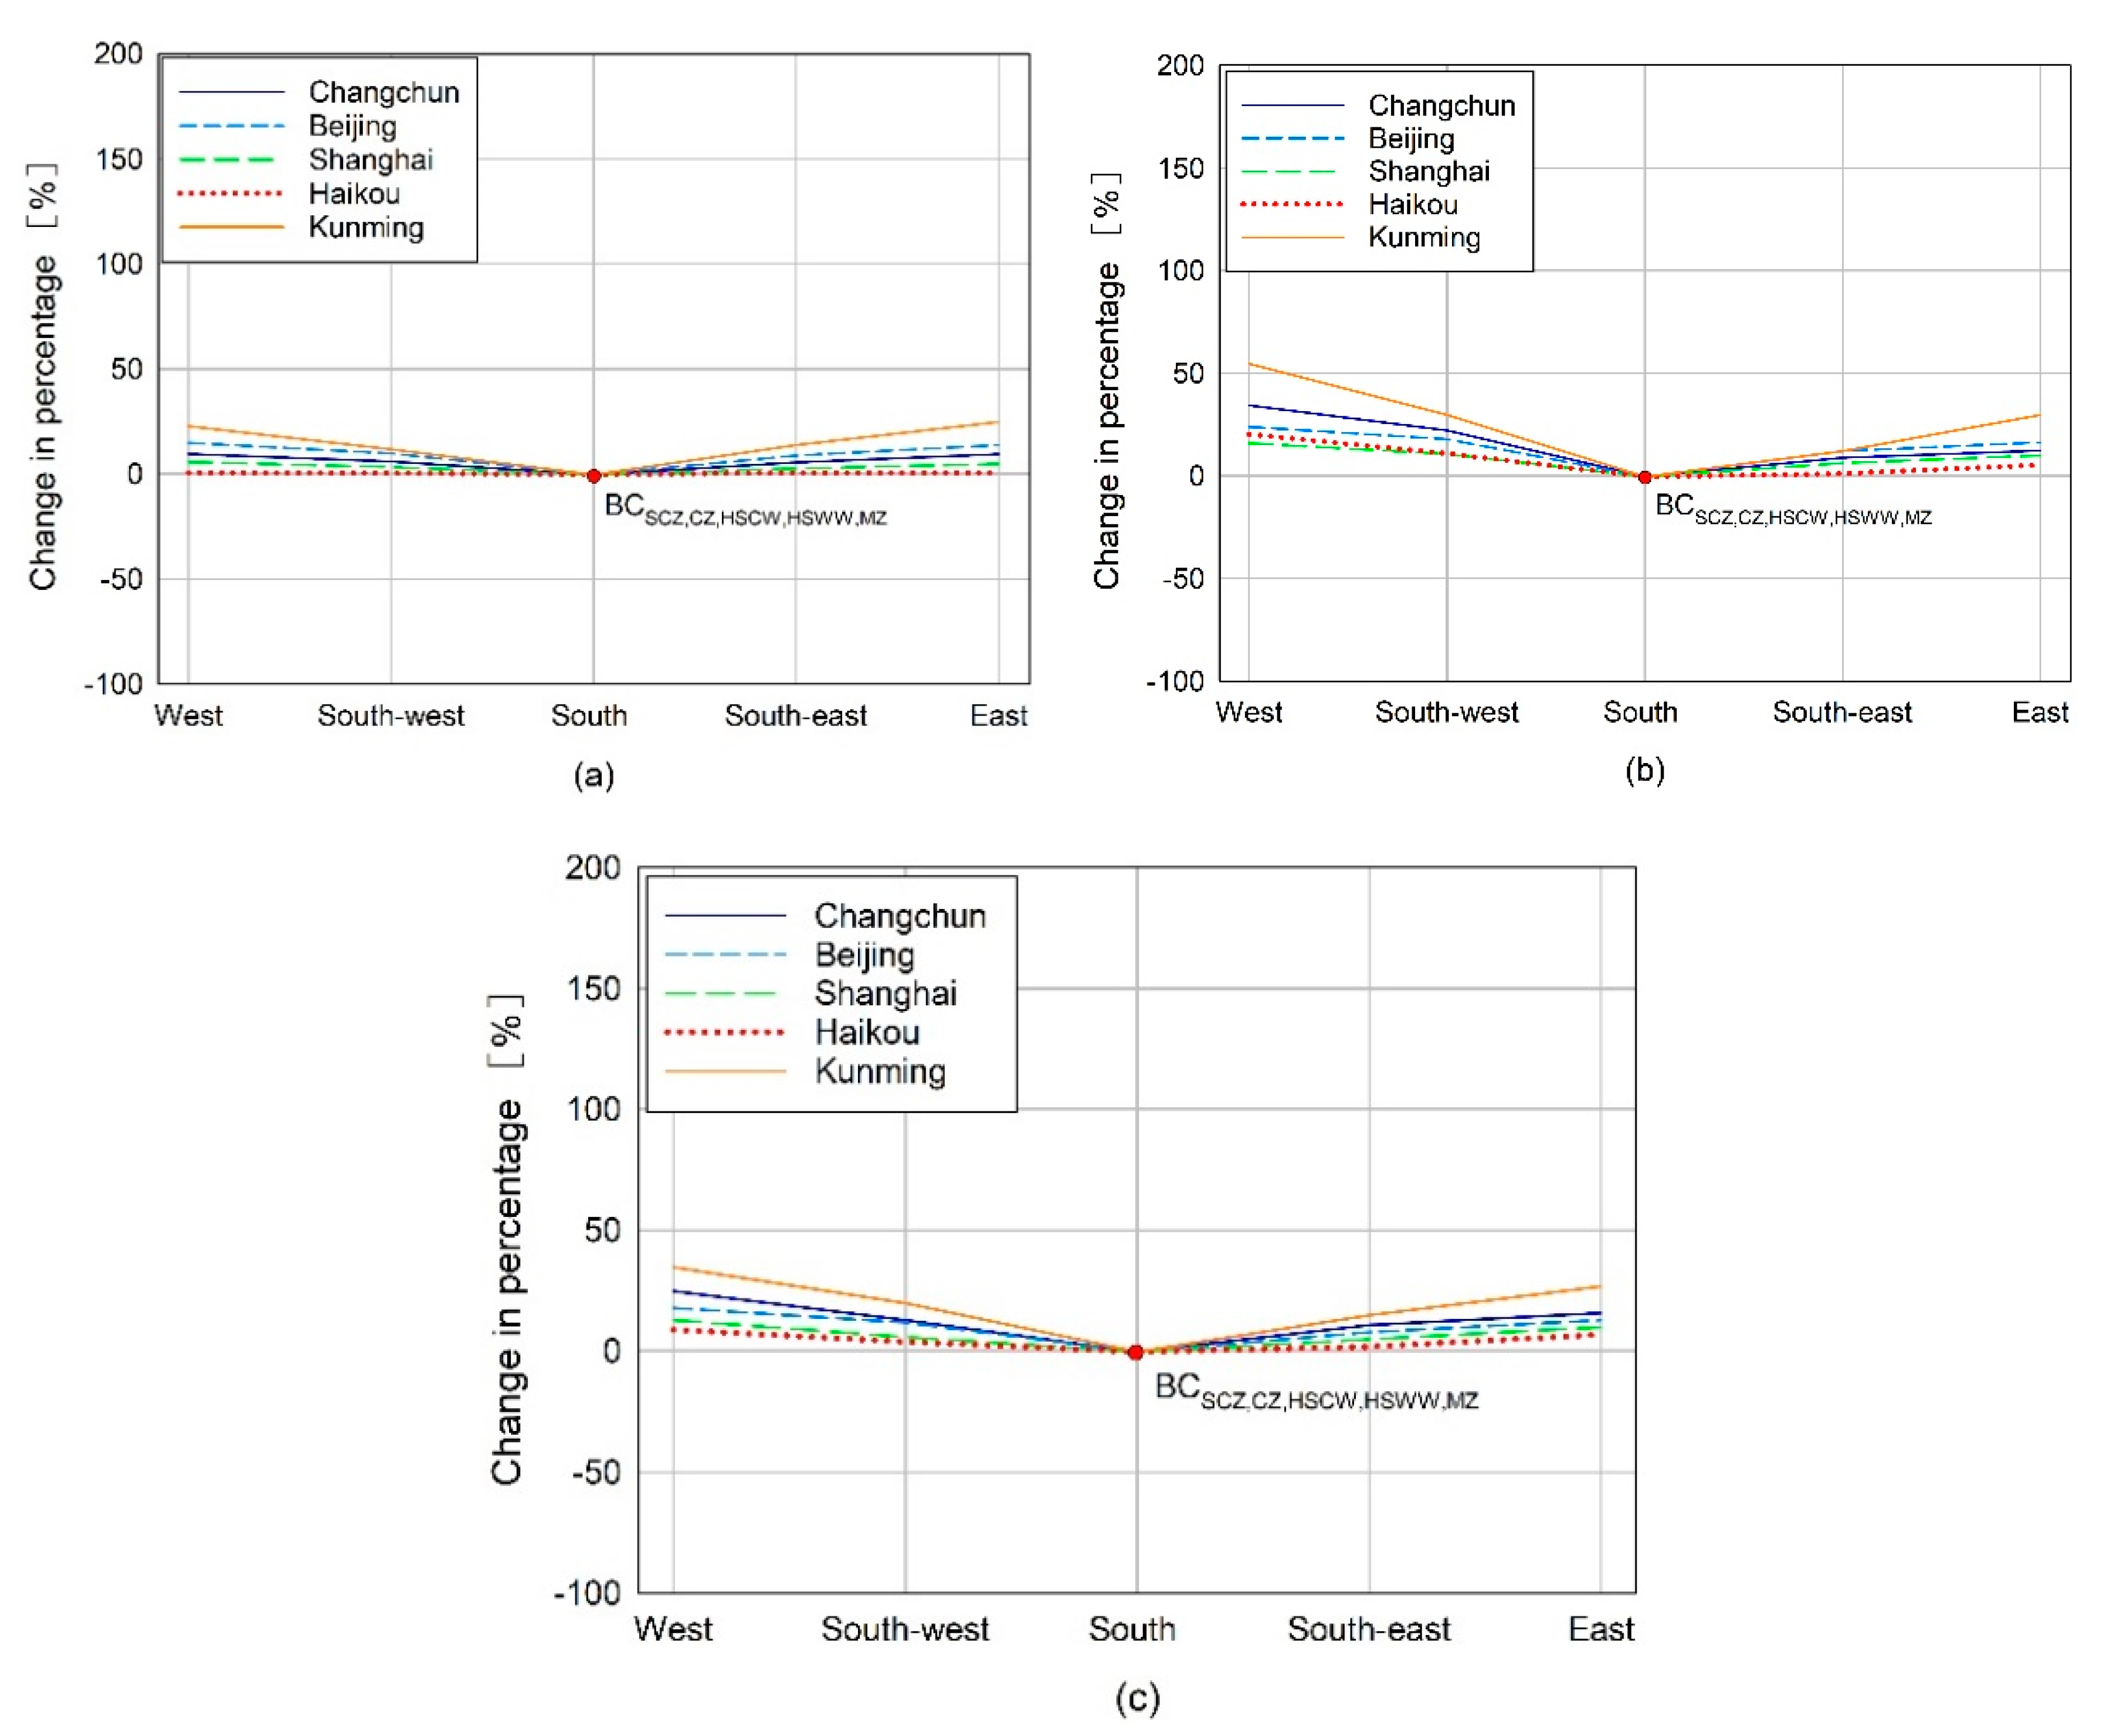
According to Figure 4a–c, the optimal solutions of each climate zone are all to the south, given the option of changing the orientation of the whole building. A rotation from south to west or south to east would separately lead to a heating and cooling demand increase of approximately by 5–25% and 40–53%, and a maximum growth of about 47% of total energy could be discovered in Kunming. Among them, the influence of orientation on cooling demand was slightly greater than heating.
3.1.2. Layer of EPS Board
It can be found in Figure 5a–c that the changing rates of the terminal energy utilization varied from each other. For heating aspects, adding the thickness of the insulation layer can lead to a significant reduction for energy use in all regions, while the variation in Kunming was minimal, accounting for around 7%. On the contrary, the changing rate of cooling loads lifted, but the amplitude was not obvious. For total energy demand, the results of Changchun and Shanghai revealed the largest energy saving potential of approximately 11% when adding EPS thickness from local standard 0.065 m, 0.036 m (see Table 6) to 0.12 m, and then about 6% reduction in Beijing. Nevertheless, by transforming the EPS board from the current requirement values to 0.12 m, the total energy load also increased by around 5% and 20% for Haikou and Kunming, respectively. What needs to be pointed out is that when the variation of total energy consumption for each region is not linearly distributed with the thickness of the material, the rate of change finally flattens out, therefore, the key point is to search the optimal range of EPS thickness in each city so as to obtain a reasonable balance of energy demand and investment costs.
3.1.3. U-Value of Exterior Fenestration
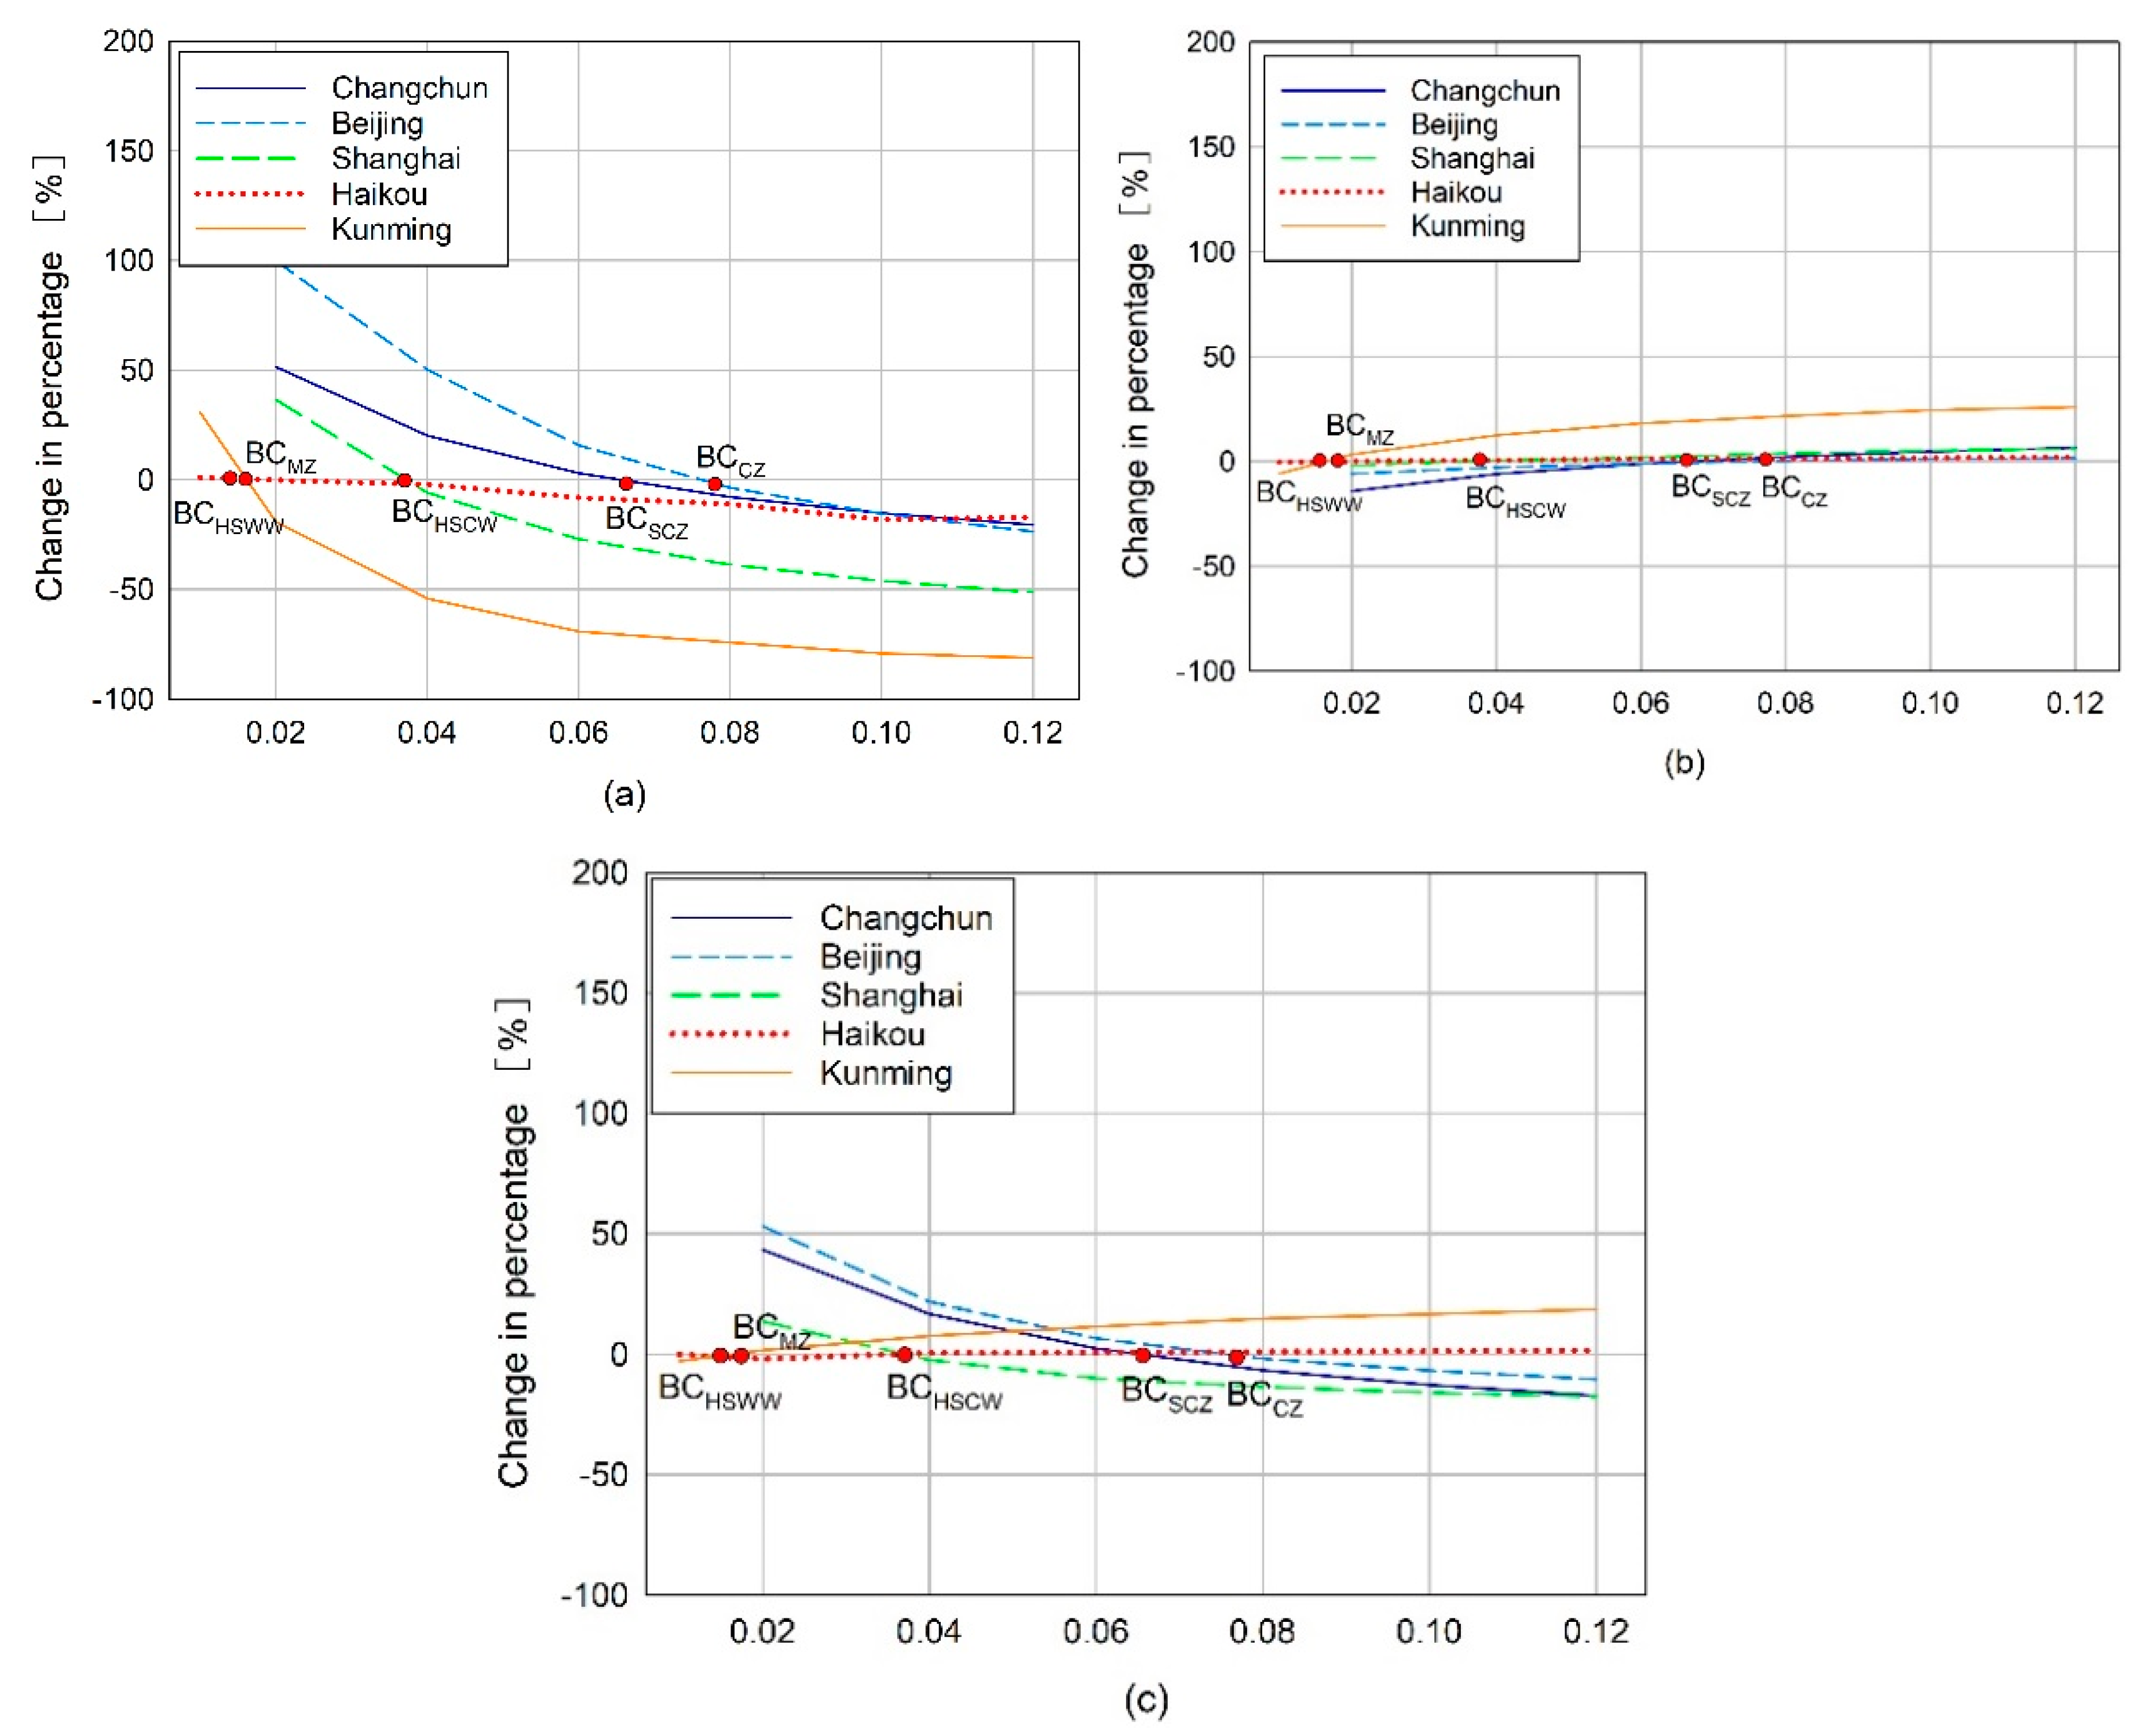
From Figure 6a–c, the slopes of the heating and cooling utilizations have different degrees in all cities except in Haikou. For heating aspects, Changchun, Beijing, and Shanghai all grew linearly with U-value increasing, however, Kunming showed a nonlinear growth with an inflection point U-value of 3.4 W/(m2 K). On the other hand, Beijing and Kunming reflect the best energy saving potential, with approximately by 40% and 37%, respectively. For cooling aspects, the increase variations were all within 10%. Focusing on total demand, only Haikou and Kunming showed a slightly negative growth within 10% by changing the thermal conductivity from standard value to 2.0 W/(m2 K), which further indicated that the need for heating in these areas is not high in winter and the total energy demand across the year is mainly reflected in cooling; in other words, although the heating reduction was larger than cooling growth in Kunming, the overall utilization was still slightly higher.
3.1.4. SHGC
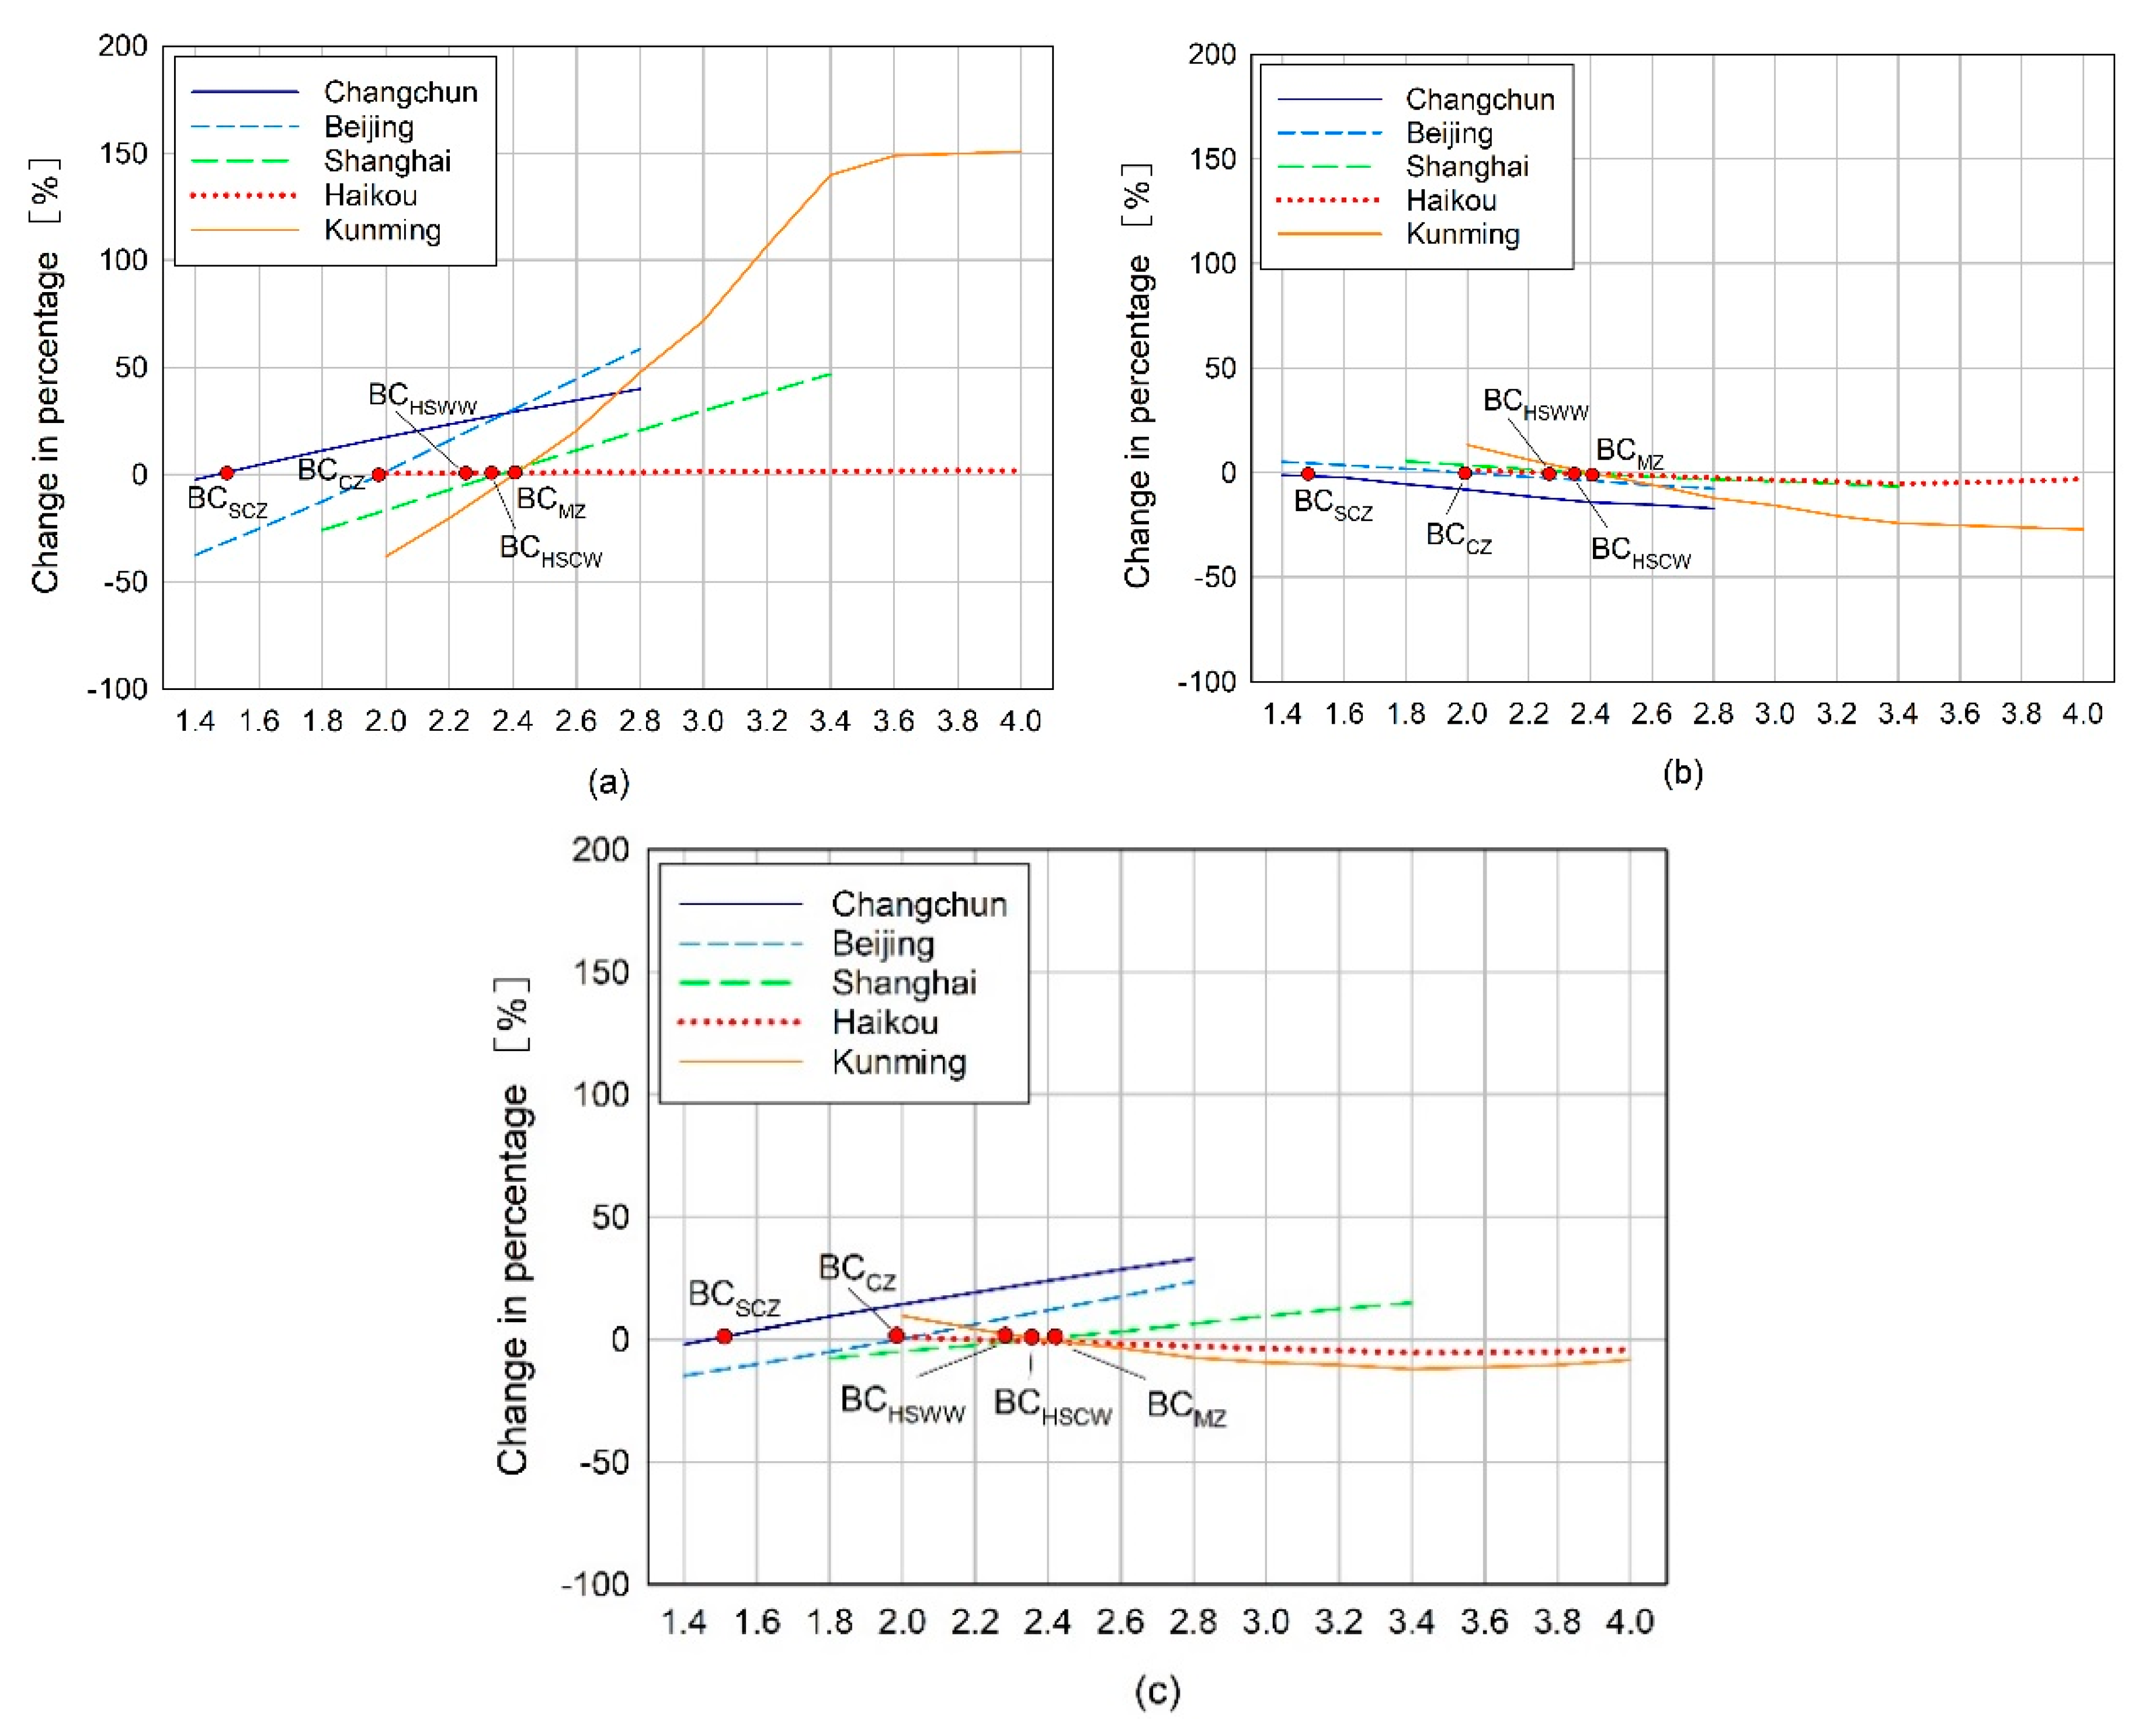
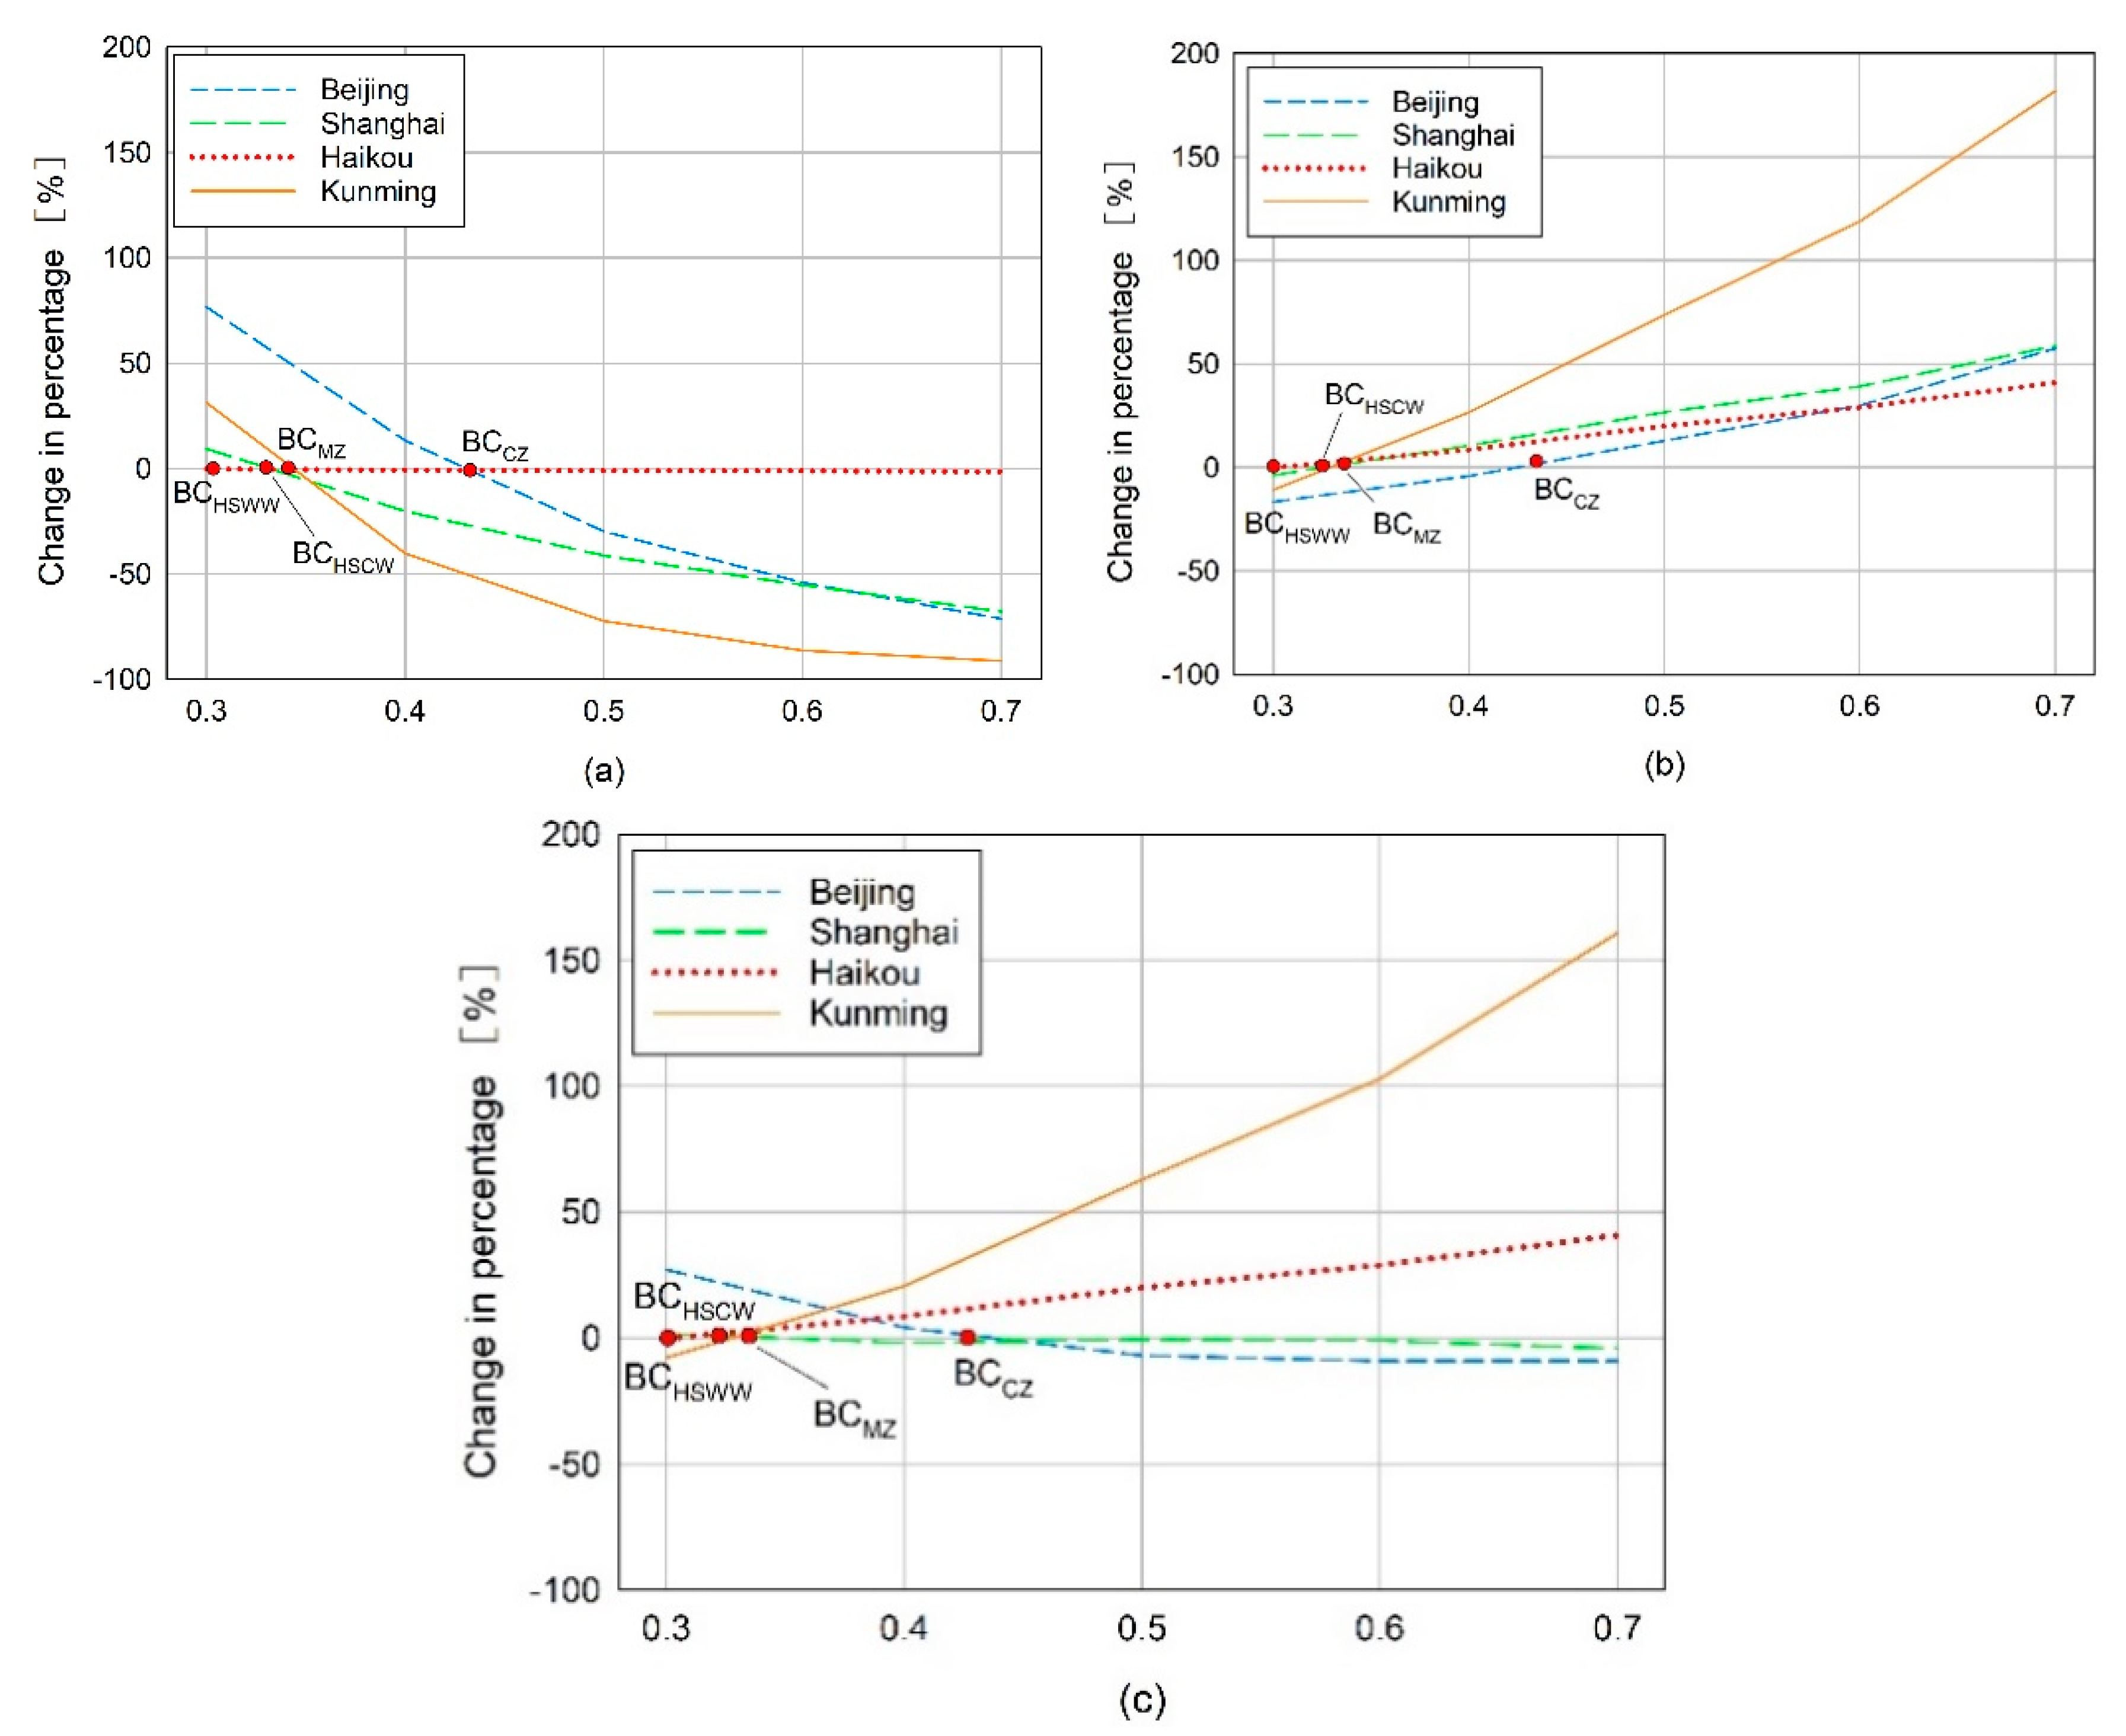
Given there is no specific requirement for SHGC value in SCZ, the different values for Beijing, Shanghai, Haikou, and Kunming were carried out respectively, see Figure 7a–c, and the standard SHGC values for each city above were 0.428, 0.328, 0.30, and 0.332, which are listed in Table 6. For heating aspects, all cities except Haikou appeared to have nonlinear reduction for energy utilization by changing SHGC to 0.7, which Kunming has the greatest potential for reaching by 88%, Beijing and Shanghai are both around 72%. However, there is no effect on Haikou due to the fact that the heating demand in winter for this area is the lowest compared to other locations. For cooling demand, the changing of SHGC will affect all cities to varying different degrees, even above the 170% observed in Kunming. For total demand, it was easy to find that, for Beijing, we could appropriately add SHGC at the current standard to save more energy, but it should be strictly limited in Kunming and Haikou. In other words, SHGC is not sensitive to the cold winter regions, but to the warm/hot summer areas of China.
3.1.5. WWR
Generally speaking, energy demand varies linearly with WWR in all cities regardless of room orientation. However, due to the fact that direct solar radiation obtained by south and north facades vary from each other, it is necessary to analyze one by one and then a comprehensive comparison follows.
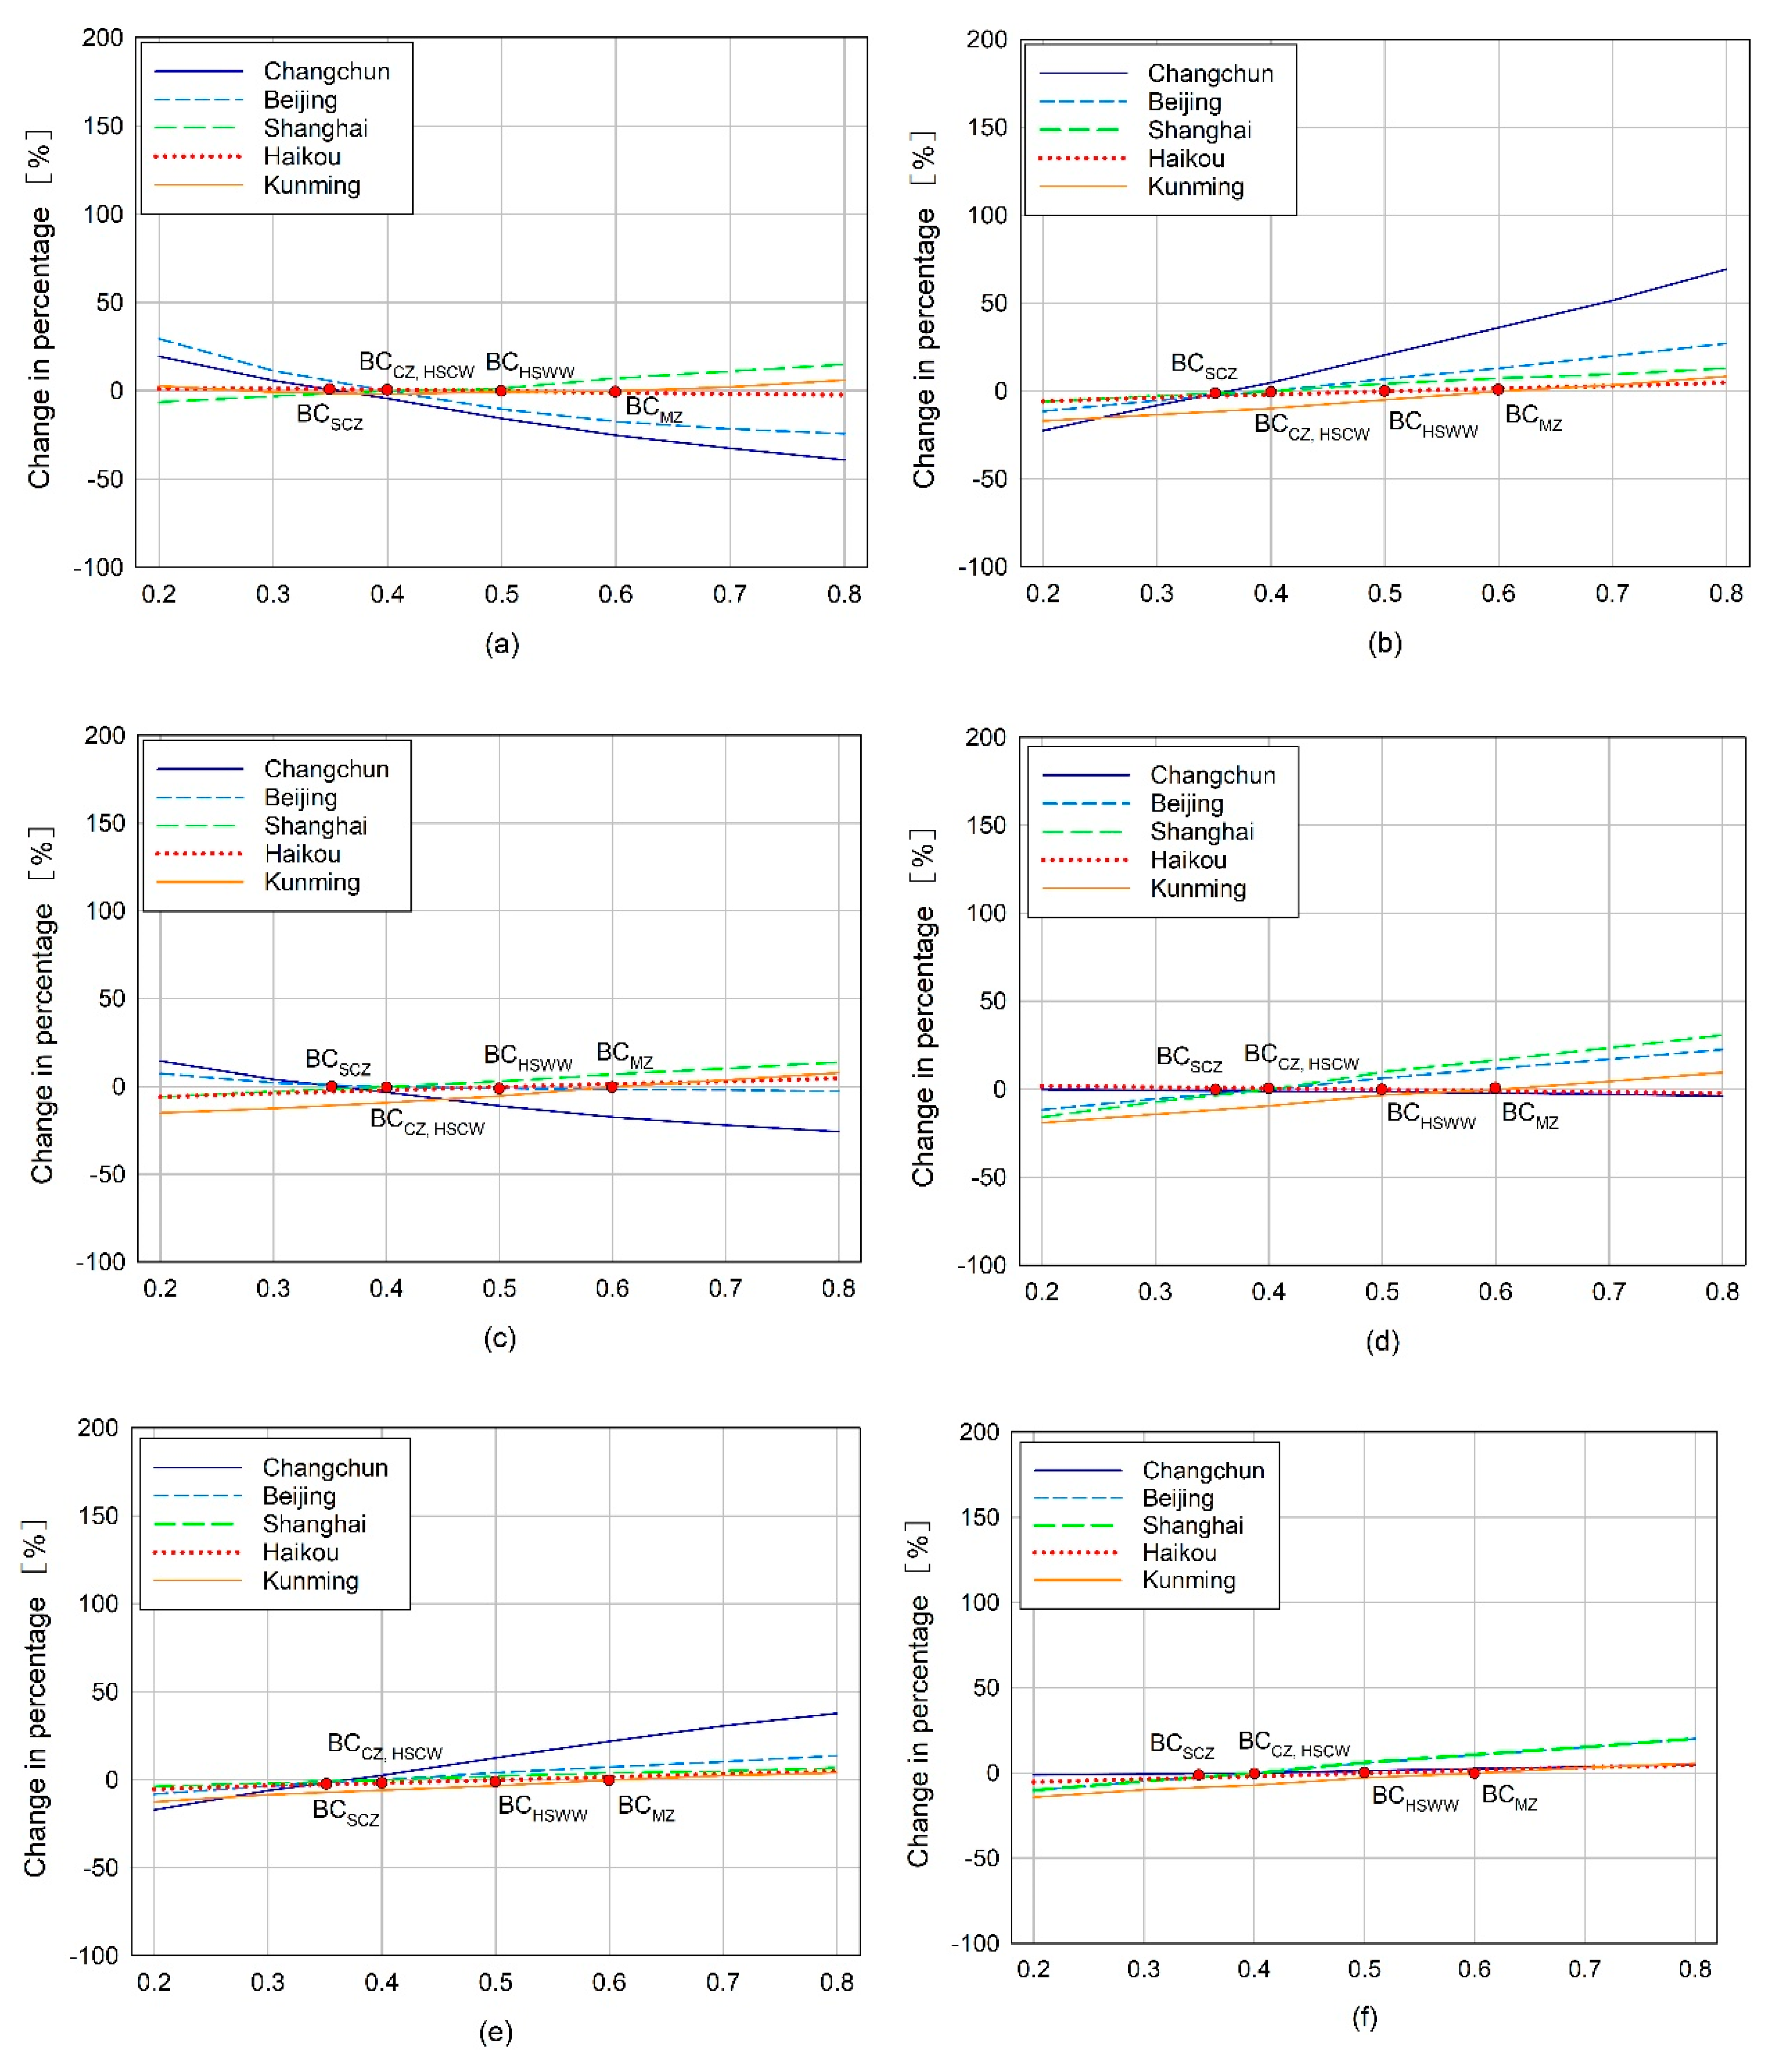
For south rooms, in Figure 8a–c, the changing in Changchun was most obvious for total energy savings, which means a larger WWR can effectively receive more radiation. In contrast, the changing in other regions was not obvious; for north rooms, Figure 8d–f, due to less solar radiation on the facades, the heating loads seemed to have no effect with changing WWR in Changchun, but cooling demand increased by around 40% and the total demand increased in all regions with larger WWR (0.8), especially in Beijing (21%) and Shanghai (20%).
However, by comparing Figure 8c,f, although the reduction rate in south rooms was larger than the increase rate in north rooms (for Changchun), they seemed to achieve the energy efficiency with larger WWR. One thing worth mentioning is that the initial energy utilization of north rooms was much higher than south, so the rate of change here cannot directly to compare. In other words, for SCZ and CZ of China, indoor heating is easily lost through windows, especially in winter, thus, WWR should also be strictly controlled.
3.1.6. Infiltration Rate
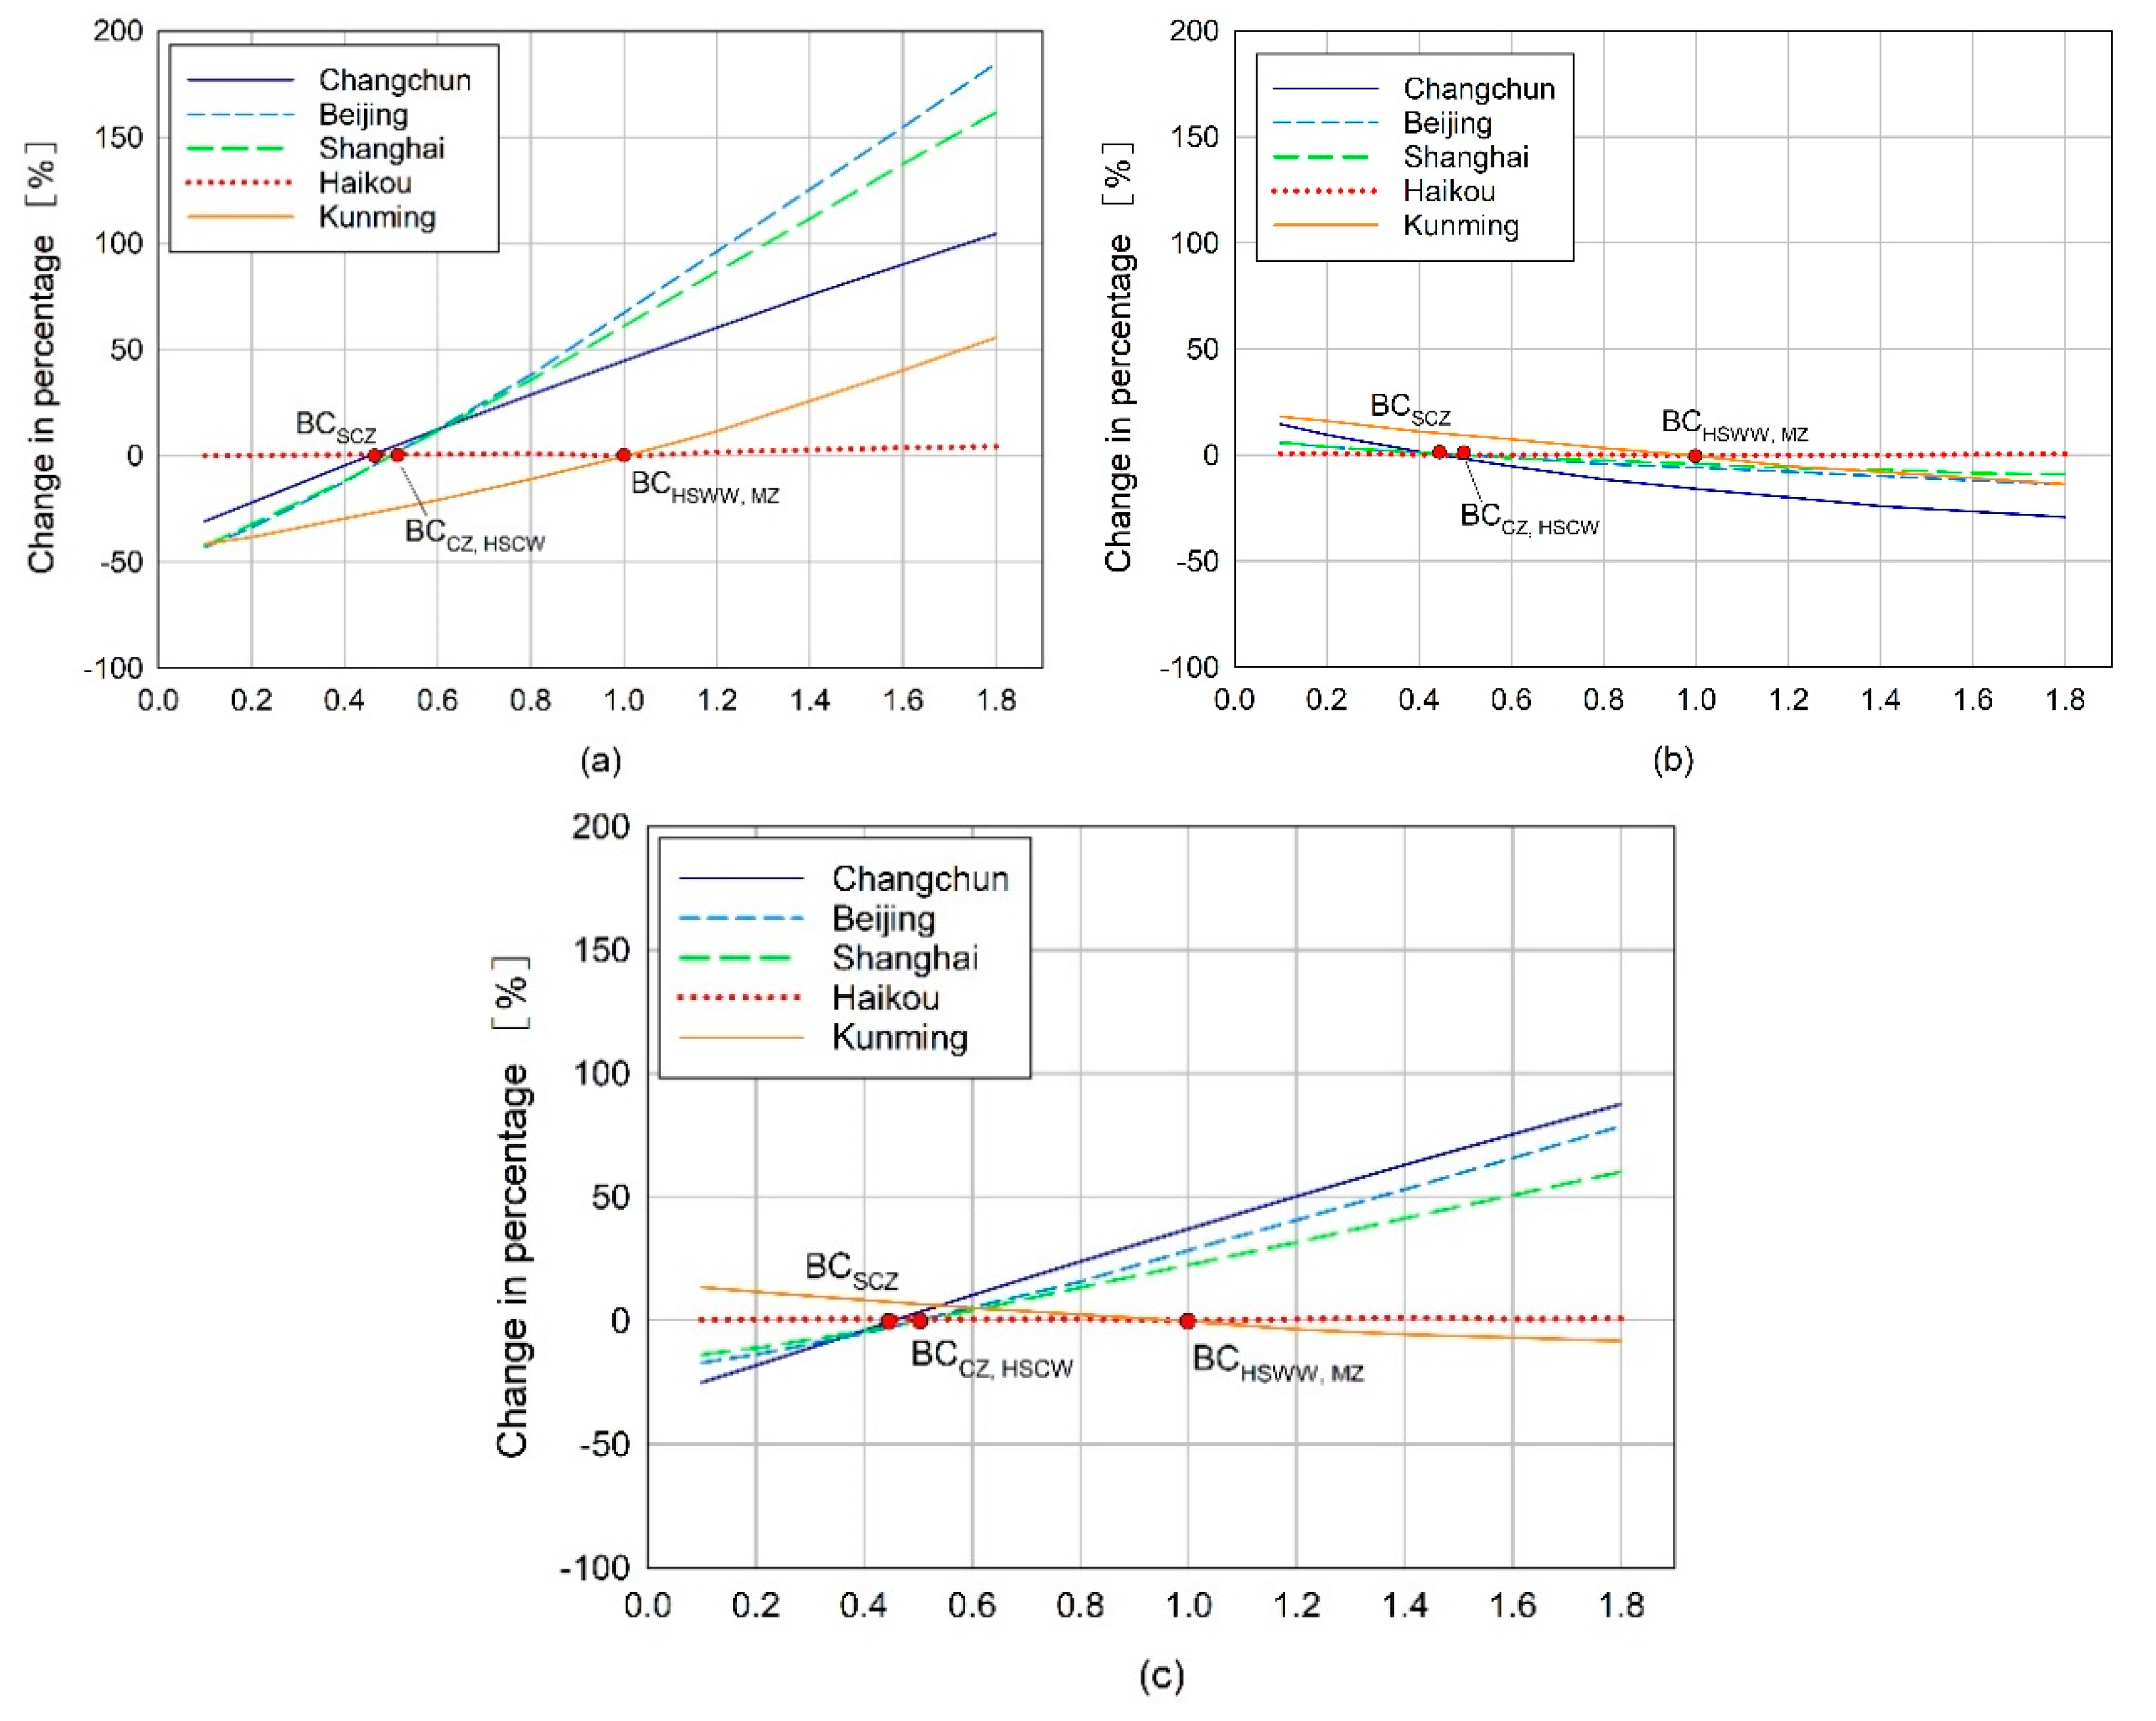
According to Figure 9a–c, for total energy demand, the infiltration rate of Changchun, Beijing, and Shanghai should be taken more into consideration, because the changing rate increased significantly by 85%, 77%, and 60% respectively, which means more heating will be lost in the process of air penetration, and smaller air changes, such as 0.1 h−1, can effectively reduce heat exchanges between indoors and outdoors for energy saving of 18–26%, and there was nearly no effect on Haikou and Kunming. When focusing on heating and cooling demand separately, infiltration rate and heating consumption increased in direct proportion, which is more significant than that of cooling load in inverse proportion. It is worth mentioning that the energy demand varies linearly in each climate zone regardless of heating, cooling, or total energy demand. However, it is not easy and realistic to reach the 0 h−1 due to the fact that cold air infiltration is inevitable and always exists in practical terms, therefore, the aim should be to decrease the infiltration rate as extremely as possible in cold winter areas. Meanwhile, the appropriate increase in the number of air changes will vary according to the specific circumstances for other regions to reach the objective of energy conservation.
3.1.7. Optimal Value/Range for Energy Conservation
Through the quantitative analysis above, the sensitivity of each design parameter to different regions was not the same. In this paper, by comparing with the current energy codes, further sensitive parameter groups were established to evaluate the energy saving potential, and the final optimal values/range of parameters for each city are shown in Table 9.
3.2. Thermal Comfort
Another significant index which should not be neglected is the increasing desire for indoor thermal comfort, in other words, it needs to meet the maximization of comfort level on the basis of building energy conservation. Thus, in this section, a further calculation was carried out based on the optimal design parameters above to explore the better range for both energy and comfort. Indoor design temperature in this paper was set at 20.5 °C in winter and 25.6 °C in summer, see Table 7, however, the ideal indoor thermal environment cannot be achieved in reality, which means instantaneous temperature will exceed the design range, resulting in thermal discomfort at some certain period of time. Section 3.2.1, Section 3.2.2, Section 3.2.3, Section 3.2.4 and Section 3.2.5 demonstrate the representative city of different climate zones’ PMV/PPD simulation results (8760 h) based on the most sensitive design parameters. What needs illustration is that since the main usage period of office buildings is from 8:00 a.m. to 18:00 p.m. (except for weekends and holiday), the analysis below was also chosen based on this interval.
3.2.1. SCZ—Changchun
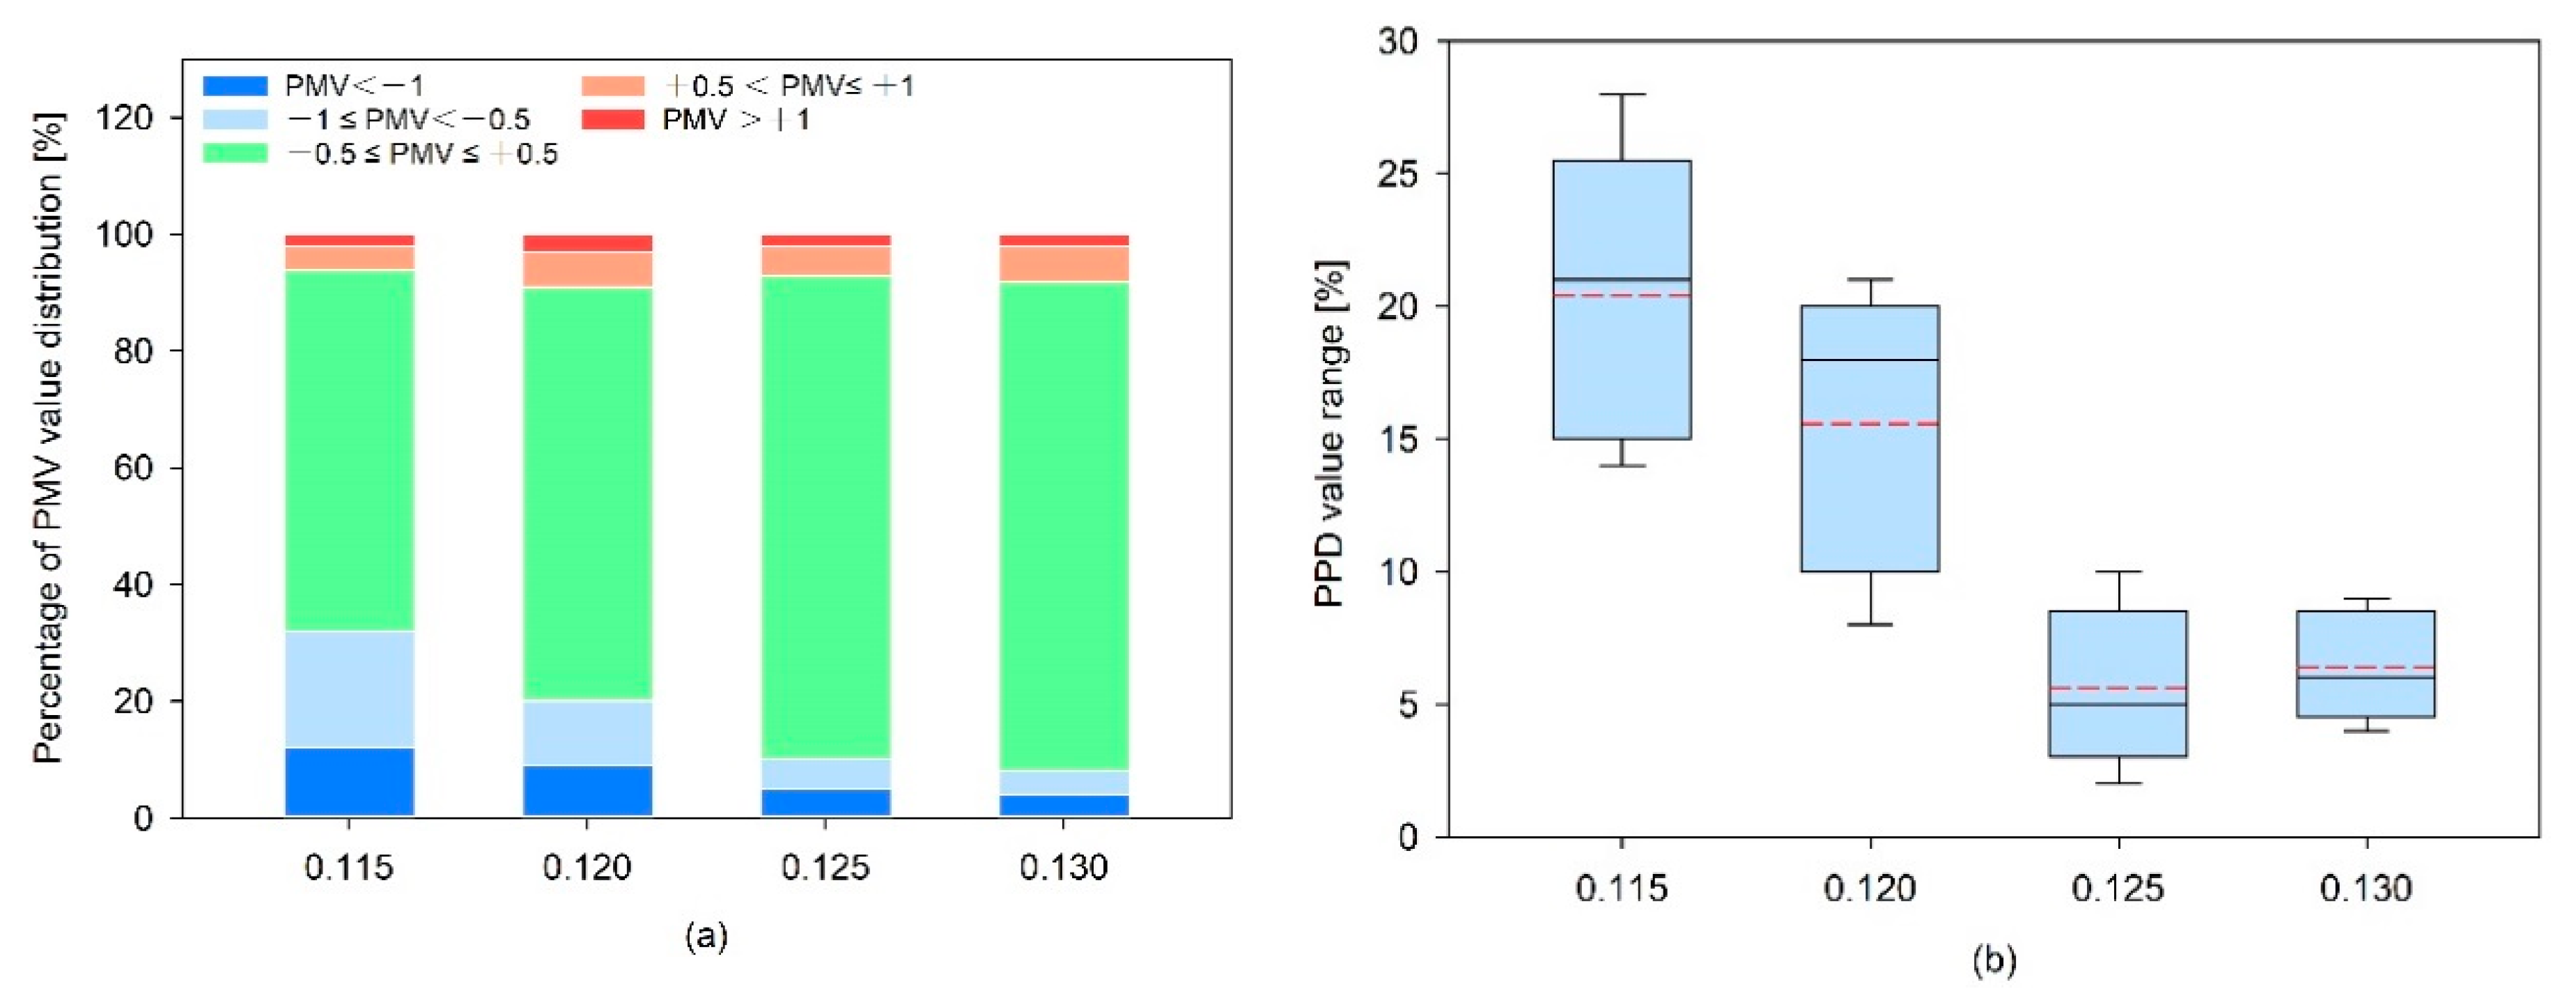
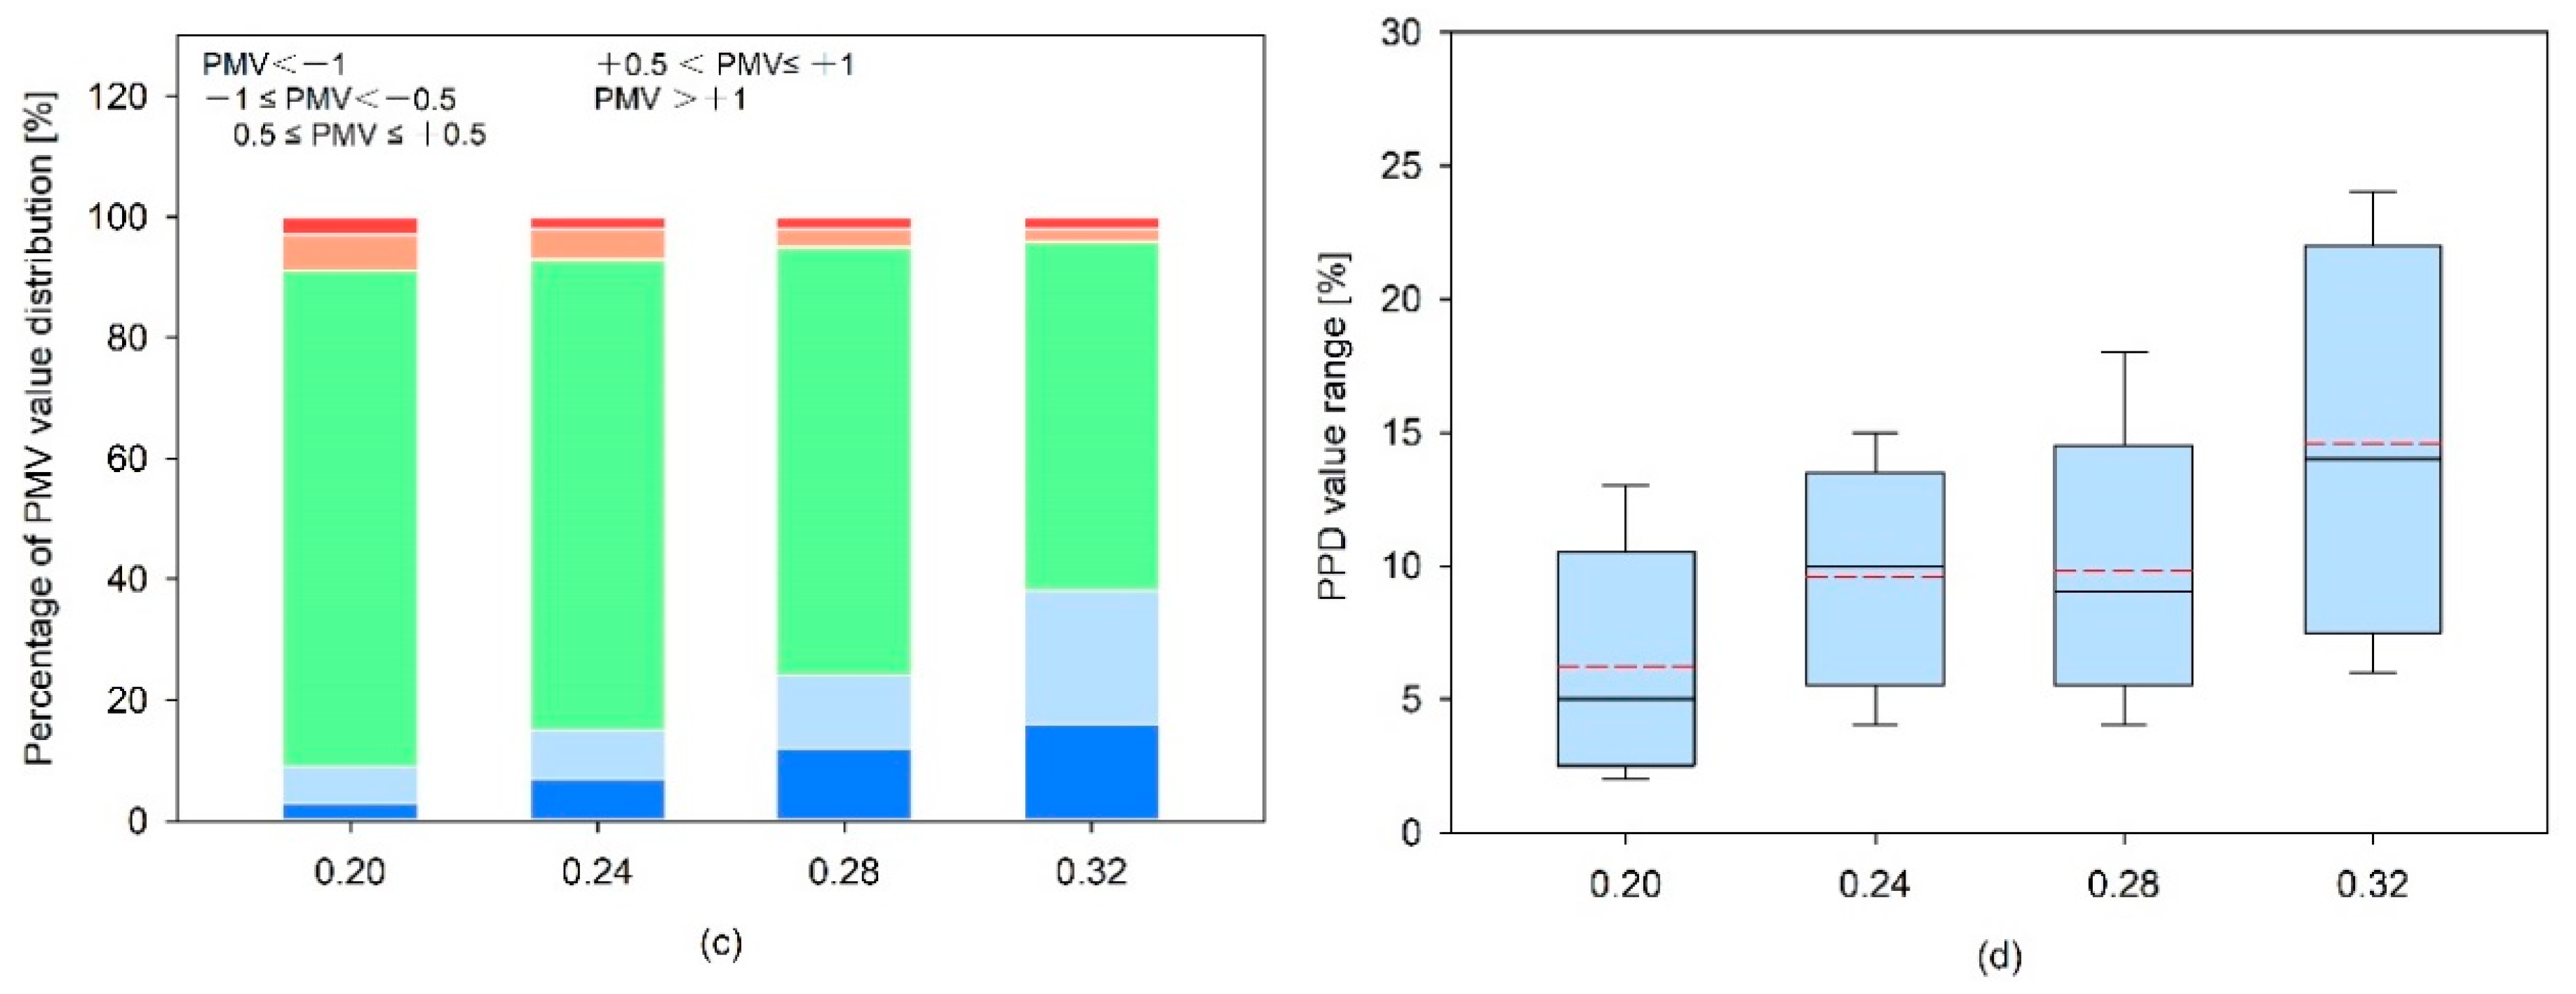
As is shown in Table 9, the most significant parameters of Changchun are EPS thickness, WWR, and infiltration rate. Among them, based on minimum air change (0.1 h−1) being unchanged, the results for various layers of EPS and WWR were achieved in Figure 10a–d. The results show that an increase of EPS thickness from 0.115 m to 0.130 m improved the indoor thermal comfort range (−0.5 ≤ PMV ≤ 0.5) by 9–22%, and as the layer of EPS insulation reached about 0.125 m to 0.130 m, the thermal comfort interval tended to be stable and accounted for more than 80% of the total usage period of the year. Meanwhile, the average values of PPD (red short dotted line) were all below 10%, which can meet level 1 of indoor thermal requirements. On the other hand, an increase of WWR shrank the comfortable range especially from 0.28 to 0.32, which is further indication that the optimal WWR range for this area is approximately from 0.2 to 0.28, which also can be verified from PPD values.
3.2.2. CZ—Beijing
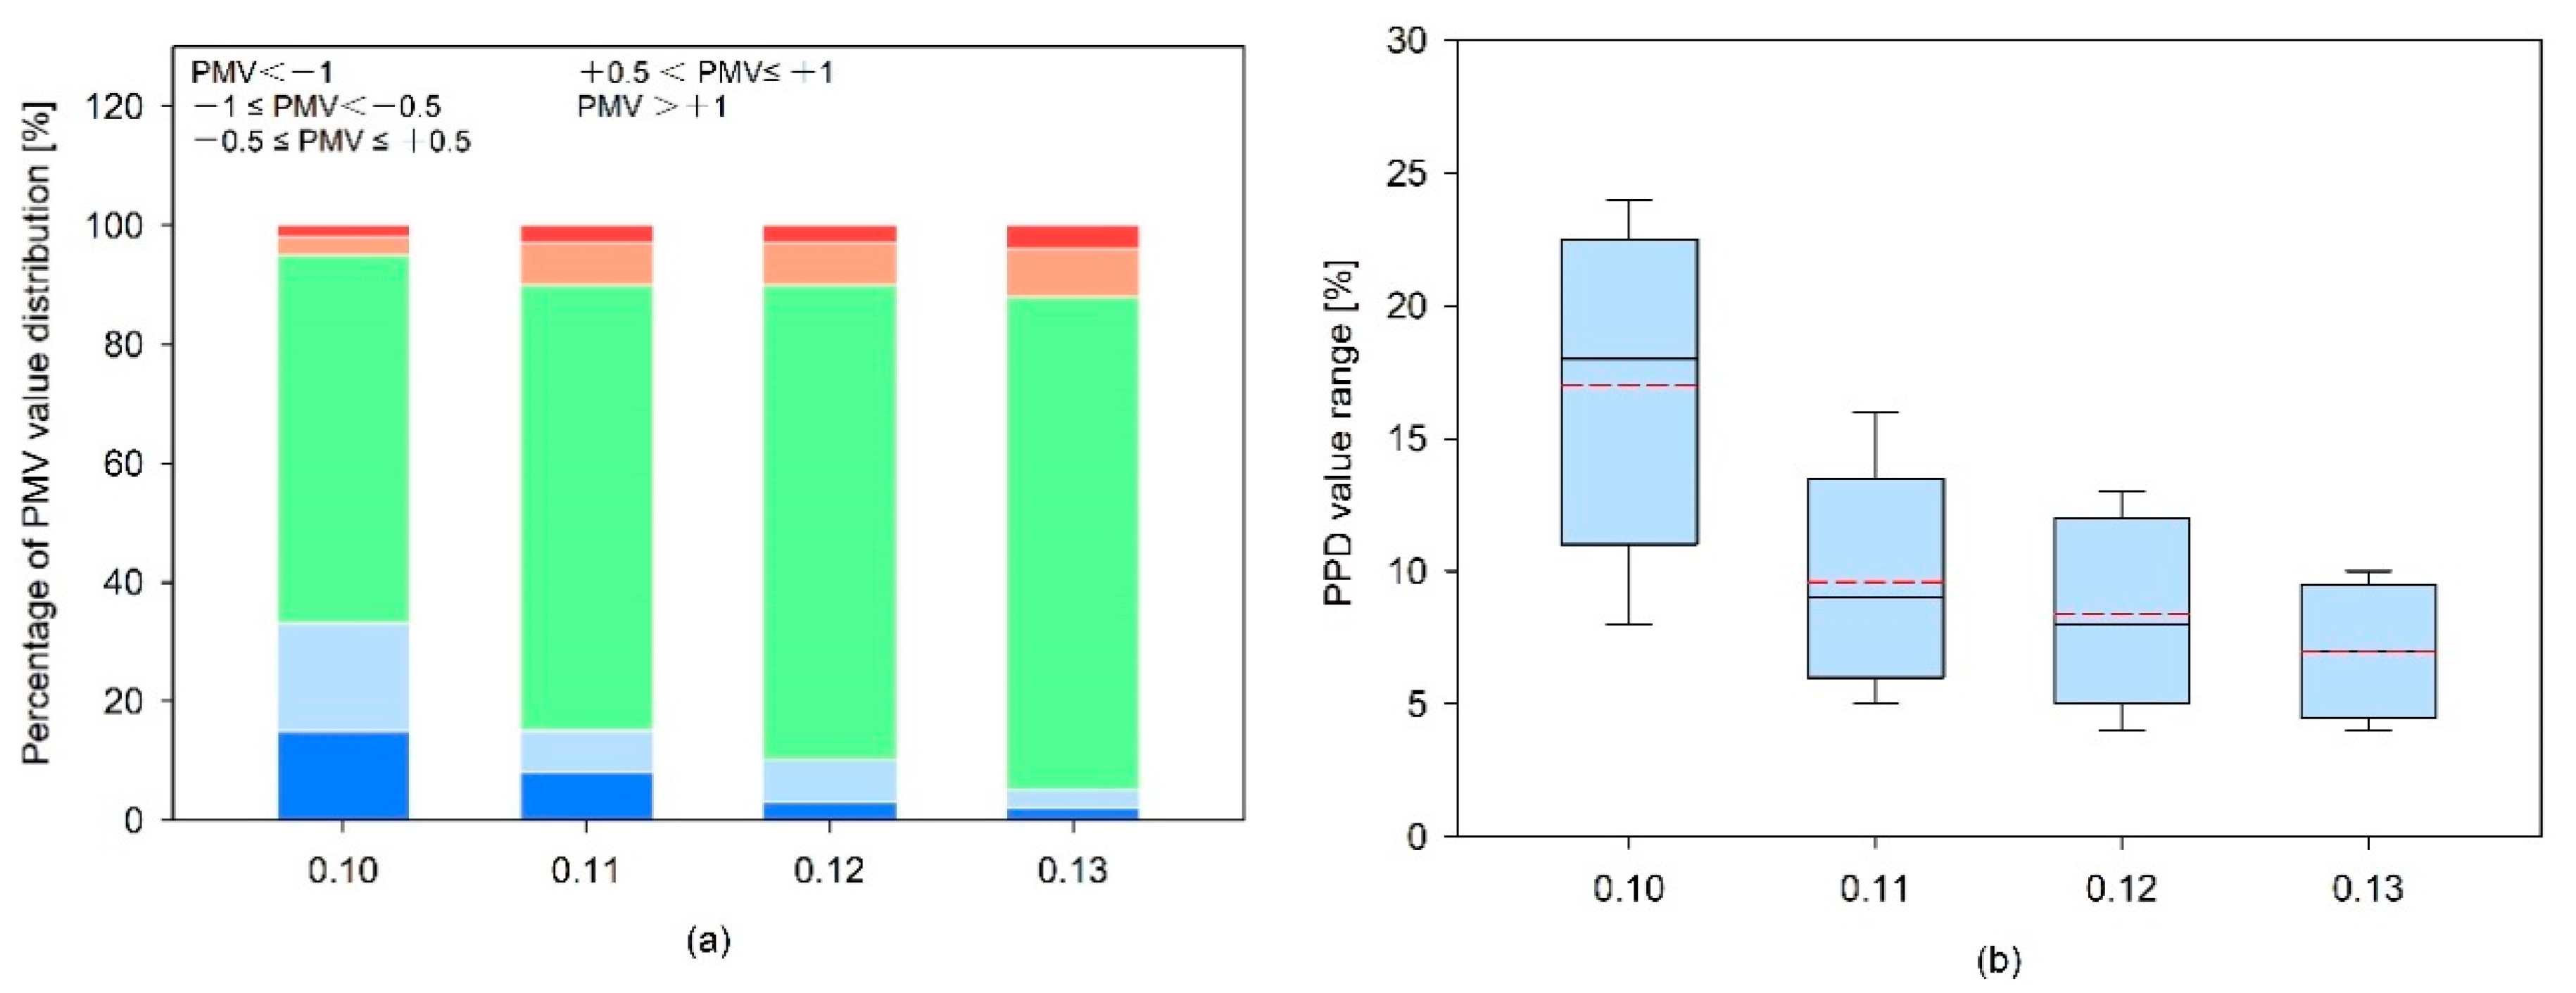
Due to the fact that weather conditions between CZ and SCZ are generally similar, the most sensitive parameters for Beijing are still EPS thickness and WWR. According to Figure 11a–d, an increase of EPS thickness from 0.10 m to 0.11 m will improve the comfort range by about 10%. As the insulation board increased from 0.11 m to 0.13 m, the thermal comfort interval tended to be stable, which accounted for above 83% of the total usage time. At the same time, the mean values of PPD were all below 10%, which can meet the level 1 indoor thermal requirements (9.4%, 8.9%, and 7.6%, respectively). The statistical data illustrated that, no matter how the WWR changed within the chosen scope, the proportions of optimal comfort range all exceeded 85%. To some extent, the optimization results of comfort level in this region for WWR are consistent with the outcome of energy demand.
3.2.3. HSCW—Shanghai
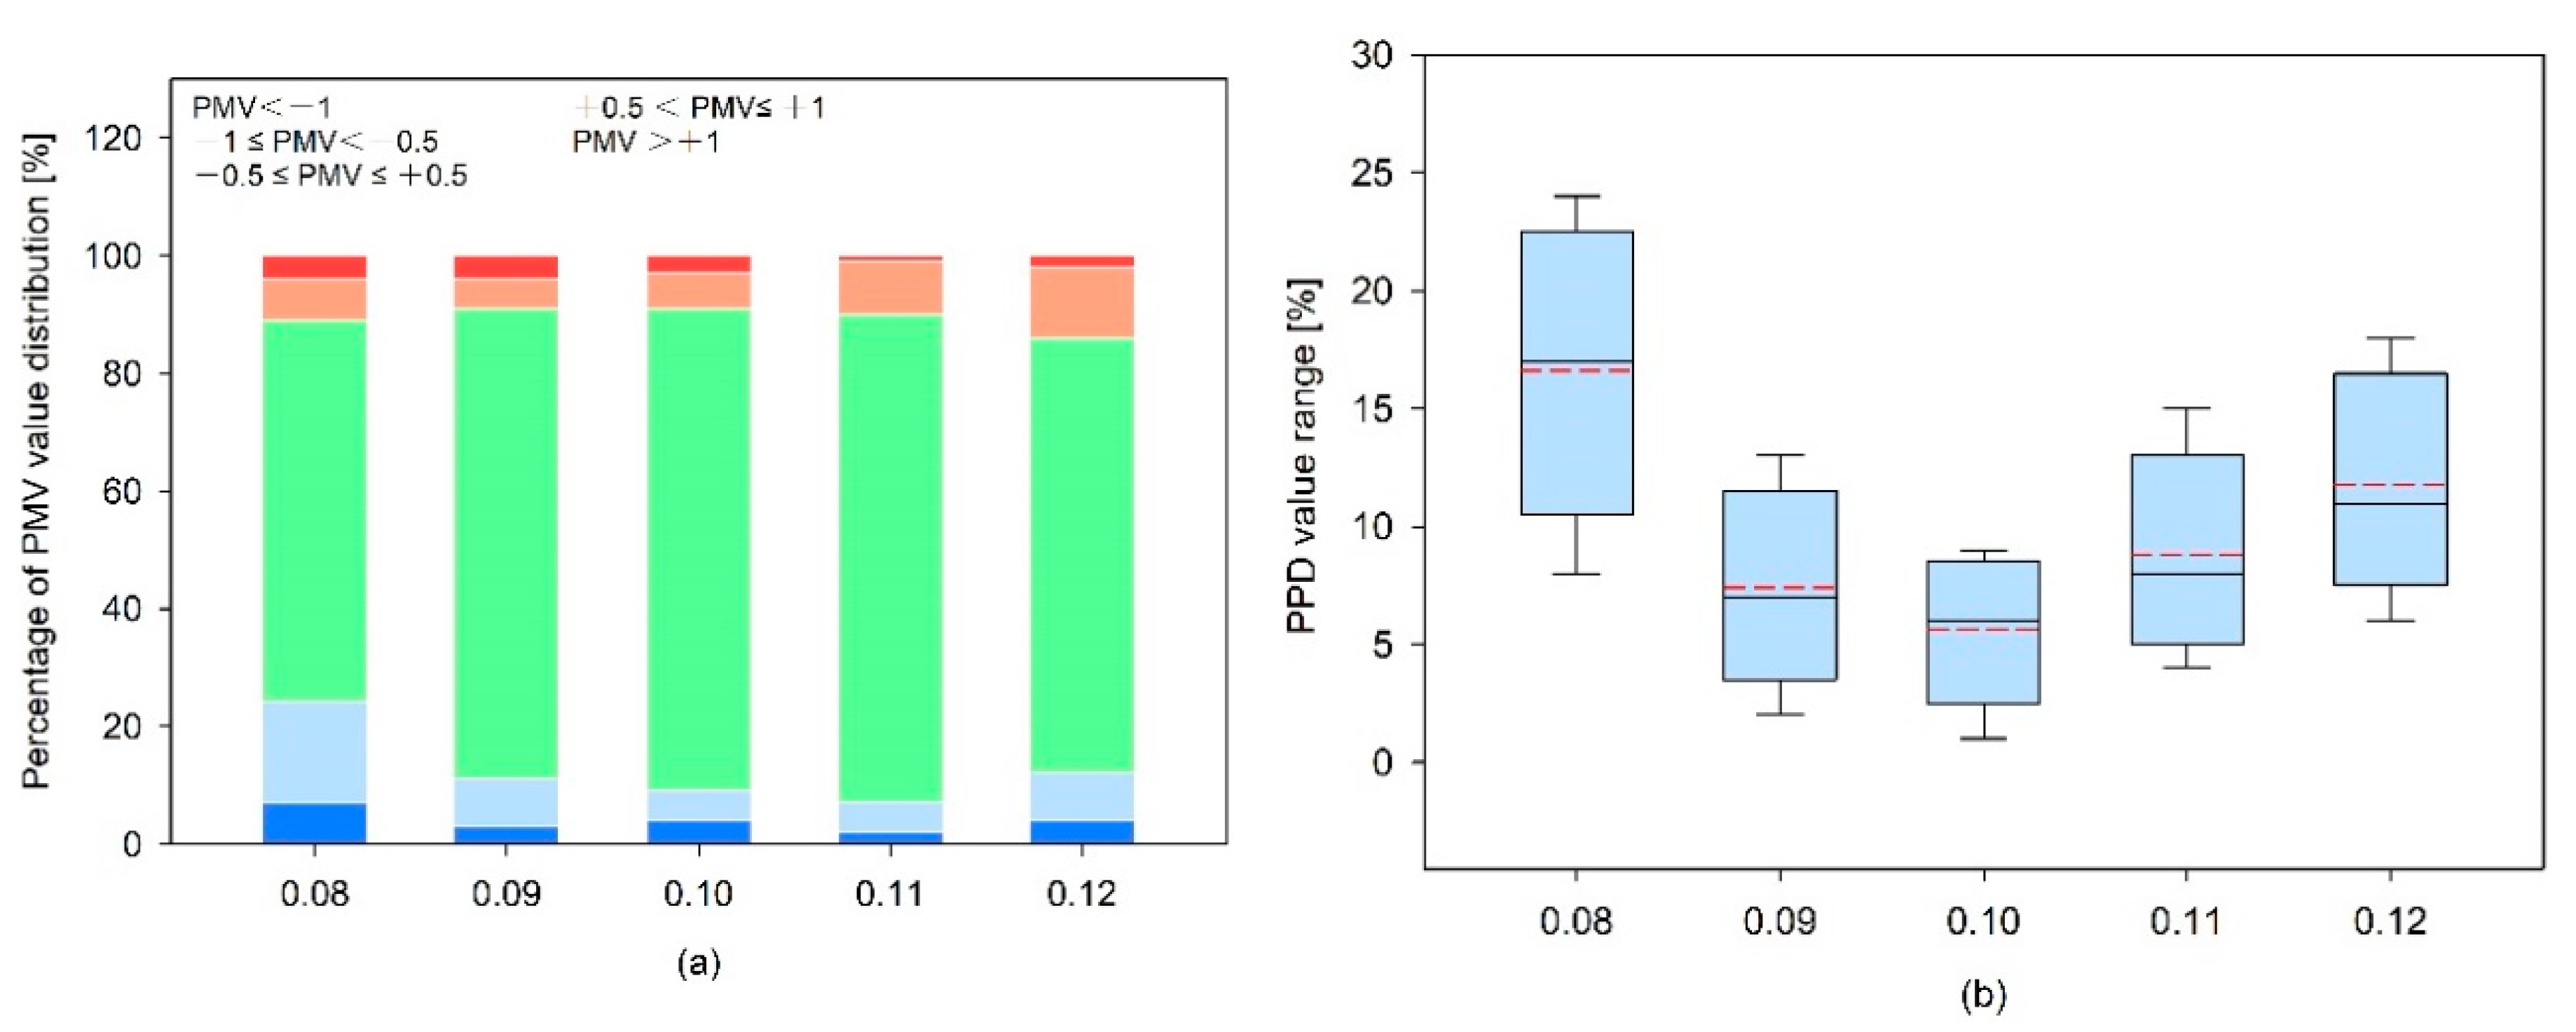
Based on the optimal values for energy demand above (Table 9), in this region, only the influence for changing layers of EPS on comfort level were focused on. As Figure 12a,b shows, by increasing the layer of EPS board from 0.08 m to 0.12 m, the comfort interval (−0.5 ≤ PMV ≤ 0.5) increased first (from 0.08 m to 0.09 m) and then decreased (from 0.11 m to 0.12 m), and the total period of thermal neutrality between the layer was more than 85%, varying from 0.09 m to 0.11 m. Also, the fluctuation range of PPD was relatively small (less than 10%) in this interval.
3.2.4. HSWW—Haikou
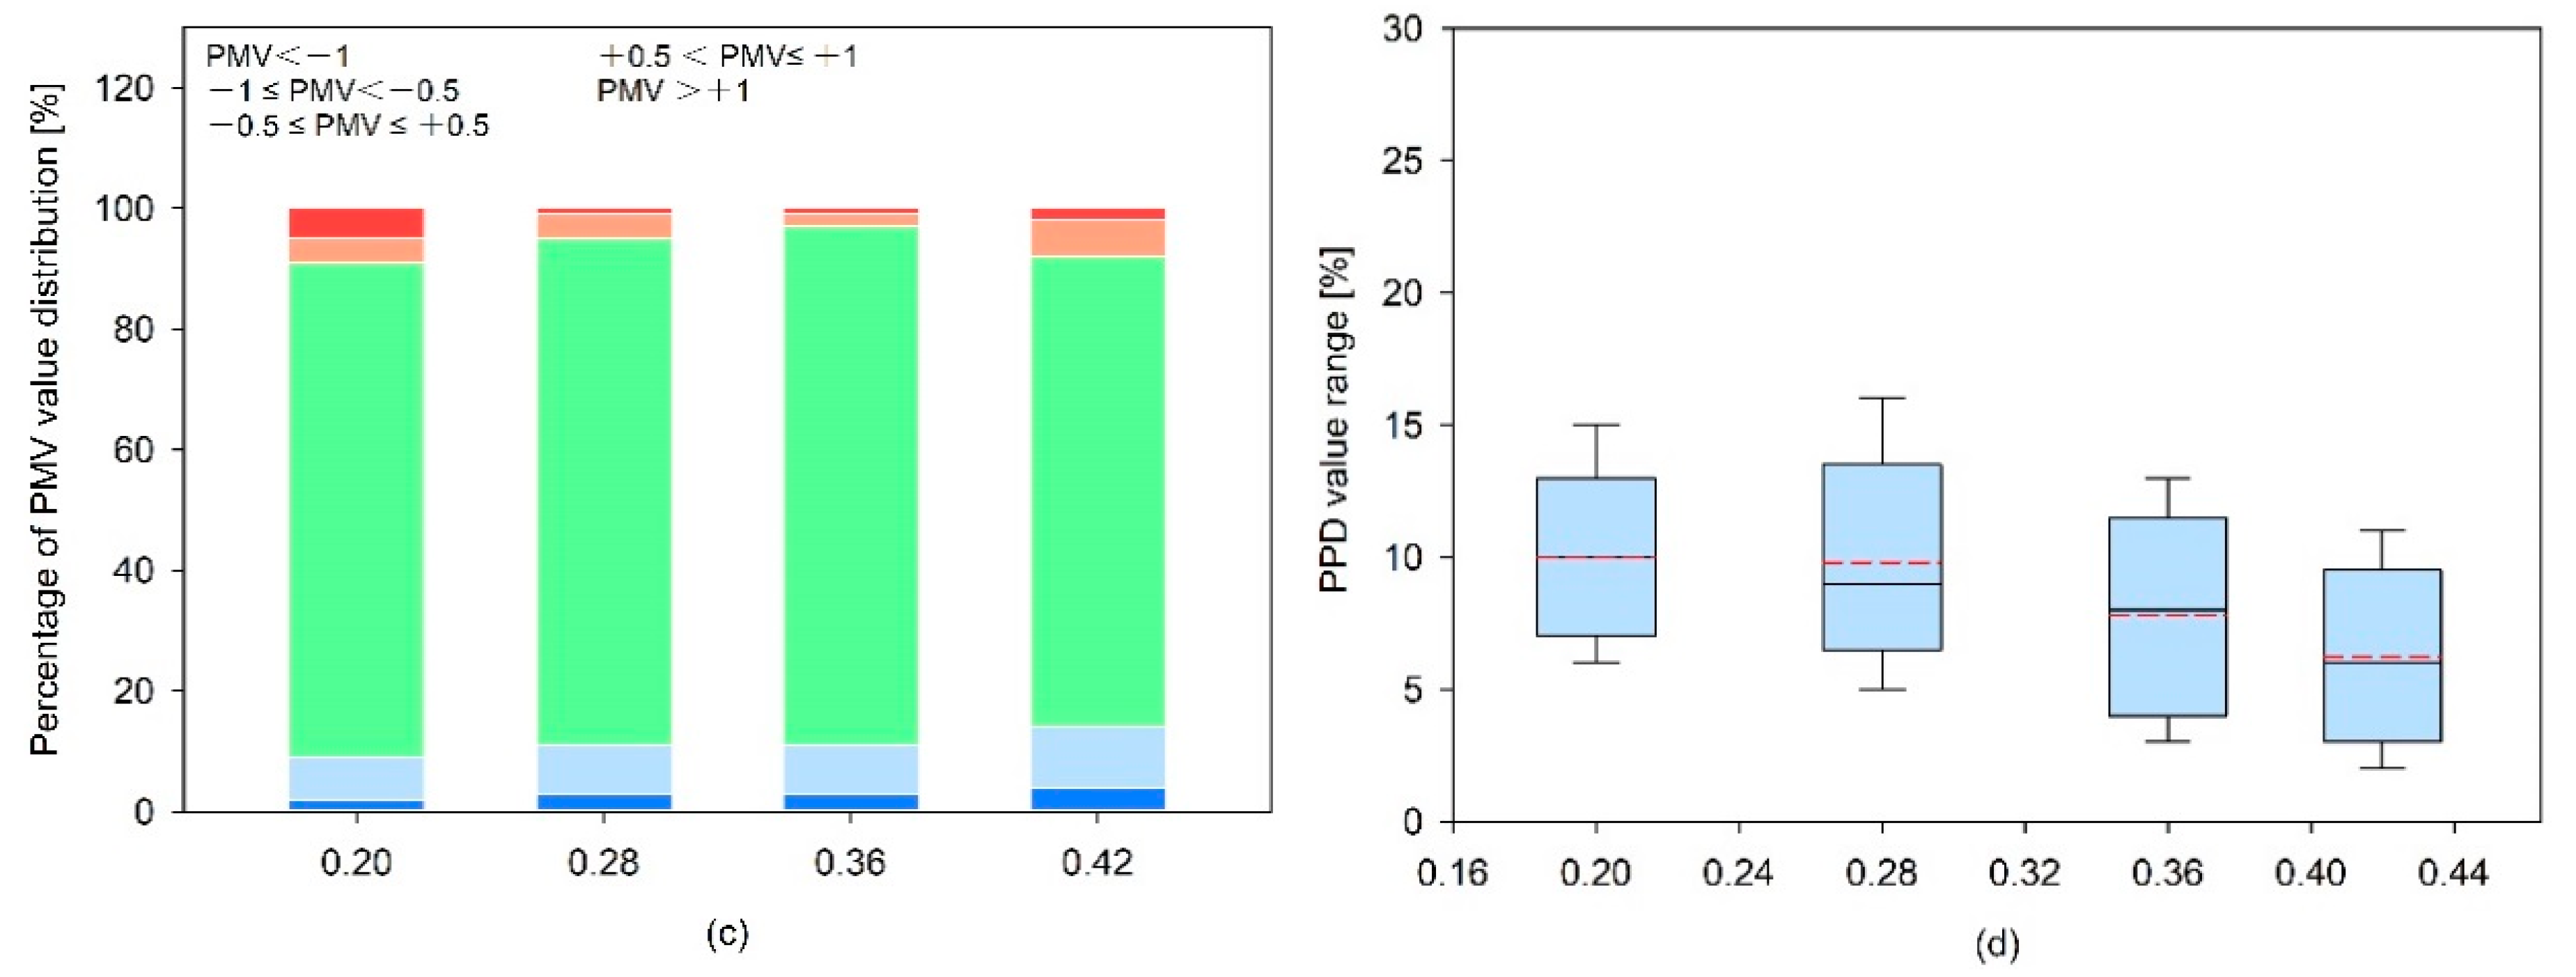
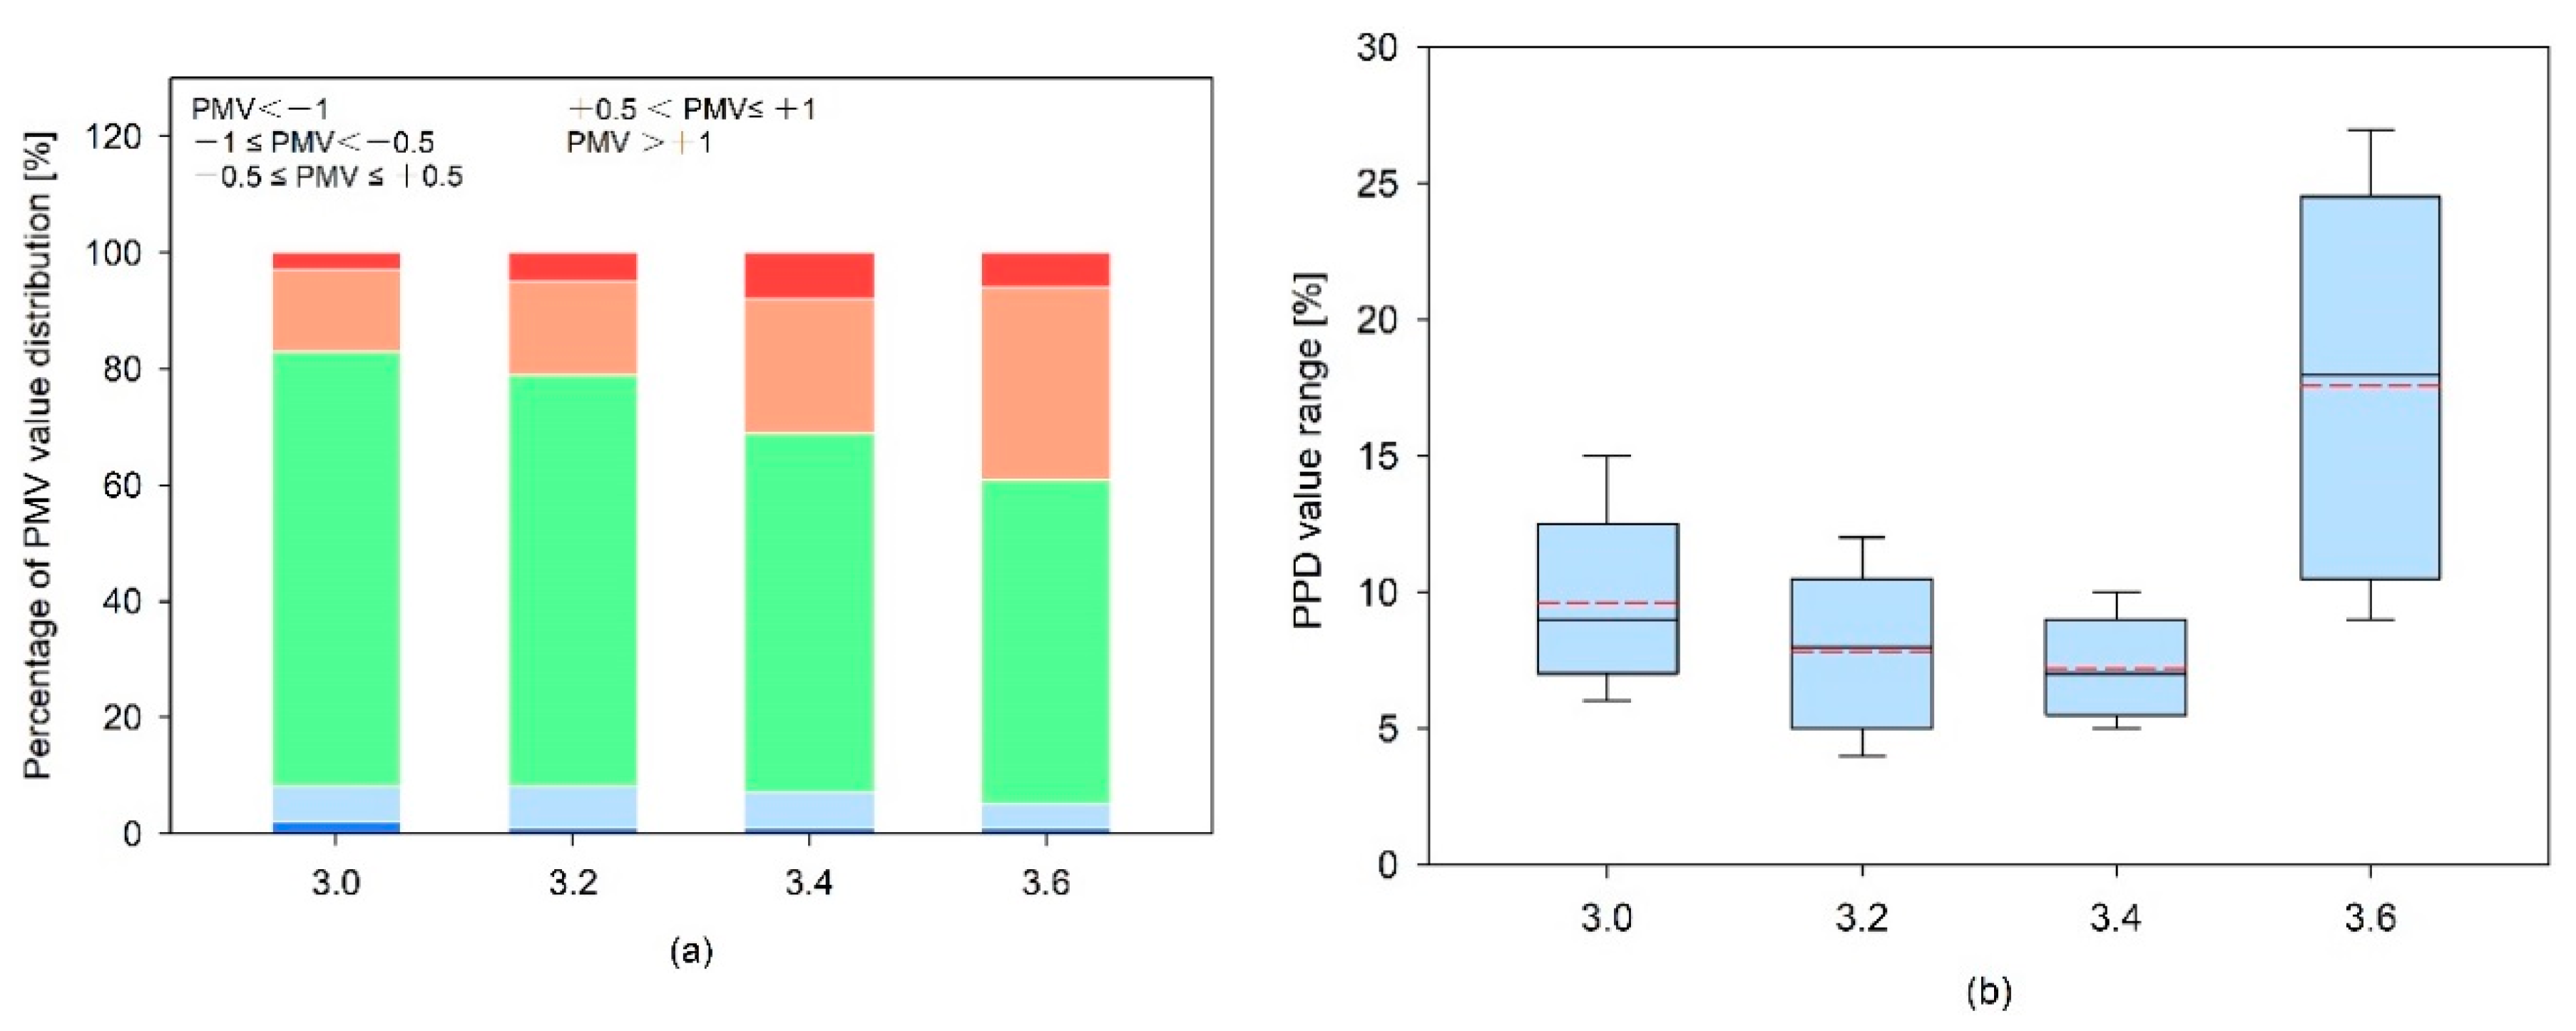
In this area, since cooling loads contribute the main portion of total energy demand, the U-value of exterior fenestration and SHGC become more important. From Figure 13a,b, based on optimal values of SHGC (0.28), only the impact for transforming U-value of exterior fenestration on comfort level was concentrated on. With changing the U-value from 3.4 to 3.6 W/(m2 K), the partition of light red increased significantly, which means the higher conductivity of fenestration led to a rapid rise for indoor temperature, and the total periods of thermal neutrality between the U-values were more than 78%, varying from 3.0 to 3.2 W/(m2 K), and the fluctuation ranges of PPD were both less than 10% in this range.
3.2.5. MZ—Kunming
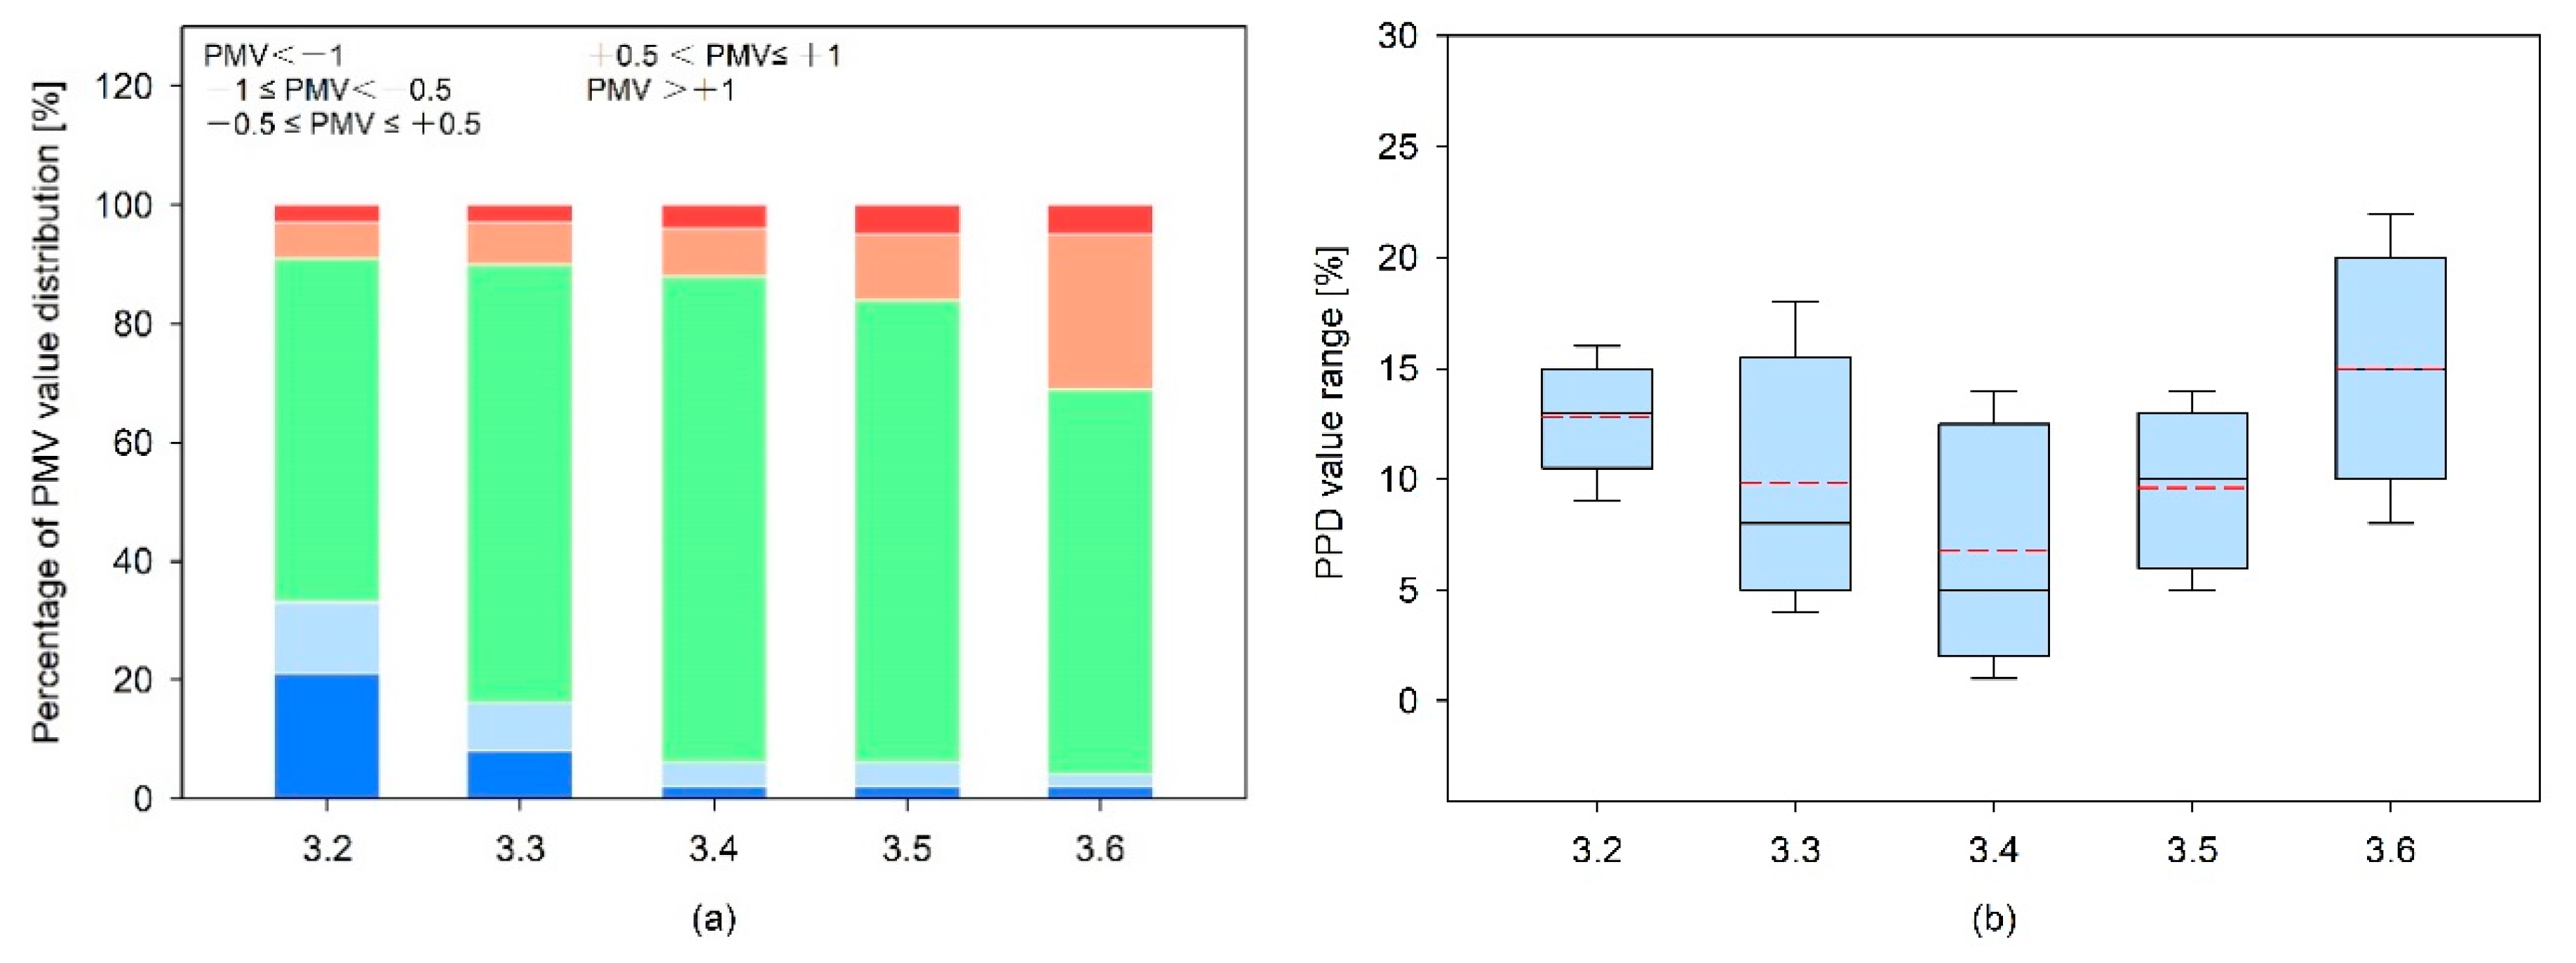
Just as in the situation of HSWW, only the impact of altering U-value on comfort level was focused on. As Figure 14a,b shows, by changing the U-value from 3.2 to 3.6 W/(m2 K), the comfort interval of level 1 increased first (from 3.2 to 3.4) and then decreased (from 3.4 to 3.6), and the total periods of thermal neutrality between the range of 3.3 to 3.5 W/(m2 K) were more than 78%. Also, the average values of PPD were all within 10%, respectively.
3.3. A Trade-Off Consideration between Energy Demand and Thermal Requirement
The calculation results above indicated the combination of sensitive parameters that minimized energy demand while maximizing teh thermal comfort condition for urban office buildings in five representative climatic regions of China. Annual end-use and total energy demand of parameter variations were compared with benchmark cases to evaluate the energy saving potential.
For SCZ, considering that the heating requirement dominates the larger part of energy utilization, although the solar energy can reduce the heat loads to some extent during the day, the heat loss at night is still much larger than that of the sun. Therefore, the primary consideration is to increase the heat storage performance of the building envelope. In other words, setting the larger thermal inertia of the surface material and appropriately increasing the thickness of the insulation layer can effectively improve the thermal delay of the building envelope, which can take the radiant heat of the day and contribute this to the night so as to reduce the initial heat loads of the next usage period. Similar strategies can also be applied to CZ, because the climate distribution is roughly the same as SCZ. One point which cannot be neglected is that the fenestration size with lower infiltration rate is also significant in these areas. The reason for this is that transparent glass is the most vulnerable part of the envelope and cold air permeation always exists, so only taking the envelope material, WWR, and infiltration rate into account seriously can achieve the unification of energy efficiency and thermal comfort. In terms of HSCW, avoiding overheating in summer and heating protection in winter should being weighed up. By optimizing the U-values of the exterior transparent/opaque envelope as well as the infiltration rate, approximately one fifth of the total energy consumption can be saved. Meanwhile, a higher level of comfort requirement can be achieved through transforming the layer of insulation materials. Since the overheating is dominant in HSWW, the practical approach is to coordinate the relationship between U-values of exterior window and SHGC, a larger value of SHGC will lead to the cooling loads increasing at an alarming rate, also resulting in discomfort indoors. When focusing on MZ, although temperature variations are minimum in the whole year, the SHGC and U-values of windows are also sensitive in this area, the former of which can provide free heat in winter but can also lead to overheating in summer, thus, the additional constraining factors (heat transfer coefficient of fenestration) seem more important for obtaining the higher comfort interval.
4. Conclusions
In this study, the optimization results of various parameters for each climate zone were presented with consideration of energy demands as well as thermal comfort. Firstly, the design parameters which were considered to be likely to affect energy utilization were extracted from the literature review, and five typical benchmark cases with climatic adaptability were established for further quantitative analysis. In addition, with the help of numerical simulation, it was found that the influence of parameters on different climatic zones are not the same, meanwhile, the parameter groups were set up according to the sensitivity level of each climate region to explore the maximum energy reduction. Lastly, a further coupling calculation of indoor thermal comfort based on the optimal energy consumption interval was conducted to search for the best thermal range with less energy demand. The main conclusions are summarized as follows:
- (1)
- In general, buildings oriented south have the best performance for energy consumption across all five climate zones, because they can make full use of the solar radiation and achieve the basic day-lighting requirement;
- (2)
- SCZ—Changchun: due to the fact that heat protection in winter is the most significant aspect, the insulation thickness, WWR, and infiltration are more sensitive when the thickness of EPS insulation varies from 0.125 m to 0.130 m and WWR is less than 0.24, and when the other parameters remain unchanged at the optimal values (infiltration rate is as small as possible), buildings in this climate can reach the maximum total energy demand reductions of about 18–24%. Meanwhile, with the improvement of the building envelope, a comfortable condition will be maintained at the higher level;
- (3)
- CZ—Beijing: similar to SCZ, the thermal insulation performance of the envelope structure is still an important issue in this area, and the biggest energy saving rate can reach approximately 15% when the EPS thickness is between 0.11 m to 0.13 m, with the best WWR range being from 0.2 to 0.42;
- (4)
- HSCW—Shanghai: since both energy demands (heating/cooling) should be taken into consideration in this area, the results showed that when the most important parameters of EPS insulation change from 0.09 m to 0.11 m, this can achieve the biggest energy reduction of 16–19%, and although it can reduce heating loads while continuing to increase the insulation layer, indoor discomfort (slight warm) will exist in summer;
- (5)
- HSWW—Haikou: as overheating is the main issue in this region, it is essential to take measures for avoiding high temperatures in summer to reduce the cooling loads. For one thing, maintaining the optimal value of SHGC and other subdominant parameters based on the simulation results invariably, and for another, setting the U-value of fenestration between 3.0 W/(m2 K) and 3.4 W/(m2 K), can receive the best saving of 5–7%, as well as guarantee a higher comfort level;
- (6)
- MZ—Kunming: comparing with HSWW, the crucial influence parameters are also SHGC and U-value of exterior fenestration, so it was found that a U-value between 3.3 W/(m2 K) and 3.5 W/(m2 K) while also keeping SHGC as small as possible based on local standards will lead to approximately 12–15% of total energy demand reduction.
However, there are still some important aspects which have not been considered in this paper, mainly the three points below:
- (1)
- The benchmark cases selected in this paper are all multistory buildings, but various geometries will inevitably lead to discrepancies in the shape coefficient and energy utilization;
- (2)
- The effect of shading was not considered in the calculation, nonetheless, it is widely used in HSWW and MZ to protect against the intense solar radiation, so as to decrease the total cooling loads of the building throughout the year;
- (3)
- Relative humidity is a crucial aspect for the thermal environment and safeguarding of the construction envelope, especially in HSWW, leading to the problem of excessive partial pressure of water-steam, which encourages mold growth.
Above all, this paper showed that the different parameters should be focused on during the early design process or while retrofitting old buildings, and the simulation results also further indicate that there is still much room for appropriate improvements in the local building energy efficiency codes.
Author Contributions
Conceptualization, Y.G.; methodology, Y.G., D.B.; software, Y.G.; investigation, Y.G., D.B.; formal analysis, D.B.; writing—original draft preparation, Y.G.; writing—review and editing, Y.G., D.B.; supervision, Y.G. All authors have read and agreed to the published version of the manuscript.
Funding
This research received no external funding.
Acknowledgments
The authors would like to thank the teachers and students from the University of Kitakyushu for their generous help.
Conflicts of Interest
The authors declare no conflict of interest.
References
- Giouri, E.D.; Tenpierik, M.; Turrin, M. Zero energy potential of a high rise office building in a Mediterranean climate: Using multi-objective optimization to understand the impact of designs towards zero-energy high-rise buildings. Energy Build. 2020, 209, 109666. [Google Scholar] [CrossRef]
- Sun, K.; Hong, T. A framework for quantifying the impact of occupant behavior on energy savings of energy conservation measures. Energy Build. 2017, 146, 383–396. [Google Scholar] [CrossRef] [Green Version]
- Al-Saggaf, A.; Nasir, H.; Taha, M. Quantitative approach for evaluating the building design features impact on cooling energy consumption in hot climates. Energy Build. 2020, 211, 109802. [Google Scholar] [CrossRef]
- Gercek, M.; Arsan, Z.D. Energy and environmental performance based decision support process for early design stages of residential buildings under climate change. Sustain. Cities Soc. 2019, 48, 101580. [Google Scholar] [CrossRef]
- China’s Ministry of Housing and Urban-rural Development. China’s Research Report on Building Energy Consumption; 2016; pp. 24–28.
- Atmaca, A.B.; Gedik, G.Z. Evaluation of mosques in terms of thermal comfort and energy consumption in a temperate-humid climate. Energy Build. 2019, 195, 195–204. [Google Scholar] [CrossRef]
- Bano, F.; Sehgal, V. Evaluation of energy-efficient design strategies: Comparison of the thermal performance of energy-efficient office buildings in composite climate, India. Sol. Energy 2018, 176, 506–519. [Google Scholar] [CrossRef]
- Alalouch, C.; Al-Saadi, S.; Alwaer, H.; Al-Khaled, K. Energy saving potential for residential buildings in hot climates: The case of Oman. Sustain. Cities Soc. 2019, 46, 101442. [Google Scholar] [CrossRef]
- Chi, F.; Yong, H.; Wang, R.; Li, G.; Peng, C. An investigation of optimal window-to-wall ratio based on changes in building orientations for traditional dwellings. Sol. Energy 2020, 195, 64–81. [Google Scholar] [CrossRef]
- Du, T.; Jansen, S.; Turrin, M.; van den Dobbelsteen, A. Effects of architectural space layouts on energy performance: A review. Sustainability 2020, 12, 1829. [Google Scholar] [CrossRef] [Green Version]
- Saikia, P.; Pancholi, M.; Sood, D.; Rakshit, D. Dynamic optimization of multi-retrofit building envelope for enhanced energy performance with a case study in hot Indian climate. Energy 2020, 197, 117263. [Google Scholar] [CrossRef]
- Zhang, S.; He, W.; Chen, D.; Chu, J.; Fan, H.; Duan, X. Thermal comfort analysis based on PMV/PPD in cabins of manned submersibles. Build. Environ. 2019, 148, 668–676. [Google Scholar] [CrossRef]
- Hwang, R.; Shih, W.; Huang, K. Performance-rating-based approach to formulate a new envelope index for commercial buildings in perspective of energy efficiency and thermal comfort. Appl. Energy 2020, 264, 114725. [Google Scholar] [CrossRef]
- Kim, K.; Kim, B.S.; Park, S. Analysis of design approaches to improve the comfort level of a small glazed-envelope building during summer. Sol. Energy 2007, 81, 39–51. [Google Scholar] [CrossRef]
- Baruch, G. Climate Considerations in Building and Urban Design; John Wiley and Sons Inc.: New York, NY, USA, 1998. [Google Scholar]
- Inanici, M.N.; Demirbilek, F.N. Thermal performance optimization of building aspect ratio and south window size in five cities having different climatic characteristics of Turkey. Build. Environ. 2000, 35, 41–52. [Google Scholar] [CrossRef]
- Bai, L.; Wang, S. Definition of new thermal climate zones for building energy efficiency response to the climate change during the past decades in China. Energy 2019, 170, 709–719. [Google Scholar] [CrossRef]
- China’s Ministry of Housing and Urban-rural Development. Code for Thermal Design of Civil Building; GB50176-2016; 2016; pp. 17–22.
- Zhang, A.; Bokel, R.; van den Dobbelsteen, A.; Sun, Y.; Huang, Q.; Zhang, Q. The effect of geometry parameters on energy and thermal performance of school buildings in cold climates of China. Sustainability 2017, 9, 1708. [Google Scholar] [CrossRef] [Green Version]
- Khalesi, J.; Goudarzi, N. Thermal comfort investigation of stratified indoor environment in displacement ventilation: Climate-adaptive building with smart windows. Sustain. Cities Soc. 2019, 46, 101354. [Google Scholar]
- Fernandez-Antolin, M.; del Rio, J.M.; Costanzo, V.; Nocera, F.; Gonzalez-Lezcano, R. Passive design strategies for residential buildings in different Spanish climate zones. Sustainability 2019, 11, 4816. [Google Scholar] [CrossRef] [Green Version]
- Xue, P.; Li, Q.; Xie, J.; Zhao, M.; Liu, J. Optimization of window to wall ratio with sunshades in China low latitude region considering daylighting and energy saving requirements. Appl. Energy 2019, 233, 62–70. [Google Scholar] [CrossRef]
- Shen, H.; Tzempelikos, A. Day-lighting and energy analysis of private offices with automated interior roller shades. Solar Energy 2012, 86, 681–704. [Google Scholar] [CrossRef]
- Feng, G.; Dou, B.; Xu, X.; Chi, D.; Sun, Y.; Hou, P. Research on energy efficiency design key parameters of envelope for nearly zero energy buildings in cold area. Procedia Eng. 2017, 205, 686–693. [Google Scholar] [CrossRef]
- Susorova, I.; Tabibzadeh, M.; Rahman, A.; Clack, H.L.; Elnimeiri, M. The effect of geometry factors on fenestration energy performance and energy savings in office buildings. Energy Build. 2013, 57, 6–13. [Google Scholar] [CrossRef]
- Goia, F. Search for the optimal window to wall ratio in office buildings in different European climates and the implications on total energy saving potential. Solar Energy 2016, 132, 467–492. [Google Scholar] [CrossRef]
- Zhao, M.; Kunzel, H.M.; Antretter, F. Parameters influencing the energy performance of residential buildings in different Chinese climate zones. Energy Build. 2015, 96, 64–75. [Google Scholar] [CrossRef]
- Wu, Z.; Li, N.; Wargocki, P.; Peng, J.; Li, J. Field study on thermal comfort and energy saving potential in 11 split air-conditioned office buildings in Changsha, China. Energy 2019, 182, 471–482. [Google Scholar] [CrossRef]
- Gartner, J.A.; Gray, F.M.; Auer, T. Assessment of the impact of HVAC system configuration and control zoning on thermal comfort and energy efficiency in flexible office spaces. Energy Build. 2020, 212, 109785. [Google Scholar] [CrossRef]
- Ming, R.; Yu, W.; Zhao, X.; Liu, Y.; Li, B.; Essah, E.; Yao, R. Assessing energy saving potentials of office buildings based on adaptive thermal comfort using a tracking-based method. Energy Build. 2020, 208, 109611. [Google Scholar] [CrossRef]
- Garcia, D.S.; Bellido, C.R.; Rio, J.; Fargallo, A.P. Towards the quantification of energy demand and consumption through the adaptive comfort approach in mixed mode office buildings considering climate change. Energy Build. 2019, 187, 173–185. [Google Scholar] [CrossRef]
- Wang, R.; Lu, S.; Feng, W. A three-stage optimization methodology for envelope design of passive house considering energy demand, thermal comfort and cost. Energy 2020, 192, 116723. [Google Scholar] [CrossRef]
- U.S. Department of Energy. Energy Plus Version 8.7 Documentation (Input Output Reference); 2016; pp. 51–59.
- U.S. Department of Energy. Energy Plus Version 8.7 Documentation (Engineering Reference); 2016; pp. 59–68.
- Dalong, L.; Liu, Y.; Xujie, H.; Jiaping, L. Review of globe solar radiation model for building energy efficiency analysis. J. Civ. Environ. Eng. 2015, 37, 101–108. [Google Scholar]
- Supit, K. A simple method to estimate global radiation. Sol. Energy 1998, 63, 147–160. [Google Scholar] [CrossRef]
- Wei, C.W.; Tso, C.Y. Energy consumption, indoor thermal comfort and air quality in a commercial office with retrofitted heat, ventilation and air conditioning (HVAC) system. Energy Build. 2019, 201, 202–215. [Google Scholar]
- Kleber, M.; Wagner, A. Investigation of indoor thermal comfort in warm-humid conditions at a German climate test facility. Build. Environ. 2018, 128, 216–224. [Google Scholar] [CrossRef]
- Fanger, P.O. Analysis and Applications in Environmental Engineering; 1970; pp. 244–250. [Google Scholar]
- Butera, F.M. Principles of thermal comfort. Renew. Sustain. Energy Rev. 1998, 2, 39–66. [Google Scholar] [CrossRef]
- Jang, M.S.; Koh, C.D.; Moon, I.S. Review of thermal comfort design based on PMV/PPD in cabins of Korean maritime patrol vessels. Build. Environ. 2007, 42, 55–61. [Google Scholar] [CrossRef]
- Wong, L.T.; Mui, K.W.; Hui, P.S. A multivariate-logistic model for acceptance of indoor environmental quality (IEQ) in offices. Build. Environ. 2008, 43, 1–6. [Google Scholar] [CrossRef]
- China’s Academy of Building Research. Evaluation Standard for Indoor Thermal Environment in Civil Buildings; GB50785-2012; 2012; pp. 56–58. [Google Scholar]
- China’s Academy of Building Research. Assessment Standard for Healthy Building; T/ASC 02-2016; 2016; pp. 79–82. [Google Scholar]
- China’s Ministry of Housing and Urban-rural Development. Design Code for Heating Ventilation and Air Conditioning of Civil Buildings; GB50736-2012; 2012; pp. 6–8.
- Lu, M.; Chao, B.; Zhou, X.; Li, M.; Zhang, J.; Ouyang, Q.; Zhu, Y. Can personal control influence human thermal comfort? A field study in residential buildings in China in winter. Energy Build. 2014, 72, 411–418. [Google Scholar] [CrossRef]
- Gou, S.; Nik, V.M.; Scartezzini, J.; Zhao, Q.; Li, Z. Passive design optimization of new-built residential buildings in Shanghai for improving indoor thermal comfort while reducing building energy demand. Energy Build. 2018, 169, 484–506. [Google Scholar] [CrossRef]
- Li, H.; Wang, S.; Cheung, H. Sensitivity analysis of design parameters and optimal design for zero/low energy buildings in subtropical regions. Appl. Energy 2018, 228, 1280–1291. [Google Scholar] [CrossRef]
- Wen, L.; Hiyama, K.; Koganei, M. A method for creating maps of recommended window-to-wall ratios to assign appropriate default values in design performance modeling: A case study of a typical office building in Japan. Energy Build. 2017, 145, 304–317. [Google Scholar] [CrossRef]
- Chen, S.; Levine, M.; Li, H.; Yowargana, P.; Xie, L. Measured air tightness performance of residential buildings in north China and its influence on district space heating energy use. Energy Build. 2012, 51, 157–164. [Google Scholar] [CrossRef]
Figure 1.
Building energy variation in China: 2001–2014.

Figure 2.
Study flow of optimization process.

Figure 3.
Climate classification and selection of sites.

Figure 4.
Variation percentage of energy demand for changing orientation [—]: (a) heating; (b) cooling; (c) total.
Figure 4.
Variation percentage of energy demand for changing orientation [—]: (a) heating; (b) cooling; (c) total.

Figure 5.
Variation percentage of energy demand for changing layer of expanded polystyrene (EPS) [m]: (a) heating; (b) cooling; (c) total.
Figure 5.
Variation percentage of energy demand for changing layer of expanded polystyrene (EPS) [m]: (a) heating; (b) cooling; (c) total.

Figure 6.
Variation percentage of energy demand for changing U-value of exterior fenestration [W/m2 K]: (a) heating; (b) cooling; (c) total.
Figure 6.
Variation percentage of energy demand for changing U-value of exterior fenestration [W/m2 K]: (a) heating; (b) cooling; (c) total.

Figure 7.
Variation percentage of energy demand for changing solar heat gain coefficient (SHGC) [—]: (a) heating; (b) cooling; (c) total.
Figure 7.
Variation percentage of energy demand for changing solar heat gain coefficient (SHGC) [—]: (a) heating; (b) cooling; (c) total.

Figure 8.
Variation percentage of energy demand for changing window to wall ratio (WWR) (south/north) [—]: (a) heating—S; (b) cooling—S; (c) total—S; (d) heating—N; (e) cooling—N; (f) total—N.
Figure 8.
Variation percentage of energy demand for changing window to wall ratio (WWR) (south/north) [—]: (a) heating—S; (b) cooling—S; (c) total—S; (d) heating—N; (e) cooling—N; (f) total—N.

Figure 9.
Variation percentage of energy demand for changing infiltration rate [h−1]: (a) heating; (b) cooling; (c) total.
Figure 9.
Variation percentage of energy demand for changing infiltration rate [h−1]: (a) heating; (b) cooling; (c) total.

Figure 10.
PMV/PPD values of various EPS thicknesses [m] and WWR [—] for a severe cold zone (SCZ)—Changchun: (a) PMV values for changing EPS thickness; (b) PPD values for changing EPS thickness; (c) PMV values for changing WWR; (d) PPD values for changing WWR.
Figure 10.
PMV/PPD values of various EPS thicknesses [m] and WWR [—] for a severe cold zone (SCZ)—Changchun: (a) PMV values for changing EPS thickness; (b) PPD values for changing EPS thickness; (c) PMV values for changing WWR; (d) PPD values for changing WWR.


Figure 11.
PMV/PPD values of various EPS thickness [m] and WWR [—] for a cold zone (CZ)—Beijing: (a) PMV values for changing EPS thickness; (b) PPD values for changing EPS thickness; (c) PMV values for changing WWR; (d) PPD values for changing WWR.
Figure 11.
PMV/PPD values of various EPS thickness [m] and WWR [—] for a cold zone (CZ)—Beijing: (a) PMV values for changing EPS thickness; (b) PPD values for changing EPS thickness; (c) PMV values for changing WWR; (d) PPD values for changing WWR.


Figure 12.
PMV/PPD values of various EPS-thickness [m] for a hot summer and cold winter (HSCW)—Shanghai: (a) PMV values for changing EPS thickness; (b) PPD values for changing EPS thickness.
Figure 12.
PMV/PPD values of various EPS-thickness [m] for a hot summer and cold winter (HSCW)—Shanghai: (a) PMV values for changing EPS thickness; (b) PPD values for changing EPS thickness.

Figure 13.
PMV/PPD values of various U-value of exterior fenestration [W/m2 K] for a hot summer and warm winter zone HSWW—Haikou: (a) PMV values for changing U-values; (b) PPD values for changing U-values.
Figure 13.
PMV/PPD values of various U-value of exterior fenestration [W/m2 K] for a hot summer and warm winter zone HSWW—Haikou: (a) PMV values for changing U-values; (b) PPD values for changing U-values.

Figure 14.
PMV/PPD values of various U-value of exterior fenestration [W/m2 K] for mild zone (MZ)—Kunming: (a) PMV values for changing U-values; (b) PPD values for changing U-values.
Figure 14.
PMV/PPD values of various U-value of exterior fenestration [W/m2 K] for mild zone (MZ)—Kunming: (a) PMV values for changing U-values; (b) PPD values for changing U-values.


Table 1.
Geographical data of selected cities.
| Climate Zone | Sites | Meteorological Station | tmin·m (°C) | tmax·m (°C) | ||
|---|---|---|---|---|---|---|
| Latitude (°) | Longitude (°) | Elevation (m) | ||||
| SCZ | Changchun | 125.22 | 43.90 | 238 | −14.4 | 23.7 |
| CZ | Beijing | 116.28 | 39.93 | 55 | −2.9 | 27.1 |
| HSCW | Shanghai | 121.43 | 31.17 | 3 | 4.9 | 28.5 |
| HSWW | Haikou | 110.25 | 20.00 | 64 | 18.6 | 29.1 |
| MZ | Kunming | 102.65 | 25.00 | 1887 | 9.4 | 20.3 |
Table 2.
Priority level of design parameters.
| Design Parameters | Climate Zones/Cities | ||||
|---|---|---|---|---|---|
| SCZ | CZ | HSCW | HSWW | MZ | |
| Changchun | Beijing | Shanghai | Haikou | Kunming | |
| Orientation [—] | ● | ● | ○ | ○ | ○ |
| Layer of EPS insulation [m] | ● | ● | ● | ● | ● |
| U-value of fenestration [W/(m2 K)] | ● | ● | ● | ● | ● |
| SHGC [—] | ○ | ○ | ○ | ● | ● |
| WWR [—] | ● | ● | ○ | ○ | ○ |
| Infiltration rate [h−1] | ● | ● | ● | ○ | ● |
Notes: ● represents the most sensitive design parameters; ○ are the subdominant design parameters.
Table 3.
Corresponding relation between predicted mean vote (PMV) values and 7-point thermal sensation index.
Table 3.
Corresponding relation between predicted mean vote (PMV) values and 7-point thermal sensation index.
| Thermal Sensation | Cold | Cool | Slight Cool | Neutral | Slight Warm | Warm | Hot |
|---|---|---|---|---|---|---|---|
| PMV | −3 | −2 | −1 | 0 | +1 | +2 | +3 |
Table 4.
Comfort level based on PMV- predicted percentage dissatisfied (PPD).
| Category | Assessment Criteria | |
|---|---|---|
| 1 | −0.5 ≤ PMV ≤ +0.5 | PPD ≤ 10% |
| 2 | −1 ≤ PMV < −0.5/+0.5 < PMV ≤ +1 | 10% < PPD ≤ 25% |
| 3 | PMV < −1/PMV > +1 | PPD > 25% |
Table 5.
Geometrical information of benchmark models.
| Basic Information | SCZ | CZ | HSCW | HSWW | MZ |
|---|---|---|---|---|---|
| Changchun | Beijing | Shanghai | Haikou | Kunming | |
| Plan area (m2) | 1628.6 | 1948.8 | 2012.2 | 1582.4 | 1687.2 |
| Number of layers (—) | 6 | 6 | 6 | 6 | 6 |
| Story height (m) | 3.5 | 3.5 | 3.6 | 3.6 | 3.5 |
| Building height (m) | 22.2 | 22.2 | 22.8 | 22.8 | 22.4 |
Table 6.
Summary of building envelope (opaque/transparent) conditions for benchmark models.
| Climate Zones | Exterior Wall | Exterior Fenestration | WWR [—] | ||
|---|---|---|---|---|---|
| K-Values [W/(m2 K)] | EPS-Thickness [m] | U-Values [W/(m2 K)] | SHGC [—] | ||
| SCZ | 0.48 | 0.065 | 1.46 | 0.570 | 0.35 |
| CZ | 0.42 | 0.076 | 1.98 | 0.428 | 0.4 |
| HSCW | 0.74 | 0.036 | 2.35 | 0.328 | 0.4 |
| HSWW | 1.38 | 0.012 | 2.28 | 0.30 | 0.5 |
| MZ | 1.24 | 0.015 | 2.40 | 0.332 | 0.6 |
Table 7.
Summary of other boundary conditions for benchmark models.
| Climate Zones | Thermal Interference | Design Temperature | Relative Humidity [%] | ||||
|---|---|---|---|---|---|---|---|
| People [W/m2] | Lighting [W/m2] | Electric Equipment [W/m2] | Air Changes [h−1] | Winter [°C] | Summer [°C] | ||
| SCZ | 11.3 | 9.0 | 8.2 | 0.45 | 16 (20.5) | 28 (25.6) | 40–60 |
| CZ | 0.5 | ||||||
| HSCW | 0.5 | ||||||
| HSWW | 1 | ||||||
| MZ | 1 | ||||||
Table 8.
Value codomain of the chosen parameters.
| Design Parameters | Climate Zones | Number | ||||
|---|---|---|---|---|---|---|
| SCZ | CZ | HSCW | HSWW | MZ | ||
| Orientation [—] | south, southeast, southwest, west, east | 25 | ||||
| Layer of EPS board [m] | 0.02, 0.04, 0.06, 0.08, 0.10, 0.12 | 0.01, 0.02, 0.04, 0.06, 0.08, 0.10, 0.12 | 32 | |||
| U-value of fenestration [W/(m2 K)] | 1.4, 1.6, 1.8, 2.0, 2.2, 2.4, 2.6, 2.8 | 1.8, 2.0, 2.2, 2.4, 2.6, 2.8, 3.0, 3.2, 3.4 | 2.0, 2.2, 2.4, 2.6, 2.8, 3.0, 3.2, 3.4, 3.6, 3.8, 4.0 | 47 | ||
| SHGC [—] | — | 0.3, 0.4, 0.5, 0.6, 0.7 | 20 | |||
| WWR [—] | 0.2, 0.3, 0.4, 0.5, 0.6, 0.7, 0.8 south and north separately | 70 | ||||
| Infiltration rate [h−1] | 0.1, 0.2, 0.4, 0.6, 0.8, 1.0, 1.2, 1.4, 1.6, 1.8 | 50 | ||||
Notes: Section 3.1.1, Section 3.1.2, Section 3.1.3, Section 3.1.4, Section 3.1.5 and Section 3.1.6 adopted the method of single-objective control variable to seek the sensitivity degree of each parameter; Section 3.1.7 used the multi-objective method to calculate the sensitivity parameter groups.
Table 9.
The optimal values/range of parameters results for each climate zone.
| Design Parameters | Climate Zones | ||||
|---|---|---|---|---|---|
| SCZ | CZ | HSCW | HSWW | MZ | |
| Changchun | Beijing | Shanghai | Haikou | Kunming | |
| Orientation [—] | ○ South | ○ South | ○ South | ○ South | ○ South |
| Layer of EPS board [m] | ● 0.115–0.13 | ● 0.1–0.13 | ● 0.08–0.12 | ○ 0.012 | ○ 0.02 |
| U-value of fenestration [W/(m2 K)] | ○ 1.28 | ○ 1.28 | ● 1.78 | ● 3.0–3.60 | ● 3.20–3.60 |
| SHGC [—] | ○ 0.570 | ○ 0.5 | ○ 0.39 | ● 0.28 | ● 0.30 |
| WWR [—] | ● 0.2–0.32 | ● 0.2–0.42 | ○ 0.2–0.4 | ○ 0.2–0.6 | ○ 0.2–0.6 |
| Infiltration rate [h−1] | ● 0.1 | ● 0.1 | ● 0.1 | ○ 1 | ○ 1 |
Notes: ● represents the most sensitive design parameters; ○ is the subdominant design parameters.
© 2020 by the authors. Licensee MDPI, Basel, Switzerland. This article is an open access article distributed under the terms and conditions of the Creative Commons Attribution (CC BY) license (http://creativecommons.org/licenses/by/4.0/).
Share and Cite
MDPI and ACS Style
Guo, Y.; Bart, D. Optimization of Design Parameters for Office Buildings with Climatic Adaptability Based on Energy Demand and Thermal Comfort. Sustainability 2020, 12, 3540. https://0-doi-org.brum.beds.ac.uk/10.3390/su12093540
AMA Style
Guo Y, Bart D. Optimization of Design Parameters for Office Buildings with Climatic Adaptability Based on Energy Demand and Thermal Comfort. Sustainability. 2020; 12(9):3540. https://0-doi-org.brum.beds.ac.uk/10.3390/su12093540
Chicago/Turabian StyleGuo, Yuang, and Dewancker Bart. 2020. "Optimization of Design Parameters for Office Buildings with Climatic Adaptability Based on Energy Demand and Thermal Comfort" Sustainability 12, no. 9: 3540. https://0-doi-org.brum.beds.ac.uk/10.3390/su12093540
Note that from the first issue of 2016, this journal uses article numbers instead of page numbers. See further details here.