Effects and Mechanisms of Phosphate Activation in Paddy Soil by Phosphorus Activators
by
 ,
,
Huanli Yao
1 ,
,
Xian Chen
1,2,
Junying Yang
1,
Jihong Li
1,
Jiale Hong
1,
Yueming Hu
1,3 and
Xiaoyun Mao
1,2,3,* 1
College of Natural Resources and Environment, South China Agricultural University, Guangzhou 510642, Guangdong, China
2
Guangdong Provincial Key Laboratory of Eco-Circular Agriculture, South China Agricultural University, Guangzhou 510642, Guangdong, China
3
Guangdong Provincial Key Laboratory for Land Use and Consolidation, South China Agricultural University, Guangzhou 510642, Guangdong, China
*
Author to whom correspondence should be addressed.
Sustainability 2020, 12(9), 3917; https://0-doi-org.brum.beds.ac.uk/10.3390/su12093917
Submission received: 26 March 2020
/
Revised: 3 May 2020
/
Accepted: 4 May 2020
/
Published: 11 May 2020
(This article belongs to the Section Environmental Sustainability and Applications)
Abstract
:Phosphorus (P) build-up in agricultural soils as a consequence of excessive P fertilizer application necessitates the exploration of soil P pool for crop supply. We conducted a soil incubation experiment, pot experiments, and field experiments to study the effects of different P activators (Pas) (humic acid, lignosulfonate sodium, and biochemical humic acid) on soil phosphate fraction, rice yield, and P loss. Through chemical analyses and microbial community structure measurement, we found that Pas significantly increased paddy soil water-soluble P (WSP), available P, Fe-P, and relative abundances of P-mineralizing and P-solubilizing microorganisms, whereas they decreased Al-P and microbial alpha diversity. Our pot experiment results showed that the application of Pas significantly reduced soil P loss and resulted in grain yield comparable to those obtained by fertilization with P fertilizers, and significantly higher than those in the control plants. The results of the field experiment suggested that Pas are able to increase rice yield more significantly than P fertilizers and improve the P utilization efficiency of rice plants. We conclude that application of Pas was more effective in reducing P leaching, soil total P, WSP, and Olsen P than P fertilizers during rice harvest.
1. Introduction
Phosphorus (P) is an essential nutrient for plant growth, and is often applied to most agricultural soils to increase crop production [1]. For a long time, P fertilizers have played an important role in replenishing soil available P and promoting crop growth. However, when applied to soil, P fertilizers are rapidly fixed by ions such as calcium (Ca), aluminum (Al), and iron (Fe), thereby becoming sparingly bioavailable [2]. Since the 1980s, the application of P fertilizer in China has been rapidly increasing. Consequently, the excessive P has been building up in agricultural soils. Until 2010, 5.9 Mt of P had accumulated in the soils of the cultivated lands in China, with an average of 240 kg ha−1, which is approximately ten times higher than the average in 1980 [3,4]. In the agricultural soils of South China, P accumulates at an annual rate of approximately 68 kg ha−1 [4,5].
Studies showed that in the conditions when Olsen P accumulation exceeds 60 mg kg−1, P is more likely to be lost by runoff [6]. It was estimated that annual P loss from agriculture in China is 2.2 kg ha−1. Phosphates are lost from the soils, mainly together with colloids and/or particulates by runoff to surface water bodies [7,8], causing substantial environmental problems, such as eutrophication, biodiversity losses in aquatic ecosystems, algal blooms, and so on [9,10]. According to the statistics of the first national survey of pollution sources in China, the contribution of crop cultivation to P loss from the environment was 26% [4]. In 2015, the State Council of China issued the Opinions on Ways to Speed up the Transformation of Agricultural Development Modes, stating that P fertilizer usage must be limited in order to minimize the impact of agricultural development on the environment [10].
Some researchers believe that rational utilization of P fixed in soils can not only mitigate agricultural nonpoint source pollution and protect phosphorus resources, but also sustain maximum crop yield for 100 years [11]. As the application of chemical P fertilizers is becoming a great concern, finding ways for achieving efficient utilization of soil P has caught researchers’ attention. Studies showed that P-solubilizing microorganisms are effective P-mobilisers. They produce an array of metabolites, such as organic acids, which drive the solubilization of moderately soluble inorganic P in soils, and they excrete enzymes that stimulate root growth, such as phosphatase [12,13,14]. However, as microbial enrichment and acclimatization are complex processes and microbial growth is greatly affected by environmental conditions, the production of biofertilizers and their agronomic effectiveness need to be improved [11]. In recent years, organic fertilizers have captured the interest of many researchers because of their strong P-mobilizing effects [15,16]. On one hand, soil inorganic P is solubilized by organic acids in organic fertilizers [17]; on the other hand, P fixation in soil is reduced when the P-binding sites are occupied by organic functional groups from organic fertilizers [18]. In addition, the inorganic P from organic fertilizers can be rapidly absorbed and utilized by crops. However, organic fertilizers are usually applied in large amounts with uncontrollable P loss risks [19,20]. Studies showed that total P (TP) concentration in leachates from soil fertilizer treated with organic fertilizers was 1.8–123 times higher than that of the control, while TP mass loss was 42.1–155 times higher than that of the control [17]. Because of the large volume, slow effectiveness, and inconvenient application of organic fertilizers, farmers in China still mainly use chemical P fertilizers, and the accumulative environmental risk of P in arable lands has been continuously increasing.
Our previous studies showed that organic molecules bearing certain functional groups can convert low-grade phosphate rock powder (PRP) into highly efficient fertilizers, which slowly release P via its complexation with metallic ions (e.g., Al3+ and Fe2+). After binding with organic molecules, the physical, chemical, and biological activities of PRP are enhanced, ensuring the continuous dynamic release of P [21,22]. Therefore, we hypothesized that applying such P-activators (Pas) in cultivated land will activate the soil P pool and reduce the application of P fertilizer, thus reducing the environmental risk. This study aimed to investigate the effects of Pas in activating the soil P pool and reveal the mechanisms.
In this study, we analyzed the dynamic changes in P fractions in a soil incubation experiment with the application of Pas, and we discussed the effects of Pas on soil P mobility. Afterwards, a pot culture experiment was carried out to investigate the effects of the application of Pas on P loss from paddy soil and rice growth. Finally, a field experiment was conducted to study the effects of Pas on rice growth and P utilization. Our hypothesis was that the application of Pas would promote the transformation of inorganic P in soil, improve the bioavailability of soil, and promote the growth of crops.
2. Materials and Methods
2.1. Phosphate-Activators and Soils
The three Pas used in this research were humic acid (HA), lignosulfonate sodium (LS), and biochemical humic acid (BCHA). HA contained 90% of fulvic acid (FA), and it had 79.61% of organic matter content, 0.1% of P2O5 content, and a pH of 5.15. LS had a purity of 98%, P2O5 content of 0.12%, and a pH of 7.60. BCHA was made of food waste mixture which contained 5% nitrogen, 1% K2O, 0.11% P2O5, and 77.97% organic matter, with a pH of 5.89.
In order to study the activation effects of activators on different soils, two kinds of soils were used: Pot and incubation experiments soil with rich available P, and field experiment soil with low available P. The soil used in the pot and incubation experiments was collected from the 0–20 cm surface layer of a paddy field in South China Agricultural University Farm in Guangzhou (N23°09′28.87″, E113°21′27.91″). Soil samples were air-dried, ground, and passed through a 2 mm sieve before further analyses, and their basic properties were: pH 5.96, total N 0.05%, total P 0.06%, total K 1.30%, water-soluble P 26.70 mg kg−1, Olsen P 107.07 mg kg−1, organic P 17.27 mg kg−1, and organic matter 3.56%. The basic properties of the soil in the field experiment were: pH 5.04, EC 0.10 mS·cm−1, organic matter 31.87 g kg−1, hydrolysable N 190.1 mg·kg−1, available P 15.98 mg kg−1, and available K 65.21 mg kg−1.
2.2. Soil Incubation Experiment
Four treatments were set up as follows: (1) Control (CK1) with no added PA; (2) treatment HA with HA added; (3) treatment LS with LS added; and (4) treatment BCHA with BCHA added. The activators were added in concentrations of 10 g·kg−1 of air-dried soil. For HA, LS, and BCHA treatments, a total amount of 100 g of paddy soil and the corresponding PA were mixed thoroughly and placed into a 180 mL rigid plastic cup (with upper and lower diameters of 7 and 5 cm, respectively). For each treatment, 18 cups were prepared as described above, whereas the cups for CK1 contained only 100 g of soil. All cups were transferred in an incubator set at 25 °C. During incubation, the water layer over the soil surface was maintained at 1 cm in each cup. Soil samples were taken at days 5, 10, 20, 30, 45, and 60, air-dried, and analyzed for WSP and Olsen P using the molybdenum blue method [23]. Three cups of soil (0.50g soil per cup) were taken from each treatment, and 3 repetitions were determined. In addition, P fractionation was performed according to Chang and Jackson [24] with some modifications. Briefly, 1.00g soil was first extracted with 1 mol·L−1NH4Cl. The suspension was centrifuged, and the supernatant solution discarded. This was followed by 0.5 mol·L−1 NH4F for Al-P extraction. The residues were then treated with 0.1 mol·L−1 NaOH for Fe-P determination, followed by 0.3 mol·L−1 Na3C6H5O7 and Na2O4S2 for measuring O-P. The remaining sample remnant was extracted with 0.5 mol·L−1 H2SO4 for Ca-P. All extraction solutions were tested for P concentrations using the molybdenum blue method [23].
At day 50, soil samples were taken for 16S rDNA high-throughput sequencing. Operational taxonomic units (OTUs) of the V4–V5 region were analyzed on an Illumina HiSeq 2500 platform. Based on the measured OUT, alpha diversity was estimated using QIIME [25]. See URL for specific calculation method and program code [26].
2.3. Pot Culture Experiment
Five treatments were set up with four replicates: RCK0 with no application of P fertilizers; RCK1 with application of superphosphate (SP) (100 mg P2O5·kg−1); and HA, LS, and BCHA treatments with applications of 2 g·kg−1 of HA, LS, and BCHA, respectively. Plastic buckets were used for this experiment. A hole was made in the middle of each bucket bottom and nylon net was placed over the hole before adding 5 kg of soil. The bucket was then placed inside another bucket (with no holes) for leachate collection.
The Pas and superphosphate were mixed thoroughly with the soil. In all five treatments, urea and potassium chloride were used as N and K fertilizers, respectively. Additionally, the amounts of N and K provided by the Pas were taken into account. Three days after the application of base fertilizers (50 mg N·kg−1 and 80 mg K2O·kg−1), rice seedlings (Oryza sativa L. var. Huahang31, BBCH code: 13–15) from Guangdong Academy of Agricultural Sciences were transplanted into the buckets. N fertilizer was applied again at 30, 30, and 40 mg N·kg−1, respectively, on 5, 15, and 30 days after rice transplanting, and 30 days after rice transplanting, K fertilizer was applied again at 70 mg K2O·kg−1.
The experiment was conducted in a net house of the College of Natural Resources and Environment of South China Agricultural University, from 2 April to 5 July 2019. Rice was transplanted on 2 April with three holes per bucket and three seedlings per hole. Starting from the second day after transplanting, the rice was watered every day in order to maintain a 3–5 cm water layer over the soil surface until the late tillering stage, and then the soil was left to dry over 2–3 days after small cracks appeared at the soil surface.
Leachates were collected 3, 6, 10, 20, 30, and 40 days after rice transplanting. We mixed 5 mL of leachates with 20 mL of 5% potassium persulfate and digested the mix in an autoclave (Shanghai Shen’an Medical Instrument Factory, Shanghai, China) at 120 °C and 1.1 kg/cm2 for 30 min. TP was quantified spectrophotometrically using the molybdenum blue method [23], and the cumulative P loss (CPL) was calculated according to the following Equation (1):
where n is the number of times to collect the solution; C is the P concentration of the leaching solution; and V is the volume of the leaching solution.
Rice was harvested on 5 July 2019. Rice biomass and grain yield were recorded. After 3 days of harvest, the soil samples were air-dried and ground to pass a 100-mesh sieve. Soil Olsen P and WSP were extracted with 0.5 mol·L−1 NaHCO3 and deionized-water, respectively, soil was digested with concentrated H2SO4-HclO4 for TP determination, and P concentrations in all extraction and digestion solutions were determined using the molybdenum blue method [23].
2.4. Field Experiment
Three treatments were set up as follows: T0 with no application of P fertilizers; T1 with application of superphosphate (2.5 kg SP/100 m2); and T2 with applications of 1.25 kg SP/100 m2 and 1.25 kg PA/100 m2 (PA refers to BCHA). Each treatment was set up with three plots, each plot with an area of 100 m2.
The experiment was conducted in Yongbiao village, Sulong Town, Yunfu City, Guangdong Province (N22°54′54.90″, E112°02′40.31″) from July to October 2019. Rice (Oryza sativa L. var. Meixiangzhan, BBCH code: 13–15) from Guangdong Academy of Agricultural Sciences was transplanted on 30 July 2019 and harvested on 22 October 2019. After harvest, soil samples were air-dried, ground to pass a 100-mesh sieve, and rice biomass and grain yield were recorded. TP of straw and rice was determined to calculate P utilization (PU) according to the following, Equations (2) and (3):
where PP is the total amount of P absorbed by the plants (g/100 m2); PC is the P concentration (g·kg−1); and Y is the yield (kg/100 m2).
where PPPF is the PP in treatment with P application; PPnPF is the PP in treatment without P application; and PF is the total amount of P in the fertilizers applied.
PP = PCrice × Yrice + PCstraw × Ystraw,
PU = (PPPF − PPnPF)/PF,
2.5. Statistical Analysis
Each treatment in this study was applied in a randomized design. The main effects of the test were the application and types of Pas, the response variables were soil P fraction, soil P loss, rice growth effect, and rice P use efficiency. Data were analyzed by one-way analysis of variance (ANOVA), and treatment means were separated by Duncan’s multiple-range test using the SPSS software (Version 24.0, IBM, New York, USA). Variance heterogeneity test was carried out on the data of the experiments, and a P < 0.05 was considered to be statistically significant. Graphs were plotted using Microsoft Excel 2010 and Origin Pro 2018.
3. Results
3.1. Soil P Activation During Incubation
3.1.1. Changes in Olsen P and WSP
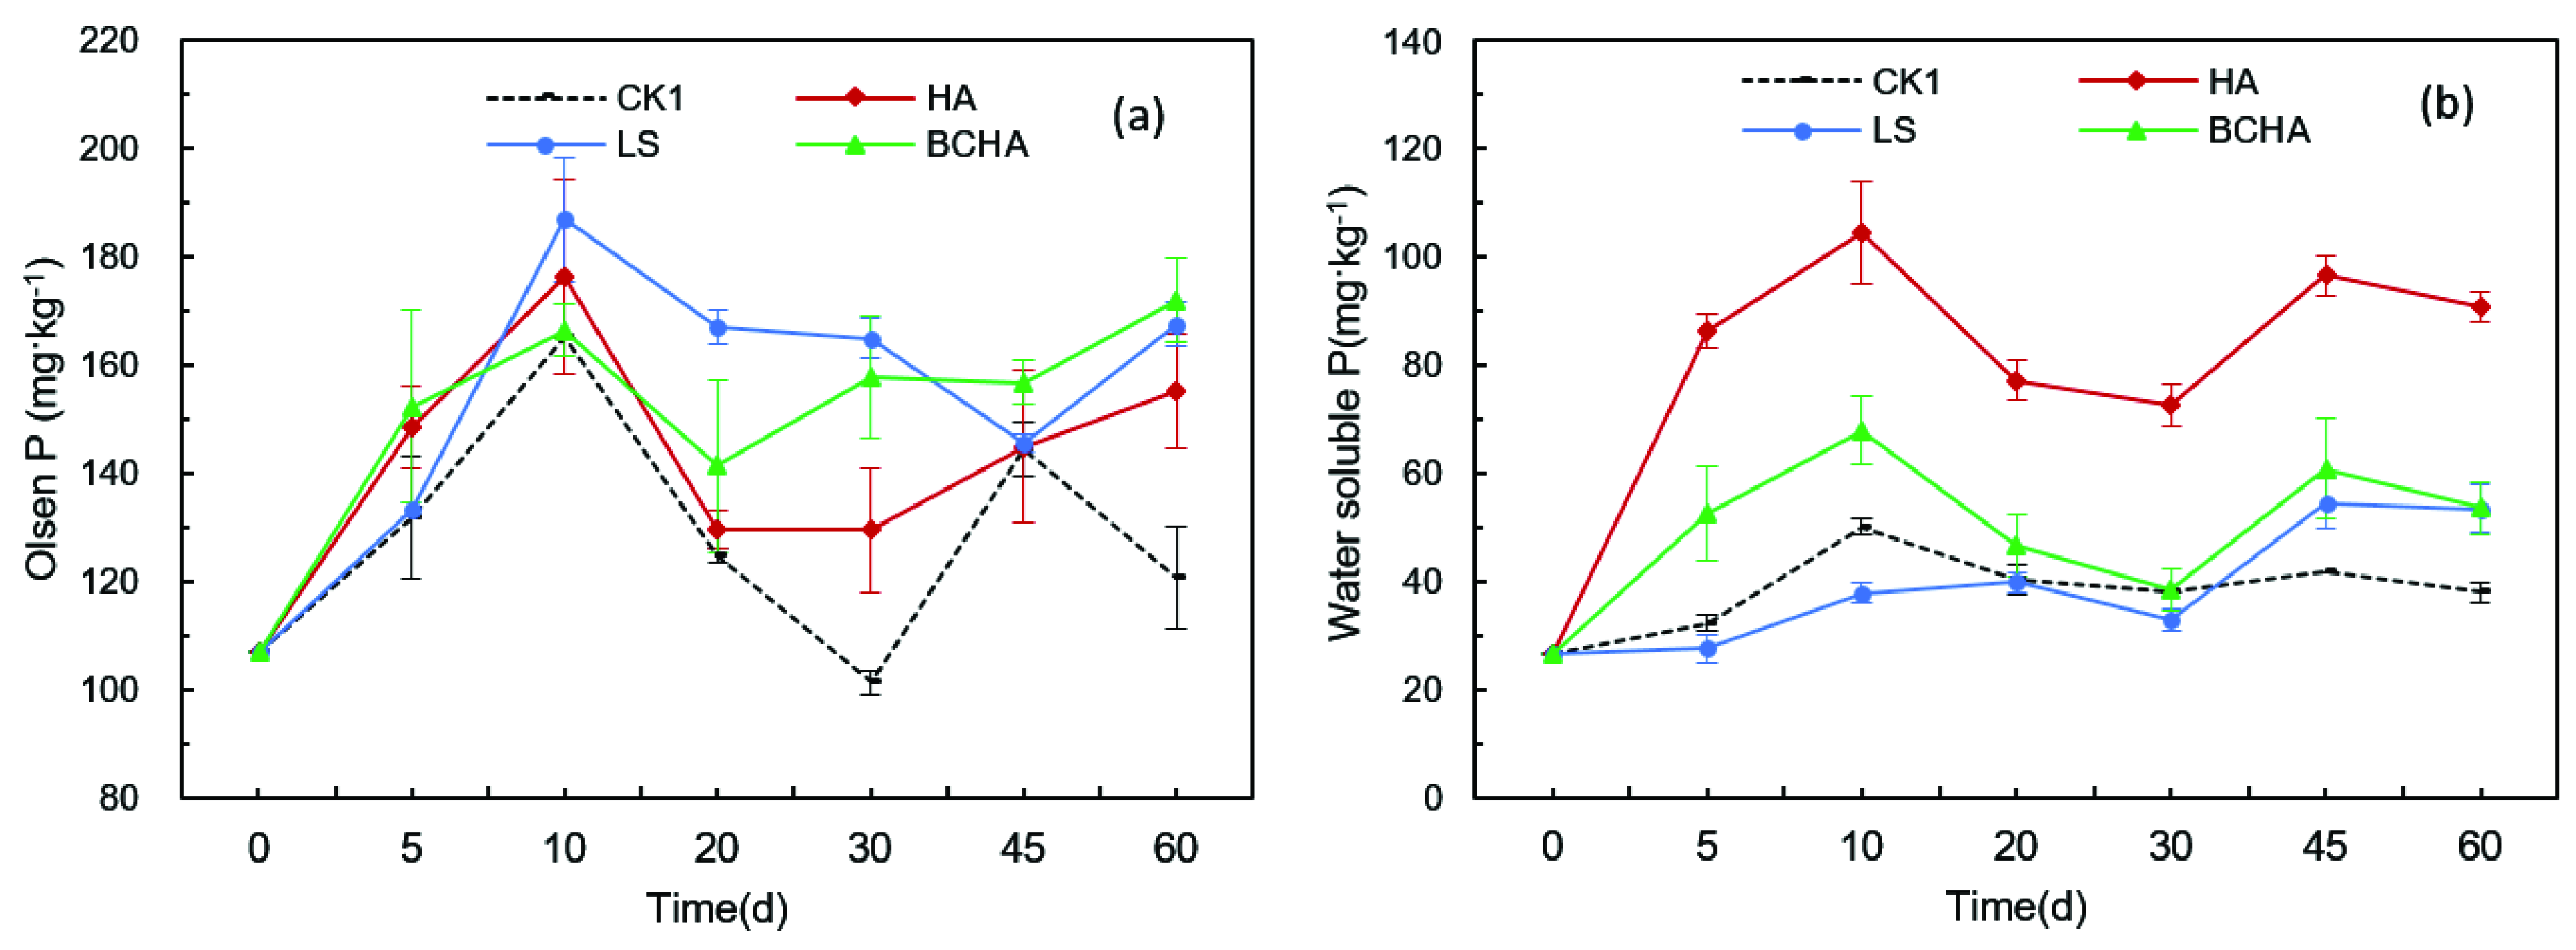
Olsen P is an important indicator of soil P availability. During soil incubation, Olsen P in the treatments with added activators was generally higher than that in CK1 (Figure 1a). For the first ten days, Olsen P increased in all treatments, with small differences among treatments. This increase was related to P transformations under flooding conditions. From the 10th until the 30th day, Olsen P in CK1 decreased rapidly, while that in the HA, LS, and BCHA treatments decreased much more slowly. This indicated that the organic activators slowed down P fixation and improved soil P availability. At the end of incubation, Olsen P concentrations in the HA, LS, and BCHA treatments were 28.4%, 38.6%, and 42.2%, respectively, larger than that in CK1. During incubation, HA and BCHA addition significantly increased soil WSP by 90.9–166.8% and 1.6–62.6%, respectively, compared to that of CK1 (P < 0.05) (Figure 1b). For the first 30 days, WSP in LS treatment was lower than that in CK1, which might be attributed to the relatively high pH of LS, as high pH is not favorable for P solubilization.
3.1.2. Changes in Phosphate Fraction
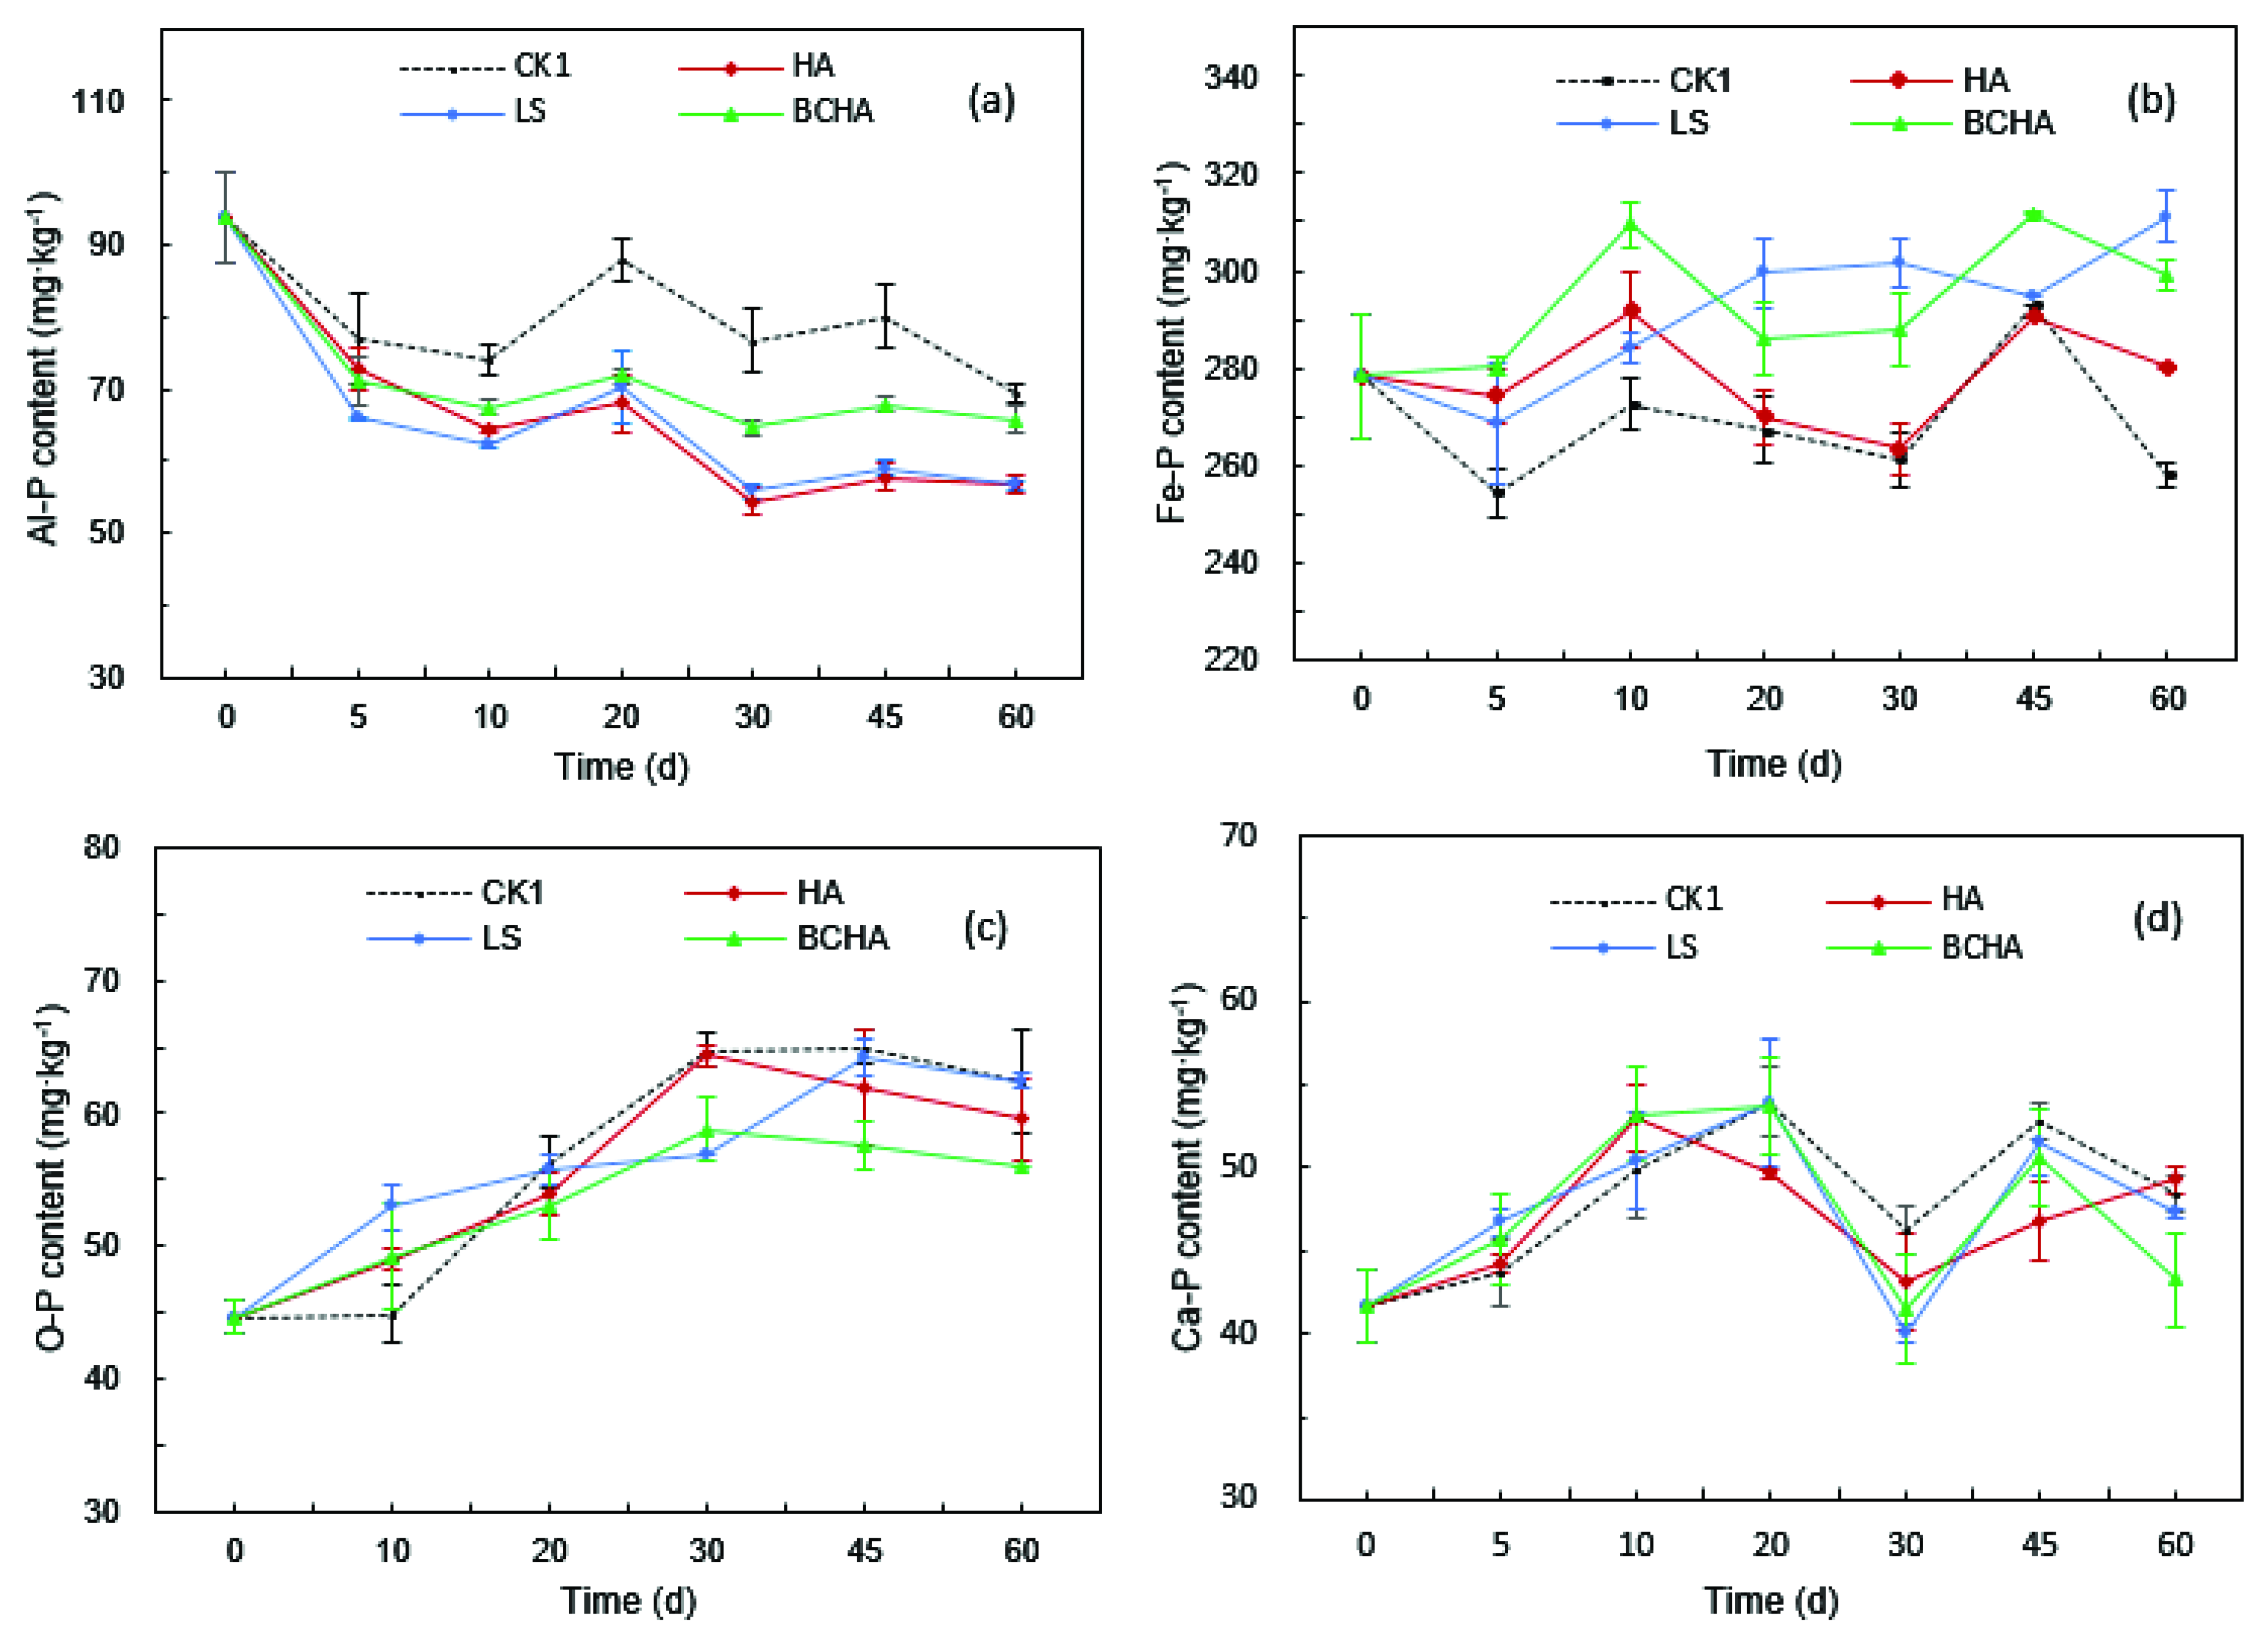
In the HA, LS, and BCHA treatments, Al-P decreased significantly (P < 0.05) by 5.4–29%, 14.5–27.2%, and 5.4–18.5%, respectively, compared with that in CK1 (Figure 2a). In contrast, Fe-P increased significantly (P < 0.05) by 8.6%, 20.6%, and 15.9%, respectively, on day 60 compared with that in CK1 (Figure 2b). These results indicated that HA, LS, and BCHA significantly increased the P transformation from Al-P to Fe-P in the paddy soil. As O-P is structurally stable, it was not until day 20 that O-P in the HA, LS, and BCHA treatments began to decrease by 3.5%, 3.5%, and 9.1%, respectively, compared with that in CK1 (Figure 2c). Although Ca-P is widely accepted as an effective P source for crops growing in alkaline soils, different types of Ca-P compounds greatly differ in their P bioavailability. At the early stage of incubation, Ca-P slightly increased in the HA, LS, and BCHA treatments, and began to decrease after day 20 with an average reduction of 2.4%, 1.2%, and 1.9%, respectively (Figure 2d).
3.1.3. Changes in Soil Microbial Community Structure
In the HA, LS, and BCHA treatments, the observed species, Shannon diversity, PD whole tree, and Simpson indices decreased to some extent compared to those in CK1 (Table 1), indicating that the additions of HA, LS, or BCHA were not favorable for species evenness and richness of the soil microbial community. In other words, these Pas had certain selectivity to microbial community, thus reducing the diversity and richness of microbial community.
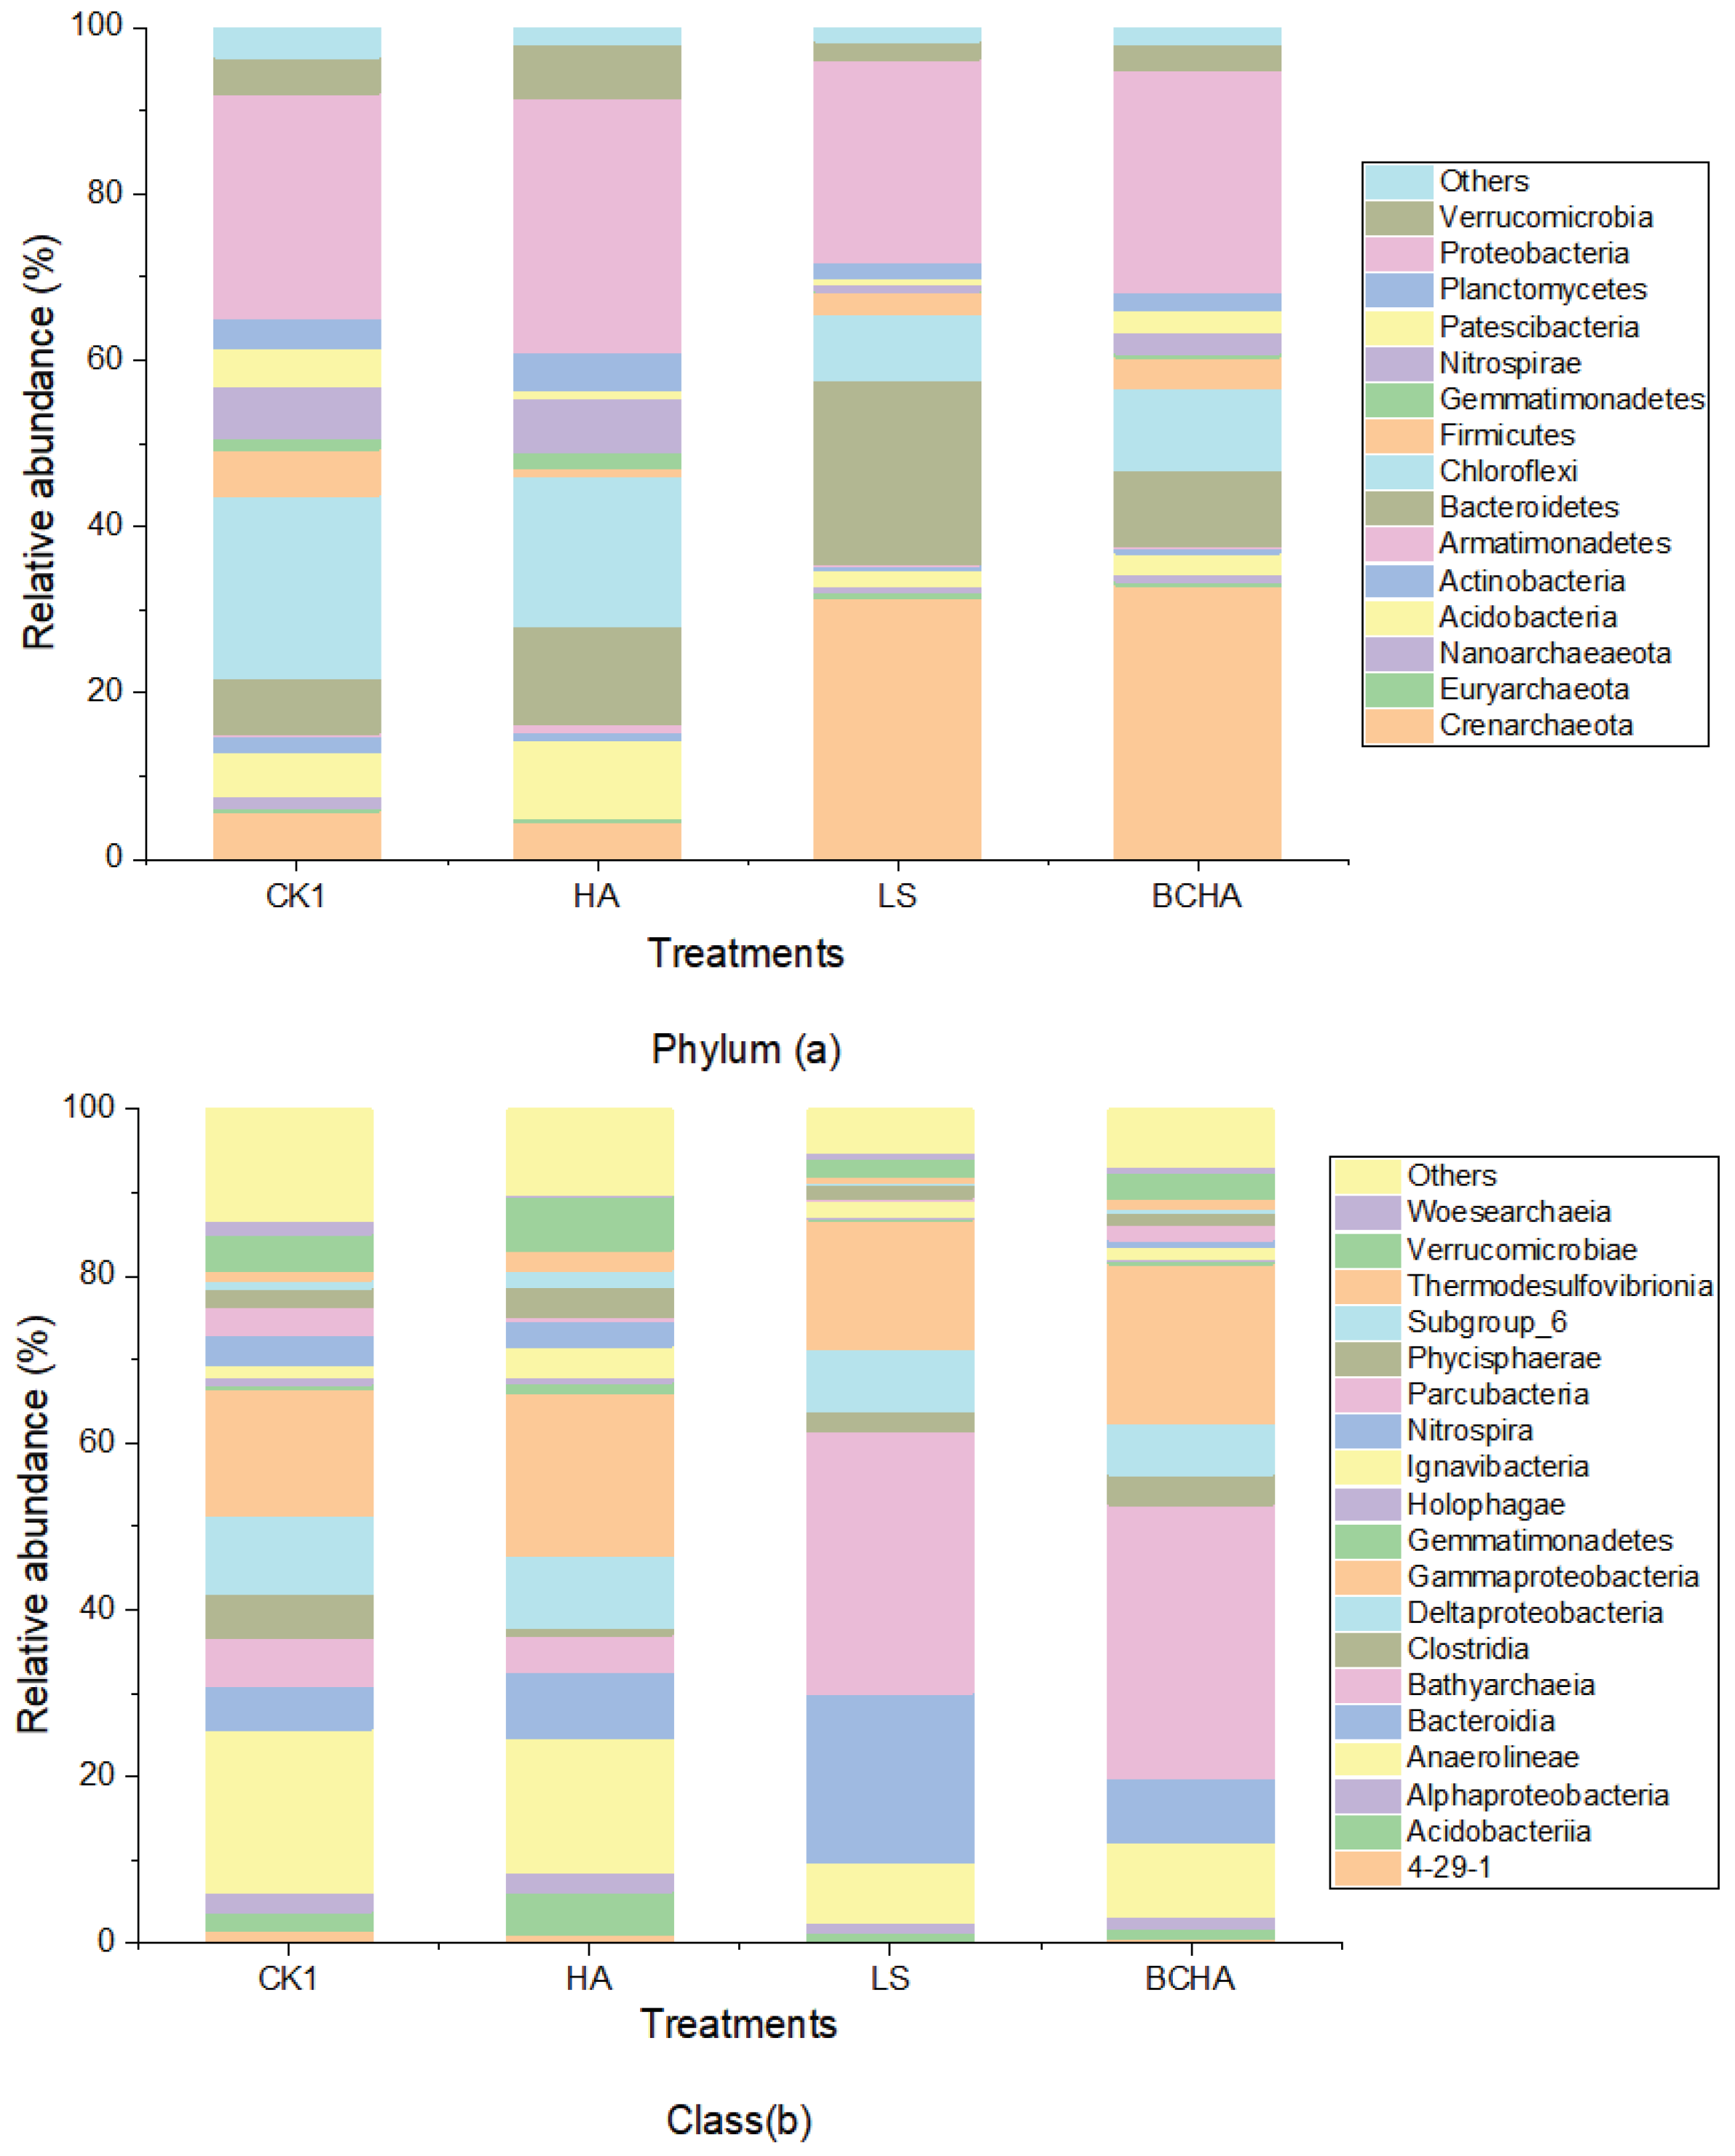
Taxonomic composition of soil microbial communities at the phylum level was similar among treatments, but differences were observed in the relative abundances of the phyla (Figure 3a). The dominant phyla in all the treatments were Crenarchaeota, Bacteroidetes, Chloroflexi, and Proteobacteria. The relative abundance of Bacteroidetes increased to 11.66%, 22.18%, and 9.1% in HA, LS, and BCHA treatments, respectively, compared with 6.64% in the control. Studies showed that Bacteroidetes are associated with organic P transformation [27], as they degrade large organic molecules into small ones. Therefore, the increase in the relative abundance of Bacteroidetes suggested enhanced function of soil microorganisms in organic P utilization.
At the class level, the relative abundance of Bacteroidia in HA, LS, and BCHA treatments increased by 53.6%, 295%, and 49.51%, respectively, and that of Gammaproteobacteria increased by 28.51%, 2.51%, and 26.52%, respectively, compared with those in the control (Figure 3b). These results could be explained by the symbiosis hypothesis that states that symbiotic bacteria (e.g., Bacteroidia and Gammaproteobacteria in this study) grow and reproduce better in nutrient-rich environments [28].
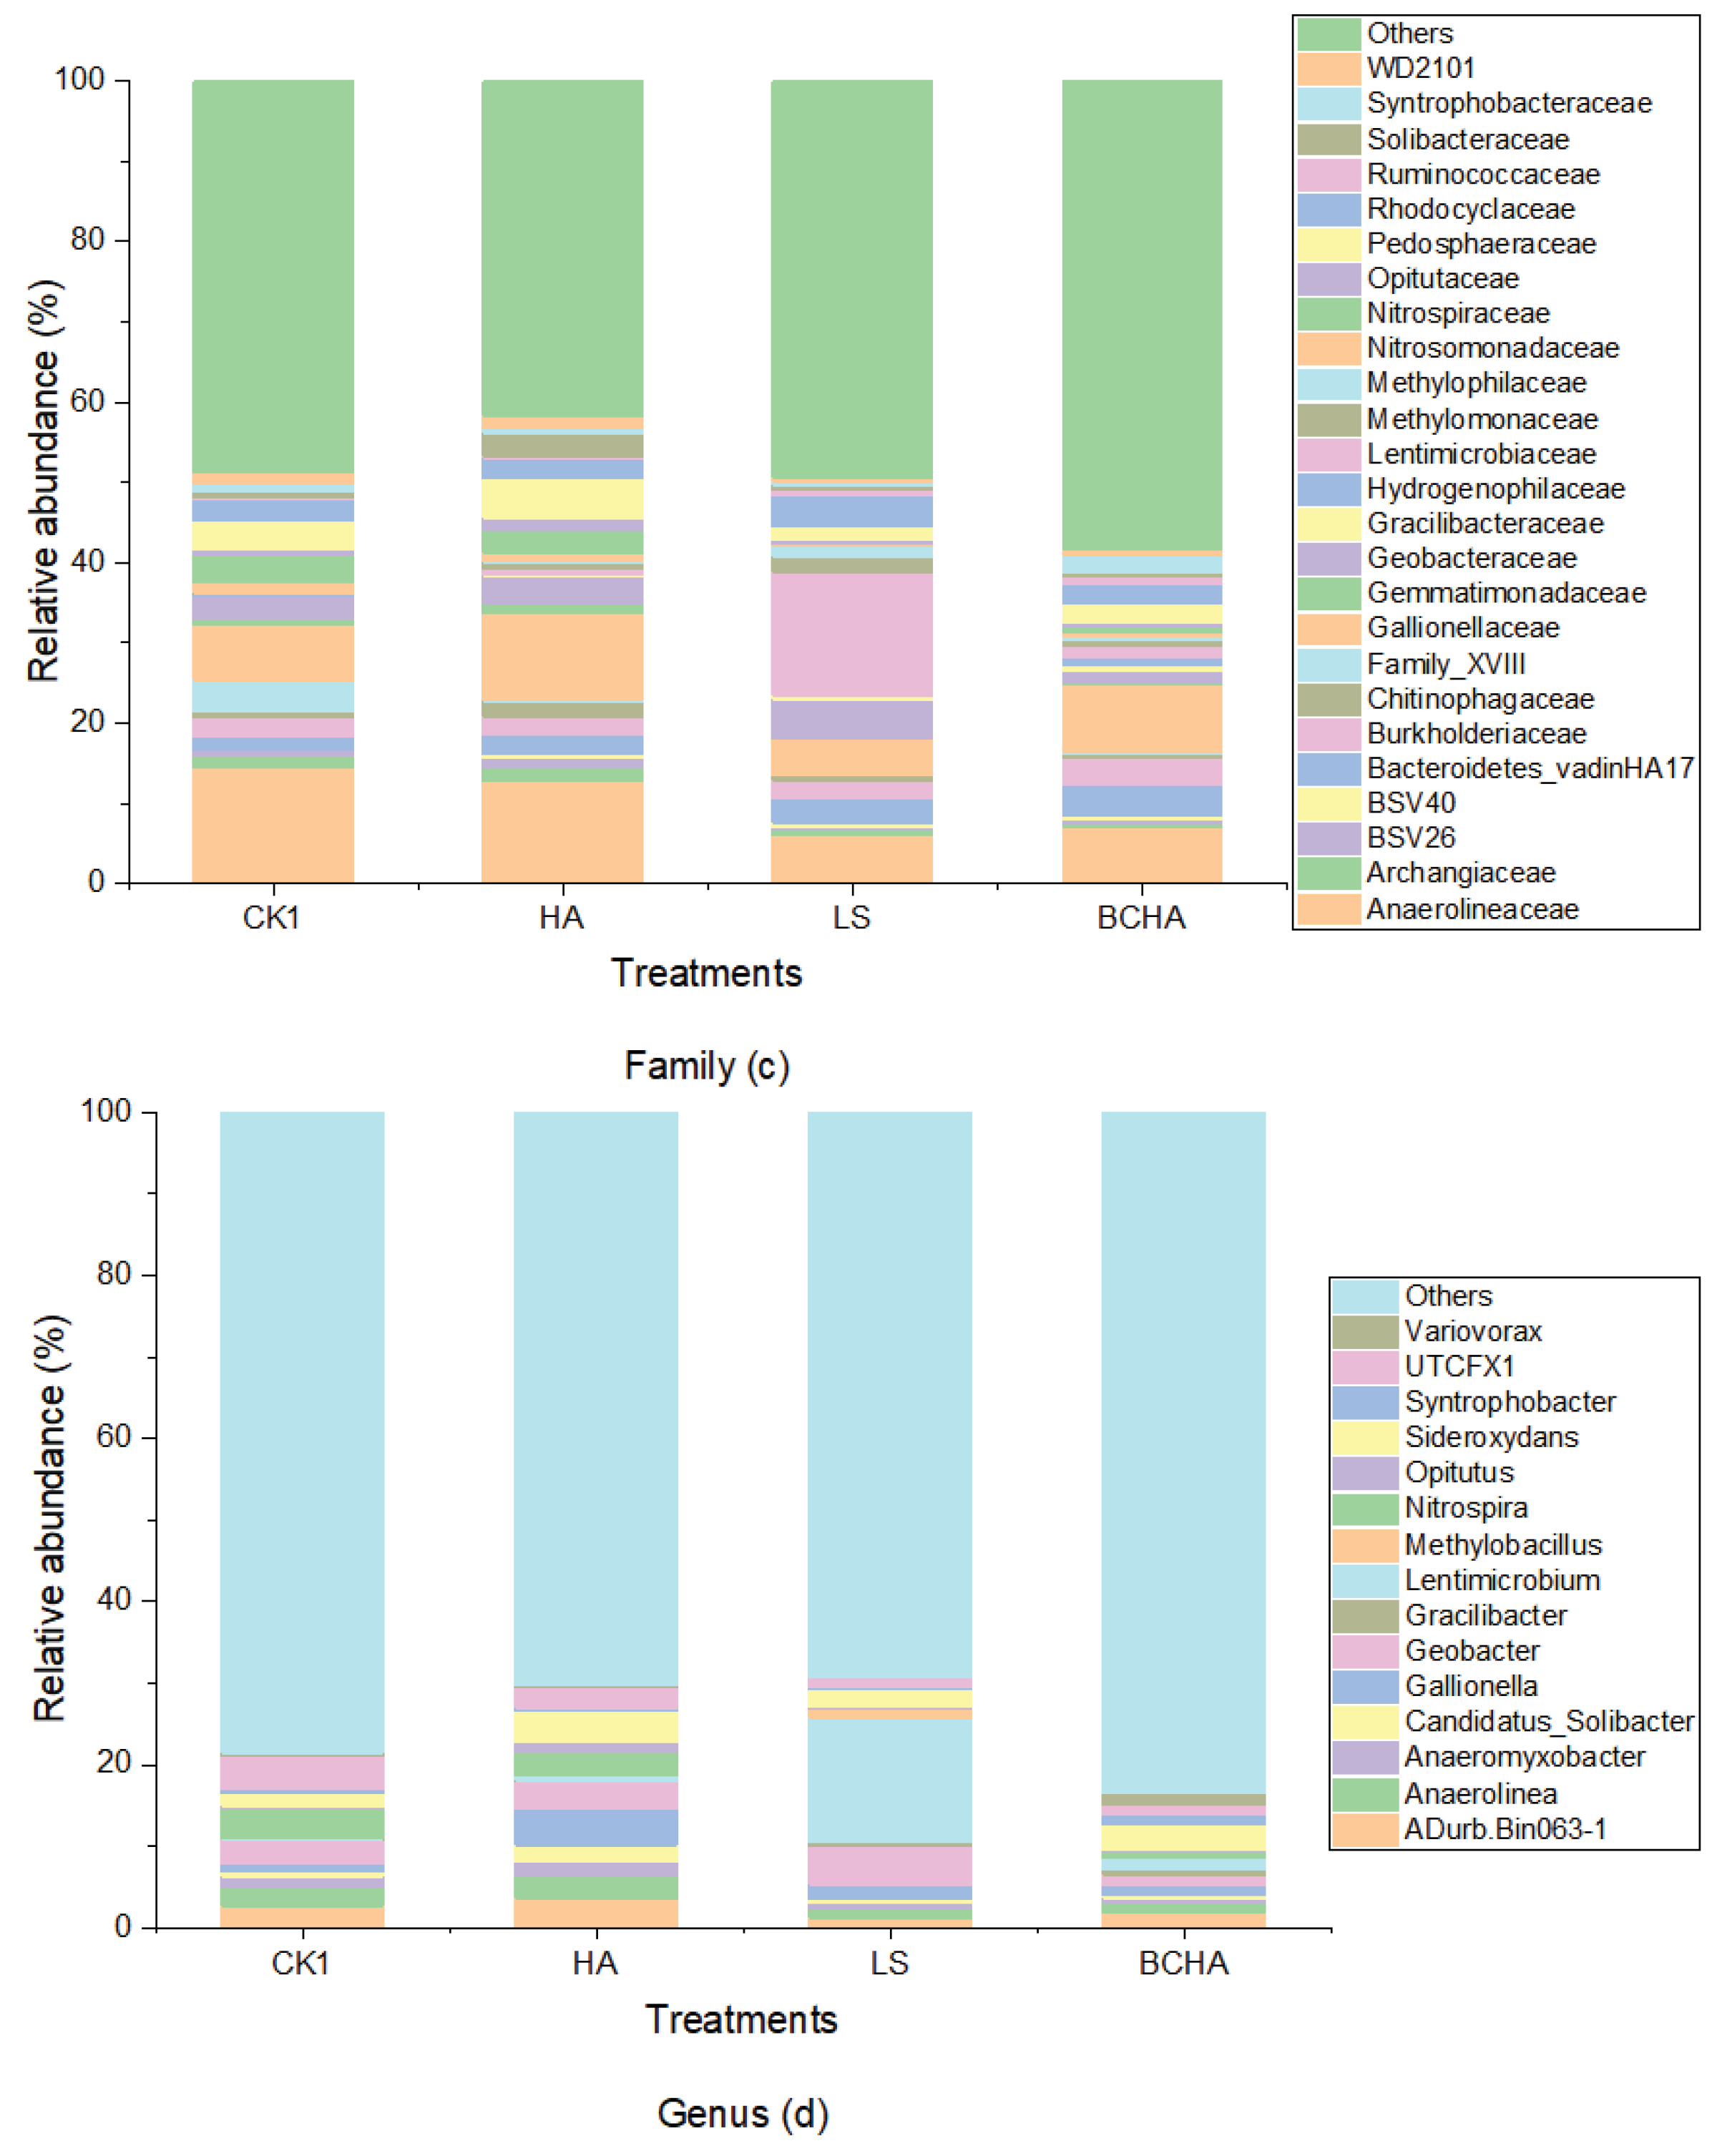
In BCHA treatment, the relative abundances of Burkholderiaceae and Bacteroidetes increased by 36.07% and 139%, respectively, compared with that in the control. The genus Burkholderia belongs to the family Burkholderiaceae, and is a good mineral P-solubilizing microorganism [12,29]. In LS treatment, the relative abundances of the P-solubilizing microorganisms, Rhodocyclaceae and Geobacteraceae, increased by 42.22% and 64.83%, respectively, compared with those in the control. Jiang [25] observed that the genus Geobacter (Geobacteraceae) was significantly and positively correlated with Al-P and phosphatase activity. In HA treatment, small changes were found in the composition and relative abundances of the dominant microorganisms, with almost no increase in the relative abundances of P-solubilizing microorganisms. This might be because HA is relatively stable and not readily utilizable by microorganisms.
Therefore, we can conclude that soil P activation by HA, LS, and BCHA is a biochemical process. The application of HA had a small effect on soil microbial community structure. The other two activators, LS and BCHA, had an effect on different groups of microorganisms and increased P solubilization by soil microorganisms to different extents. In terms of their positive effects on P solubilizing microbes, the three activators were, from highest to lowest, arranged in the following order: BCHA > LS > HA.
3.2. Influences of PAs on P Leaching and Rice Growth
3.2.1. Phosphate Losses
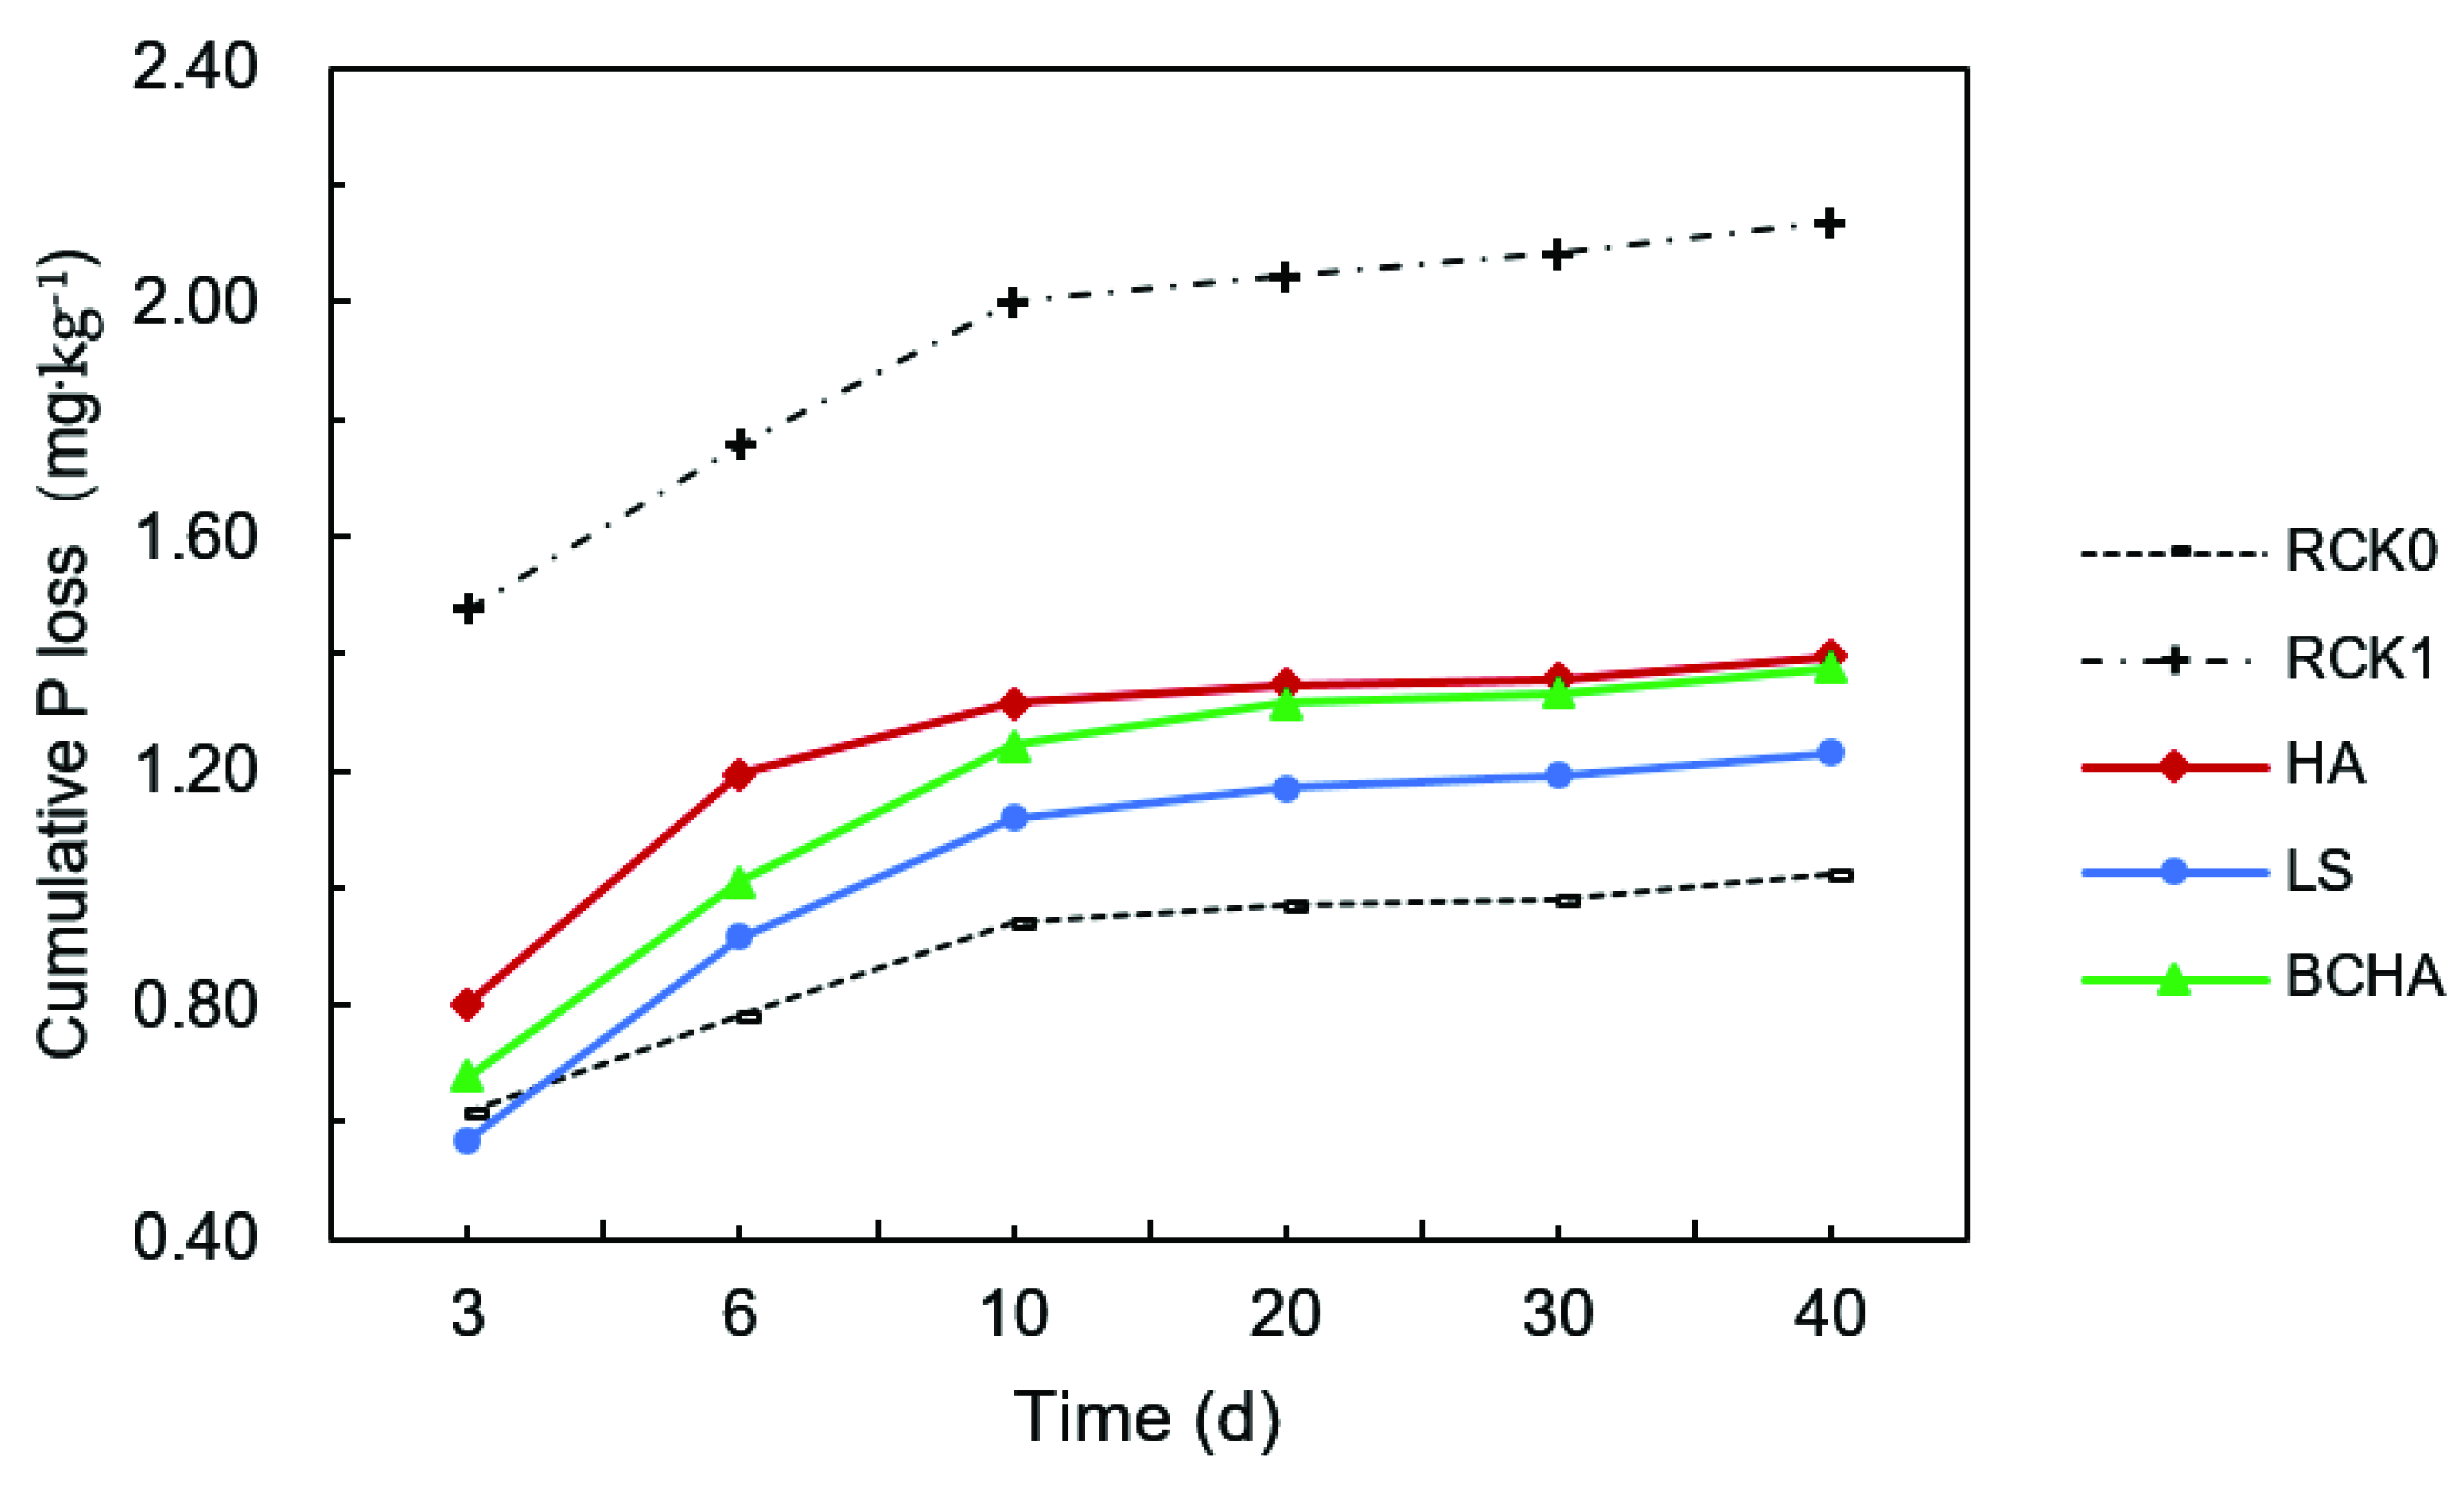
As shown in Figure 4, P loss by leaching was rapid during the first ten days after transplantation, but after these ten days, it slowed down greatly. The highest cumulative P loss was observed in RCK1 where superphosphate was applied, reaching 2.14 mg·pot−1 40 days after rice transplantation. The cumulative P loss in HA, LS, and BCHA treatments at day 40 were 1.40 mg, 1.23 mg, and 1.38 mg, respectively, which were 34.6%, 42.3%, and 35.6% (P < 0.05) lower than those of RCK1, respectively. The cumulative P loss in RCK0 was 1.02 mg at day 40, which was not significantly different from values obtained in HA, LS, or BCHA treatment. Li [17] reported that total P loss from soil amended with an organic fertilizer was 42–155 times higher than that from soil without amendment with organic fertilizer. Therefore, compared with WSP fertilizers and organic fertilizers, the organic activators used in this study significantly reduced soil P loss.
3.2.2. Rice Growth
In spite of the high Olsen P content in potted soil, the yield of RCK0 was still very low, and it is still necessary to apply P fertilizer or PAs to increase crop yield. Effective tiller number, straw dry biomass, and aboveground dry biomass were slightly higher (P > 0.05) in HA, LS, and BCHA than those in RCK0 (Table 2). In contrast, grain yield was significantly higher (P < 0.05) in HA, LS, and BCHA than that in RCK0. In particular, the grain yield in LS and BCHA increased by 15.6% and 24.3%, respectively, compared with that in RCK0, and were even slightly higher than that in RCK1. The grain yield increased marginally in HA (by 11.3%) compared with that in RCK0, and was not significantly different from that in RCK1. Suri [30] observed that the application of P-solubilizing microorganisms without P fertilizers increased the grain yield by 10.55–25.04%. The increases in grain yield achieved in this study demonstrated that the agronomic effectiveness of the three activators was comparable to that of WSP fertilizers and microbial fertilizers. BCHA application achieved the highest grain yield because of the synergic effect of microorganisms. In terms of their yield-increasing effects, the three activators were, from the highest- to lowest-yielding: BCHA > LS > HA.
3.2.3. Soil P After Rice Harvest
After rice was harvested, WSP, Olsen P, and TP were much lower in HA, LS, BCHA, and RCK0 than those in RCK1 (Table 3). Compared with that in RCK1, WSP in HA, LS, and BCHA decreased by 8.85–10.88%, while Olsen P decreased by 7.90–10.22%. Both WSP and Olsen P were slightly higher (P > 0.05) in HA, LS, and BCHA than those in RCK0. Soil TP in HA, LS, and BCHA was slightly lower than that in RCK0, and significantly lower (13.31%, 13.63%, and 16.16% lower, P < 0.05) than that in RCK1. Although organic fertilizers have good P-releasing efficiencies, their continuous application could significantly increase soil WSP and unstable P, resulting in P leaching. Therefore, compared with WSP fertilizers and organic fertilizers, PAs could guarantee successful crop yield while decreasing P content in the paddy soil, thus reducing the environmental risks imposed by P fertilization application of arable lands.
3.3. Effects of Different Treatments on Rice Growth and P Utilization in the Field
Compared with those in T0, the effective tiller number and biomass of rice treated with PA were slightly increased, but there was no significant difference (Table 4), whereas the rice yield in this treatment significantly increased (P < 0.05) by 36.53%, which was even higher than that in the treatment with superphosphate. This implies that the PAs used in this experiment significantly improved rice yield.
By measuring the P utilization rate of rice plants after harvest, we observed that the P utilization rate of T1 treated with superphosphate was only 9.78%, while that of T2 treated with PA was 42.65%, which was significantly higher than that of T1 (P < 0.05). Therefore, the application of PAs can effectively improve the P utilization rate of rice in the field and reduce the fixed P content in the soil, thus reducing the risks implied by P fertilizers.
4. Discussion
4.1. The Biochemical Mechanism of PA Activation of Soil P
Olsen P is the P form available for plant uptake, and it has been proven that its content is significantly correlated with plant growth in different types of soils [31,32]. The content of Olsen P in paddy soil was significantly increased after the addition of the three PAs (Figure 1). The increasing trend of Olsen P in paddy soil was stable when BCHA was added during the cultivation period, and the content of Olsen P was the highest among the three activators from day 45 to day 60, which was consistent with the best results obtained for rice growth (Table 2).
The increase of Olsen P content in the soil after the addition of PAs is the result of the chemical activation of fixed P by activators and its effect on the promotion of microbial solubilization of P. The chemical activation is mainly related to the reaction activity of the PAs. The three PAs used in this study have more oxygen-containing functional groups than common organic compounds (such as organic fertilizers, low molecular organic acids, etc.), mainly including hydroxyl, methoxy, carbonyl, and carboxyl groups [11]. These oxygen-containing groups have strong surface activity and strong exchange, adsorption, and complexation capabilities. They act on the surface of soil particles, effectively enhancing the physical, chemical, and biological reactions with the soil particles, thus ensuring the continuous release of P and reducing the fixation of P in the soil [22,33].
The contents and proportions of Fe-P, Al-P, O-P, and Ca-P reflect the soil P status [34]. For acidic paddy soils under flooding conditions, Fe-P is an effective P source for rice. As an intermediate product of weathering processes, Al-P indirectly influences soil available P by affecting Fe-P [35]. In acidic soils, the content of Ca2-P, which has a relatively high bioavailability, is extremely low [36], and there was no significant relationship observed between Ca-P and available P in acidic soils [37]. The results of this study showed that the addition of PAs had a relatively weak change on the structure of O-P and Ca-P, but it was able to significantly promote the transformation of Al-P with low bioavailability to Fe-P with high bioavailability.
The addition of simple organic matter to the soil can change the metabolic characteristics and diversity of soil microorganisms [38]. However, there is no report on the organic matter selection of selectively increasing specific microbial communities (such as phosphate-solubilizing bacteria). The three activators used in this study were all water-soluble organics, and they all caused changes of microbial population structure after their application in cultivation (Table 1). The abundance of phosphorous soluble microorganisms (such as Burkholderia, which has a good dissolving effect on the mineral P in soil) in the treatment of BCHA increased significantly compared with that in CK1 (Figure 3c,d), followed by the treatment of LS, whereas that in the treatment of HA changed only slightly. LS and BCHA are organic wastes, which have better bioavailability, while HA has lower bioavailability [39]. As a result, the overall P-activation efficiency of HA on soil was low because of its minor role in promoting the dissolution of P by microorganisms. Therefore, besides chemically active groups of the materials, their biological activities should be considered as well in the selection of soil PAs, i.e., both the characteristics of chemical activation and biological P solubilization should be considered. In the future, we can screen and develop substances that could induce and enhance the abundance of phosphate-solubilizing bacteria in the soil, which we expect would further improve the activation efficiency of soil P.
4.2. Activation of Soil P Pool to Reduce the P Fertilizer Application, and Realization of Pollution Reduction and Increase of P Use Efficiency
In recent years, the non-point source pollution caused by N and P eutrophication is continuously increasing, which mainly comes from atmospheric deposition [40,41], leaking sanitary sewers [42,43], and agricultural P loss [4]. Most P fertilizers bond with the cations in the soil and form metal phosphates, meaning that P is fixed in the soil and difficult to obtain by plants [44], and this leads to the increasing risk of soil P pool entering water bodies, thus causing water quality degradation [10]. In 2007, cyanobacteria bloom broke out in Lake Taihu due to eutrophication, cutting off the drinking water supply for 2 million people in the city of Wuxi for more than 1 week [45]. As the utilization rate of applied phosphate fertilizer is only 10–25% [46], restricting the application of these fertilizers would affect the crop yield to a certain extent if no other effective measures were adopted. Therefore, it is very important to study the activation mechanisms of the soil P pool, reduction of P fertilizer inputs, and risks of P accumulation under the premise of ensuring proper phosphorus nutrition of crops, especially in the areas with limited arable land resources and fragile agricultural ecological environment.
The changing trends of soil P levels will determine the impact of P on nonpoint source pollution in the future. In the middle and late 1970s, the amount of P fertilizer application per unit of cultivated land area in France, Germany, and Britain reached the highest levels in history. By the end of 1980s, agriculture was the source of more than 30% of the underground and surface water P pollution in rural areas of most European Union countries [47]. In developed countries, the main strategy for controlling environmental pollution of agricultural P is to limit the application of P fertilizers on cultivated land. This can be achieved through formulating strict regulations, such as the Nutrient Management Law of the United States [48], the Mineral Accounting System (MINAS) of the Netherlands [49], and the time limit for the prohibition of P fertilizers for different crops in France [50]. Large-scale cultivation practices are convenient for reducing the P risk of cultivated lands through strict management laws and regulations; still, in the underdeveloped areas and countries with large human populations, less cultivable land area, and scattered management, it is better to provide farmers with technical measures that can meet the requirements of crop P nutrition in order to ensure high yield of crops and reduce the application of P fertilizers. The results of the present study also showed that for cultivated land with rich available P, the use of PAs 100% instead of P fertilizers could significantly reduce the amount of P loss (Figure 4) and meet the requirements of rice P nutrition in order to ensure the yield (Table 2). Compared with the treatment of P fertilizer application, the decrease of Olsen P in soil was not significant, but the total P was significantly reduced in the treatment of PAs application after the harvest (Table 3). These results showed that reducing the environmental risk of P-rich cultivated land under the condition of perennial application of P fertilizer and surplus P is a feasible option. For cultivated land with medium soil P fertility, the application of PAs to replace part of the P fertilizer application can significantly improve the utilization rate of P fertilizer (Table 4) and alleviate the risk of P accumulation. Therefore, in the future, the application scheme of PAs instead of different proportion of P fertilizers should be studied according to the content of soil P. These studies can be expected to lead to the development of technical methods for P risk management and control of cultivated land suitable for specific local environmental conditions, which is of great significance for ensuring food production and reducing the environmental risks of agricultural P loss.
5. Conclusions
The application of organic activators, i.e., HA, LS, and BCHA, effectively enhanced the transformation of P from Al-P to Fe-P, thus improving P bioavailability in paddy soils. Besides their chemical activation effects, the activators stimulated the enrichment of P-solubilizing microorganisms and enhanced mineral P solubilization by microorganisms. Compared with P fertilizers, the organic activators effectively reduced P loss, soil total P, WSP, and Olsen P during rice harvest. PA application achieved grain yield and rice biomass comparable to that of P fertilizer application, but significantly higher than that of the control, showing its agronomic effectiveness. In the field experiment, organic activators significantly improved the yield and P utilization efficiency of rice. Based on the above studies, the future research should focus on the use of PAs instead of different proportions of P fertilizers according to the content of soil P, so as to further improve P utilization efficiency and reduce P risk.
Author Contributions
Conceptualization, H.Y.; methodology, H.Y. and X.M.; software, H.Y. and J.Y.; validation, X.M.; formal analysis, H.Y.; investigation, H.Y.; resources, X.M.; data curation, H.Y., J.Y., J.L., and J.H.; writing—original draft preparation, H.Y.; writing—review and editing, X.M., Y.H., X.C., and H.Y.; visualization, H.Y.; supervision, X.M. and X.C.; project administration, X.M. and X.C.; funding acquisition, X.M. All authors have read and agreed to the published version of the manuscript.
Funding
This research was funded by the National Key R&D Program of China (Grant No. 2018YFD0200303); the Science and Technology Project of Guangdong Province (Grant No. 2017A050501029; 2016B020242005; 2019B030301007) and the National Natural Science Foundation of China (Grant No. U1901601).
Acknowledgments
The authors thank Shaoling Zheng for assistance with soil analysis and Chengyu Chen for reviewing this paper.
Conflicts of Interest
The authors declare no conflicts of interest. The funders had no role in the design of the study; in the collection, analyses, or interpretation of data; in the writing of the manuscript, or in the decision to publish the results.
References
- Kvakić, M.; Pellerin, S.; Ciais, P.; Achat, D.L.; Augusto, L.; Denoroy, P.; Gerber, J.S.; Goll, D.; Mollier, A.; Mueller, N.D. Quantifying the limitation to world cereal production due to soil phosphorus status. Global Biogeochem. Cycles 2018, 32, 143–157. [Google Scholar] [CrossRef]
- McLaughlin, M.J.; McBeath, T.M.; Smernik, R.; Stacey, S.P.; Ajiboye, B.; Guppy, C. The chemical nature of P accumulation in agricultural soils-implications for fertiliser management and design: An Australian perspective. Plant Soil 2011, 349, 69–87. [Google Scholar] [CrossRef]
- Li, H.; Huang, G.; Meng, Q.; Ma, L.; Yuan, L.; Wang, F. Integrated soil and plant phosphorus management for crop and environment in China. A review. Plant Soil 2011, 349, 157–167. [Google Scholar] [CrossRef]
- Li, H.; Liu, J.; Li, G.; Shen, J.; Bergstro, L.; Zhang, F. Past, present, and future use of phosphorus in Chinese agriculture and its influence on phosphorus losses. Ambio 2015, 44, 274–285. [Google Scholar] [CrossRef] [PubMed] [Green Version]
- Ma, J.; Liu, Y.; He, W.; He, P.; Haygarth, P.M.; Surridge, B.W.J.; Lei, Q.; Zhou, W. The long-term soil phosphorus balance across Chinese arable land. Soil Use Manag. 2018, 34, 306–315. [Google Scholar] [CrossRef]
- Heckrath, G.; Brookes, P.C.; Poulton, P.R.; Goulding, K.W.T. Phosphorus leaching from soils containing different phosphorus concentrations in the broadbalk experiment. J. Environ. Qual. 1995, 24, 904–910. [Google Scholar] [CrossRef]
- Jacobsen, O.H.; Moldrup, P.; Larsen, C.; Konnerup, L.; Petersen, L.W. Particle transport in macropores of undisturbed soil columns. J. Hydrol. 1997, 196, 185–203. [Google Scholar] [CrossRef]
- Wang, S.H.; Wang, J.H.; Du, L.S. Characteristics of phosphorus sorption-desorption kinetics by the colloidal dispersion complex in black soil. Adv. Mater. Res. 2013, 726–731, 1691–1694. [Google Scholar] [CrossRef]
- Simpson, R.J.; Richardson, A.E.; Nichols, S.N.; Crush, J.R. Pasture plants and soil fertility management to improve the efficiency of phosphorus fertiliser use in temperate grassland systems. Crop Pasture Sci. 2014, 65, 556–575. [Google Scholar] [CrossRef]
- Liu, X.; Sheng, H.; Jiang, S.; Yuana, Z.; Zhangb, C.; Elserc, J.J. Intensification of phosphorus cycling in China since the 1600s. PNAS 2016, 113, 2609–2614. [Google Scholar] [CrossRef] [Green Version]
- Zhu, J.; Li, M.; Whelan, M. Phosphorus activators contribute to legacy phosphorus availability in agricultural soils: A review. Sci. Total Environ. 2018, 612, 522–537. [Google Scholar] [CrossRef] [PubMed] [Green Version]
- Behera, B.C.; Singdevsachan, S.K.; Mishra, R.R.; Dutta, S.K.; Thatoi, H.N. Biocatalysis and Agricultural Biotechnology Diversity, mechanism and biotechnology of phosphate solubilising microorganism in mangrove—A review. Biocatal. Agric. Biotechnol. 2014, 3, 97–110. [Google Scholar] [CrossRef]
- Osorio, N.W.; Habte, M. Effect of a phosphate-solubilizing fungus and an arbuscular mycorrhizal fungus on leucaena seedlings in tropical soils with contrasting phosphate sorption capacity. Plant Soil 2015, 389, 375–385. [Google Scholar] [CrossRef]
- García-López, A.M.; Avilés, M.; Delgado, A. Effect of various microorganisms on phosphorus uptake from insoluble Ca-phosphates by cucumber plants. J. Plant Nutr. Soil Sci. 2016, 179, 454–465. [Google Scholar] [CrossRef]
- Ojo, A.O.; Adetunji, M.T.; Okeleye, K.A.; Adejuyigbe, C.O. Effect of phosphorus fertilizer and poultry manure on p fractions in some derived savanna soils of south western nigeria-a greenhouse study. AJEA 2016, 10, 1–9. [Google Scholar] [CrossRef]
- Kobierski, M.; Bartkowiak, A.; Lemanowicz, J.; Piekarczyk, M. Impact of poultry manure fertilization on chemical and biochemical properties of soils. Plant Soil Environ. 2017, 63, 558–563. [Google Scholar] [CrossRef] [Green Version]
- Li, P.; Lang, M.; Li, C.; Thomas, B.W.; Hao, X. Nutrient leaching from soil amended with manure and compost from cattle fed diets containing wheat dried distillers’ grains with solubles. Water Air Soil Pollut. 2016, 227, 1–13. [Google Scholar] [CrossRef]
- Song, K.; Xue, Y.; Zheng, X.; Lv, W.; Qiao, H.; Qin, Q. Effects of the continuous use of organic manure and chemical fertilizer on soil inorganic phosphorus fractions in calcareous soil. Sci. Rep. 2017, 1–9. [Google Scholar] [CrossRef] [Green Version]
- Abdala, D.B.; Silva, I.R.; Vergütz, L.; Sparks, D.L. Long-term manure application effects on phosphorus speciation, kinetics and distribution in highly weathered agricultural soils. Chemosphere 2015, 119, 504–514. [Google Scholar] [CrossRef]
- Yin, Y.; Liang, C.; Xi, F.; Du, L.Y.; Wang, J.Y.; Bing, L.F. Relationship Between Phosphorus Fractions in Paddy Soil and Phosphorus Release to Runoff Amended with Manure. Clean Soil Air Water 2018, 46, 1700192–1700199. [Google Scholar] [CrossRef]
- Huang, L.; Mao, X.; Wang, J.; Chen, X.; Wang, G.; Liao, Z. The effect and mechanism of improved efficiency of physicochemical pro-release treatment for low grade phosphate rock. J. Soil Sci. Plant Nutr. 2014, 14, 316–331. [Google Scholar] [CrossRef] [Green Version]
- Mao, X.; Lu, Q.; Mo, W.; Xin, X.; Chen, X.; He, Z. Phosphorus availability and release pattern from activated. J. Agric. Food Chem. 2017, 1–8. [Google Scholar] [CrossRef]
- Murphy, J.; Riley, J.P. A modified single solution method for the determination of phosphate in natural waters. Anal. Chem. Acta 1962, 27, 31–36. [Google Scholar] [CrossRef]
- Chang, S.C.; Jackson, M.L. Fractionation of soil phosphorus. Soil Sci. 1957, 84, 133–144. [Google Scholar] [CrossRef]
- Jiang, N.; Wei, K.; Chen, L. Long-term chronological shifts in bacterial communities and hydrolytic extracellular enzyme activities in the forty years following a land-use change from upland fields to paddy field. Pedobiologia. 2016, 59, 17–26. [Google Scholar] [CrossRef]
- Calculators. Available online: https://mothur.org/wiki/calculators (accessed on 26 March 2020).
- Rofner, C.; Sommaruga, R.; P´erez, M.T. Differential utilization patterns of dissolved organic phosphorus compounds by heterotrophic bacteria in two mountain lakes. FEMS Microbiol. Ecol. 2016, 92, 1–10. [Google Scholar] [CrossRef] [Green Version]
- Wang, Y.; Ji, H.; Gao, C. Differential responses of soil bacterial taxa to long-term P, N, and organic manure application. J. Soils Sediments 2016, 16, 1046–1058. [Google Scholar] [CrossRef]
- Busato, J.G.; Zandonadi, D.B.; Mól, A.R.; Souza, R.S.; Aguiar, K.P.; Júnior, F.B.R.; Olivares, F.L. Compost biofortification with diazotrophic and P-solubilizing bacteria improves maturation process and P availability. J. Sci. Food Agric. 2017, 97, 949–955. [Google Scholar] [CrossRef]
- Suri, V.K.; Choudhary, A.K.; Chander, G.; Verma, T.S.; Gupta, M.K.; Dutt, N. Improving phosphorus use through co-inoculation of vesicular arbuscular mycorrhizal fungi and phosphate-solubilizing bacteria in maize in an acidic alfiso. Commun. Soil Sci. Plant Anal. 2011, 42, 2265–2273. [Google Scholar] [CrossRef] [Green Version]
- Olsen, S.R.; Cole, C.V.; Watanabe, F.S. Estimation of Available Phosphorus in Soils by Extraction with Sodium Bicarbonate; US Government Printing Office: Washington, DC, USA, 1954. [Google Scholar]
- Johnston, A.E.; Poulton, P.R.; White, R.P. Plant-available soil phosphorus. Part II: The response of arable crops to Olsen P on a sandy clay loam and a silty clay loam. Soil Use Manag. 2013, 12–21. [Google Scholar] [CrossRef]
- Jindo, K.; Martim, S.A.; Navarro, E.C.; Aguiar, N.O.; Canellas, L.P. Root growth promotion by humic acids from composted and non-composted urban organic wastes. Plant Soil 2012, 353, 209–220. [Google Scholar] [CrossRef]
- Li, T.; Zheng, W.; Zhang, S.; Jia, Y.; Li, Y.; Xu, X. Spatial variations in soil phosphorus along a gradient of central city-suburb- exurban satellite. Catena 2018, 170, 150–158. [Google Scholar] [CrossRef]
- Lu, R. Soil Agricultural Analysis; China Agricultural Science and Technology Press: Beijing, China, 1999; pp. 175–176. [Google Scholar]
- Jiang, B.; Gu, Y. A suggested fractionation scheme of inorganic phosphorus in calcareous soils. Fertil. Res. 1989, 20, 159–165. [Google Scholar] [CrossRef]
- Egashira, K.; Takenaka, J.; Shuto, S. Phosphorus status of some paddy soils in Bangladesh. Soil Sci. Plant Nutr. ISSN 2003, 0768, 751–755. [Google Scholar] [CrossRef] [Green Version]
- Degens, B.P. Microbial functional diversity can be influenced by the addition of simple organic substrates to soil. Soil Biol. Biochem. 1998, 30, 1981–1988. [Google Scholar] [CrossRef]
- Othieno, C.O. The effect of organic mulches on yields and phosphorus. Plant Soil 1973, 38, 17–32. [Google Scholar] [CrossRef]
- Elliott, E.M.; Kendall, C.; Wankel, S.D.; Burns, D.A.; Boyer, E.W.; Harlin, K.; Bain, D.J.; Butler, T.J. Nitrogen isotopes as indicators of NOx source contributions to atmospheric nitrate deposition across the midwestern and northeastern United States. Environ. Sci. Technol. 2007, 41, 7661–7667. [Google Scholar] [CrossRef]
- Kaushal, S.S.; Groffman, P.M.; Band, L.E.; Elliott, E.M.; Shields, C.A.; Kendall, C. Tracking nonpoint source nitrogen pollution in human-impacted watersheds. Environ. Sci. Technol. 2011, 45, 8225–8232. [Google Scholar] [CrossRef]
- De, M.; Toor, G.S. Nitrogen transformations in the mounded drainfields of drip dispersal and gravel trench septic systems. Ecol. Eng. 2017, 102, 352–360. [Google Scholar] [CrossRef] [Green Version]
- Lusk, M.G.; Toor, G.S.; Yang, Y.Y.; Mechtensimer, S.; De, M.; Obreza, T.A. A review of the fate and transport of nitrogen, phosphorus, pathogens, and trace organic chemicals in septic systems. Crit. Rev. Environ. Sci. Technol. 2017, 47, 455–541. [Google Scholar] [CrossRef]
- Hinsinger, P. Bioavailability of soil inorganic P in the rhizosphere as affected by root-induced chemical changes: A review Philippe. Plant Soil 2001, 237, 173–195. [Google Scholar] [CrossRef]
- Qin, B.; Zhu, G.; Gao, G.; Zhang, Y.; Li, W.; Paerl, H.W.; Carmichael, W.W. A drinking water crisis in Lake Taihu, China: Linkage to climatic variability and lake management. Environ Manag. 2010, 45, 105–112. [Google Scholar] [CrossRef]
- Ao, J.; Chen, Z.; Wu, M.; Lu, X.; Huang, Z.; Liao, H. Phosphorus fractions of red soils in Guangdong province of south China and their bioavailability for five crop species. Soil Sci. 2014, 179, 514–521. [Google Scholar] [CrossRef]
- FAO Statistical Databases. Available online: http://faostat.fao.org/faostat/collections?Subset=agriculture (accessed on 26 March 2020).
- USEPA. Environmental Indicators of Water Quality in the United States; United States Environmental Protection Agency: Washington, DC, USA, 1996. [Google Scholar]
- Ondersteijn, C.J.M.; Beldman, A.C.G.; Daatselaar, C.H.G.; Giesen, G.W.J.; Huirne, R.B.M. The Dutch Mineral Accounting System and the European Nitrate Directive: Implications for N and P management and farm performance. Agric. Ecosyst. Environ. 2002, 92, 283–296. [Google Scholar] [CrossRef]
- Oenema, O. Governmental policies and measures regulating nitrogen and phosphorus from animal manure in European agriculture. J. Anim. Sci. 2004, 82, 196–206. [Google Scholar] [CrossRef]
Figure 1.
Changes in Olsen Phosphorous (P) (Figure a) and water-soluble P (Figure b) concentrations across the 60 days of soil incubation. Data points represent (n = 3) treatments within P activators (Pas) (humic acid, HA; lignosulfonate sodium, LS; biochemical humic acid, BCHA; and CK1, without the addition of the above mentioned agents). Each bar is the standard error of three replicates.

Figure 2.
Changes in Al-P (Figure a), Fe-P (Figure b), O-P (Figure c), and Ca-P (Figure d) concentrations across the 60 days of soil incubation. Data points represent (n = 3) treatments within Pas (humic acid, HA; lignosulfonate sodium, LS; biochemical humic acid, BCHA; and CK1, without the addition of the above-mentioned agents). Each bar is the standard error of three replicates.

Figure 3.
Taxonomic composition of soil microbial communities at the phylum (a), class (b), family (c), and genus (d) levels after 50 days of incubation. Data points represent (n = 3) treatments within PAs (humic acid, HA; lignosulfonate sodium, LS; biochemical humic acid, BCHA; and CK1, without the addition of the above-mentioned agents).


Figure 4.
Cumulative phosphate loss via P leaching from the paddy soil during the pot experiment. Data points represent (n = 4) treatments within PAs (humic acid, HA; lignosulfonate sodium, LS; biochemical humic acid, BCHA; RCK1, superphosphate; and RCK0, without the addition of the above-mentioned agents).


Table 1.
Microbial alpha diversity indices in the paddy soil after 50 days of incubation.
| Treatment | No. Of Seqs | Chao1 | Observed Species | Shannon | PD-Whole-Tree | Simpson |
|---|---|---|---|---|---|---|
| CK1 | 135830 | 5475.94 | 4847 | 9.41 | 404 | 0.99 |
| HA | 148782 | 4196.90 | 3708 | 8.95 | 306 | 0.99 |
| LS | 104677 | 4654.08 | 3291 | 6.19 | 283 | 0.89 |
| BCHA | 133075 | 5204.37 | 3922 | 7.14 | 332 | 0.91 |
CK1: No agents, HA: Humic acid, LS: Lignosulfonate sodium, BCHA: Biochemical humic acid. No. of Seqs is short for number of sequences. PD is short for phylogenetic diversity.
Table 2.
Rice growth status in the paddy soil under different treatments.
| Treatments | Effective Tiller Number (No.·pot−1) | Grain Weight (g·pot−1) | Straw Weight (g·pot−1) | Biomass (g·pot−1) |
|---|---|---|---|---|
| RCK0 | 19.00 ± 0.82 ab | 44.86 ± 5.38 b | 29.40 ± 1.36 c | 74.26 ± 6.12 c |
| RCK1 | 20.00 ± 1.90 a | 53.32 ± 1.90 a | 34.85 ± 0.50 ab | 88.17 ± 1.61 ab |
| HA | 17.00 ± 1.87 b | 49.92 ± 1.87 a | 32.41 ± 2.17 bc | 82.32 ± 3.84 bc |
| LS | 19.50 ± 1.29 a | 51.84 ± 2.63 a | 31.40 ± 1.73 c | 83.24 ± 4.06 b |
| BCHA | 20.25 ± 1.89 a | 55.74 ± 4.43 a | 37.49 ± 3.44 a | 93.23 ± 7.87 a |
RCK0: No P fertilizer and no agents, RCK1: Superphosphate, HA: Humic acid, LS: Lignosulfonate sodium, BCHA: Biochemical humic acid. Values are means ± standard errors (n = 4). Treatments with different letter designations (e.g., a, b, c) are significantly different at p < 0.05 while treatments with the same letter designation denote no significant difference. There is no significant difference between the treatment with ab and the treatment with a or b (the same with bc).
Table 3.
Water-soluble P, Olsen P, and total P in the different treatments after the rice was harvested.
Table 3.
Water-soluble P, Olsen P, and total P in the different treatments after the rice was harvested.
| Treatments | Water-Soluble P (mg·kg−1) | Olsen P (mg·kg−1) | Total P (g·kg−1) |
|---|---|---|---|
| RCK0 | 14.95 ± 0.57 b | 65.73 ± 1.33 b | 0.55 ± 0.03 b |
| RCK1 | 17.28 ± 1.06 a | 78.34 ± 3.27 a | 0.63 ± 0.03 a |
| HA | 15.66 ± 1.62 ab | 70.33 ± 3.34 ab | 0.55 ± 0.05 b |
| LS | 15.40 ± 0.74 ab | 71.06 ± 2.10 ab | 0.55 ± 0.03 b |
| BCHA | 15.75 ± 0.94 ab | 72.15 ± 1.32 ab | 0.53 ± 0.03 b |
RCK0: No P fertilizer and no agents, RCK1: Superphosphate, HA: Humic acid, LS: Lignosulfonate sodium, BCHA: Biochemical humic acid. Values are means ± standard errors (n = 4). Treatments with different letter designations (e.g., a, b) are significantly different at p < 0.05 while treatments with the same letter designation denote no significant difference. There is no significant difference between the treatment with ab and the treatment with a or b.
Table 4.
Effects of different activators on rice yield and P utilization.
| Treatments | Effective Tiller Number | Rice Weight (t·ha−1) | Biomass (t·ha−1) | P Utilization |
|---|---|---|---|---|
| T0 | 18.79 ± 1.66 b | 5.89 ± 0.51 b | 10.44 ± 1.90 a | / |
| T1 | 20.17 ± 0.69 ab | 6.28 ± 0.53 ab | 10.86 ± 1.60 a | 9.78% |
| T2 | 21.03 ± 0.41 a | 8.04 ± 0.63 a | 13.86 ± 1.37 a | 42.65% |
T0: No P fertilizer and no agents, T1: Superphosphate, T2: Superphosphate and PA. Values are means ± standard errors (n = 3). Treatments with different letter designations (e.g., a, b) are significantly different at p < 0.05 while treatments with the same letter designation denote no significant difference. There is no significant difference between the treatment with ab and the treatment with a or b.
© 2020 by the authors. Licensee MDPI, Basel, Switzerland. This article is an open access article distributed under the terms and conditions of the Creative Commons Attribution (CC BY) license (http://creativecommons.org/licenses/by/4.0/).
Share and Cite
MDPI and ACS Style
Yao, H.; Chen, X.; Yang, J.; Li, J.; Hong, J.; Hu, Y.; Mao, X. Effects and Mechanisms of Phosphate Activation in Paddy Soil by Phosphorus Activators. Sustainability 2020, 12, 3917. https://0-doi-org.brum.beds.ac.uk/10.3390/su12093917
AMA Style
Yao H, Chen X, Yang J, Li J, Hong J, Hu Y, Mao X. Effects and Mechanisms of Phosphate Activation in Paddy Soil by Phosphorus Activators. Sustainability. 2020; 12(9):3917. https://0-doi-org.brum.beds.ac.uk/10.3390/su12093917
Chicago/Turabian StyleYao, Huanli, Xian Chen, Junying Yang, Jihong Li, Jiale Hong, Yueming Hu, and Xiaoyun Mao. 2020. "Effects and Mechanisms of Phosphate Activation in Paddy Soil by Phosphorus Activators" Sustainability 12, no. 9: 3917. https://0-doi-org.brum.beds.ac.uk/10.3390/su12093917
Note that from the first issue of 2016, this journal uses article numbers instead of page numbers. See further details here.