Assessment of Ecological Carrying Capacity and Ecological Security in China’s Typical Eco-Engineering Areas


1
Key Laboratory of Land Surface Pattern and Simulation, Institute of Geographic Sciences and Natural Resources Research, Chinese Academy of Sciences, Beijing 100001, China
2
College of Resources and Environment, University of Chinese Academy of Sciences, Beijing 100001, China
*
Author to whom correspondence should be addressed.
Sustainability 2020, 12(9), 3923; https://0-doi-org.brum.beds.ac.uk/10.3390/su12093923
Submission received: 1 April 2020
/
Revised: 7 May 2020
/
Accepted: 8 May 2020
/
Published: 11 May 2020
(This article belongs to the Collection Risk Assessment and Management)
Abstract
:The implementation of ecological restoration programs is intensively changing the original ecological carrying capacity and the status of ecological security. To evaluate the spatiotemporal variation of ecological carrying capacity and ecological security in China’s eco-engineering areas, an indicator system of ecological carrying capacity and ecological security should be developed. This study developed an evaluation indicator system that contains 29 indicators. The indicators were generated by long-time series and multi-source data. The indicator system presents the relationship between ecological carrying capacity and ecological security and reflects the dynamic change of them in eco-engineering areas. We selected the Three-River Headwaters Region (TRHR) and implemented the Ecological Conservation and Construction Program (ECCP) as a case study. The results showed the variation of ecological carrying capacity (ECC) and ecological security (ES) in the TRHR before (2000–2004), during early term (2005–2009), and during medium term (2010–2015) implementation of ECCP, and limiting factors of ecological carrying capacity and ecological security in TRHR was analyzed. The results showed that the ECC index and the ES index were significantly increase, indicating that the ECC improved and that the ES state got better in the TRHR after implementing ECCP. The water conservation was the major factors limiting the increase of the ECC. The leading factors limiting the improvement of the ES were educational expenditure before 2010 and turned into proportion of tertiary industry and investments for ecological restoration after 2010. The implementation of the ECCP has improved the ES state but has also resulted in new problems. It provides a scientific reference for future research on the indicator system of ecological carrying capacity and ecological security in eco-engineering areas and also has vital practical significance to guide the sustainable development of ecological restoration programs.
1. Introduction
After population explosion and rapid economic development, which benefited from sacrificing the ecological environment, causing a large number of serious global ecological and environmental problems, people became aware of the importance of ecological sustainable development. As vital issues in the ecological sustainable development field, the ecological carrying capacity (ECC) and ecological security (ES) were published successively [1,2,3]. The proposal of ECC and ES has aroused much discussion on the imbalance between supply and demand of ecological resources. However, the ECC and ES involve various definitions and still constitute a polysemous category [1,4,5].
The formal concept of carrying capacity originated from the maximum size of animal population and was to emphasize the ecosystem pressures caused by limited resources [6]. With the continuous occurrence of sustainable emergency, the concept of carrying capacity was extended to particular fields, such as land carrying capacity [7], water carrying capacity [8], tourism carrying capacity [9], and city carrying capacity [10,11]. Researches on carrying capacity have gradually started to a comprehensive evaluation. Ecological carrying capacity evolved from carrying capacity is a more comprehensive concept and encompasses the aforementioned particular fields [10]. ECC focuses on the material supply provided by ecosystems for human survival and development [12]. In the context of the continuous imbalance between human demand and ecological supply, a series of ecological and environmental problems appear and the concept of ecological security is put forward. ES focuses on the balance between supply and demand rather than on the ecological conditions itself [12]. Obviously, ECC is the core of evaluating ES, and they are closely related, but few studies discussed both ECC and ES. When assessing the sustainability of diverse areas, some researches only focused on ECC [8,9,10,11,12] while others only focused on ES [3,4,13,14]. The main cause of this phenomenon is unclear definitions. The controversy regarding the definitions of ECC and ES involves whether to consider the influence of human on ecosystems, which have led to selecting similar indicators when relevant studies evaluate ECC and ES. Therefore, the results are often incomparable between ECC and ES. Thus, the ECC and ES should be defined before they are assessed. ECC should be a prerequisite for judging whether an ecosystem is safe, whereas ES, which focuses on the relationship between human survival demand and ECC, is the key to judge whether an ecosystem is sustainable. This paper clarifies the definitions and relationship between ECC and ES.
Research studies on ECC and ES have gained considerable interest among scientists and land managers. However, most of the relevant studies have qualitatively or semiquantitatively performed their assessments and generally have taken the provincial level or county level as the smallest research unit [13]. Qualitative and county level evaluations of ECC and ES are insufficient because they lead to a lack of information and an uncertain spatial distribution [14]. In addition, the single time scale, short time span, and lack of dynamics are also shortcomings of such prior studies. With the advances in GIS (Geographic Information System, GIS) and RS (Remote Sensing, RS) technology, the data used for assessing the ECC and ES has exceeded that of previous regional surveys and statistics [15]. It is now possible to reveal dynamic changes and spatial characteristics of ECC and ES through using GIS and RS. Except a comprehensive assessment method, it the key to find the limiting factors of ECC and ES [11]. However, few studies have analyzed the limiting factors for improving ECC and ES.
Under the background of land degradation and the demand of sustainable development, a large number of ecological projects have been initiated at the international and national scales, such as the Prevention and Restoration Actions to Combat Desertification in the European Commission [16], and the conservation programs for cultivated, range, and irrigated lands in America [17]. Since the 1950s, exploitation of natural resources had seriously degraded China’s ecological environment. After suffering multiple accentuated calamities such as famine, floods, and droughts, China responded to these national sustainability emergencies via a series of large-scale ecological restoration programs aimed at alleviating ecological environment degradation and exploring a path of sustainable development. By 2015, China had invested $378.5 billion in 16 nation-level ecological restoration programs, covering 624 million hectares and benefiting over 500 million people [18]. The eco-engineering areas where ecological projects were implemented are undergoing variations of community structure [19], ecosystem service [6,20], land use type [6]. These variations affected the supply of ecosystems and thus changed the ECC. In addition, the awareness and investment for ecological protection coupled with the change of ECC impacted the relationship between supply and demand of ecosystems and, thus, changed the ES. The changes of ECC, ES, and sustainability after ecological restoration were founded by many studies [21,22,23,24,25]. In general, the implement of ecological restoration programs has inevitably changed the original ECC and the status of ES. Assessment of the ECC and ES in the eco-engineering areas caused by natural and human-induced disturbances plays a critical role in providing valuable information about ecological background for designing suitable policy measures to adjust ecological restoration programs.
The Three-River Headwaters Region (TRHR) implemented the Ecological Conservation and Construction Program (ECCP) is a typical eco-engineering area in China. The TRHR, which is located in the hinterland of the Qinghai-Tibet Plateau, is at the headwaters of the Yangtze, Yellow, and Lantsan Rivers in China and has a unique alpine vegetation ecosystem [26]. As an important component of the national ecological security strategic structure—the “Two Screens and Three Zones”—in China, the TRHR plays a significant role for the conservation of water and for stabilizing the climate pattern of China as well as all of Southeast Asia [27]. However, owing to the special geographical position and alpine climatic conditions, the ecosystem in TRHR is fragile and difficult to restore after degradation [28]. In recent decades, with global warming, a series of eco-environmental problems have appeared in TRHR, such as melting glaciers and shrinking wetlands [29]. Meanwhile, the increasingly intense human exploitation via overgrazing and mineral mining has further accelerated the eco-environmental deterioration in TRHR [19,20]. Problems, such as grassland degradation, loss of biodiversity, and soil erosion have seriously threatened the ecological security of TRHR and the entire basin [29]. China has responded to the eco-environmental problems by implementing the ECCP in the TRHR since 2005. The program plans to invest 23.56 billion yuan from 2005 to 2020 to reverse ecological deterioration for ecological restoration and to improve the production and living infrastructure for local farmers [30]. In 2015, the TRHR was designated as the first pilot national park in China based on its nature reserves. The mission of the TRHR has been extended from ecological conservation to exploring a harmonious development relationship between humans and nature [31,32]. It was demonstrated that the ECCP had made positive effects, such as increasing grassland yield [33] and advancing the green-up date [34]. Previous assessment of the ECCP was based on a single indictor. Therefore, there is an acute need for an objective and comprehensive assessment of the ability and state of sustainable development in TRHR.
In short, there are two main problems in the studies of ECC and ES in China’s eco-engineering areas. On the one hand, the concepts or definitions are confusing between ECC and ES [1,4,5]. On the other hand, more and more studies paid attention to the sustainability of eco-engineering areas, but relevant studies in China started late and were rare [21,22,23,24,25]. To fill research gap of ECC and ES and to understand the impact of human disturbance on ECC and ES, this study aimed (1) to provide a feasible framework template of ECC and ES assessment for eco-engineering areas disturbed by human; (2) to evaluate the dynamic changes of ECC and ES; (3) to find the limiting factors of ECC and ES; and (4) to provide a scientific reference for optimizing the ecological restoration programs.
2. Materials and Methods
2.1. Study Area
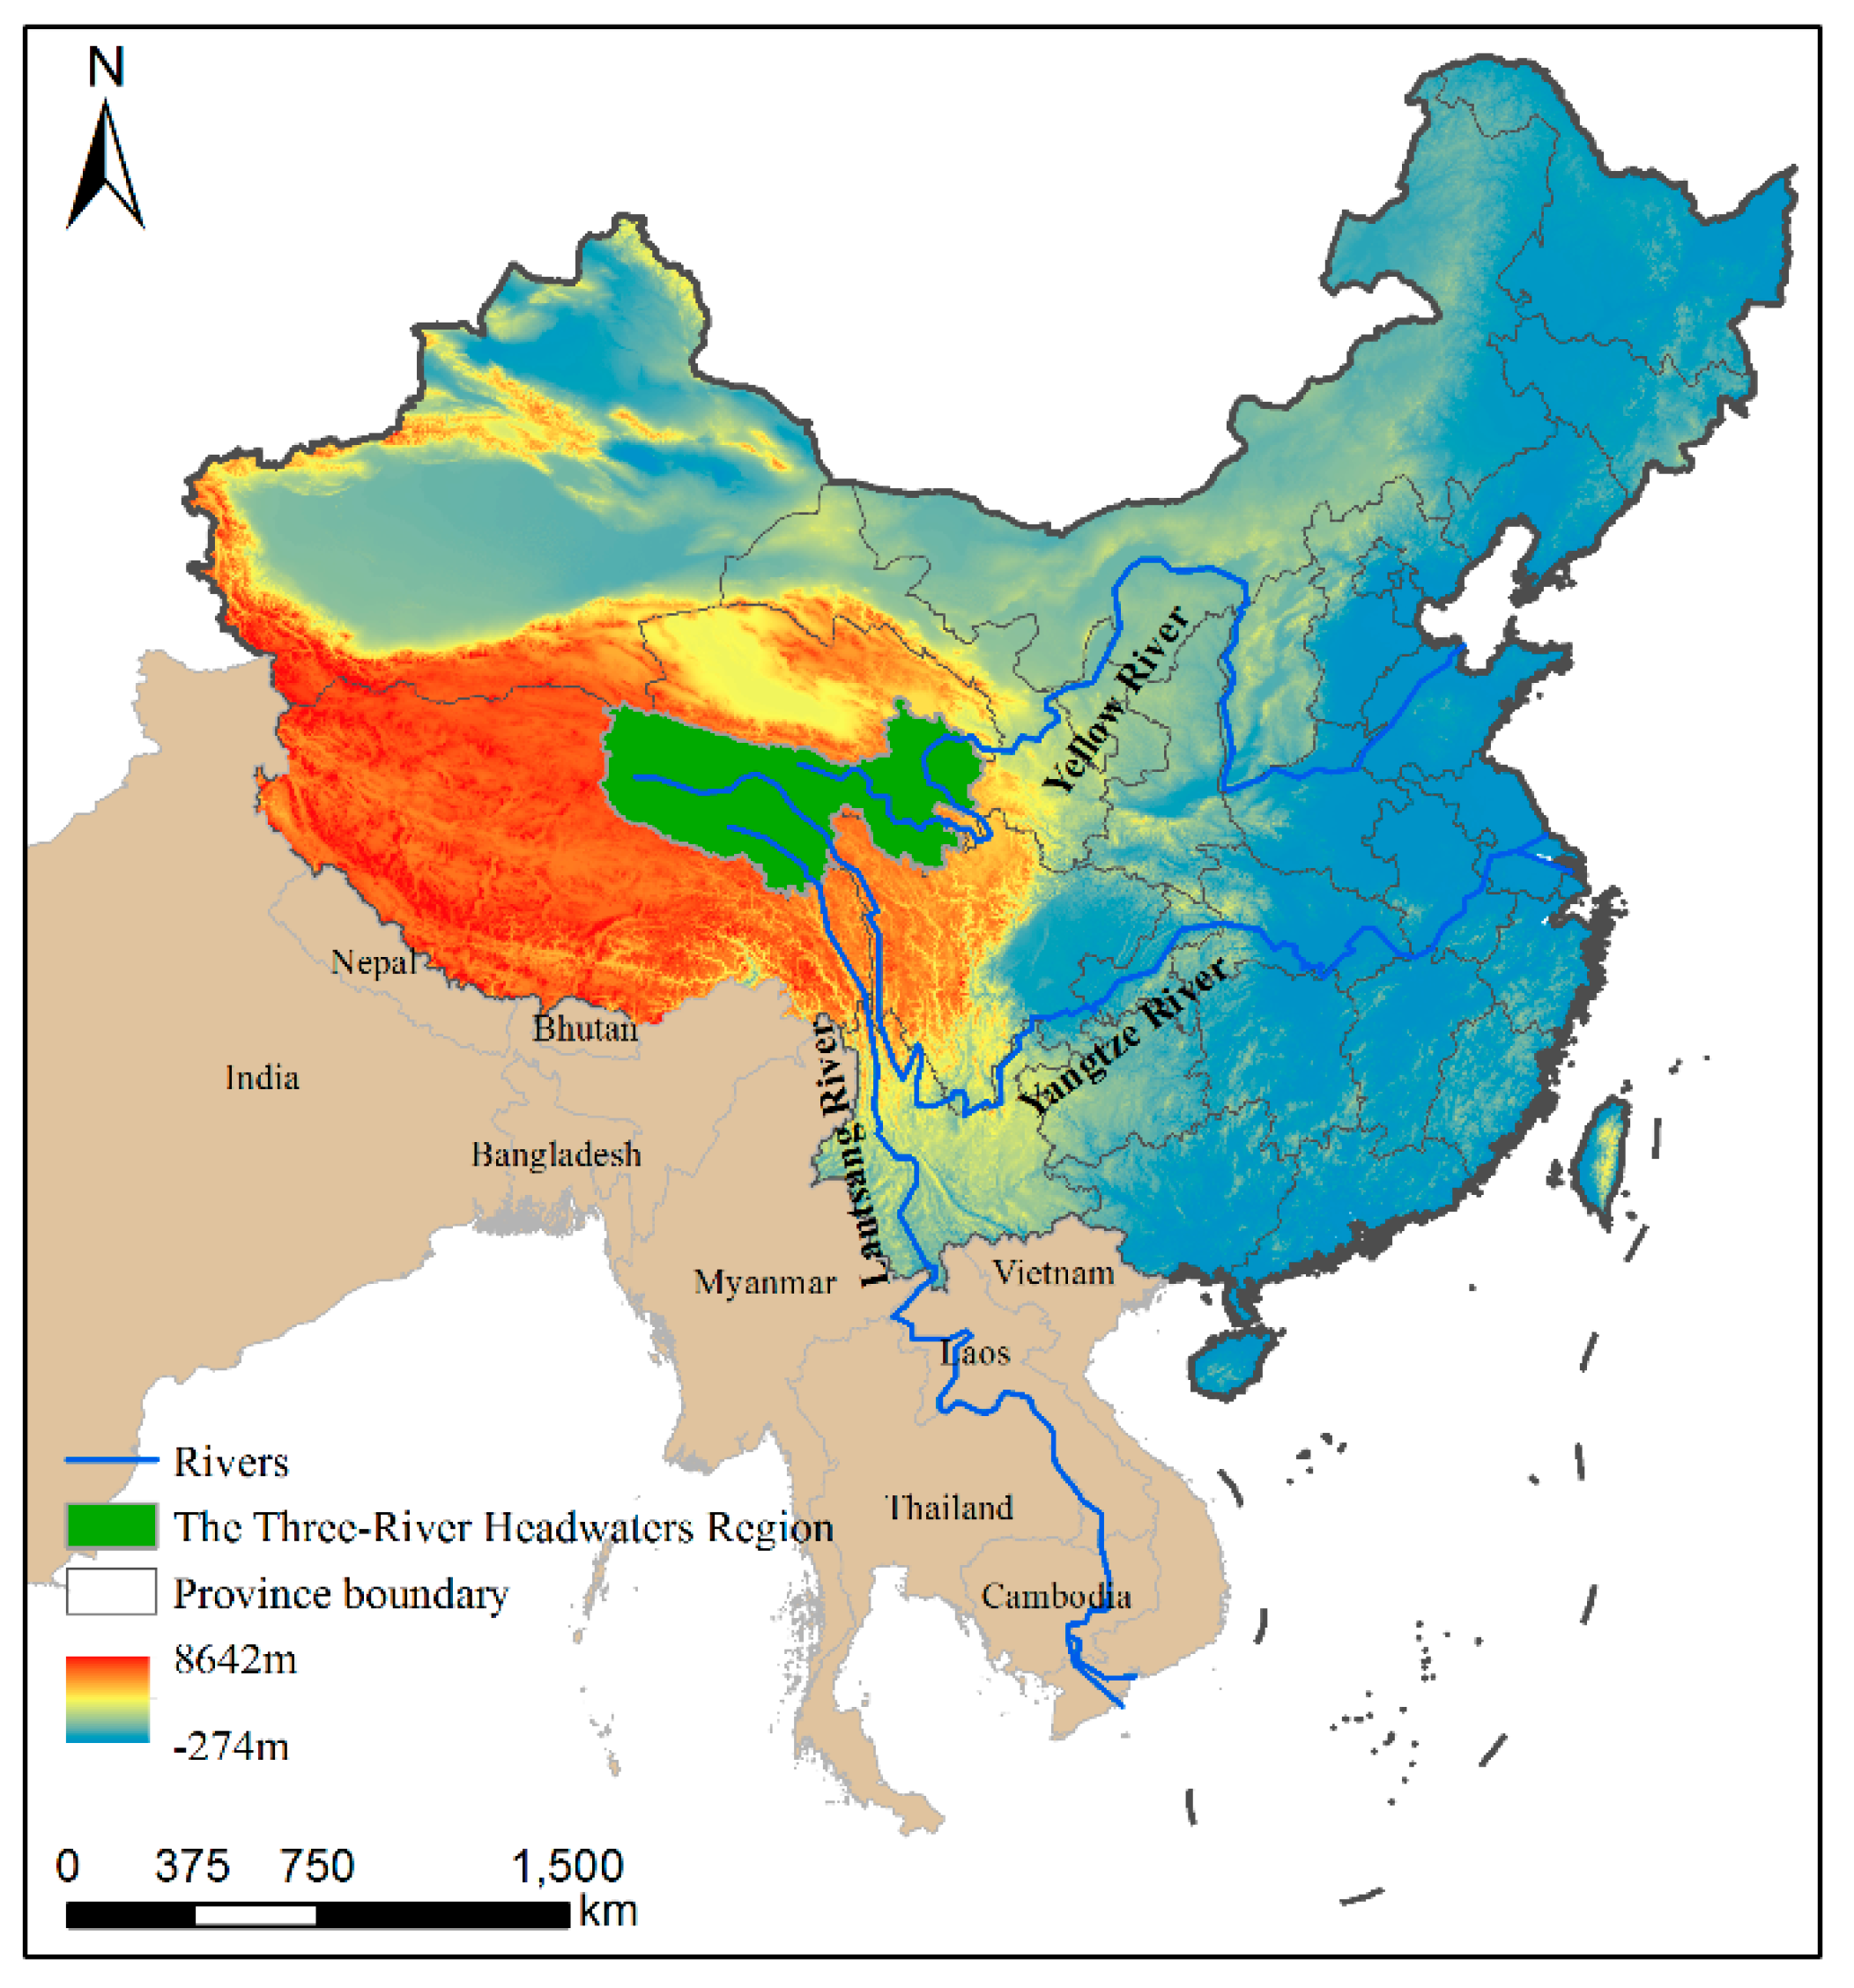
The TRHR is situated in the south of Qinghai Province, China, between 31°36′ and 37°12′ and between 89°22′ and 102°26′ (Figure 1). The region covers an area of 395,000 km² and includes 21 counties and one township. The terrain of the TRHR, where the landform is mainly mountains, rises from southeast to northwest, with an altitude ranging from 1953 to 6748 m (Figure 1). Its typical plateau continental climate is characterized by cold and warm seasons that alternate as well as clear wet and dry seasons with a mean annual temperature of –3.59 °C and a mean annual precipitation of 447.81 mm. Grassland that covers 57.45% of the total area is the main ecosystem type in TRHR. Affected by terrain and hydrothermal conditions, the grasslands show a transition from temperate steppe (below 3500 m), alpine meadow (3500–4000 m), alpine steppe (4000–4500 m), and alpine desert (above 4500 m) from the southeast to northwest [19]. The TRHR, which is called the “Chinese water tower”, has abundant freshwater resources, including more than 180 rivers, 16,500 lakes, 666,600 km² of freshwater marsh, and 1812 km² of glaciers [30]. Moreover, the TRHR is rich in biodiversity in the plateau. There are 2308 species of identified vascular plants, more than 1000 of which are native to China and 40 species that are rare, endangered, and protected species in China, and 338 species of identified animals, of which 69 species are endangered and protected species of China [35].
The population in the TRHR is growing fast. In 2015, the population of the TRHR was 1,352,000, with an increase of 37.27% compared with that of 2000. The population of ethnic minorities exceeds 90% of the total population, and the population that is engaged in agriculture and animal husbandry exceeds 80% of the total population. Regarding education in TRHR, less than 20% of the total rural labor force finishes nine-year compulsory education, which lags behind that of most regions in China. The TRHR has low social development and a simple economic structure. The average annual income of farmers and herdsmen who depend on traditional animal husbandry is less than 4000 yuan (calculated based on Qinghai Statistical Yearbook [36]).
2.2. Development of an Indicator System for Assessing ECC and ES
ECC, a key indicator to reflect the supply capacity of ecological capital to human’s socioeconomic activities, is the prerequisite for evaluating ES [11,12,37]. In this paper, we define ECC as the maximum bearing capacity determined by the structure, process, and spatial pattern of ecosystems and define ES as the characterization of the health status of sustainable coexistence of ecosystems with human society. The concept of ES not only reflects whether an ecosystem is healthy but also describes the relationship between human activities (carrying object) and the eco-environment (carrier) to ensure sustainability.
Based on the aforementioned definition and analysis, the indicator system is developed in three steps. Firstly, we conducted a review of indicators with literature, policy documents, government or agency reports, etc. Secondly, the indicators were refined according to eco-engineer area’s characteristics and data availability. Thirdly, the indicators were adjusted for improvements based on the definition of ECC and ES and on the relationship between the criteria layers. The indicator system developed should follow the principles of integrity, simplicity, independence, operability, and data availability.
In order to distinguish ECC and ES and to clarify their relationship, we developed the indicator system of ECC and ES in this study. The indicator system of ECC contains 15 indicators selected from climate layer, land layer, biota layer, and water layer. The criteria layer could reflect the background of present situations and quality of resource and eco-environment supporting human activities. Specific indicators are shown in Table 1.
Based on the definition of ES mentioned above, the core idea for assessing ES is how human activities change the ECC and whether ecosystems are sustainable. We chose the “pressure–state–response” framework (PSR) that was proposed by the Organization for Economic Cooperation and Development as the foundation of our indicator system for assessing ES. The PSR framework consists of indicators to estimate pressures from human activities, indicators reflecting current ecological status, and indicators representing human response to ecological environment problems. Finally, 14 indicators were selected in the PSR indicator system of ES. Specific indicators are shown in Table 2.
2.3. Data Collection and Processing
To evaluate the changes in the ECC and ES before and after implementation of the ECCP in TRHR, considering the time span of the ECCP, we chose three periods for our study: 2000–2004 (before implementation of the ECCP), 2005–2009 (early term implementation of the ECCP), and 2010–2015 (medium term implementation of the ECCP). The mean value of each indicator during each period was selected as the calculated value to eliminate the effects of interannual variability of each indicator on the results.
Data were obtained by model calculations and statistics. Statistical data, including meteorological, socioeconomic, and ecological environmental monitoring data, was derived from the China National Meteorological Information Center, Statistical Yearbook of Qinghai Province, the Qinghai Farming and Animal Husbandry Statistical Manual, the Bulletin of the State Environment in Qinghai, and the Report of Water Resources Monitoring in TRHR. The wind erosion modulus, water erosion modulus, water conservation, ANPP (Aboveground Net Primary Production, ANPP), and vegetation coverage were estimated using model simulations. Details of how all the ECC and ES evaluation indicators were collected or calculated are shown in Table 1 and Table 2.
Because each indicator has different dimensions, all indicators must thus be standardized to eliminate incompatibilities among the parameters when utilizing the indicators. We used the range normalization method to standardize each qualitative indicator. Additionally, the trends of indicators influencing ECC or ES are inconsistent; thus, the indicators were divided into two types depending on their impact on the ECC and ES: positive (+) and negative (-). The bigger the positive indicators value, the higher ECC or the better ES, whereas the bigger the negative indicators value, the lower ECC or the worst ES. Table 1 and Table 2 give the type of indicators. For positive indicator, the following standardized formula was used:
where Xi,j is the standardized value of indicator i in year j; xi,j is the actual value of indicator i in year j; and xi,min and xi,max are the minimum and maximum values observed in all actual measurements of indicator i for 2000–2015. According to this formula, the value of indicator i is always between 0 and 1. A large value of Xi,j means that indicator i has a strong impact on the ECC or ES, whereas a small value of Xi,j suggests correspondingly small impacts.
Negative indicators with the conceptual meaning of Xi,j contradicts the impact that would be judged using this formula (e.g., a large positive value for the water erosion modulus has a large negative impact on the ECC); then, Xi,j should be calculated using a modified version of this formula:
An analytical hierarchy process (AHP) method was carried to combine multi-indicators in indicator system and then further aggregated to become the ecological carrying capacity index (ECCI) and ecological security index (ESI) by the following equations:
where Xi and Yj are the standardized value of indicator i and j in the indicator system of ECC and ES, respectively; Wi and Wj are the weight of indicator i and j in the indicator system of ECC and ES, respectively; and wi and wj are the weight of criterion layer k and t in the indicator system of ECC and ES, respectively. The ranges of ECCI and ESI are between 0 and 1. The larger the ECCI value, the higher the ECC. The larger the ESI value, the better the ES status. Through the judgment matrix of AHP, we invited experts who are very familiar with the TRHR, including researchers and policy makers from various organizations, to score for the relative importance of the indicators in criteria layer and indicator items, so as to calculate the weight of criteria layer and indicator items. Table 1 and Table 2 show the weights of criteria layer and indicators items.
In this study, all data processing and spatial analyses were mainly conducted in ArcGIS 10.3 software in Krasovsky_1940_Albers projection. All evaluation data were collected and quantified in different units and at different scales; for instance, water erosion modulus was calculated and characterized by the raster units of 1 km × 1 km, the vegetation types data were collected at the vector data format, and the dosage of pesticides were collected at the county-level of Qinghai Province. To comprehensively assess ECCI and ESI index in the TRHR, we resampled, interpolated, and converted all data to a uniform grid of 1 km × 1 km. Then, using Equations (3) and (4), all indicators were aggregated. Lastly, ES was grouped into six classes (critical, unsafe, endangered, basically safe, safe, and very safe) in ArcGIS by the Jenks natural break optimization for ESI and into the uniform interval ranges of 0–0.45, 0.45–0.5, 0.5–0.6, 0.6–0.65, 0.65–0.7, and 0.7–1 for ESI.
Regression analysis and significance test were applied to analyze the changing trend of ECC and ES for 2000–2015. In this paper, we introduce the concept of a cask effect to analyze the limiting factors present as part of the ECC and ES in TRHR. This analysis could help us determine which indicator is the limiting factor for increasing ECC or improving the ES status.
3. Results
3.1. Spatial and Temporal Changes in the ECC and ES in TRHR
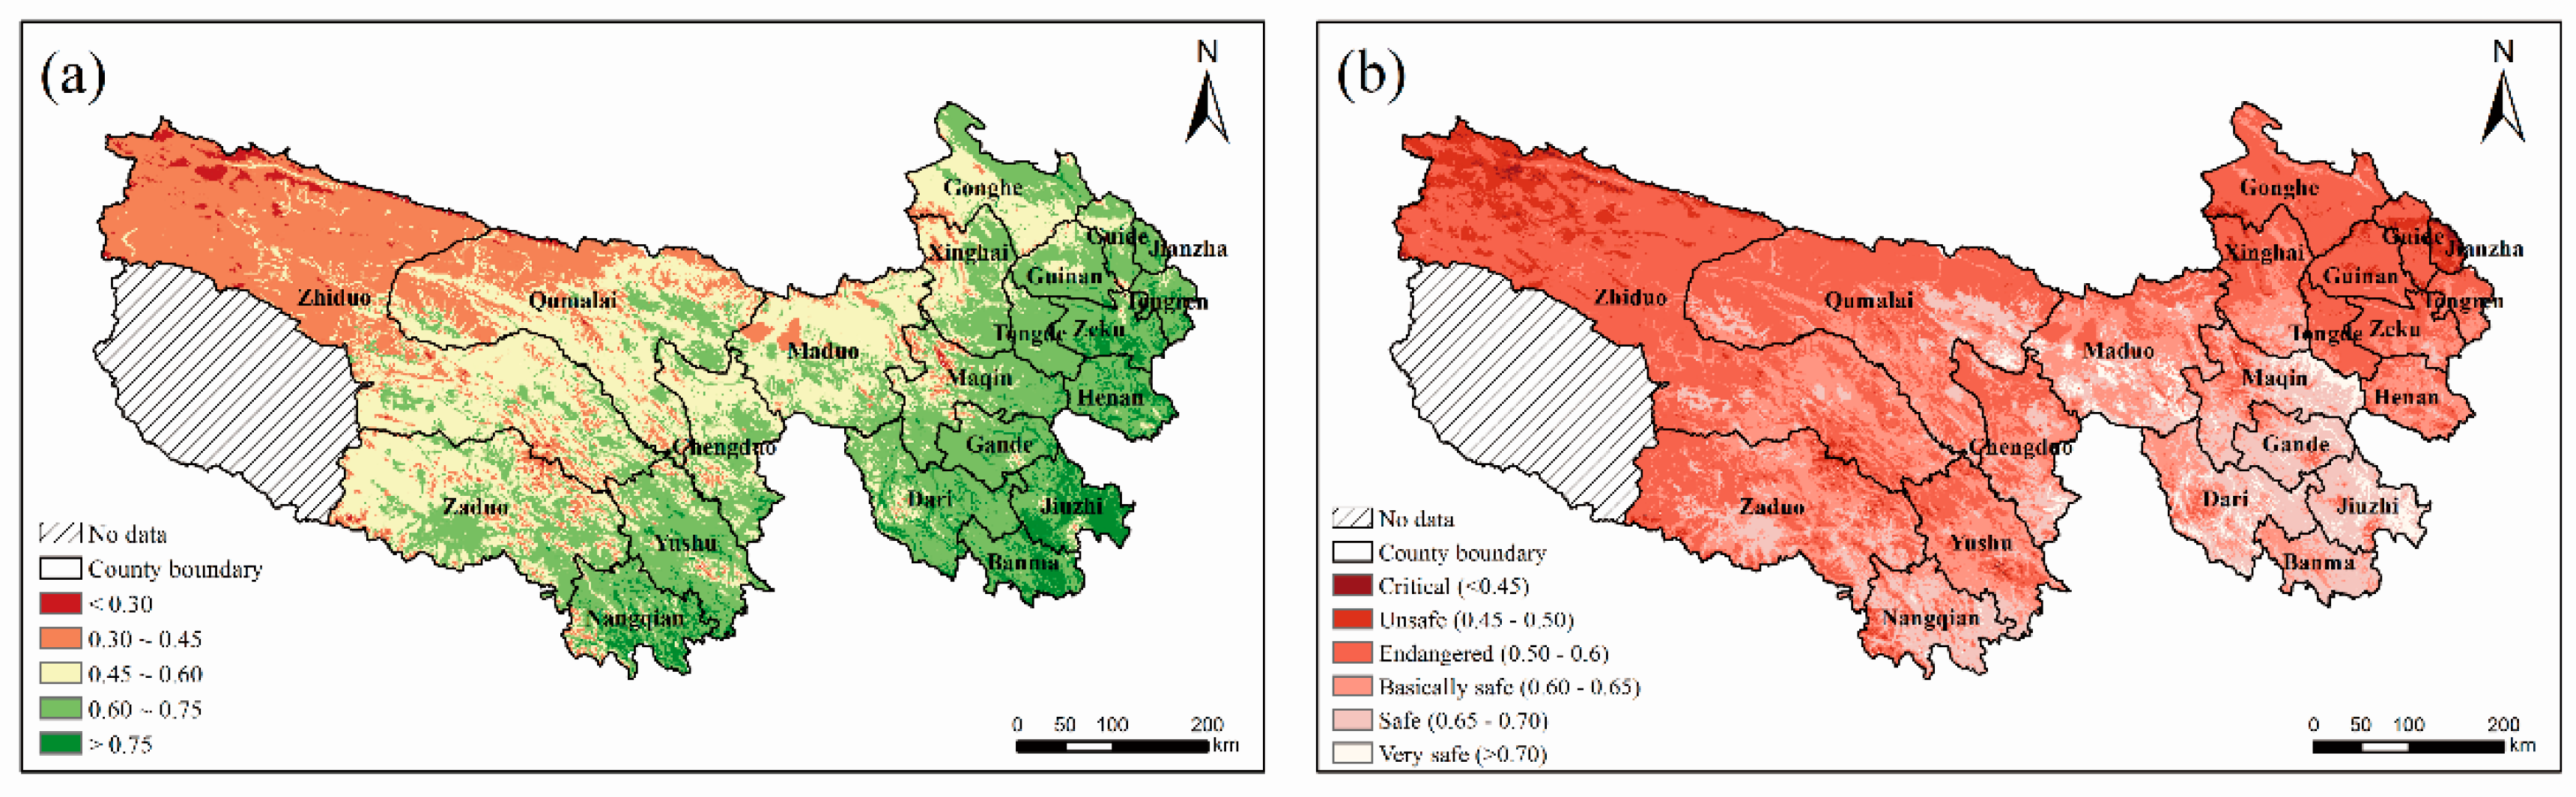
The mean ECCI for the entire Three-River Headwaters Region (TRHR) was 0.559 for 2000–2015, which indicates that the mean ECC in TRHR was at the medium but close to a good level. The spatial pattern decreased from southeast to northwest. The ECCs of Banma, Jiuzhi, Henan, Zheku, and Nangjian counties in the southeast were relatively high, while those of Zhiduo and Qumalai in the northwest and Maduo and Chengduo in the center were relatively low (Figure 2a).
The mean ESI for the entire TRHR was 0.595, which indicated that the ES status of the TRHR was between endangered and basically safe. The spatial pattern of ES shows serious heterogeneity in TRHR. The ES statuses of Zhiduo, Qumalai, and Zheku counties in the west and Guide, Jianzha, Guinan, Gonghe, and Tongde counties in the east are relatively good, while those of Jiuzhi, Banma, Dari, Gande, and Maqin counties in the southwest and Nangqian County in the south are relatively bad (Figure 2b).
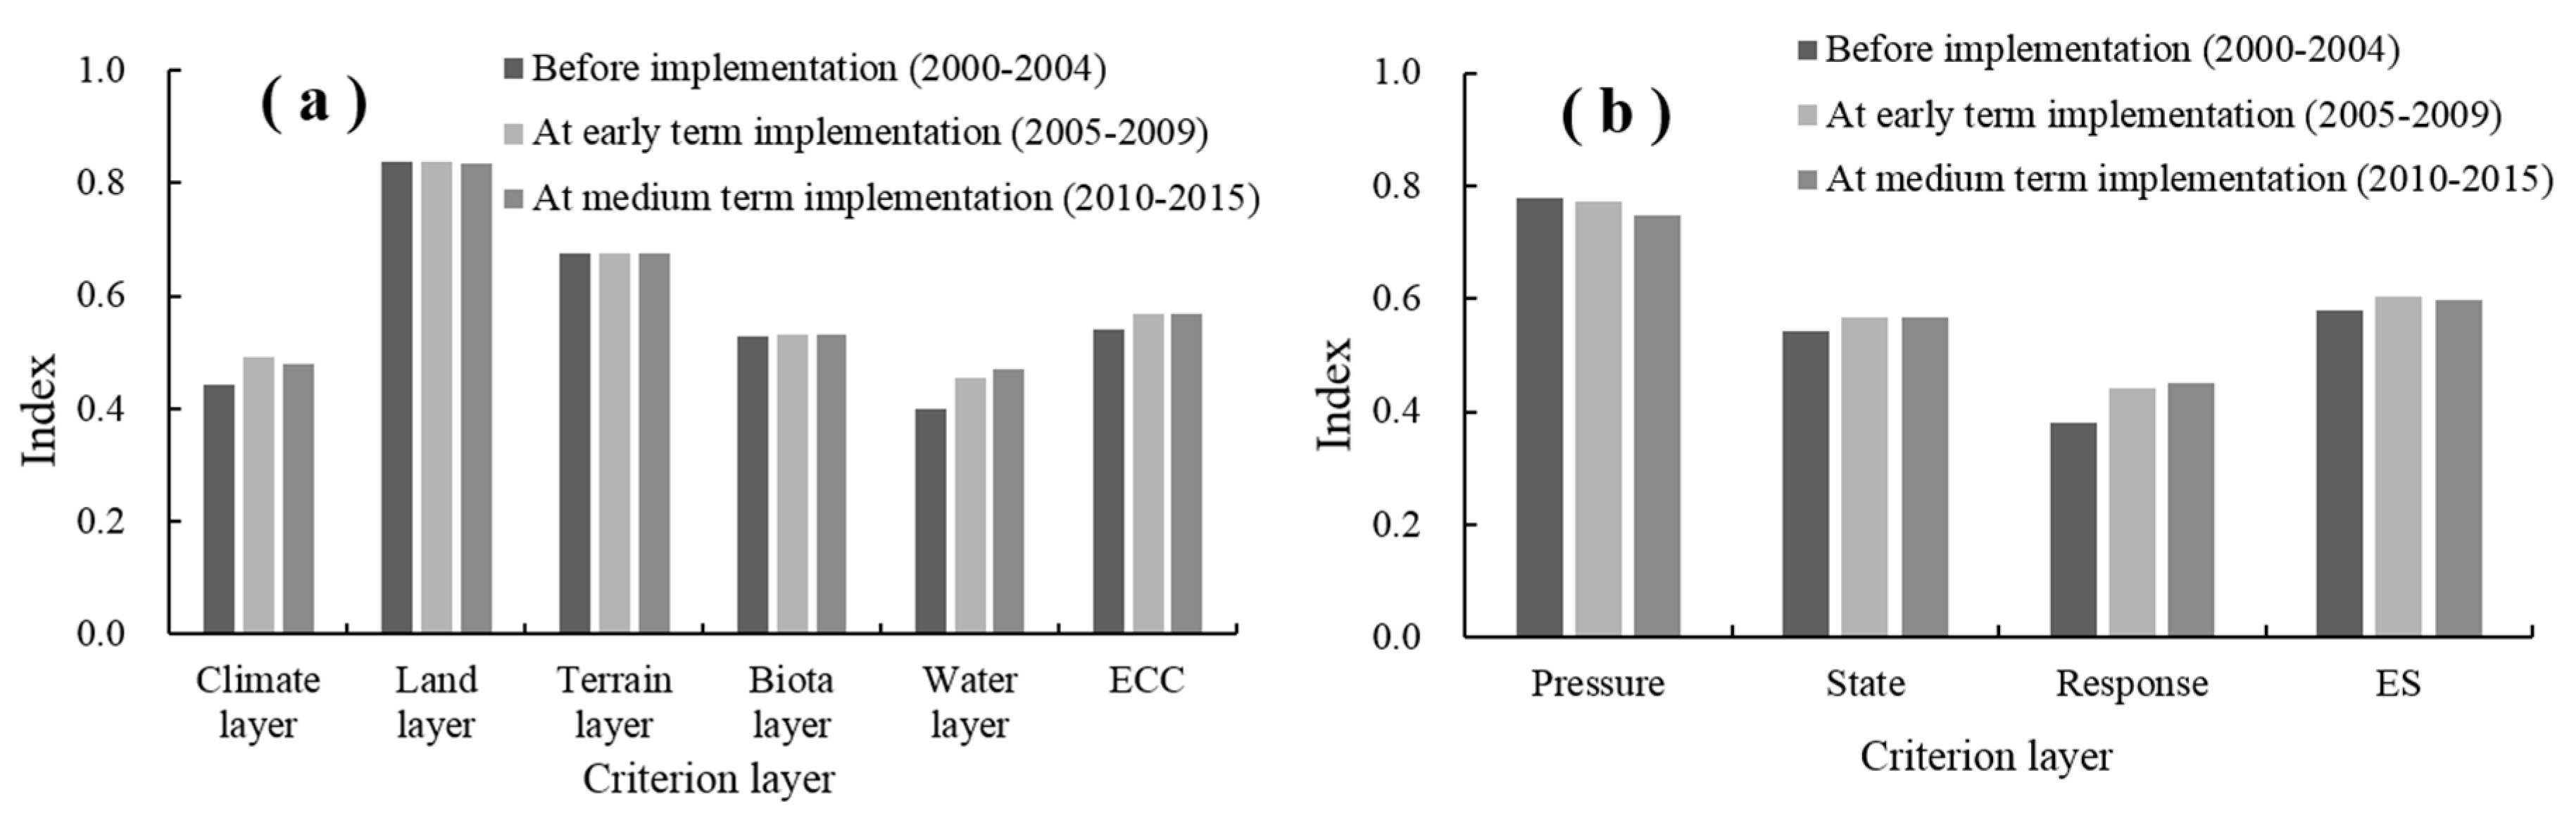
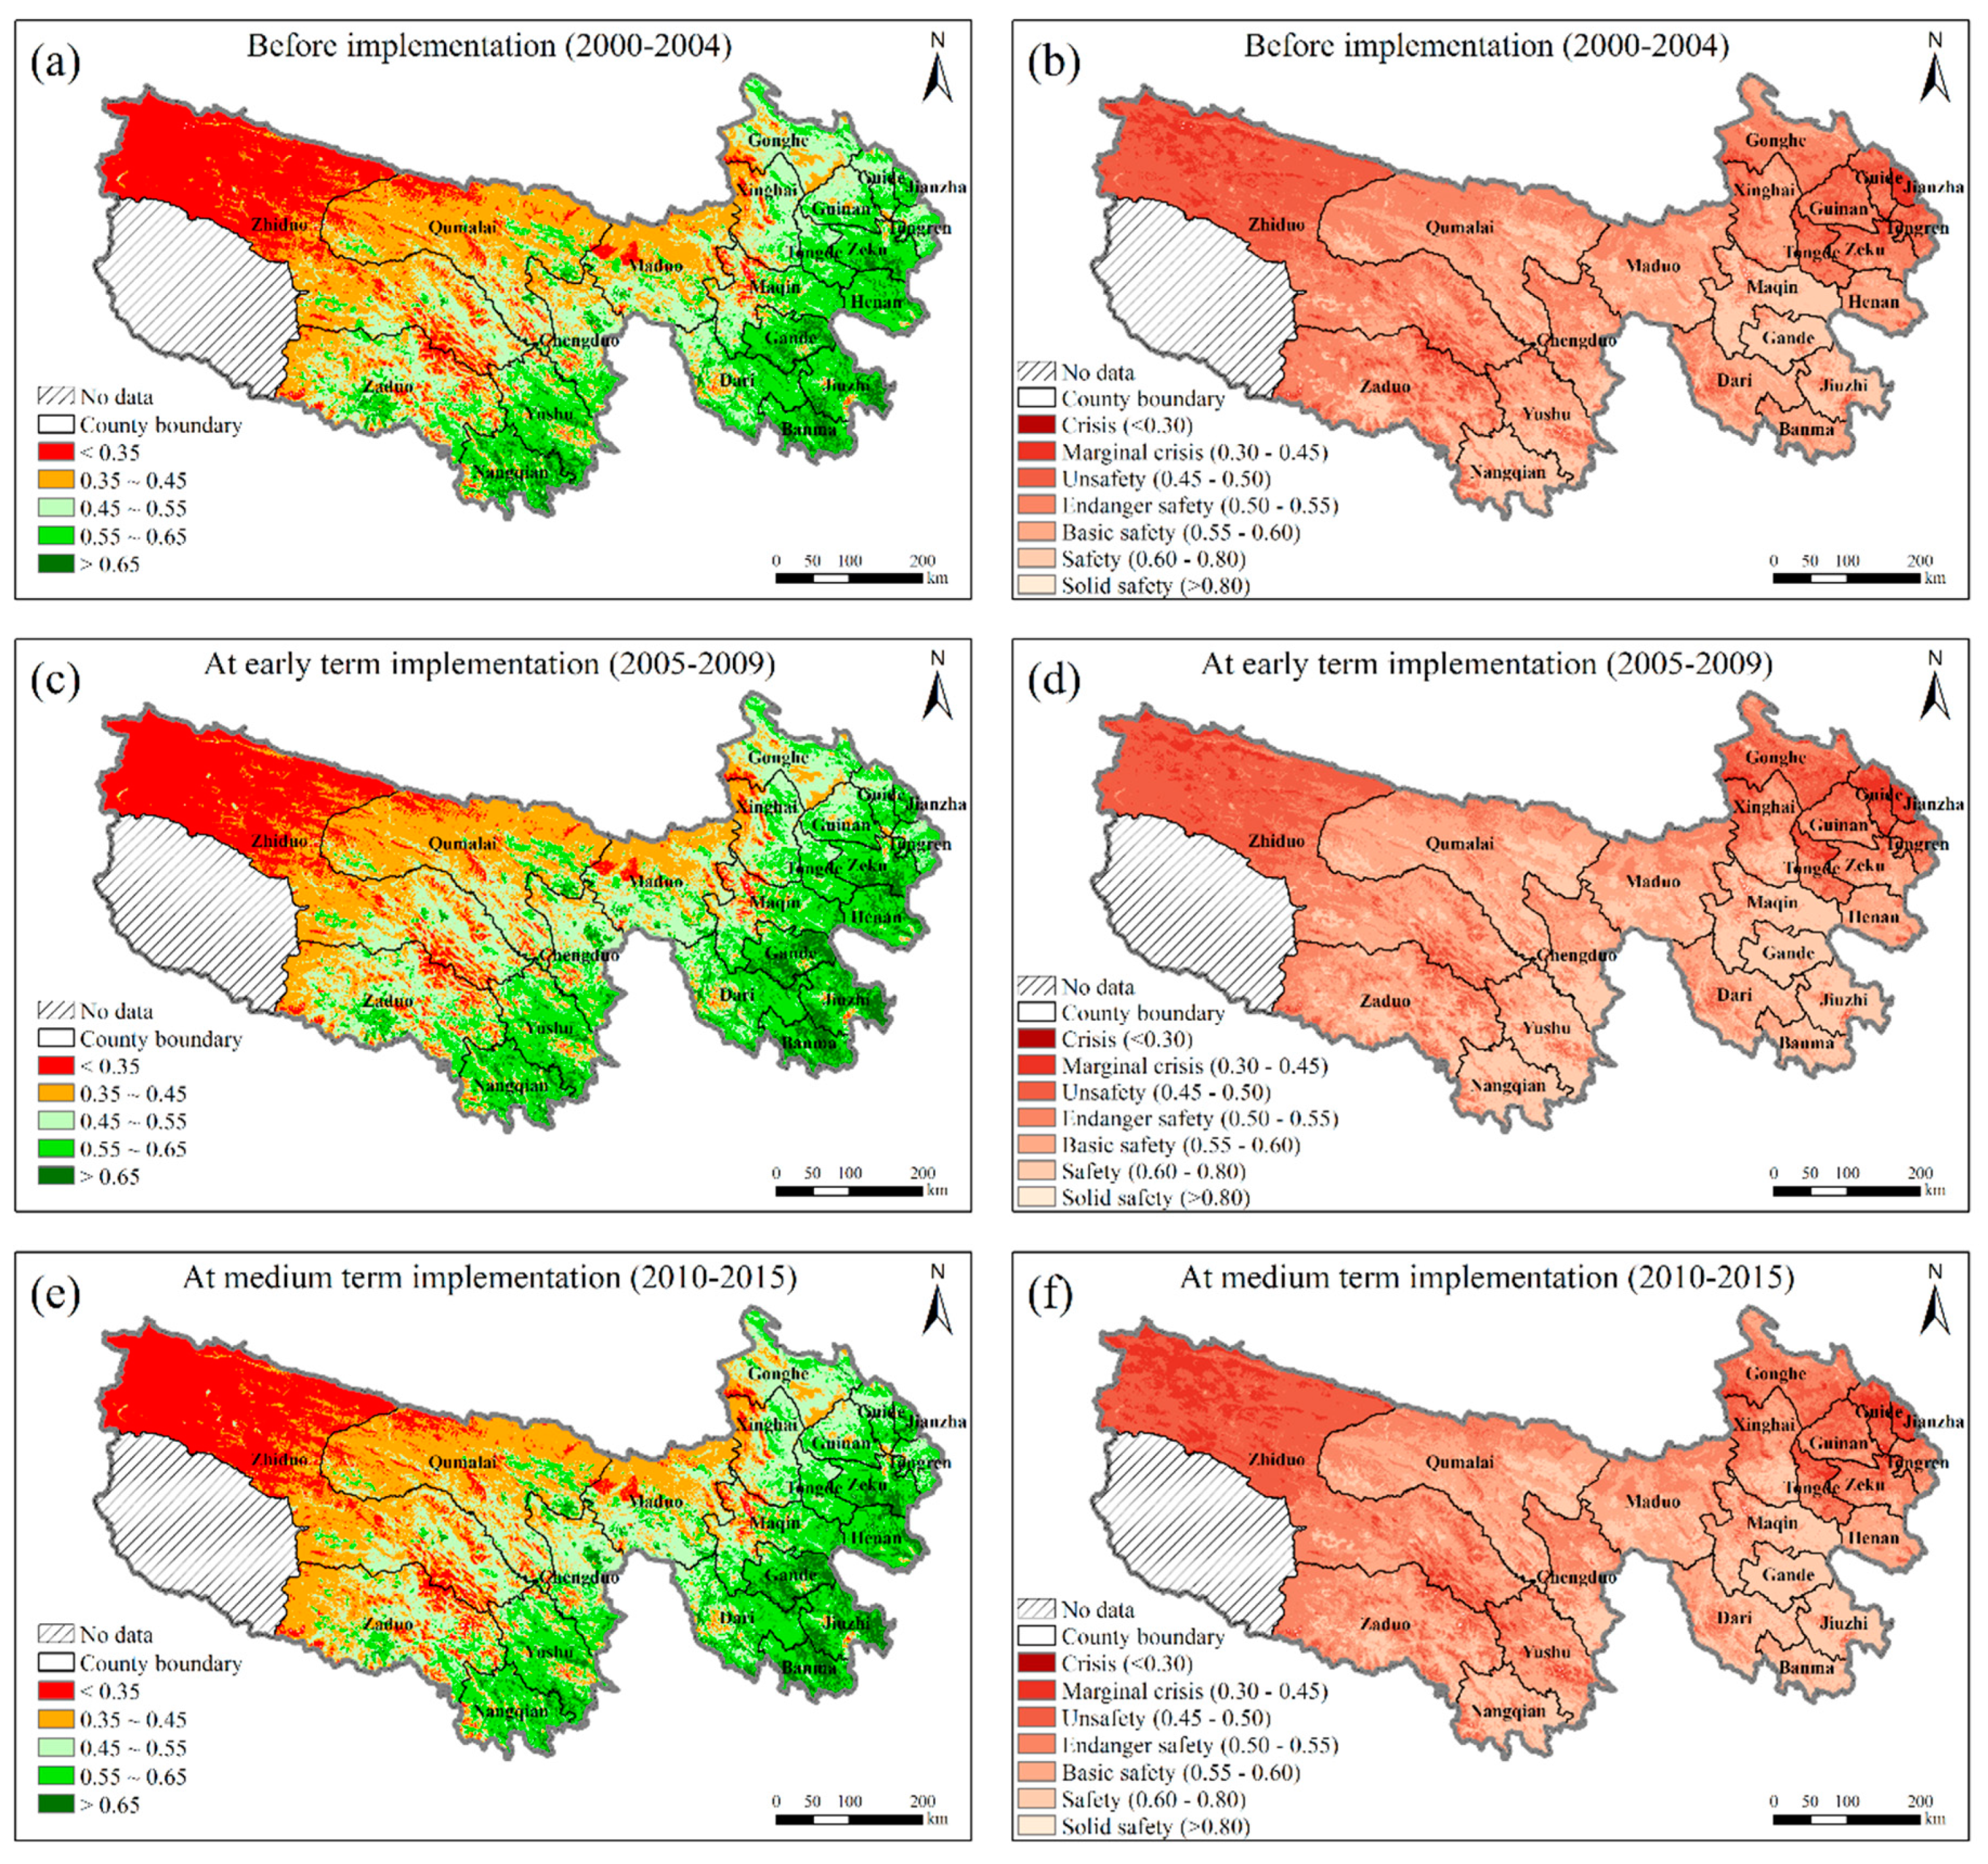
For 2000–2015, ECCI showed a statistically significant increasing trend (slope = 0.002/yr, p < 0.01), suggesting the ECC was improving in TRHR. Compared with the ECCI before implementation, ECCI at medium term implementation increased from 0.541 to 0.568 (Figure 3a). Spatially, the area with the high ECC (ECCI > 0.75) increased in the southeast of the TRHR, whereas the area with the low ECC (ECCI < 0.30 and 0.30–0.45) decreased in the west and the area with different classes basically remained unchanged (Figure 4a,c). The ECC during the medium term of the program (2010–2015) changed little compared with that during early term of the program (2005–2009) (Figure 4c,e), and the ECCI during the early and medium terms of the program were 0.567 and 0.568, respectively (Figure 3a). In terms of criterion layer, the land layer index was the highest and the climate layer and water layer index were the lowest. The land layer, terrain layer, and biota layer index were stable during the three periods of the program. The water layer index increased gradually as program implementation progressed. Moreover, the climate layer index fluctuated considerably, which was improved after implementation of the program but decreased during the medium term of the program (Figure 3a).
For 2000–2015, the ESI significantly increased at a slope of 0.002 per year (p < 0.05), indicating that the ES status of the TRHR considerably changed but the increasing trends slowed down after medium-term implementation. Before implementation of the program, during early-term and medium-term implementation of the program, the ESI was 0.580, 0.604, and 0.599 (Figure 3b). Compared with before implementation of the program, the ES status of Maqin, Gande, Jiuzhi, Banma, and Dari counties in the south and Maduo County in the center improved during early-term implementation of the program, and the ES status further improved during medium-term implementation of the program upon expansion of the safe and very safe areas in these counties. Compared with before implementation of the program, the ES status of Zhiduo County in the west improved during early-term implementation of the program, but the improvement decreased during medium-term implementation of the program because of the decrease in the critical and unsafe areas (Figure 4b,d,f). From the perspective of the criterion layer, although the pressure layer index was higher, it decreased as the program implementation progressed. Meanwhile, the lower response layer index obviously increased (Figure 3b).
3.2. Analysis of the Limiting Factors for ECC and ES in TRHR
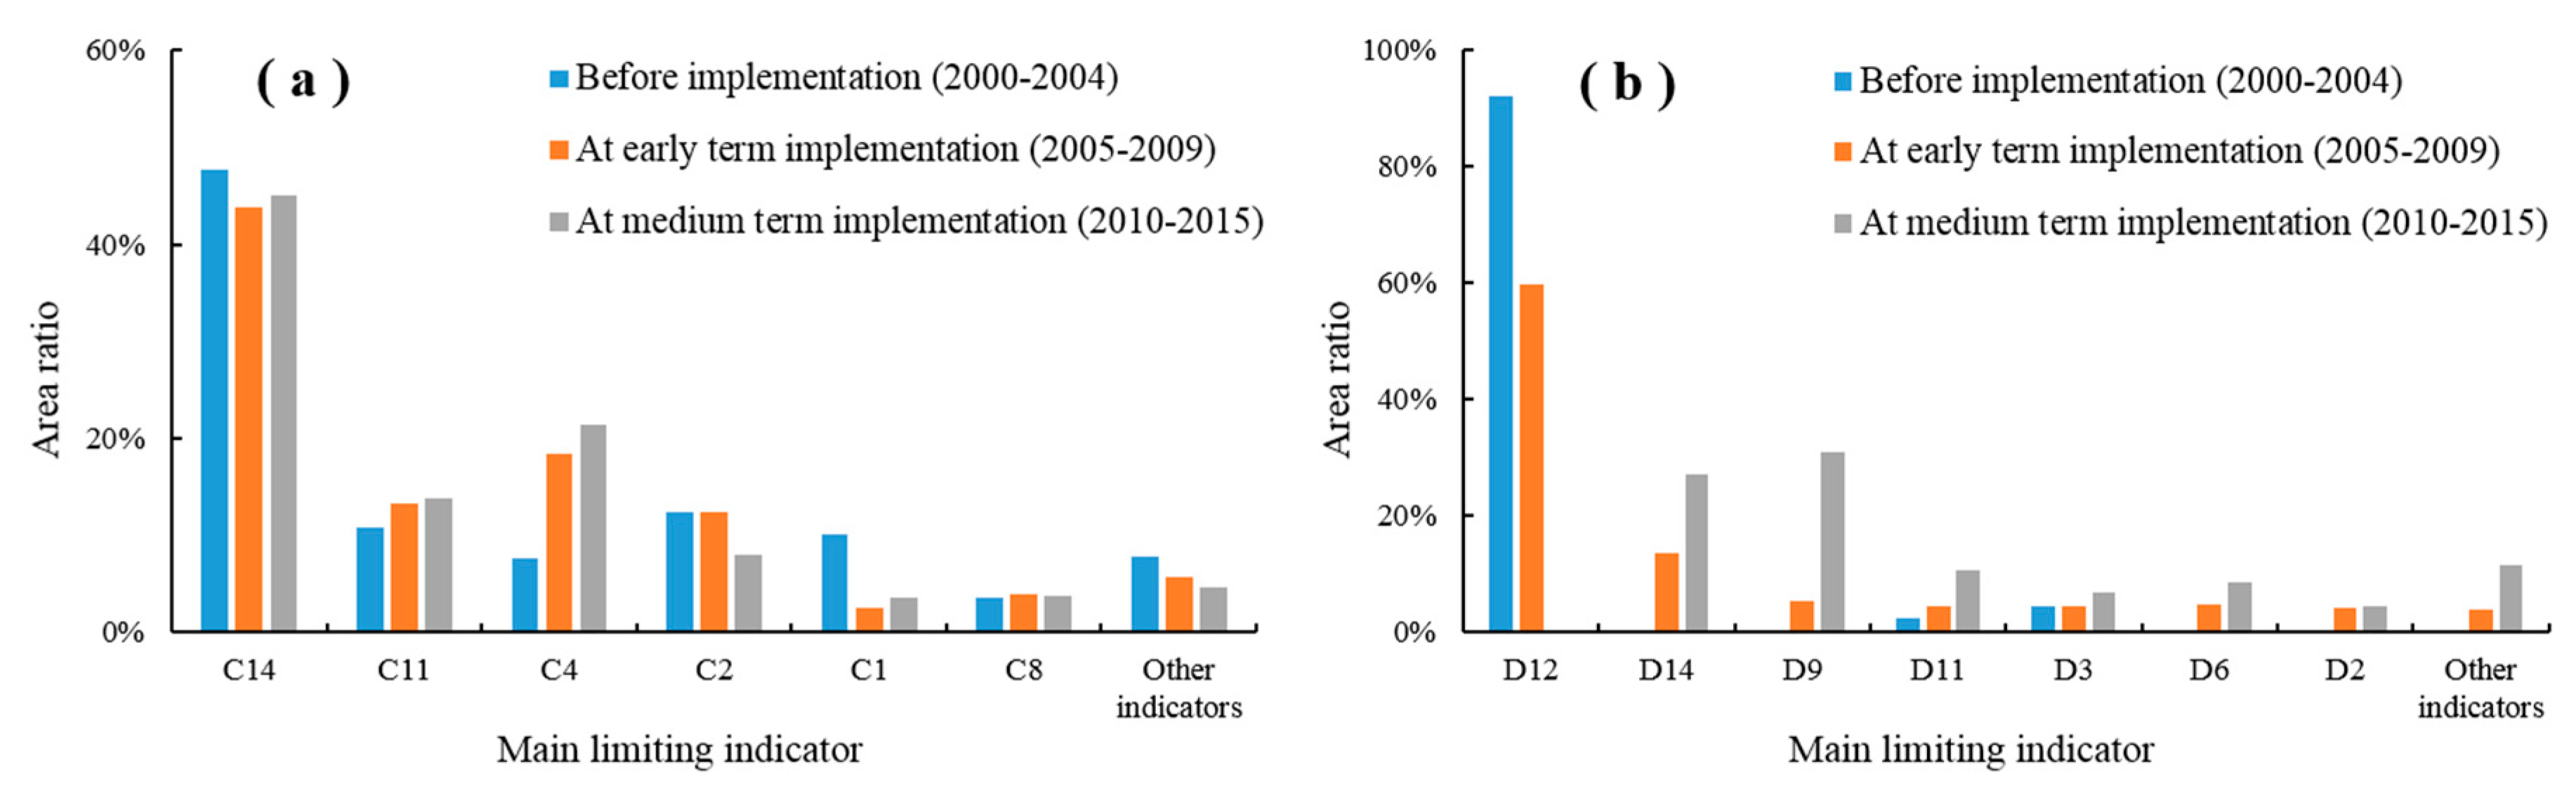
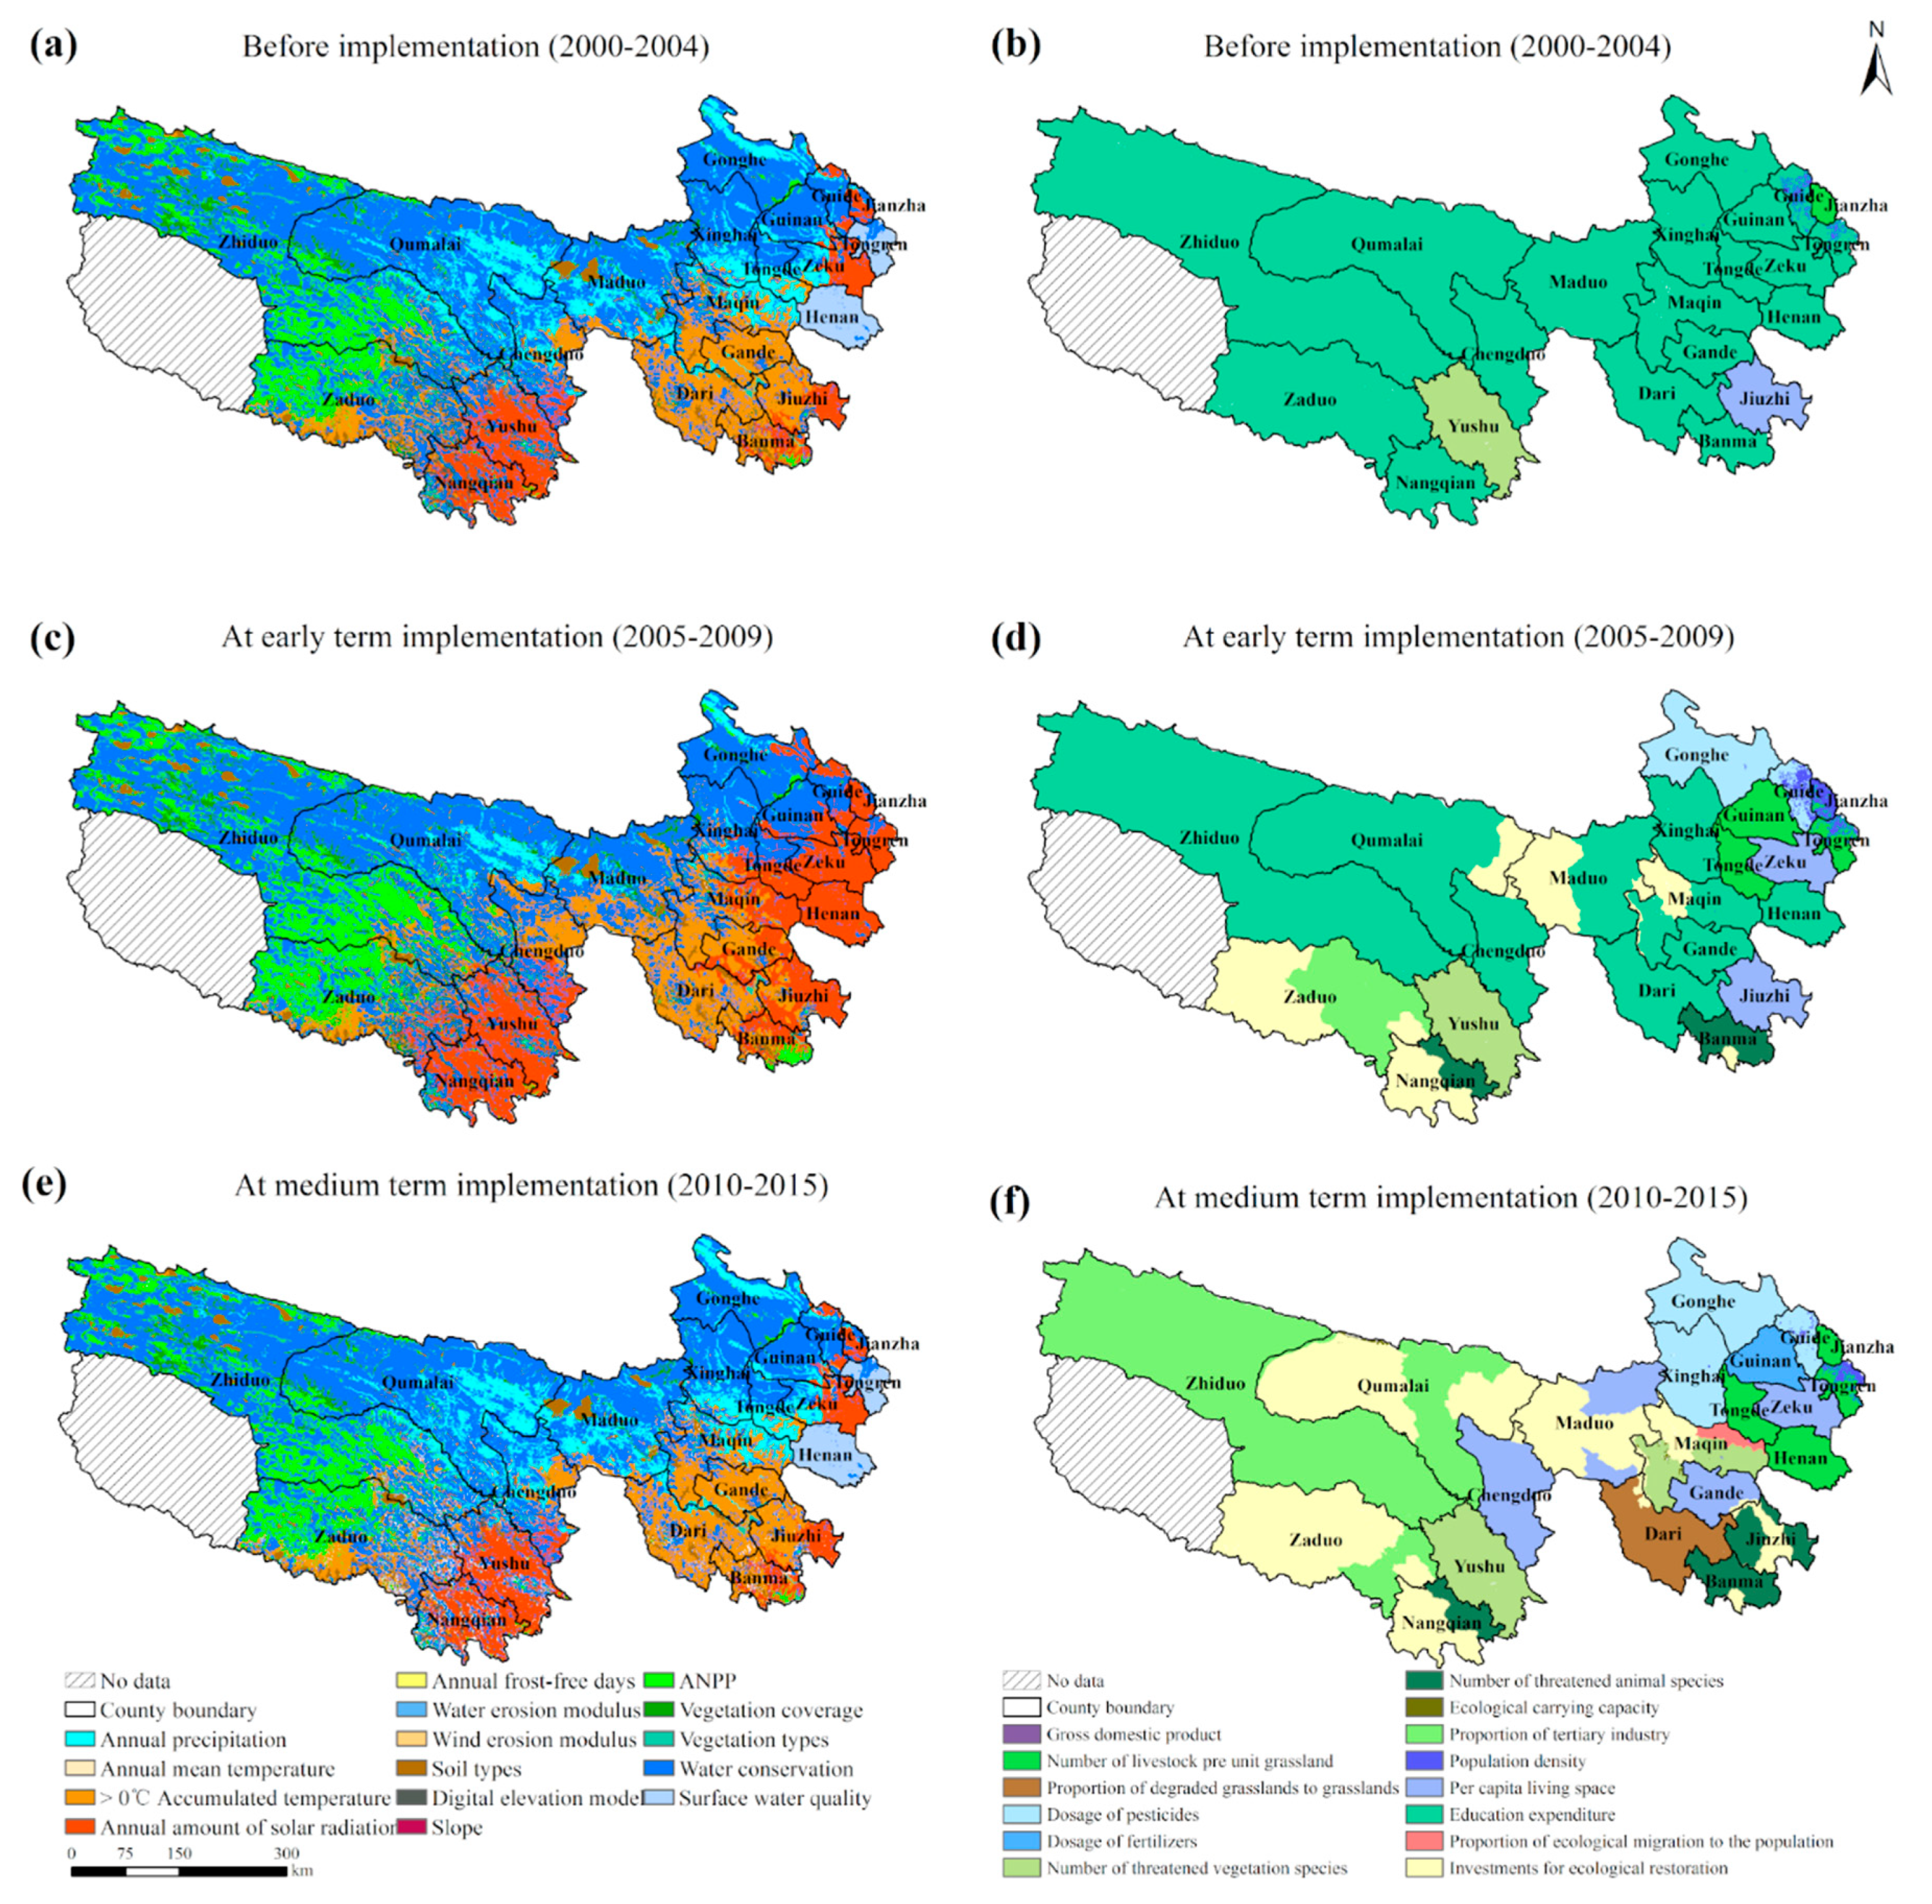
For the three periods, the main limiting indicators for ECC and the area of each limiting indicator changed little in TRHR. According to the proportion of each indicator area in the calculated area of the TRHR, the main limiting indicators for ECC were water conservation, ANPP, annual amount of solar radiation, >0 °C accumulated temperature, and annual precipitation, among which the area of water conservation as the first limiting factor was more than 40% of the calculated area in the TRHR (Table 3, Figure 5a). In Zhiduo, Qumalai, and Zaduo counties in the west, the main limiting indicators remained unchanged during the three periods, which were ANPP and water conservation. In Nangqian and Yushu counties in the center, the main limiting indicator was the annual amount of solar radiation. In Maduo and Chengduo counties in the center, the main limiting indicators were water conservation and annual precipitation, but the area of >0 °C accumulated temperature, and annual amount of solar radiation increased after implementation of the program. In the east, the main limiting indicators were annual precipitation, water conservation, >0 °C accumulated temperature, and surface water quality before implementation of the program, while the area of annual precipitation and surface water quality decreased and the area of annual amount of solar radiation increased after implementation of the program (Figure 6a,c,e).
For the three periods, the main limiting indicators for ES changed little but the area for each limiting indicator considerably changed. Educational expenditure, the proportion of tertiary industry, investments for ecological restoration, the number of threatened animal species, per capita living space, and dosage of pesticides were the major limiting indicators for ecological security during the three periods (Figure 5b). Before implementation of the program, the main limiting indicator was educational expenditure at 92.21% of the calculated area in the TRHR (Table 4) while the other limiting indicator is the number of threatened vegetation species in Yushu County, i.e., per capita living space in Jiuzhi County (Figure 6a). During early-term implementation of the program, the proportion of educational expenditure decreased to 59.69% (Table 4). During this period, some areas where investments in ecological restoration, the number of threatened animal species, and the proportion of tertiary industry were limiting indicators that appeared in the middle part of the TRHR; in addition, some areas where the dosage of pesticide, number of livestock per unit grassland, and population density were limiting indicators appeared in the east (Figure 6d). During medium-term implementation of the program, areas where educational expenditure was the limiting indicator mostly disappeared. At the same time, a new spatial pattern showed that the indicator items for response layer (such as proportion of tertiary industry, investments in ecological restoration, and per capita living space) were main limiting indicators in the west and middle parts, while the indicator items for the pressure layer (such as the dosage of pesticides and fertilizers, number of livestock per unit grassland, and number of threatened vegetation and animal species) were the main limiting indicators in the east (Figure 6f).
4. Discussion
4.1. Indicator System Development of the ECC and ES
On the basis of clarifying the definitions of ECC and ES, this study developed an indicator system for assessing ECC and ES in eco-engineer areas. We took TRHR implementing ECCP as an example and noted that ECC increased and ES status improved in TRHR after 2000. The results are similar to those calculated by Gao et al. [43] based on ecological footprint method. Additionally, we found that the ES status was still unsafe in the ten years after initiating ECCP, which implied that the eco-environment in TRHR was still vulnerable. This was in line with the evaluation of Liu et al. [27]. The attempt to distinguish the ECC and ES and to clarify the relationship between them is rarely discussed in previous researches. In addition, when evaluating ECC and ES in most previous researches, the information about impervious surfaces was used so that the results were less accurate and included less details. This study used spatial analysis techniques and multisource data to evaluate the ECC and ES. ECC and ES could be analyzed effectively under a finer scale. Therefore, our method makes the assessment of ECC and ES more accurate and better understood by decision makers.
However, there is uncertainty in this method. Some indicators (such as air quality and biodiversity) that play vital role in evaluating ECC and ES have not been fully considered in the indicator system. This is because some long-term data are unavailable. In the backward TRHR, ecological environment monitoring started late and statistical technology was not mature. If the data can be obtained in other eco-engineer areas, then our method can be improved for assessing the ECC and ES.
4.2. Spatiotemporal Variations of the ECC and ES in TRHR
The results calculated by indicator system of ECC and ES developed in this study showed that the mean ECC is in the medium but close to good level in TRHR and that the spatial pattern decreases from southeast to northwest (Figure 2a). Water conservation, ANPP, and annual amount of solar radiation are the main limiting indicators for the ECC in TRHR (Figure 5 and Figure 6). The land layer index is the highest, which indicates that the soil condition is good and the soil holding capacity is high. However, the water layer index is lowest, which is because the TRHR, which is called the “Chinese water tower”, is not only the headwaters of three big rivers (the Yangtze, the Yellow, and Lantsang River) but also is intensively distributed with glaciers, snow mountains, lakes, wetlands, and marshes. Once the surface water becomes polluted, the affected area becomes very large owing to the rich surface water system. In addition, large desert and tundra areas lower the water conservation in TRHR, especially in Zhiduo and Qumalai in the west. Therefore, the main limiting indicator is still water conservation, although the water layer is more important in TRHR. The climate layer index is low and fluctuates considerably, which is due to the bad hydrothermal conditions owing to the high altitude of the TRHR. The instability of the climate layer and water layer is the major reason for the fluctuation of the ECC in TRHR.
Currently, the ES in most areas of the TRHR is still listed by endangered status. The difference between the local economic society conditions and the human response causes various limiting factors in different areas of the TRHR. In the underdeveloped west and middle parts, educational expenditure, the proportion of tertiary industry, and investment in ecological restoration are the main limiting indicators of ES (Figure 6). In these areas, there is lower pressure because of a lower GDP, the smaller number of livestock per unit grassland, and smaller dosage of pesticides and fertilizers; however, extremely poor eco-environment conditions and low ecological carrying capacity increase the burden of eco-environment protection. However, the low economic level can hardly meet the demand of the grand mission of eco-environment protection because investments in eco-environment protection measures and resident education are difficult to guarantee. For these reasons, the ecological security status of underdeveloped regions may further deteriorate in the future. In the relatively developed region of the east, the indicator items for the pressure layer (such as dosage of pesticides and fertilizers, number of livestock per unit grassland, and number of threatened vegetation and animal species) are the main limiting indicators (Figure 6). Although these areas have a relatively high level of ECC, the fast development needs of the economy and society cause greater pressure on ES. Rapid population growth leads to higher population density and urban expansion. Excessive dependence on the dosage of pesticides and fertilizers results in environmental pollution due to a lack of scientific awareness in agriculture. To increase income, the number of grazing livestock is extensively increased, which leads to grassland degradation. Without population control, grazing livestock reduction, and scientific faming, the current ES status must deteriorate again in the future.
4.3. Effect of ECCP in the TRHR
The ECCP that was implemented in 2005 aims to protect the fragile eco-environment, to prevent ecological degradation, to improve resident livelihood, and to promote regional development. The main measures include returning farmlands or rangelands to grasslands, conserving soil and water, protecting biodiversity, restoring ecologically deteriorated land, reducing grazing livestock, ecological migration, and so on. The program was planned for implementation from 2005 to 2020.
The results of the ECC and ES assessed in this study indicate that both improved after implementation compared with before implementation of the program. Improvements in the climatic conditions and water environment are the major reason for the improved ECC. However, the major reason why ES improved has been the increase in human response to ecological protection and the level of ECC.
Although continuous eco-environment deterioration has stopped owing to the ECCP, there are still problems, such as high pressure caused by violent human disturbance and insufficient human response for ES in TRHR. Implementation of the ECCP also has resulted in new ES pressure. The ecological migration measure involves actual internal migration within TRHR; that is, the population of ecological core areas is moved to other non-core areas. This migration only reduces the population density of the core areas but increases that of non-core areas. The pressure on ES from the large population density still exists. Moreover, ecological migration changes the production and lifestyle of the original residents and increases the need for building land in migration areas. If planning is not reasonable, ecological migration may cause higher ecological pressure [44,45].
How to solve the contradiction between economic development and ecological protection is the goal that ECCP is exploring. The economy of TRHR is behind. In 2015, the per capita GDP of TRHR was 19,751 yuan, only 35% of China’s GDP [36]. The root cause of this situation is that industrial structure is too simple [46,47]. For a long time, the economic development of TRHR depended on resource consumption industries, such as animal husbandry, mining, and primary product processing. Moreover, there were 106.49 × 10⁴ of farmers and herdsmen, accounting for 78% of total population in the TRHR in 2015 [36]. Locally, herdsmen are generally characterized by a low educational level, few labor skills in non-herd production, and differences in language and living habits. These characteristics cause their employment channels to be narrow, and it is difficult for them to move out of the grasslands. These herdsmen depend only on grazing to increase their income; however, the large population of farmers and herdsmen in TRHR is far more than the needs of local agriculture and animal husbandry.
After initiating ECCP, some protecting measures had negative impacts on local economy and herdsmen’s income. For instance, livestock reduction is also an important measure for the ECCP. The grazing pressure index for TRHR reduced to 1.46 from 2.29 before implementation of the program [33]. At present, the loss of herdsmen caused by livestock reduction is made up by ecological compensation, but low compensation cannot meet the demand for economic development. In the last several years, numbers of livestock are increasing again. Additionally, vital progress has been made in biodiversity conservation and the number of wildlife populations has dramatically increased [48,49]. As the number of wild herbivore populations rapidly increase, the problem of dividing the grasslands between used by wild herbivores or livestock is becoming more and more prominent. While impacting the development of local traditional animal husbandry, it also gradually threatens the ES of grasslands in TRHR. Yang et al. [50] showed that wild herbivores increase the grazing pressure of the Yellow River source in TRHR by 22.12%. Moreover, according to the planning of the Three-River Headwaters National Park construction, the number of wildlife will increase by 20% by 2020, which means more acute issues will occur between using the lands for livestock and leaving it to wild herbivores.
In the face of the conflict between ecological protection projects and local economic development, the Chinese government is trying ways to solve it. Developing ecotourism is one of the poverty-reduction measures adopted at present. The TRHR has rich tourism resources and is suitable for developing tourism. The TRHR has not only unique snow mountains, glaciers, deserts, and other original plateau landscape but also religion, folk custom, historical relics, and other cultural landscapes. After implementing ECCP in TRHR, the construction of infrastructure such as roads, railways, and airports has improved the tourism reception capacity, and tourism industry is growing. The number of tourists in TRHR was only 143,000 in 1999 and had increased to 2,222,000 by 2007, with a growth rate of 40.9%/yr. Tourism revenue increased from 4.31 million yuan to 59.46 million yuan for 1999–2007, with a growth rate of 38.8%/yr. It is expected that the number of tourists will reach 1.52 million and tourism revenue will reach 9.7 billion yuan by 2025 [51]. In 2015, TRHR became China’s first national park, drawing on the experience of national park construction abroad [52,53,54]; thus, TRHR tourism will get more attention and has great potential.
In China, agronomic restoration measures alone cannot meet the demand of grassland conservation and restoration. More complex and comprehensive measures should be involved, including transforming the traditional production and lifestyle of farmers and herdsmen, adjusting economic structure locally, rectifying the development policies of ethnic minorities, and managing the economic development in grassland regions. Although it is true that the ECC and the ES improved in TRHR after implementation of the ECCP, these gains are vulnerable to setbacks. Thus, a clear path forward should be maintained at all time. By reasonable assessment of the ECC and ES, we can determine the progress of the ECCP and adjust its direction in real time.
5. Conclusions
The indicator system established in this study can be effectively applied to evaluate the ECC and ES in eco-engineering areas. It identifies the hotspots of eco-engineering areas for ecological researchers and decision makers to take further measures for the purposes of sustainability, conservation, and development. Taking the TRHR as an example, the ECC increased and the ES status improved in the ten years after implementation of the ECCP. However, the ES status of the TRHR is still not safe. The analysis of limiting factors found that the keys to ecological environment management are to protect the water eco-environment, to prevent and restore the degraded grasslands, and to protect the biodiversity in TRHR. We suggest that limiting overgrazing, controlling pollution, improving the industrial structure, enhancing resident education levels, and ecological protection awareness should be given more attention in future implementation of the ECCP.
Author Contributions
Conceptualization, J.F.; methodology, S.W.; investigation, Y.Z.; formal analysis, Y.Z.; writing—original draft preparation, Y.Z.; writing—review and editing, Y.Z., and J.F.; funding acquisition, J.F. All authors have read and agreed to the published version of the manuscript.
Funding
This research was funded by National Key R & D Program of China, grant numbers 2017YFC0506505 and 2017YFA0604804, and Strategic Priority Research Program of the Chinese Academy of Sciences, grant number XDA20090000.
Acknowledgments
Financial support is acknowledged from National Key R & D Program of China (2017YFC0506505 and 2017YFA0604804) and Strategic Priority Research Program of the Chinese Academy of Sciences (XDA20090000).
Conflicts of Interest
The authors declare no conflict of interest.
References
- Lu, S.; Li, J.; Guan, X.; Gao, X.; Gu, Y.; Zhang, D.; Mi, F.; Li, D. The evaluation of forestry ecological security in China: Developing a decision support system. Ecol. Indic. 2018, 91, 664–678. [Google Scholar] [CrossRef]
- Ohl, C.; Krauze, K.; Grunbuhel, C. Towards an understanding of long-term ecosystem dynamics by merging socio-economic and environmental research. Ecol. Econ. 2007, 63, 383–391. [Google Scholar] [CrossRef]
- Zhao, Y.-Z.; Zou, X.-Y.; Cheng, H.; Jia, H.-K.; Wu, Y.-Q.; Wang, G.-Y.; Zhang, C.; Gao, S.-Y. Assessing the ecological security of the Tibetan plateau: Methodology and a case study for Lhaze County. J. Environ. Manag. 2006, 80, 120–131. [Google Scholar] [CrossRef] [PubMed]
- Zhang, H.; Xu, E. An evaluation of the ecological and environmental security on China’s terrestrial ecosystems. Sci. Rep. 2017, 7, 811. [Google Scholar] [CrossRef] [PubMed]
- Chapman, E.J.; Byron, C. The flexible application of carrying capacity in ecology. Glob. Ecol. Conserv. 2018, 13, e00365. [Google Scholar] [CrossRef]
- Zhang, H.; Fan, J.; Cao, W.; Zhong, H.; Harris, W.; Gong, G.; Zhang, Y. Changes in multiple ecosystem services between 2000 and 2013 and their driving factors in the Grazing Withdrawal Program, China. Ecol. Eng. 2018, 116, 67–79. [Google Scholar] [CrossRef]
- Xu, Y.; Tang, Q.; Fan, J.; Bennett, S.; Li, Y. Assessing construction land potential and its spatial pattern in China. Landsc. Urban Plan. 2011, 103, 207–216. [Google Scholar] [CrossRef]
- Gong, L.; Jin, C. Fuzzy Comprehensive Evaluation for Carrying Capacity of Regional Water Resources. Water Resour. Manag. 2009, 23, 2505–2513. [Google Scholar] [CrossRef]
- Salerno, F.; Viviano, G.; Manfredi, E.C.; Caroli, P.; Thakuri, S.; Tartari, G. Multiple Carrying Capacities from a management-oriented perspective to operationalize sustainable tourism in protected areas. J. Environ. Manag. 2013, 128, 116–125. [Google Scholar] [CrossRef]
- Wang, S.; Xu, L.; Yang, F.; Wang, H. Assessment of water ecological carrying capacity under the two policies in Tieling City on the basis of the integrated system dynamics model. Sci. Total. Environ. 2014, 472, 1070–1081. [Google Scholar] [CrossRef]
- Zhang, M.; Liu, Y.; Wu, J.; Wang, T. Index system of urban resource and environment carrying capacity based on ecological civilization. Environ. Impact Assess. Rev. 2018, 68, 90–97. [Google Scholar] [CrossRef]
- Cheng, C.; Liu, Y.; Chen, Y.; Liu, Y.; Zhang, Y.; Shen, S.; Yang, R.; Xu, Z.; Hong, Y.; Yang, R. Diagnosing cropland’s allowable range and spatial allocation in China’s typical mountainous plateau area: An evaluation framework based on ecological carrying capacity. Sci. Total Environ. 2019, 685, 1255–1268. [Google Scholar] [CrossRef] [PubMed]
- Sun, J.; Li, Y.; Gao, P.; Xia, B. A Mamdani fuzzy inference approach for assessing ecological security in the Pearl River Delta urban agglomeration, China. Ecol. Indic. 2018, 94, 386–396. [Google Scholar] [CrossRef]
- Lu, X.-C.; Zhang, J.; Li, X.-Z. Geographical information system-based assessment of ecological security in Changbai Mountain region. J. Mt. Sci. 2014, 11, 86–97. [Google Scholar] [CrossRef]
- Tian, Y.; Wang, Z.; Mao, D.; Li, L.; Liu, M.-Y.; Jia, M.; Man, W.; Lu, C. Remote Observation in Habitat Suitability Changes for Waterbirds in the West Songnen Plain, China. Sustainability 2019, 11, 1552. [Google Scholar] [CrossRef] [Green Version]
- Rojo, L.; Bautista, S.; Orr, B.J.; Vallejo, V.R.; Cortina, J.; Derak, M. Prevention and restoration actions to combat desertification. Sécheresse 2012, 23, 219–226. [Google Scholar] [CrossRef]
- Van Liew, M.W.; Veith, T.L.; Bosch, D.D.; Arnold, J.G. Suitability of SWAT for the Conservation Effects Assessment Project: Comparison on USDA Agricultural Research Service Watersheds. J. Hydrol. Eng. 2007, 12, 173–189. [Google Scholar] [CrossRef] [Green Version]
- Bryan, B.; Gao, L.; Ye, Y.; Sun, X.; Connor, J.D.; Crossman, N.D.; Stafford-Smith, M.; Wu, J.; He, C.; Yu, D.; et al. China’s response to a national land-system sustainability emergency. Nature 2018, 559, 193–204. [Google Scholar] [CrossRef]
- Fan, J.-W.; Shao, Q.-Q.; Liu, J.-Y.; Wang, J.-B.; Harris, W.; Chen, Z.-Q.; Zhong, H.-P.; Xu, X.-L.; Liu, R.-G. Assessment of effects of climate change and grazing activity on grassland yield in the Three Rivers Headwaters Region of Qinghai–Tibet Plateau, China. Environ. Monit. Assess. 2009, 170, 571–584. [Google Scholar] [CrossRef]
- Shao, Q.; Cao, W.; Fan, J.; Huang, L.; Xu, X. Effects of an ecological conservation and restoration project in the Three-River Source Region, China. J. Geogr. Sci. 2016, 27, 183–204. [Google Scholar] [CrossRef]
- Convertino, M.; Baker, K.; Vogel, J.; Lu, C.; Suedel, B.; Linkov, I. Multi-criteria decision analysis to select metrics for design and monitoring of sustainable ecosystem restorations. Ecol. Indic. 2013, 26, 76–86. [Google Scholar] [CrossRef] [Green Version]
- Canto-Perello, J.; Martinez-Leon, J.; Curiel-Esparza, J.; Martin-Utrillas, M. Consensus in prioritizing river rehabilitation projects through the integration of social, economic and landscape indicators. Ecol. Indic. 2017, 72, 659–666. [Google Scholar] [CrossRef]
- Hermoso, V.; Pantus, F.; Olley, J.; Linke, S.; Mugodo, J.; Lea, P. Systematic planning for river rehabilitation: Integrating multiple ecological and economic objectives in complex decisions. Freshw. Boil. 2011, 57, 1–9. [Google Scholar] [CrossRef] [Green Version]
- Marler, T.; Arora, J.S. Survey of multi-objective optimization methods for engineering. Struct. Multidiscip. Optim. 2004, 26, 369–395. [Google Scholar] [CrossRef]
- Mateos, D.M.; Power, M.E.; Comín, F.A.; Yockteng, R. Structural and functional loss in restored wetland ecosystems. PLoS Boil. 2012, 10, e1001247. [Google Scholar] [CrossRef] [Green Version]
- Liu, J.; Xu, X.; Shao, Q. Grassland degradation in the “Three-River Headwaters” region, Qinghai Province. J. Geogr. Sci. 2008, 18, 259–273. [Google Scholar] [CrossRef]
- Zhu, J.; Zhou, Y.; Wang, S.; Wang, L.; Wang, F.; Liu, W.; Guo, B. Multicriteria decision analysis for monitoring ecosystem service function of the Three-River Headwaters region of the Qinghai-Tibet Plateau, China. Environ. Monit. Assess. 2015, 187, 355. [Google Scholar] [CrossRef]
- Liu, D.; Cao, C.; Dubovyk, O.; Tian, R.; Chen, W.; Zhuang, Q.; Zhao, Y.; Menz, G. Using fuzzy analytic hierarchy process for spatio-temporal analysis of eco-environmental vulnerability change during 1990–2010 in Sanjiangyuan region, China. Ecol. Indic. 2017, 73, 612–625. [Google Scholar] [CrossRef]
- Li, X.-L.; Brierley, G.; Qiao, Y.-M.; Yang, Y.-W.; Gao, J.; Zhang, J. Rangeland degradation on the Qinghai-Tibet plateau: Implications for rehabilitation. Land Degrad. Dev. 2011, 24, 72–80. [Google Scholar] [CrossRef]
- The People’s Government of Qinghai Province (PGQP). The Phase II Planning on Ecological Conservation and Construction Program in the Sanjiangyuan National Nature Reserve; The People’s Government of Qinghai Province (PGQP): Qinghai, China, 2013; pp. 1–85. [Google Scholar]
- Ma, S.; Ma, S. The Environmental Justice in Ecological Immigration A Case Study of Sanjiangyuan Area. Arch. Res. 2015, 17, 147–152. [Google Scholar] [CrossRef] [Green Version]
- Foggin, M.; E Torrance-Foggin, M. How can social and environmental services be provided for mobile Tibetan herders? Collaborative examples from Qinghai Province, China. Pastoralism 2011, 1, 21. [Google Scholar] [CrossRef] [Green Version]
- Zhang, L.; Fan, J.; Zhou, D.; Zhang, H. Ecological Protection and Restoration Program Reduced Grazing Pressure in the Three-River Headwaters Region, China. Rangel. Ecol. Manag. 2017, 70, 540–548. [Google Scholar] [CrossRef]
- Liu, X.; Zhu, X.; Zhu, W.; Pan, Y.; Zhang, C.; Zhang, D. Changes in Spring Phenology in the Three-Rivers Headwater Region from 1999 to 2013. Remote Sens. 2014, 6, 9130–9144. [Google Scholar] [CrossRef] [Green Version]
- Shao, Q.Q.; Fan, J.W. The Integrated Monitoring and Assessment of Ecosystem in the Three-River Headwaters Region; Science Press: Beijing, China, 2012; pp. 190–222. [Google Scholar]
- Qinghai Provincial Bureau of Statistics. Qinghai Statistical Yearbook; Qinghai Provincial Bureau of Statistics: Xining, China, 2015. [Google Scholar]
- Liu, Y.; Zeng, C.; Cui, H.; Song, Y. Sustainable Land Urbanization and Ecological Carrying Capacity: A Spatially Explicit Perspective. Sustainability 2018, 10, 3070. [Google Scholar] [CrossRef] [Green Version]
- Renard, K.G.; Foser, G.R.; Weesies, G.A.; McCool, D.K.; Yoderm, D.C. Predicting Soil erosion by Water: A Guide to Conservation Planning with the Revised Universal Soil Loss Equation (RUSLE); Department of Agriculture, Agricultural Research Service: Washington, DC, USA, 1997. [Google Scholar]
- Fryrear, D.W.; Saleh, A.; Bilbro, J.D.; Schomberg, H.M.; Stout, J.E.; Zobeck, T.M. Revised Wind Erosion Equation; Department of Agriculture, Agricultural Research Service: Washington, DC, USA, 1998. [Google Scholar]
- Wang, J.; Liu, J.; Cao, M.; Liu, Y.; Yu, G.-R.; Li, G.; Qi, S.; Li, K. Modelling carbon fluxes of different forests by coupling a remote-sensing model with an ecosystem process model. Int. J. Remote Sens. 2011, 32, 6539–6567. [Google Scholar] [CrossRef]
- Zhang, X.; Liao, C.; Li, J.; Sun, Q. Fractional vegetation cover estimation in arid and semi-arid environments using HJ-1 satellite hyperspectral data. Int. J. Appl. Earth Obs. Geoinf. 2013, 21, 506–512. [Google Scholar] [CrossRef]
- Liu, S. Estimation of rainfall storage capacity in the canopies of cypress wetlands and slash pine uplands in North-Central Florida. J. Hydrol. 1998, 207, 32–41. [Google Scholar] [CrossRef]
- Gao, Y.L.; Lin, H.L.; Zhou, Z.Y.; Wei, Y.M. Analysis on ecological footprint of sustainable development in Sanjiangyuan Region. Pratacultural Sci. 2019, 36, 11–19. [Google Scholar] [CrossRef]
- Du, F. Ecological Resettlement of Tibetan Herders in the Sanjiangyuan: A Case Study in Madoi County of Qinghai. Nomad. Peoples 2012, 16, 116–133. [Google Scholar] [CrossRef] [Green Version]
- Li, L. Review of Fachun Du, Ecological Resettlement in the Sanjiangyuan of Qinghai. Nomad. Peoples 2015, 19, 344–348. [Google Scholar] [CrossRef]
- Huang, M. Factors affecting analysis of herdsmen income in the Sanjiangyuan ecological protection zone. In Proceedings of the Eighth International Conference on Measuring Technology and Mechatronics Automation ICMTMA, Macau, China, 11–12 March 2016. [Google Scholar]
- Yan, J.; Li, H.; Hua, X.; Peng, K.; Zhang, Y. Determinants of Engagement in Off-Farm Employment in the Sanjiangyuan Region of the Tibetan Plateau. MT Res. Dev. 2017, 37, 464–473. [Google Scholar] [CrossRef]
- Wu, L.; Wang, H. Poisoning the pika: Must protection of grasslands be at the expense of biodiversity? Sci. China Life Sci. 2017, 60, 545–547. [Google Scholar] [CrossRef] [PubMed]
- Foggin, M. Environmental Conservation in the Tibetan Plateau Region: Lessons for China’s Belt and Road Initiative in the Mountains of Central Asia. Land 2018, 7, 52. [Google Scholar] [CrossRef] [Green Version]
- Yang, F.; Shao, Q.; Guo, X.; Tang, Y.; Li, Y.; Wang, D.; Wang, Y.; Fan, J. Effect of Large Wild Herbivore Populations on the Forage-Livestock Balance in the Source Region of the Yellow River. Sustainability 2018, 10, 340. [Google Scholar] [CrossRef] [Green Version]
- Institute of Geographic Sciences and Natural Resources Research, Chinese Academy of Sciences, Qinghai Province Tourism Bureau. Ecotourism Development Planning for Sanjiangyuan Region in Qinghai Province (2009–2025); Tourism Press: Beijing, China, 2009. [Google Scholar]
- Merce, I.; Radac, B.; Milin, A.; Gherman, R.; Tonea, E. Forest National Park—An ecotourism destination. J. Biotechnol. 2016, 231, S96. [Google Scholar] [CrossRef]
- Aymoz, B.G.P.; Randrianjafy, V.R.; Randrianjafy, Z.J.N.; Khasa, D.P. Community Management of Natural Resources: A Case Study from Ankarafantsika National Park, Madagascar. AMBIO 2013, 42, 767–775. [Google Scholar] [CrossRef] [Green Version]
- Akyeampong, O.A. Pro-poor tourism: Residents’ expectations, experiences and perceptions in the Kakum National Park Area of Ghana. J. Sustain. Tour. 2011, 19, 197–213. [Google Scholar] [CrossRef]
Figure 1.
Location of the Three-River Headwaters Region (TRHR) based on digital elevation model data.
Figure 1.
Location of the Three-River Headwaters Region (TRHR) based on digital elevation model data.

Figure 2.
Spatial patterns for (a) the mean ecological carrying capacity index (ECCI) and (b) the mean ecological security index (ESI) for 2000–2015 in the TRHR.
Figure 2.
Spatial patterns for (a) the mean ecological carrying capacity index (ECCI) and (b) the mean ecological security index (ESI) for 2000–2015 in the TRHR.

Figure 3.
Criterion layer index of (a) ECC and (b) ES during the three periods.

Figure 4.
Spatial patterns for the ECCI and ESI during the three periods: (a) ECCI and (b) ESI before implementation of the program; (c) ECCI and (d) ESI during early-term implementation of the program; (e) ECCI and (f) ESI during medium-term implementation of the program.
Figure 4.
Spatial patterns for the ECCI and ESI during the three periods: (a) ECCI and (b) ESI before implementation of the program; (c) ECCI and (d) ESI during early-term implementation of the program; (e) ECCI and (f) ESI during medium-term implementation of the program.

Figure 5.
Proportion of main limiting indicators area for ECC and ES in the TRHR during the three periods: (a) Main limiting indicators area ratio for ECC and (b) main limiting indicators area ratio for ES.
Figure 5.
Proportion of main limiting indicators area for ECC and ES in the TRHR during the three periods: (a) Main limiting indicators area ratio for ECC and (b) main limiting indicators area ratio for ES.

Figure 6.
Spatial heterogeneity of the limiting indicators for ECC and ES during the three periods: (a) ECC and (b) ES before implementation of the program; (c) ECC and (d) ES during early-term implementation of the program; and (e) ECC and (f) ES during medium-term implementation of the program.
Figure 6.
Spatial heterogeneity of the limiting indicators for ECC and ES during the three periods: (a) ECC and (b) ES before implementation of the program; (c) ECC and (d) ES during early-term implementation of the program; and (e) ECC and (f) ES during medium-term implementation of the program.


Table 1.
Indicator system of ecological carrying capacity (ECC) in the TRHR.
| Target Layer | Criterion Layer (Weight) | Indicator (Weight) (±) | Data Sources or Calculation Method |
|---|---|---|---|
| ECC | Climate layer (0.225) | C1—Annual precipitation (0.3) (+) | National Meteorological Information Center (http://data.cma.cn), ANUSPLIN Interpolation |
| C2—Annual mean temperature (0.3) (+) | |||
| C3—> 0 °C accumulated temperature (0.15) (+) | |||
| C4—Annual amount of solar radiation (0.10) (+) | |||
| C5—Annual frost-free days (0.15) (+) | |||
| Land layer (0.300) | C6—Water erosion modulus (0.17) (-) | Revised Universal Soil Loss Equation [38] | |
| C7—Wind erosion modulus (0.08) (-) | Revised Wind Erosion Equation [39] | ||
| C8—Soil types (0.17) (+) | China Soil Types Map (1:10,000,000) (http://www.resdc.cn/data.aspx?DATAID=145) | ||
| C9—Digital elevation model (0.29) (-) | NASA (http://srtm.csi. cgiar.org) | ||
| C10—Slope (0.29) (-) | Fitting surface method (ArcGIS 10.3) | ||
| Biota layer (0.225) | C11—ANPP (0.40) (+) | GLOPEM-CEVSA model [40] | |
| C12—Vegetation coverage (0.35) (+) | Dimidiate pixel model [41] | ||
| C13—Vegetation types (0.25) (+) | China Vegetation Types Map (1:10,000,000) (http://www.resdc.cn/data.aspx?DATAID=122) | ||
| Water layer (0.25) | C14—Water conservation (0.70) (+) | Rainfall storage capacity method [42] | |
| C15—Surface water quality (0.30) (+) | Bulletin of the State Environment in Qinghai, Report of the Water resources monitoring in the Three-River Headwaters Region (http://sthjt.qinghai.gov.cn/zlzk) |
Note: ANPP-Aboveground Net Primary Production.
Table 2.
“Pressure–state–response” PSR indicator system of ecological security ES for the TRHR.
| Target Layer | Criterion Layer (Weight) | Indicator (Weight) (±) | Data Sources or Calculation Method |
|---|---|---|---|
| ES | Pressure (0.3) | D1—GDP (0.30) (-) | Resource and Environment Data Cloud Platform (http://www.resdc.cn/data.aspx?DATAID=252) |
| D2—Number of livestock per unit grassland (0.30) (-) | Qinghai Farming and Animal Husbandry Statistical Manual (http://tjj.qinghai.gov.cn/tjData/qhtjnj) | ||
| D3—Number of threatened vegetation species (0.05) (-) | Provided by the environmental protection bureau, Qinghai Province (http://sthjt.qinghai.gov.cn) | ||
| D4—Number of threatened animal species (0.05) (-) | |||
| D5—Proportion of degraded grasslands to grasslands (0.20) (-) | Remote Sensing Interpretation [26] | ||
| D6—Dosage of pesticides (0.05) (-) | Qinghai Statistical Yearbook (http://tjj.qinghai.gov.cn/tjData/qhtjnj) | ||
| D7—Dosage of fertilizers (0.05) (-) | |||
| State (0.5) | D8—Ecological carrying capacity (1.0) (+) | Calculated in this study | |
| Response (0.2) | D9—Proportion of tertiary industry (0.25) (+) | Qinghai Statistical Yearbook (http://tjj.qinghai.gov.cn/tjData/qhtjnj) | |
| D10—Population density (0.25) (-) | Resource and Environment Data Cloud Platform (http://www.resdc.cn/data.aspx?DATAID=251) | ||
| D11—Per capita living space (0.10) (+) | Qinghai Statistical Yearbook (http://tjj.qinghai.gov.cn/tjData/qhtjnj) | ||
| D12—Educational expenditure (0.10) (+) | |||
| D13—Proportion of ecological migration to the population (0.10) (+) | [35] | ||
| D14—Investments for ecological restoration (0.20) (+) |
Table 3.
Proportion of each limiting indicator area for ECC.
| Limiting Indicators | Before Implementation (2000–2004) | At Early-Term Implementation (2005–2009) | At Medium-Term Implementation (2010–2015) |
|---|---|---|---|
| C1 | 10.02 | 2.50 | 3.58 |
| C2 | 0.09 | 0.05 | 0.05 |
| C3 | 12.46 | 12.44 | 7.90 |
| C4 | 7.70 | 18.44 | 21.37 |
| C5 | 0.06 | 0.03 | 0.03 |
| C6 | 0.53 | 0.49 | 0.41 |
| C7 | 0.05 | 0.02 | 0.03 |
| C8 | 3.61 | 3.85 | 3.78 |
| C9 | 1.01 | 0.86 | 0.81 |
| C10 | 0.54 | 0.52 | 0.52 |
| C11 | 10.77 | 13.33 | 13.80 |
| C12 | 2.24 | 2.41 | 1.67 |
| C13 | 0.64 | 0.64 | 0.62 |
| C14 | 47.62 | 43.76 | 45.01 |
| C15 | 2.66 | 0.66 | 0.42 |
Table 4.
Proportion of each limiting indicator area for ES.
| Before Implementation (2000–2004) | At Early-Term Implementation (2005–2009) | At Medium-Term Implementation (2010–2015) | |
|---|---|---|---|
| D1 | 0 | 0 | 0 |
| D2 | 0.47 | 4.13 | 4.43 |
| D3 | 0 | 0.01 | 4.14 |
| D4 | 0 | 4.77 | 8.68 |
| D5 | 0 | 0 | 1.94 |
| D6 | 4.53 | 4.53 | 6.78 |
| D7 | 0.01 | 2.76 | 4.38 |
| D8 | 0 | 0 | 0.10 |
| D9 | 0 | 5.22 | 30.95 |
| D10 | 0.36 | 1.01 | 0.40 |
| D11 | 2.42 | 4.40 | 10.68 |
| D12 | 92.21 | 59.69 | 0.01 |
| D13 | 0 | 0 | 0.48 |
| D14 | 0 | 13.47 | 27.01 |
© 2020 by the authors. Licensee MDPI, Basel, Switzerland. This article is an open access article distributed under the terms and conditions of the Creative Commons Attribution (CC BY) license (http://creativecommons.org/licenses/by/4.0/).
Share and Cite
MDPI and ACS Style
Zhang, Y.; Fan, J.; Wang, S. Assessment of Ecological Carrying Capacity and Ecological Security in China’s Typical Eco-Engineering Areas. Sustainability 2020, 12, 3923. https://0-doi-org.brum.beds.ac.uk/10.3390/su12093923
AMA Style
Zhang Y, Fan J, Wang S. Assessment of Ecological Carrying Capacity and Ecological Security in China’s Typical Eco-Engineering Areas. Sustainability. 2020; 12(9):3923. https://0-doi-org.brum.beds.ac.uk/10.3390/su12093923
Chicago/Turabian StyleZhang, Yaxian, Jiangwen Fan, and Suizi Wang. 2020. "Assessment of Ecological Carrying Capacity and Ecological Security in China’s Typical Eco-Engineering Areas" Sustainability 12, no. 9: 3923. https://0-doi-org.brum.beds.ac.uk/10.3390/su12093923
Note that from the first issue of 2016, this journal uses article numbers instead of page numbers. See further details here.