Investigating the Impact of Various Risk Factors on Victims of Traffic Accidents


1
Institute of Transportation Engineering and Geomatics, Tsinghua University, Beijing 100084, China
2
Beijing Key Laboratory of Traffic Engineering, Beijing University of Technology, Beijing 100124, China
3
Division of Biosciences, University College London, London WC1E 6BT, UK
*
Author to whom correspondence should be addressed.
Sustainability 2020, 12(9), 3934; https://0-doi-org.brum.beds.ac.uk/10.3390/su12093934
Submission received: 6 April 2020
/
Revised: 1 May 2020
/
Accepted: 5 May 2020
/
Published: 11 May 2020
Abstract
:In this study, our goal was to determine the impact of various risk factors on traffic accidents in the city of Shenyang, China, and to discuss the various common factors that influence pedestrian and non-motor vehicle accidents. A total of 1227 traffic accidents from 2015 to 2017 were analyzed, of which, 733 were accidents involving pedestrians and 494 were non-motor vehicle accidents. Among these traffic accidents, pedestrians and non-motor vehicle users had either minor or no responsibility. Sixteen influencing factors, including main responsible party attributes, pedestrian/non-motor vehicle user attributes, time attributes, space attributes, and environmental attributes were analyzed with regards to their impact on accidents using the binary logistic regression model (BLR) and the classification and regression tree analysis model (CART). Age, administrative division, and time of year were the three most common factors for pedestrian and non-motor vehicle accidents. For pedestrian accidents, the personal influencing factors of the main responsible party included illegal acts while driving and hit-and-run behavior. Factors affecting pedestrian and non-motor vehicle accidents also had different orders of importance.
1. Introduction
Traffic accidents pose a considerable threat to public health, and deaths resulting from traffic accidents have become a serious concern for society. As World Health Organization statistics show, road traffic accidents have been a leading factor, resulting in the deaths of many people in the past twenty years [1]. Of all parties involved in traffic accidents, pedestrians and cyclists are more vulnerable as they have less protection than motor vehicle drivers. Therefore, it is vital to study road traffic accidents, both non-motor vehicle and those involving pedestrians, to make our world safer and more sustainable.
Many scholars have studied traffic accidents involving both pedestrians [2] and non-motor vehicles [3]. From the behavior mechanisms of pedestrians, non-motor vehicle users, and motor vehicle users, researchers found that during traffic accidents, pedestrians and non-motor vehicle users often suffer disproportionally because they are more vulnerable [2,3]. Accident data provided by the police department have also shown that pedestrians and non-motor vehicle users are more likely to have either minor or no responsibility regarding accident accountability. Therefore, the analysis of the factors affecting the severity of traffic accidents is of great significance for the protection of the relatively more vulnerable groups that include pedestrians and non-motor vehicle users [4].
In this article, the traffic accident data were selected according to pedestrians and non-motor vehicle users who had either minor or no responsibility. Factors affecting the impact of non-motor vehicle users and pedestrians on traffic accidents were analyzed, and the similarities and differences between pedestrian and non-motor vehicle accidents were determined. The city of Shenyang was taken as the sample location for analysis. Shenyang is the capital of Liaoning province in the northeastern part of China. Its population is 8.3 million, and it had a total GDP of 629 billion yuan (89 billion US dollars) in 2018 [5]. The weather in Shenyang is characterized by a five-month wintertime period.
2. Literature Review
2.1. Related Factors Impacting Traffic Accidents
Many scholars have researched pedestrians and non-motor vehicle users involved in accidents, and a wide range of influencing factors have been identified. Factors affecting the severity of traffic accidents include aggressive driving behavior [6], weather [7], time of year [8], administrative division [9], cold regions [10], and driving circumstances [11]. These factors are, therefore, the focus of our study.
Various methods and models have been used to analyze the factors affecting traffic accidents, including hypothesis testing [12], binary logistic regression (BLR) [13], multinomial logistic regression [14], ordinal logistic regression [15], the mixed logit model [16], the tree-based model [17] including classification and regression trees (CART), the clustering approach [18], XGBoost [19], and the Bayesian network [20]. Among these methods and models, if the interpreted variable only has two values, the binary logistic regression model is the best choice. To analyze the importance ranking of different factors, CART is often used.
2.2. Non-Motor Vehicle Accidents
Due to their limited external protective devices, cyclists and motorcyclists are prone to serious injury in road accidents. Analyzing the level of recovery and the differences between these groups of road users is an important step towards determining the burden of road trauma and using the information to optimize prevention [21]. Illegal occupation of motor vehicle lanes, speeding bicycles, passing through red lights, illegal carrying of people, and bicycles going in the wrong direction are the main dangerous behaviors of non-motor vehicle users [4]. Kaplan et al. [22] found that it is important to improve the quality of bicycle paths and bicycle lanes to improve the safety of non-motor vehicle users.
2.3. Pedestrian Accidents
Pedestrians travel at the lowest speed of all traffic and have the weakest protection, which often results in more severe injuries for them in traffic accidents. The protection of pedestrians has therefore become an important topic [2]. Behnood et al. [23] considered a series of variables that may affect the severity of pedestrian injuries, including time, location, environmental conditions, pedestrian characteristics, and collision characteristics. Kovaceva et al. [24] developed a driver assistance system (automatic emergency braking and steering) to analyze the behavior characteristics of cyclists and pedestrians and then proposed the framework of a quantitative driver assistance system to benefit their safety. Wang found that older pedestrians were more likely to be involved in severe accidents in Singapore [25].
3. Data and Methods
The data and methods are illustrated in the following two sections. Two methods, binary logistic regression as well as classification and regression trees, were used to calculate the data.
3.1. Data
In light of 2015–2017 data from the Shenyang public security department, 1227 traffic accidents in Shenyang, in which pedestrians and non-motor vehicles were victims (of minor or no responsibility incidents), were used for calculations. Among all the traffic accidents under consideration, 733 were accidents of pedestrian victims and 494 were accidents of non-motor vehicle victims. The impact on accidents was set as the interpreted variable and named as Y. The influencing factors of impact on accidents were set as the explanatory variables and named as Xi. All 16 influencing factors can be classified into five parts, which are the main responsible party attributes; pedestrian/non-motor vehicle attributes; time attributes; space attributes; and environment attributes. The main responsible party indicated factors causing harm to the victims in our study. Each specific influencing factor under every part is listed as follows:
- (1)
- Main responsible party attributes: hit-and-run behavior of the main responsible party (X1), illegal acts in driving of the main responsible party (X2);
- (2)
- Pedestrian/non-motor vehicle attributes: gender (X3), age (X4), accident responsibility (X5);
- (3)
- Time attributes: season (X6), rush hour (X7), weekday or weekend (X8);
- (4)
- Space attributes: intersection (X9), administrative division (X10), location of road (X11), pavement condition (X12), vehicle isolation (X13), central isolation of road (X14), physical isolation of road (X15);
- (5)
- Environment attributes: weather (X16).
The definition of variables for pedestrian and non-motor vehicle accidents is shown in Table 1 and the proportion of different variables for accidents is shown in Table 2.
For Table 1, Spring means April and May; Summer comprises June, July, and August; Autumn comprises September and October; and Winter comprises the remaining months of a year. Hit-and-run behavior means the act of escaping from legal investigation after a traffic accident.
3.2. Methods
3.2.1. Binary Logistic Regression Analysis
In binary logistic regression analysis (BLR), the impact on accidents was set as the interpreted variable, Y, with two possible values (0, 1). Each factor that affects the impact on accidents is named as Xi, and the mathematical expression of Y and Xi is shown in Equation (1):
In Equation (1), b is set as a constant for the equation, and ai is a correlation coefficient for each influencing factor. Equation (1) is changed to Equation (2) via a logit transition.
By calculating ai, the correlation coefficient of each influence factor can be obtained, and Exp(B) is the odds ratio of the influencing factor indicating how much it can change Y from 0 to 1 in comparison with the referenced value.
3.2.2. Classification and Regression Tree Analysis
The classification and regression tree (CART) model is composed of two steps: decision tree generation and decision tree pruning. For the decision tree generation based on the training dataset, the generated decision tree should be large enough. For decision tree pruning, the decision tree is pruned under the standard minimum loss function.
Supposing that the probability of the kth category is Pk, and the Gini coefficient expression of the probability distribution is shown in Equation (3):
For sample D, the number of that sample is |D|. For the supposed k categories, the number of the kth category is |Ck|. Then, the Gini coefficient expression is shown in Equation (4):
Under the consideration of condition A, sample D is divided into two data subsets, D1 and D2, and the Gini coefficient expression is shown in Equation (5):
The Gini coefficient indicates the uncertainty of the provided sample data. The importance of each calculated variable is converted into a relative ratio in consideration of the most important factor, which shows a 100% converted value.
4. Results
4.1. Binary Logistic Regression Analysis
The results of the binary logistic regression are shown in Table 3, and they are categorized into two parts: pedestrian accidents and non-motor vehicle accidents.
4.1.1. Pedestrian Accidents
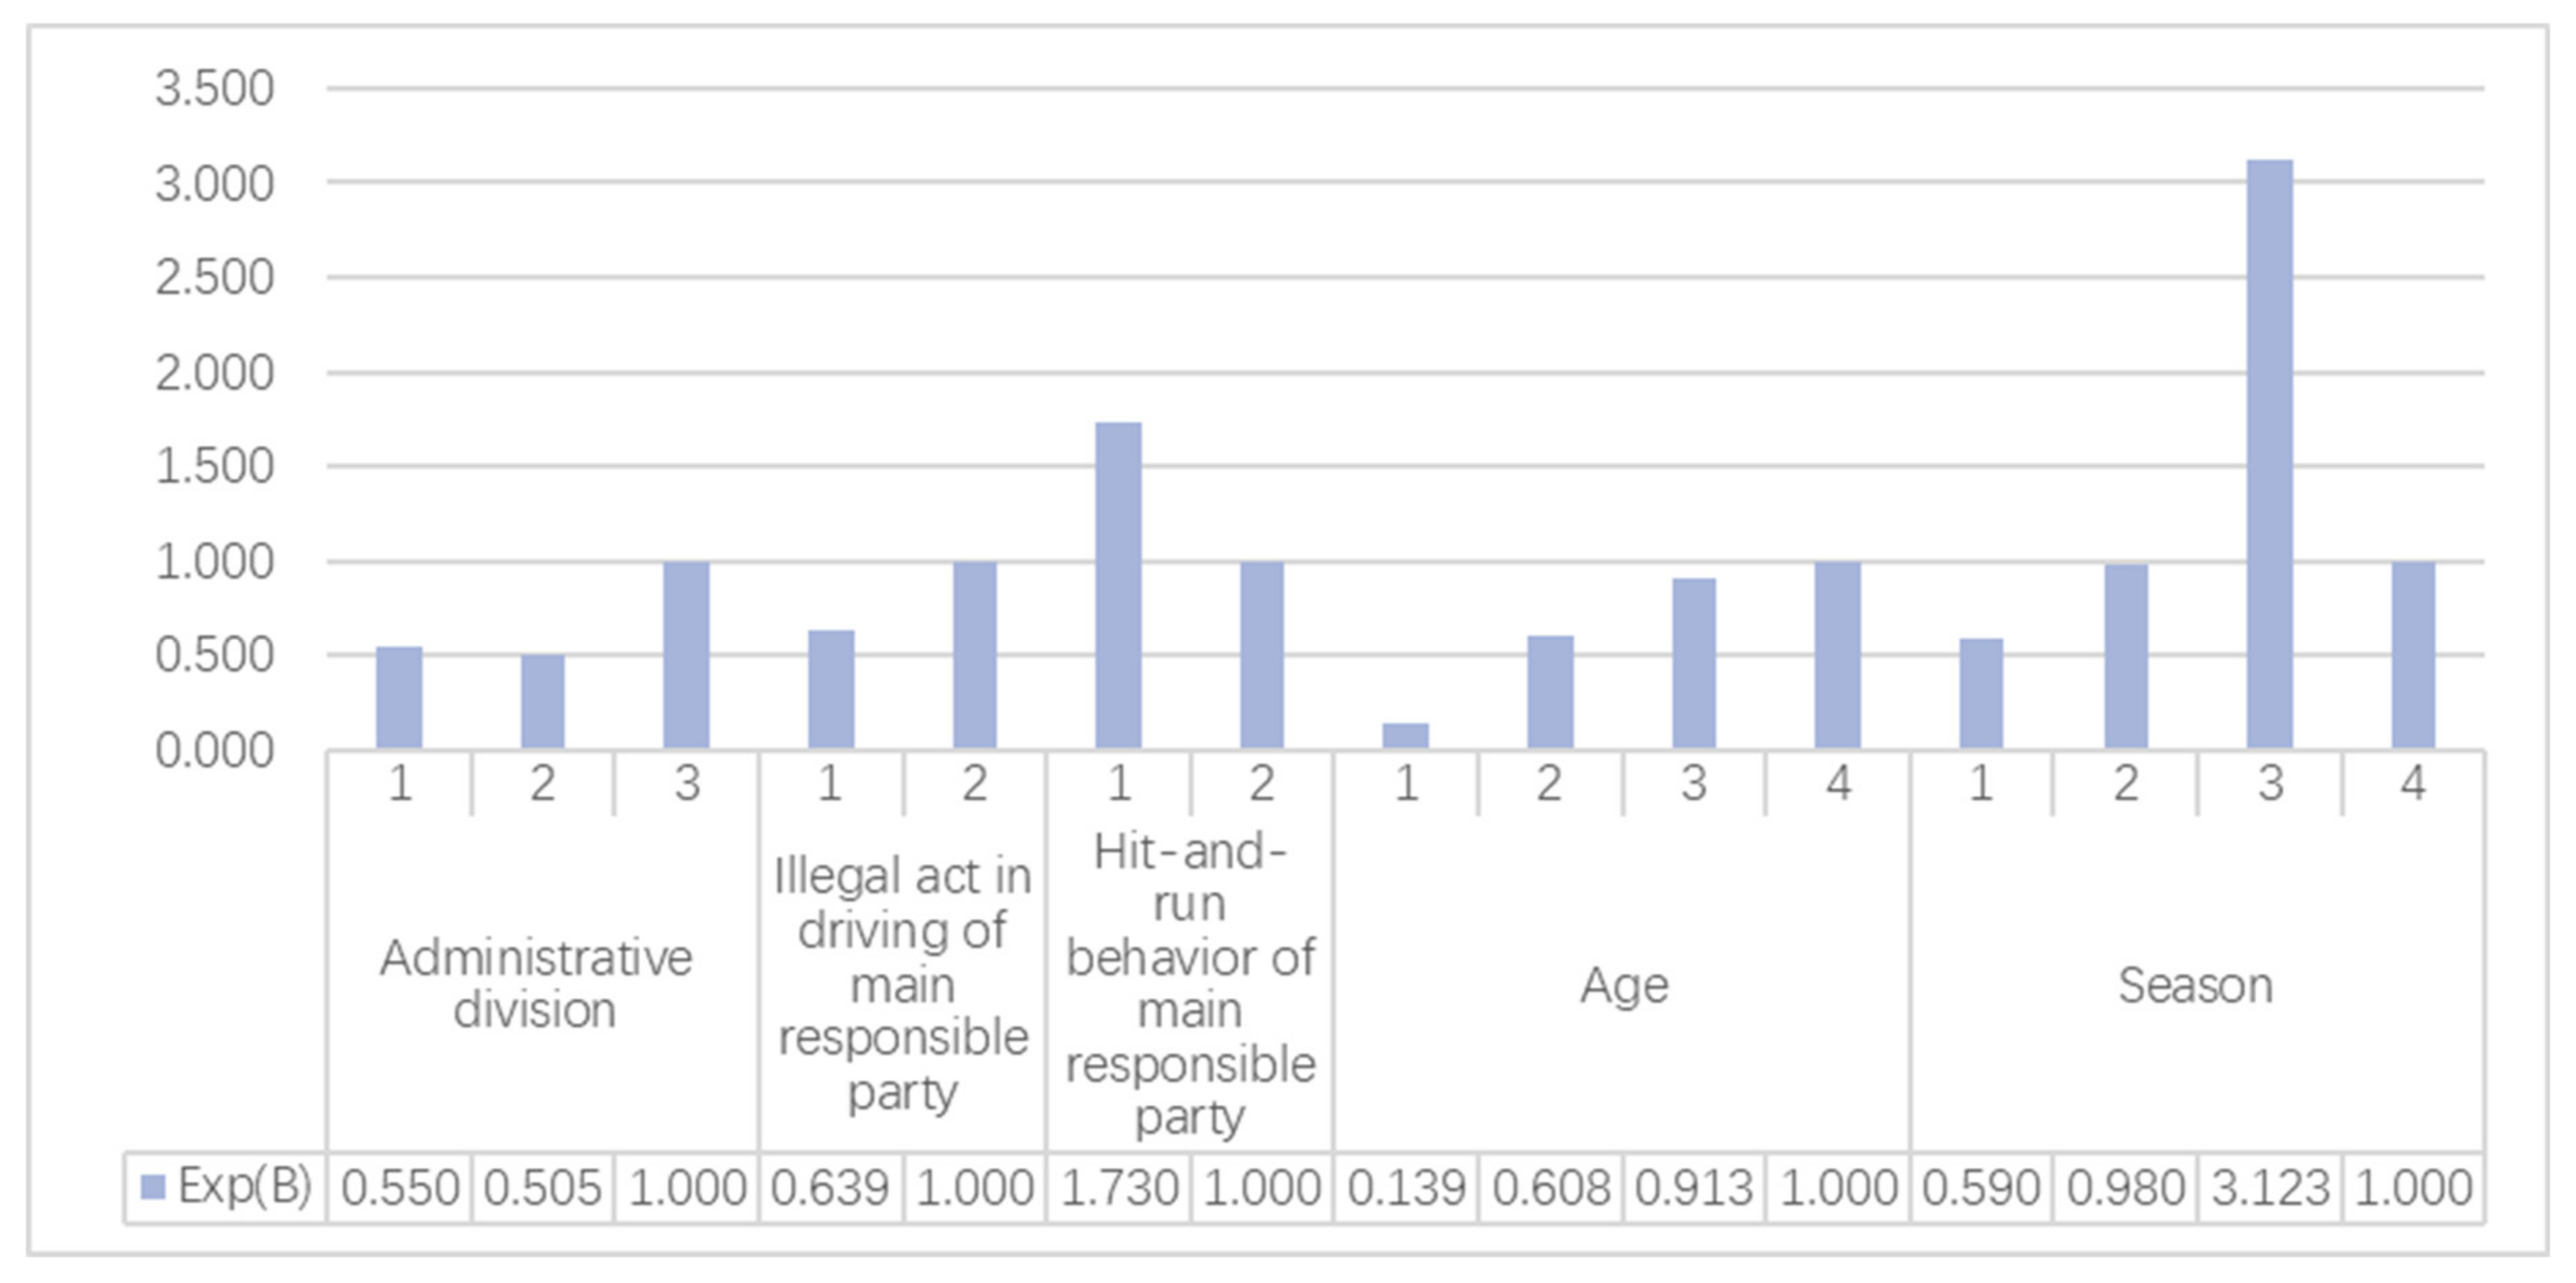
Out of 16 influencing factors considered, 5 were significant (p < 0.05). The results of the significant influencing factors are shown in Figure 1.
For administrative division, the significance value was 0.002. The probabilities of causing death from an accident of administrative division 1 and 2 were, respectively, 0.550 and 0.505 times that of administrative division 3. The area with the highest fatality rate was division 3.
For seasons, the significance value was 0.000. The probabilities of causing death from an accident of season 1, 2, and 3 were 0.590, 0.980, and 3.123 times that of season 4, respectively. Season 3 had the highest probability of causing fatal accidents.
For an illegal act in the driving of the main responsible party, the significance value was 0.019. The probability of causing death from an accident of value 1 was 0.639 times that of value 2. An illegal act in the driving of the main responsible party 2 had a higher probability of causing death.
For hit-and-run behavior of the main responsible party, the significance value was 0.007. The probability of causing death of value 1 as 1.730 times that of value 2. Hit-and-run behavior of the main responsible party 1 had a higher probability of causing death.
For the influencing factor of age, the significance value was 0.000. The probability of causing death of age 1, 2, and 3 were, respectively, 0.139, 0.608, and 0.913 times that of age 4. The highest probability of causing death accident was age 4.
4.1.2. Non-Motor Vehicle Accidents
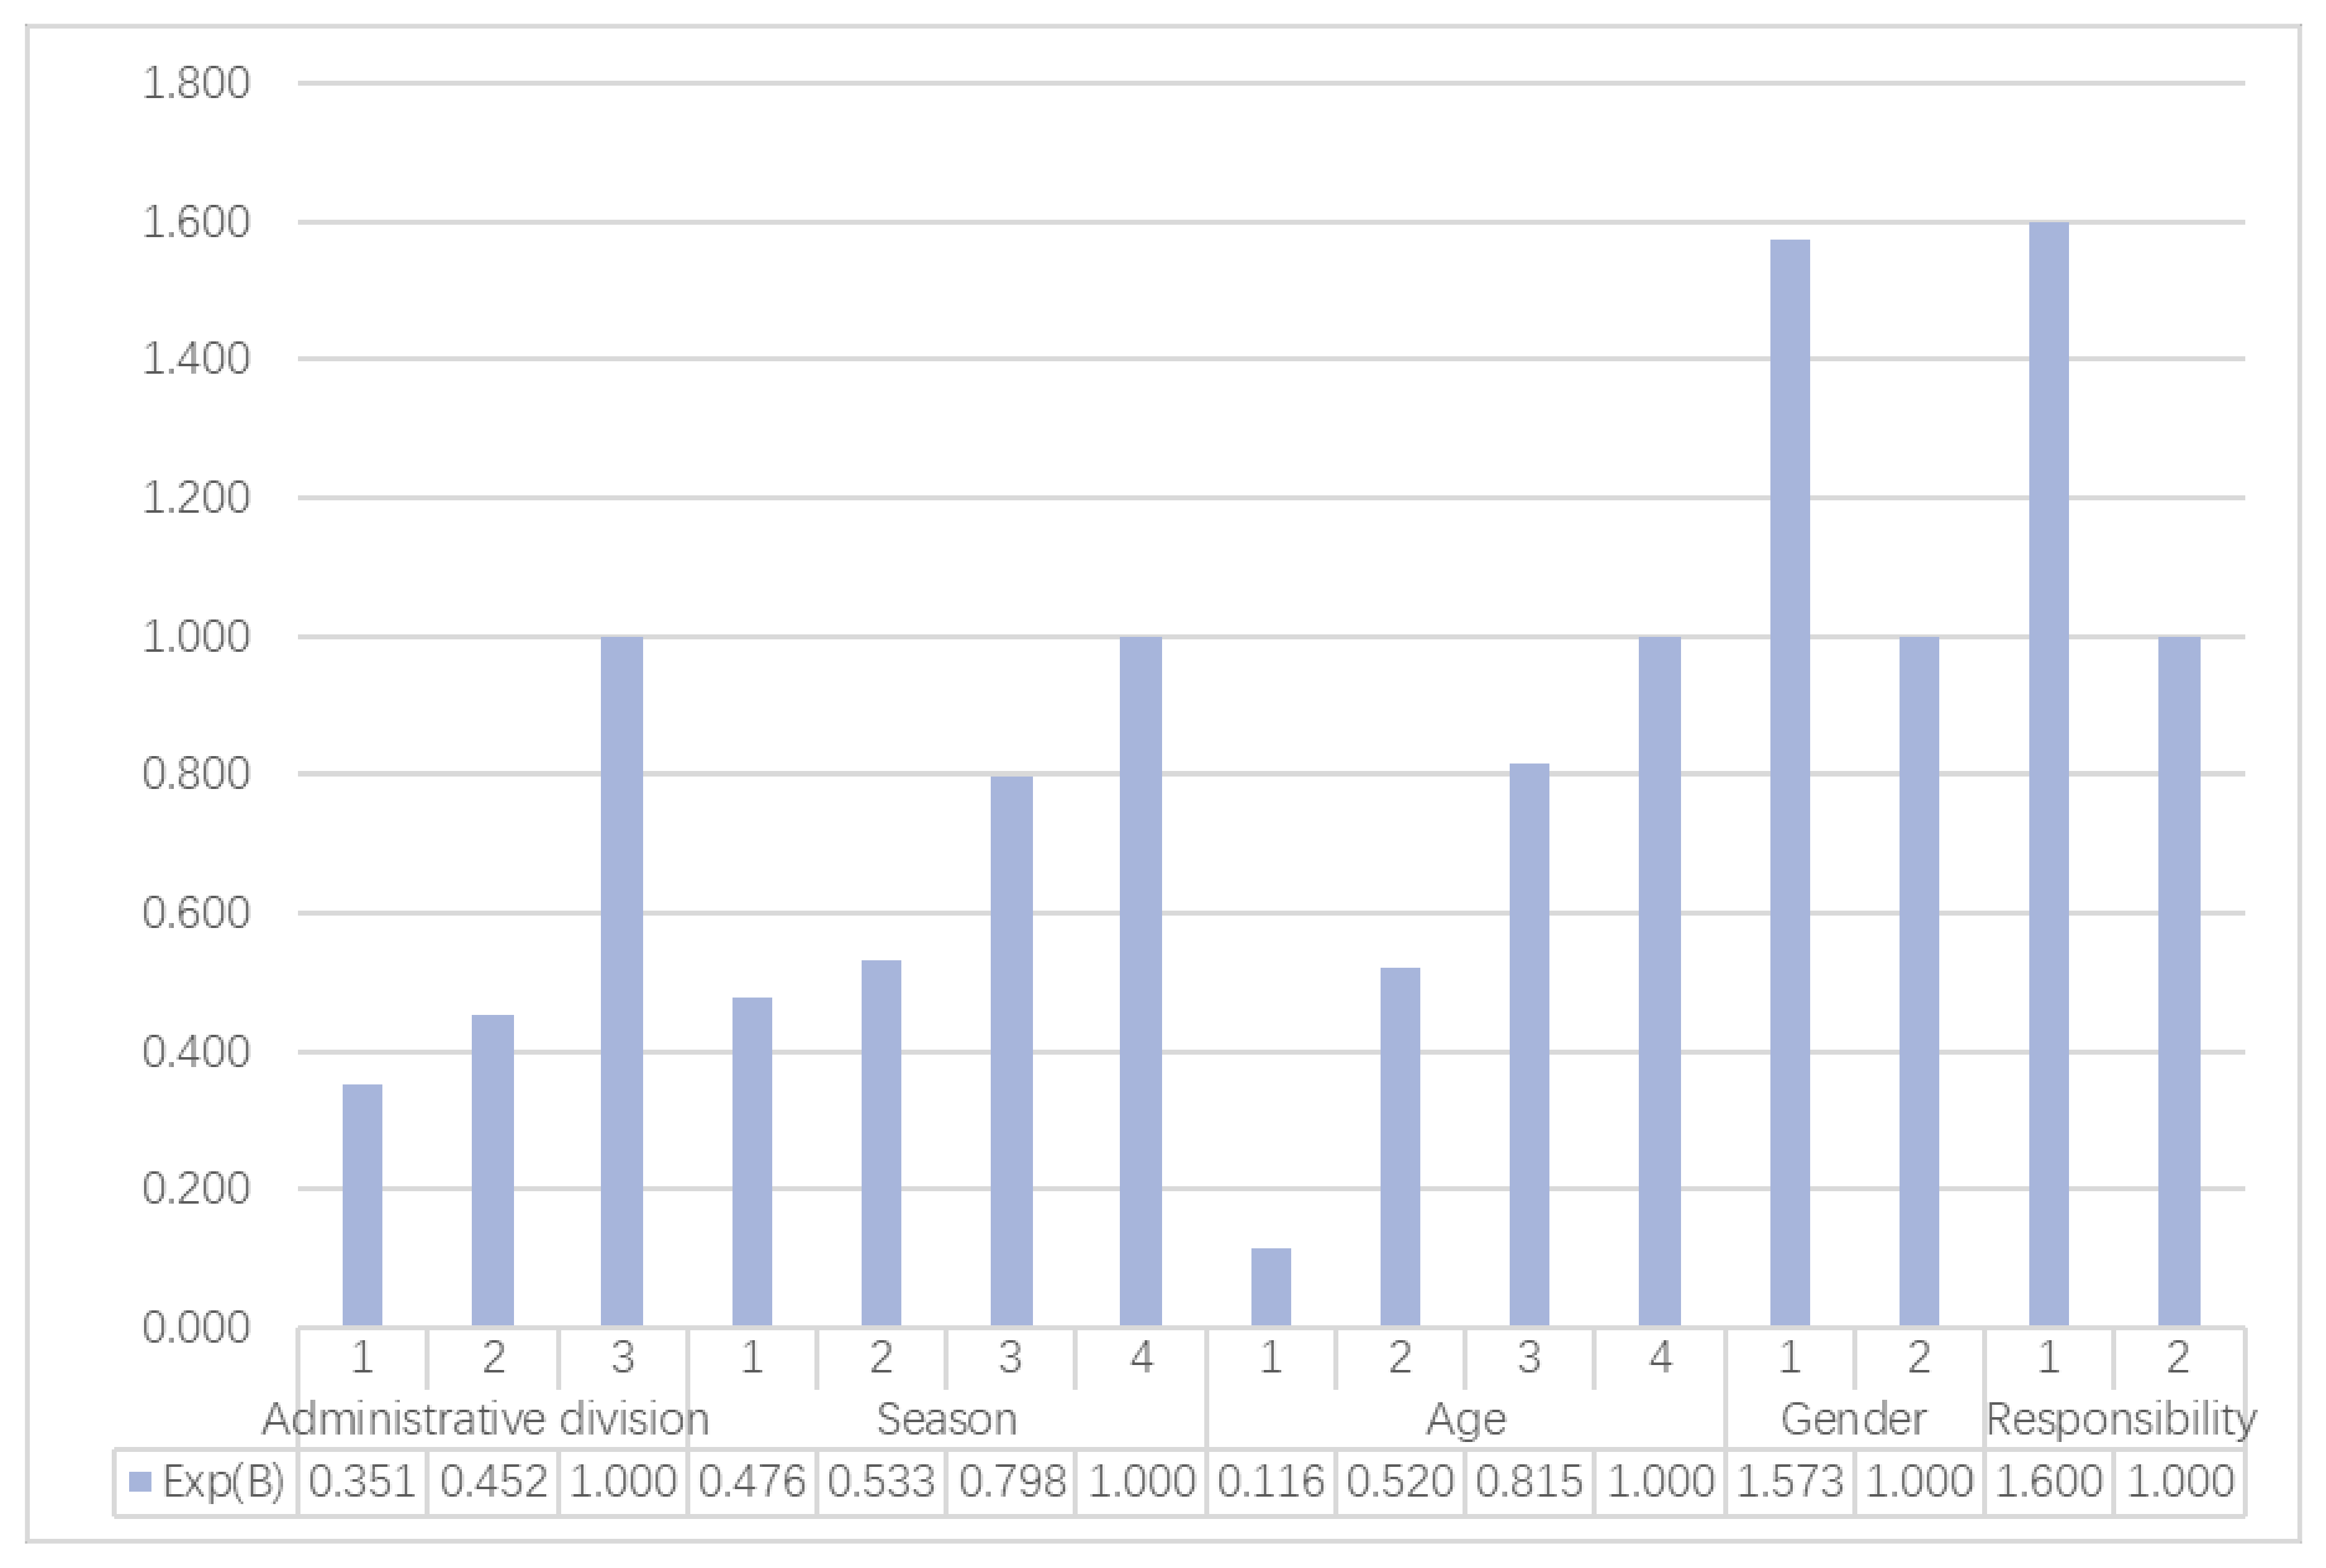
Among the 16 influencing factors taken into consideration, 5 were significant (p < 0.05). The results of the significant influencing factors are shown in Figure 2.
For administrative division, the significance value was 0.001. The probabilities of causing death from an accident of administrative division 1 and 2 were 0.351 and 0.452 times that of administrative division 3, respectively. The area with the highest fatality rate was division 3.
For seasons, the significance value was 0.017. The probabilities of causing death from an accident for season 1, 2, and 3 were 0.476, 0.533, and 0.798 times that of season 4, respectively. The highest probability of causing death was season 4.
For the influencing factor of age, the significance value was 0.031. The probabilities of causing death from an accident of age 1, 2, and 3 were 0.116, 0.520, and 0.815 times that of age 4, respectively. The highest probability of an accident causing death was age 4.
For the influencing factor of gender, the significance value was 0.037. The fatality rate of value 1 was 1.573 times that of value 2. Gender 1 had a higher probability of causing death.
For the influencing factor of accident responsibility, the significance value was 0.027. The probability of causing death from an accident of value 1 was 1.600 times that of value 2. Accident responsibility 1 had a higher probability of causing death.
4.2. Classification and Regression Tree Analysis
By using classification and regression tree analysis, we obtained the normalized importance of pedestrian and non-motor vehicles accidents. The results of normalized importance are listed in Table 4.
For pedestrian accidents, the season had the highest normalized importance (100.0%) of all the significant factors on pedestrian accidents. This was followed by age (39.7%), administrative division (33.1%), hit-and-run behavior of main responsible party (7.3%), and illegal act in driving of the main responsible party (0.2%) on normalized importance.
For non-motor vehicle accidents, the administrative division had the highest normalized importance (100.0%) of all significant factors on non-motor vehicle accidents. This was followed by gender (52.7%), season (42.8%), age (4.4%), and accident responsibility (0) on normalized importance.
5. Discussion
Based on the results from the calculations using binary logistic regression and classification and regression tree analysis, the influencing factors can be classified into three types: common influencing factors, different influencing factors, and no-influence factors. They are detailed as follows.
5.1. Common Influencing Factors
Age, administrative division, and season were the three common influencing factors for both pedestrian accidents and non-motor vehicle accidents.
5.1.1. Age
For both pedestrian and non-motor vehicle accidents, age 4 had the highest possibility of causing death and age 1 had the lowest possibility of causing death.
Elderly people in their 60s or above are less alert to their surroundings than younger people. When they encounter a traffic accident and become the victim of minor or no responsibility, it is more likely that they will sustain more severe injuries than younger people. Therefore, the elderly over 60 years old are at the highest risk of all ages in traffic accidents, whereas children and teenagers are more sheltered under their parents’ supervision, so they are the least likely group of people to have death from traffic accidents.
5.1.2. Administrative Division
The influencing factor of administrative division showed different results on pedestrian accidents and non-motor vehicle accidents. For pedestrian accidents, value 3 had the highest possibility of causing death, and value 2 had the lowest possibility of causing death. For non-motor vehicle accidents, value 3 and value 1 had the highest and lowest possibility of causing death, respectively. Hence, for both pedestrian and non-motor vehicle accidents, the most attention should be paid to the outer suburban area as it had the highest possibility of causing death. A potential reason underlying this high possibility could be the relatively poor infrastructure in outer suburban areas compared to urban areas; the former lack effective protection measures for pedestrians and non-motor vehicles. Hence, it is necessary to direct our focus to the road infrastructure construction in the suburbs to reduce the death rate of road traffic accidents.
5.1.3. Season
The influencing factor of season shows different results on pedestrian accidents and non-motor vehicle accidents. For pedestrian accidents, value 3 had the highest possibility of causing death, and value 1 had the lowest. For non-motor vehicle accidents, value 4 had the highest possibility of causing death, and value 1 had the lowest. Thus, autumn and winter were the two seasons that should be paid greater attention to reduce the occurrence of death. Extreme conditions are more frequent in the cold weather of autumn and winter [10], coupled with low visibility in rain and snow. Automobile tires also often have low pressure in these two seasons due to cold contraction, making autumn and winter the two relatively more dangerous seasons. The occurrence of death from accidents in these two seasons could be prevented by increasing the number of traffic police on duty and imposing seasonal speed limits.
5.2. Different Influencing Factors
5.2.1. Pedestrian Accidents
For pedestrian accidents, personalized influencing factors were an illegal act in the driving of the main responsible party and hit-and-run behavior of the main responsible party. Both were significant influencing factors on pedestrian accidents, but not significant for non-motor vehicle accidents.
For an illegal act in the driving of the main responsible party, value 2 had a higher possibility of causing death than value 1. Therefore, more attention should be paid to non-illegal acts in driving, including irregular acts and others. Punishment measures for these behaviors are not included in the current road traffic laws, and without legal regulation, irregular driving may lead to a higher mortality rate.
For hit-and-run behavior of the main responsible party, value 1 had a higher possibility of causing death than value 2. Thus, more attention should be paid to hit-and-run behavior. For urban infrastructure, more cameras could always be set up in places with high frequencies of road accidents to record the road traffic situation, to warn off hit-and-run behavior.
5.2.2. Non-Motor Vehicle Accidents
For non-motor vehicle accidents, the personalized influencing factors were gender and accident responsibility. Both were significant influencing factors for non-motor vehicle accidents, but were not significant for pedestrian vehicle accidents.
For the influencing factor of gender, value 1 had a higher possibility of causing death than value 2. Therefore, male drivers of non-motor vehicles should pay more attention than female drivers whilst driving.
For the influencing factor of accident responsibility, value 1 had a higher possibility of causing death than value 2. Therefore, more attention should be paid in cases of non-responsibility accidents of non-motor vehicles than minor responsibility accidents. It is necessary to improve the level of protection measures for non-motor vehicle drivers to reduce the occurrence of death from accidents.
5.3. No-Influence Factors
The no-influence factors included rush hour, weekday or weekend, intersection, location of road cross section, pavement condition, vehicle isolation, central isolation of road, physical isolation of road, or weather. All of these are time and environmental attributes rather than driver attributes. A possible explanation could be that driver attributes contribute more to traffic accidents.
6. Conclusions
Taking the city of Shenyang as the example, 1227 traffic accidents from 2015 to 2017 were analyzed, in which 733 were pedestrian accidents and 494 were non-motor vehicle accidents. Sixteen influencing factors from the aspects of the main responsible party attributes, pedestrian/non-motor vehicle attributes, time attributes, space attributes, and environment attributes were used to analyze their relationship with accidents, using binary logit (BLR) and classification and regression tree (CART) methods. The factors of age, administrative division, and season were the common influencing factors. Illegal acts in driving and hit-and-run behavior of the main responsible party were the personalized factors for pedestrian accidents. The factors of gender and accident responsibility were the personalized factors for non-motor vehicle accidents. Other factors did not show significant values for an effect on accidents.
The normalized significance values of pedestrian accidents and non-motor vehicle accidents were different. For pedestrian accidents, season was the most important influencing factor, and for non-motor vehicle accidents, administrative division was the most important influencing factor. Of all the influencing factors, driver attributes had more effect than time attributes.
Further studies can be conducted discussing the effects of new factors to determine whether there are more significant factors affecting accidents within the aspects of time and environment.
Author Contributions
Literature review: J.W., T.W.; Data acquisition and handling: Z.S., J.W.; Methodology: J.W., H.L., T.W.; Results: J.W., Z.S., H.L.; Discussion: J.W., Z.S., K.W.; Conclusion: Z.S., J.W.; Paper check: T.W., K.W. All authors have read and agreed to the published version of the manuscript.
Funding
This research was funded by Liberal Arts and Social Sciences Foundation under the Ministry of Education in China, grant number 18YJC630158; Beijing Natural Science Foundation, grant number 9194023; The major consulting project of Chinese Academy of Engineering: Research on the Transportation Strategy for Powerful Nation, grant number 2017ZD07.
Conflicts of Interest
The authors declare no conflicts of interest.
References
- Global Status Report on Road Safety. 2015. Available online: https://www.who.int/violence_injury_prevention/road_safety_status/2015/zh/ (accessed on 23 April 2020).
- Kemnitzer, C.R.; Pope, C.N.; Nwosu, A.; Zhao, S.; Wei, L.; Zhu, M. An investigation of driver, pedestrian, and environmental characteristics and resulting pedestrian injury. J. Crash Prev. Injury. Control 2019, 20, 510–514. [Google Scholar] [CrossRef] [PubMed]
- Yan, X.; Ma, M.; Huang, H.; Abdel-Aty, M.; Wu, C. Motor vehicle–bicycle crashes in Beijing: Irregular maneuvers, crash patterns, and injury severity. Accid. Anal. Prev. 2011, 43, 1751–1758. [Google Scholar] [CrossRef] [PubMed]
- Eluru, N.; Bhat, C.R.; Hensher, D.A. A mixed generalized ordered response model for examining pedestrian and bicyclist injury severity level in traffic crashes. Accid. Anal. Prev. 2008, 40, 1033–1054. [Google Scholar] [CrossRef] [Green Version]
- National Data of National Bureau of Statistics of China. Available online: http://data.stats.gov.cn/easyquery.htm?cn=E0105&zb=A01®=210100&sj=2018 (accessed on 23 April 2020).
- Hobeika, A.G.; Jung, H.; Bae, S. Contribution of Aggressive Drivers to Automobile Tailpipe Emissions under Acceleration and Braking Conditions. J. Trans. Eng. 2015, 141, 04014077. [Google Scholar] [CrossRef]
- Shi, J.; Tan, J. Traffic accident and emission reduction through intermittent release measures for heavy fog weather. Mod. Phys. Lett. B 2015, 29, 1550148. [Google Scholar] [CrossRef]
- Andersson, A.; Chapman, L. The use of a temporal analogue to predict future traffic accidents and winter road conditions in Sweden. Meteorol. Appl. 2011, 18, 125–136. [Google Scholar] [CrossRef]
- Kim, Y.; Ryoo, B.; Kim, Y.; Huh, Y. Major Accident Factors for Effective Safety Management of Highway Construction Projects. J. Constr. Eng. Manag. 2013, 139, 628–640. [Google Scholar] [CrossRef]
- Kelsall, D.; Redelmeier, D.A. Winter road safety is no accident. Can. Med. Assoc. J. 2016, 188, 241. [Google Scholar] [CrossRef] [Green Version]
- Zhang, Y.; Lu, H.; Qu, W. Geographical Detection of Traffic Accidents Spatial Stratified Heterogeneity and Influence Factors. Int. J. Environ. Res. Public Health 2020, 17, 572. [Google Scholar] [CrossRef] [Green Version]
- Park, B.; Ryu, S.; Park, J. Hypothesis Tests on the Relations Between Interchange Types and Traffic Accidents in the Case of Korean Expressways. J. Korea Soc. Transp. 2007, 25, 55–63. [Google Scholar]
- Sacha, D.; Aislin, R.; Bruce, W.; Michel, B. Age modifies the association between driver’s body mass index and death following motor vehicle crashes. Traffic. Inj. Prev. 2018, 19, 728–733. [Google Scholar]
- Yang, B.; Liu, P.; Chan, C.; Xu, C.; Guo, Y. Identifying the crash characteristics on freeway segments based on different ramp influence areas. Traffic. Inj. Prev. 2019, 20, 1–6. [Google Scholar] [CrossRef] [PubMed]
- Stipancic, J.; Zangenehpour, S.; Miranda-Moreno, L.; Saunier, N.; Granié, M. Investigating the gender differences on bicycle-vehicle conflicts at urban intersections using an ordered logit methodology. Accid. Anal. Prev. 2016, 97, 19–27. [Google Scholar] [CrossRef] [PubMed]
- Milton, J.; Shankar, V.; Mannering, F. Highway accident severities and the mixed logit model: An exploratory empirical analysis. Accid. Anal. Prev. 2008, 40, 260–266. [Google Scholar] [CrossRef]
- Wang, X.; Kim, S. Prediction and Factor Identification for Crash Severity: Comparison of Discrete Choice and Tree-Based Models. Trans. Res. Rec. 2019, 2673, 640–653. [Google Scholar] [CrossRef]
- Sui, B.; Lubbe, N.; Jonas, B. A clustering approach to developing car-to-two-wheeler test scenarios for the assessment of Automated Emergency Braking in China using in-depth Chinese crash data. Accid. Anal. Prev. 2019, 132, 105242. [Google Scholar] [CrossRef]
- Jun, M.A.; Ding, Y.; Cheng, J.; Tan, Y.; Gan, V.; Zhang, J. Analyzing the Leading Causes of Traffic Fatalities Using XGBoost and Grid-based Analysis: A City Management Perspective. IEEE Access 2019, 7, 148059–148072. [Google Scholar]
- Zong, F.; Chen, X.; Tang, J.; Yu, P.; Wu, T. Analyzing Traffic Crash Severity with Combination of Information Entropy and Bayesian Network. IEEE Access 2019, 7, 63288–63302. [Google Scholar] [CrossRef]
- Lynn, B.M.; Michelle, F.; Marilyn, J.; Mark, S.; Geoffrey, R.; Jennie, O. Characteristics of the road infrastructure and injurious cyclist crashes resulting in a hospitalisation. Accid. Anal. Prev. 2020, in press. [Google Scholar]
- Kaplan, S.; Prato, C. Spatial Analysis of Land Use and Network Effects on Frequency and Severity of Cyclist-Motorist Crashes in Copenhagen Region, Denmark. Trans. Res. Board Meet. 2015, 16, 724–731. [Google Scholar]
- Behnood, A.; Mannering, F. An empirical assessment of the effects of economic recessions on pedestrian-injury crashes using mixed and latent-class models. Anal. Methods Accid. Res. 2016, 12, 1–17. [Google Scholar] [CrossRef]
- Jordanka, K.; Andras, B.; Ron, S.; Anja, S. Safety benefit assessment of autonomous emergency braking and steering systems for the protection of cyclists and pedestrians based on a combination of computer simulation and real-world test results. Accid. Anal. Prev. 2020, in press. [Google Scholar]
- Wang, Y.; Haque, M.; Chin, H. Elderly pedestrian injuries in Singapore. J. Trans. Saf. Secur. 2017, 9, 273–300. [Google Scholar] [CrossRef]
Figure 1.
Values of the significant influencing factors on pedestrian accidents.

Figure 2.
Values of the significant influencing factors on non-motor vehicle accidents.


Table 1.
Definition of the variables for pedestrian and non-motor vehicle accidents.
| Interpreted Variable | Definition |
|---|---|
| Impact on accidents (Y) | 0 = Zero death; 1 = Accidents with death |
| Variables of explanation (Xi) | |
| Main responsible party attributes | |
| Hit-and-run behavior of the main responsible party (X1) | 1 = Yes; 2 = No |
| Illegal act in the driving of the main responsible party (X2) | 1 = Yes; 2 = No |
| Pedestrian/non-motor vehicle attributes | |
| Gender (X3) | 1 = Man; 2 = Woman |
| Age (X4) | 1 = 0–18; 2 = 19–45; 3 = 46–59; 4 = 60 and above |
| Accident responsibility (X5) | 1 = No responsibility; 2 = Minor responsibility |
| Time attributes | |
| Season (X6) | 1 = Spring 2 = Summer 3 = Autumn 4 = Winter |
| Rush hour (X7) | 1 = Yes (7:00–9:00, 17:00–19:00); 2 = No (Other time periods) |
| Weekday or weekend (X8) | 1 = Weekday; 2 = Weekend |
| Spatial attributes | |
| Intersection (X9) | 1 = Yes; 2 = No |
| Administrative division (X10) | 1 = Main city; 2 = Suburban city; 3 = Outer city |
| Location of road (X11) | 1 = Vehicle lane; 2 = Mixed lane; 3 = Non-motor vehicle lane; 4 = Crossings; 5 = Others |
| Pavement condition (X12) | 1 = Good; 2 = Others |
| Vehicle isolation (X13) | 1 = Yes; 2 = No |
| Central isolation of road (X14) | 1 = Yes; 2 = No |
| Physical isolation of road (X15) | 1 = Yes; 2 = No |
| Environmental attributes | |
| Weather (X16) | 1 = Sunny; 2 = Others |
Table 2.
The proportion of different variables in pedestrian and non-motor vehicle accidents.
| Interpreted Variable (Y) | Value | Pedestrian Accidents (%) | Non-Motor Vehicle Accidents (%) |
|---|---|---|---|
| Impact on accidents (Y) | 0 1 | 52.0 48.0 | 54.7 45.3 |
| Variables of explanation (Xi) | |||
| Main responsible party attributes | |||
| Hit-and-run behavior of the main responsible party (X1) | 1 2 | 18.8 81.2 | 10.3 89.7 |
| Illegal act in driving of the main responsible party (X2) | 1 2 | 25.8 74.2 | 33.0 67.0 |
| Pedestrian/non-motor vehicle attributes | |||
| Gender (X3) | 1 2 | 58.3 41.7 | 70.6 29.4 |
| Age (X4) | 1 2 3 4 | 5.0 22.4 27.0 45.6 | 1.6 18.0 39.5 40.9 |
| Accident responsibility (X5) | 1 2 | 82.8 17.2 | 70.0 30.0 |
| Time attributes | |||
| Season (X6) | 1 2 3 4 | 19.9 24.8 16.2 39.0 | 19.2 32.0 18.2 30.6 |
| Rush hour (X7) | 1 2 | 25.6 74.4 | 25.5 74.5 |
| Weekday or weekend (X8) | 1 2 | 28.4 71.6 | 29.8 70.2 |
| Spatial attributes | |||
| Intersection (X9) | 1 2 | 20.6 79.4 | 40.9 59.1 |
| Administrative division (X10) | 1 2 3 | 36.7 38.5 24.8 | 30.0 47.6 22.5 |
| Location of road (X11) | 1 2 3 4 5 | 59.6 16.5 7.2 9.8 6.8 | 62.1 20.9 7.9 4.0 5.1 |
| Pavement condition (X12) | 1 2 | 99.2 0.8 | 98.4 1.6 |
| Vehicle isolation (X13) | 1 2 | 4.0 96.0 | 5.7 94.3 |
| Central isolation of road (X14) | 1 2 | 16.9 83.1 | 12.1 87.9 |
| Physical isolation of road (X15) | 1 2 | 18.6 81.4 | 15.8 84.2 |
| Environmental attributes | |||
| Weather (X16) | 1 2 | 91.0 9.0 | 90.9 9.1 |
Table 3.
Significant values and odds ratios of pedestrian and non-motor vehicle accidents.
| Significant Variables | Pedestrian | Non-Motor Vehicle | ||
|---|---|---|---|---|
| p | Exp(B) | p | Exp(B) | |
| Administrative division | 0.002 | 0.001 | ||
| 1 | 0.550 | 0.351 | ||
| 2 | 0.505 | 0.452 | ||
| 3 | # | # | ||
| Season | 0.000 | 0.017 | ||
| 1 | 0.590 | 0.476 | ||
| 2 | 0.980 | 0.533 | ||
| 3 | 3.123 | 0.798 | ||
| 4 | # | # | ||
| Illegal act in driving of main responsible party | 0.019 | - | ||
| 1 | 0.639 | |||
| 2 | # | |||
| Hit-and-run behavior of main responsible party | 0.007 | - | ||
| 1 | 1.730 | |||
| 2 | # | |||
| Age | 0.000 | 0.031 | ||
| 1 | 0.139 | 0.116 | ||
| 2 | 0.608 | 0.520 | ||
| 3 | 0.913 | 0.815 | ||
| 4 | # | # | ||
| Gender | - | 0.037 | ||
| 1 | 1.573 | |||
| 2 | # | |||
| Accident responsibility | - | 0.027 | ||
| 1 | 1.600 | |||
| 2 | # | |||
“-” indicates a not significant variable. “#” indicates the Exp(B) value in comparison with referenced value. B is the correlation coefficient of each influence factor. Exp(B) is the odds ratio meaning how much it can change Y from 0 to 1 in comparison with the referenced value.
Table 4.
The normalized importance of pedestrian and non-motor vehicle accidents.
| Variables | Pedestrian Accidents | Non-Motor Vehicle Accidents |
|---|---|---|
| Hit-and-run behavior of the main responsible party (X1) | 7.3% | - |
| Illegal act in driving of the main responsible party (X2) | 0.2% | - |
| Gender (X3) | - | 52.7% |
| Age (X4) | 39.7% | 4.4% |
| Accident responsibility (X5) | - | 0 |
| Season (X6) | 100.0% | 42.8% |
| Rush hour (X7) | - | - |
| Weekday or weekend (X8) | - | - |
| Intersection (X9) | - | - |
| Administrative division (X10) | 33.1% | 100.0% |
| Location of road (X11) | - | - |
| Pavement condition (X12) | - | - |
| Vehicle isolation (X13) | - | - |
| Central isolation of road (X14) | - | - |
| Physical isolation of road (X15) | - | - |
| Weather (X16) | - | - |
“-” indicates the influencing factor was not significant in binary logistic regression analysis, and the calculation of classification and regression tree analysis was not conducted.
© 2020 by the authors. Licensee MDPI, Basel, Switzerland. This article is an open access article distributed under the terms and conditions of the Creative Commons Attribution (CC BY) license (http://creativecommons.org/licenses/by/4.0/).
Share and Cite
MDPI and ACS Style
Wang, J.; Lu, H.; Sun, Z.; Wang, T.; Wang, K. Investigating the Impact of Various Risk Factors on Victims of Traffic Accidents. Sustainability 2020, 12, 3934. https://0-doi-org.brum.beds.ac.uk/10.3390/su12093934
AMA Style
Wang J, Lu H, Sun Z, Wang T, Wang K. Investigating the Impact of Various Risk Factors on Victims of Traffic Accidents. Sustainability. 2020; 12(9):3934. https://0-doi-org.brum.beds.ac.uk/10.3390/su12093934
Chicago/Turabian StyleWang, Jianyu, Huapu Lu, Zhiyuan Sun, Tianshi Wang, and Katrina Wang. 2020. "Investigating the Impact of Various Risk Factors on Victims of Traffic Accidents" Sustainability 12, no. 9: 3934. https://0-doi-org.brum.beds.ac.uk/10.3390/su12093934
Note that from the first issue of 2016, this journal uses article numbers instead of page numbers. See further details here.