Article

ENER-BI: Integrating Energy and Spatial Data for Cities’ Decarbonisation Planning

by
Koldo Urrutia-Azcona
1,*,
Elena Usobiaga-Ferrer
1,
Pablo De Agustín-Camacho
1,
Patricia Molina-Costa
1,
Mauricia Benedito-Bordonau
1 and
Iván Flores-Abascal
2
1
TECNALIA, Basque Research and Technology Alliance (BRTA), Building Technologies Unit Parque Tecnológico de Vizcaya, Geldo Street, Edif.700, 48160 Derio, Spain
2
ENEDI Research Group, University of the Basque Country, Alda. Urquijo s/n, 48013 Bilbao, Spain
*
Author to whom correspondence should be addressed.
Sustainability 2021, 13(1), 383; https://0-doi-org.brum.beds.ac.uk/10.3390/su13010383
Submission received: 19 November 2020 / Revised: 15 December 2020 / Accepted: 16 December 2020 / Published: 4 January 2021

Abstract

:
Given the current climate emergency, our planet is suffering. Mitigation measures must be urgently deployed in urban environments, which are responsible for more than 70% of global CO2 emissions. In this sense, a deeper integration between energy and urban planning disciplines is a key factor for effective decarbonisation in urban environments. This is addressed in the Cities4ZERO decarbonisation methodology. This method specifically points out the need for technology-based solutions able to support that integration among both disciplines at a local level, enriching decision-making in urban decarbonisation policy-making, diagnosis, planning, and follow-up tasks, incorporating the spatial dimension to the whole process (GIS-based), as well as the possibilities of the digital era. Accordingly, this paper explores the demands of both integrated urban energy planning and European/Basque energy directives, to set the main requisites and functionalities that Decision Support Systems (DSSs) must fulfil to effectively support city managers and the urban decarbonisation process.

1. Introduction

Cities are progressively growing, in terms of population, economic growth, logistics, knowledge, and social interaction—this has been a consolidated trend during the last century. In connection with this, cities have also become nodes of energy consumption, pollution, and public health concern [1,2,3]. Furthermore, cities are increasingly being exposed to impacts from pandemics and climate change. To partially tackle these challenges, cities intend to address the urgent need of decarbonizing their urban environments.
To guide local authorities in the decarbonisation process, the authors of this study published the Cities4ZERO methodology, a step-by-step strategy that is able to guide decision-makers through the process of developing the most appropriate plans and projects for an effective urban transition, from an integrated, participatory, and cross-cutting planning approach [4]. The study intended to provide a deeper integration among urban planning and energy planning dynamics, a key factor in the decarbonisation process [5,6]. It also suggested the need for technology-based solutions, able to support that integration among both disciplines, enriching decision-making in urban decarbonisation policy-making, diagnosis, and planning tasks, incorporating the spatial dimension (Geographic Information System-based; GIS-based) to the whole process.
The focus of this research is to explore the following questions: what requirements and functionalities should that technology-based solution consider in order to support local authorities in effectively coping with the steps towards urban decarbonisation? What are the characteristics a Decision Support System (DSS) should have to help municipalities in the integration of energy and urban planning disciplines? Within municipalities, information for crosscutting tasks, such as decarbonisation planning, is often scattered and incomplete. Significant decisions are not made based on data—there is a general lack of integration. Relevant competences are fragmented; an intuitive and open-source software would be key to support this upgrade of crosscutting planning procedures.
Diverse urban energy planning tools have been developed. However, there is a gap in the decision-making chain between too technical, project-oriented engineering energy tools, and the discussions of urban planners around 2D city maps, which are not connected to databases. The current digital era offers the possibility of having access to automatic updatable real data from the urban environment (Internet of Things—IoT/sensors) as well as to automatize calculation processes connected to urban energy planning (algorithms); all of this presented (and able to be analysed) in a georeferenced manner (GIS-based). Therefore, this research aims to define the required main features to conform a data-based decision-support tool for integrated urban decarbonisation planning, which the authors have named ENER-BI. This acronym combines the urban energy analysis potential of the presented DSS with a Business Intelligence (BI) dashboard format, including the management, visualization, and data updateability possibilities of PowerBI software, which is also able to process and display georeferenced information, a crucial aspect in urban decarbonisation planning.
Regarding the content of the following sections: the Materials and Methods section delves on current sustainable energy directives of the European Union (EU) and the legal framework for the regional case of the Basque Country (Spain), extracting elements that ENER-BI DSS must provide from a legal perspective. Furthermore, this section presents the steps ENER-BI must cover in low-carbon city planning, as well as an analysis of the existing tools in the market. This section also describes the process followed by the research team, to identify the requirements and functionalities of ENER-BI from a DSS perspective, which are both presented in the Results section. Finally, the Discussion section argues for the adaptability of ENER-BI to municipal environments and the implications of such a DSS in the transition towards the decarbonisation of cities, presenting future lines of research in the field.

2. Materials and Methods

2.1. Identifying Requisites and Functionalities from a DSS Perspective

The process followed by the research team to identify the requirements and functionalities from a DSS perspective is structured in 5 tasks: (1) review of regulatory framework and tendencies in a European energy context; (2) selection and analysis of most CO2-emitting city systems and the data entailed (building stock, transport, public lighting, etc.); (3) identification of ENER-BI DSS structure and contents (algorithms and processes); (4) identification of requisites for ENER-BI DSS; (5) real-data test development to deepen in requirements and a user-friendly interface.
The first task, framed in Section 2.2.1, begins with the analysis of current sustainable energy European Union (EU) directives and the regional case of the Basque Country, complemented with other regional regulations in Spain. This regulatory analysis pointed the most CO2-emitting sources from public administration and the main city systems to be addressed by ENER-BI DSS from the collective perspective: public building stock and facilities, public lighting, and public transport and fleets. In addition, due to its significant impact on city energy consumption, private building stock was also born in mind. Regarding other CO2-emitting private sectors, such as private mobility, real-data availability was an issue; hence, estimations were calculated according to other reference factors (traffic intensity, fuel imports, etc.).
According to regulation requirements (task 1) and the decarbonisation targets identified (task 2), a group of multidisciplinary experts in energy efficiency identified the structure and contents for ENER-BI DSS (task 3—urban planners, energy engineers, GIS experts, physicists, and sociologists). The resulting structure, explained in detail in Section 3.2, is composed by three modules: module (0) inventory, characterisation, and monitoring; module (1) scenario generation for decarbonisation planning; and module (2) decarbonisation follow-up. For these modules, the contents were defined (algorithms and processes), the main sources of information and its requisites were identified (disaggregation degree, georeferencing, periodicity, format, structure, etc.) as well as the storage procedures, treatment and representation/visualisation (task 4).
Delving in the requisites identified in task 4, the research team developed a set of tests including real data from different sources (municipal samples of public transport and public lighting data, dynamic energy consumption data from private buildings, a georeferenced inventory of buildings from a city, cadaster, and other public sources of data). These sources come from diverse cities/contexts and were used only as a test to face the different information treatment problems of each source. These information sources were processed with diverse software tools to identify the potential requisites and functionalities of ENER-BI DSS: QGIS and PowerBI to test data processing needs; Influxdb, PostgreSQL, and Postgis for database connections; EnergyPlus and EnergyPLAN for delivering energy and CO2 hybrid data-model Key Performance Indicators (KPIs), and business intelligence and three-dimensional (3D) models for visualisation.

2.2. Literature Review for a Conceptual Framework

The requirements and functionalities of the targeted ENER-BI DSS are mainly conditioned by (a) existing energy regulation; and (b) strategic planning procedures connected to the decarbonisation of cities.

2.2.1. Regulatory Framework

Regarding the regulatory framework, the ENER-BI DSS must be able to provide a robust energy GIS-supported baseline for the city, as well as enable planning and monitoring of city strategies towards decarbonisation. Ambitious European directives and national/regional regulation demand specific decarbonisation targets and plans, as the main reference at an international level, which need the support of ENER-BI DSS to be quantitatively achieved.
The EU, in line with its commitment to fight against climate change and in search of a competitive and low-carbon economy, published the Climate and Energy Framework (with key target for 2030), which seeks to continue reducing greenhouse gas (GHG) emissions by at least 40% by 2030, compared to 1990. In September 2020, the European Commission (EC) proposed updating this target to 55% as part of the European Green Deal, increase the share of renewable energy consumed (by 32%), and improve energy efficiency (by 32.5%). Given that the building sector is the main energy consumer in the EU (where buildings are responsible for approximately 40% of energy consumption and 36% of CO2 emissions, and where 75% of the building stock is considered energy inefficient), the European directives on the Energy Performance of Buildings (EPBD) and Energy Efficiency (EED) have recently been updated (EU Directives 2018/844 and 2018/2002, respectively) as part of the legislative package “Clean Energy for all Europeans”. Altogether, the directives promote policies that help to achieve a decarbonised and energy-efficient building stock by 2050, to create a stable environment that is conducive to investment, and to empower consumers and businesses to make informed decisions to save energy and money.
At a specific regional level, and aligned with these European directives, the Euskadi Energy Strategy 2030 (3E2030) establishes the intensification of energy efficiency actions in all consumer sectors, the penetration of alternative energy in transport, and the increasing use of renewable energy. For all of these reasons, the Basque Parliament approved, last year, Law 4/2019 on Energy Sustainability of the Basque Community [7], as an example of regional EU directives transposition, which seeks to establish the regulatory pillars of energy sustainability in the areas of Basque public administration and the private sector, aimed at promoting energy-saving and efficiency measures, and the promotion and implementation of renewable energies. This kind of regional regulation is crucial to understand ENER-BI DSS requirements, as it states a concrete case of energy requirements for municipalities within the EU, much more specific and closer to implementation than EU directives.

2.2.2. City Decarbonisation Planning Framework

Regarding urban energy planning procedures, the Energy in Buildings and Communities (EBC) Programme of the International Energy Agency (IEA) analyses, in Annex 63, the importance of optimising existing local instruments, processes, and frameworks to effectively support the implementation of energy and decarbonisation strategies in our communities [8].
In this sense, the Cities4ZERO methodology describes, sequentially, through 16 steps, the main elements to be covered by a decarbonisation process, both at city and project levels [4]. Within these steps, ENER-BI DSS can allow integrating energy and urban planning information to provide relevant data for decision-makers, mainly in the following tasks:
  • Inventory and characterisation of the city (ANALYSE—Step 2 from [4]); mainly focusing on providing and integrating data of the most CO2 contributing sectors (building stock, mobility, and public lighting).
  • City diagnosis in decarbonisation terms (DIAGNOSE—Step 3 from [4]); identifying the key local strengths and weaknesses, as well as the main opportunities and threats, for the future, integrating spatial quantitative and qualitative data in the development of such city diagnosis.
  • Generation of future scenarios and consensus on city visioning (ENVISION—Step 4 from [4]); generating urban energy models to study and discuss the future implications of present decisions.
  • Strategic planning (PLAN CITY LEVEL—Step 5 from [4]); enriching with spatial and quantitative data the impacts forecasted for the actions to be developed, described in the current plans.
  • Follow-up, assessment, review, and potential up-scale of actions and plans developed in the city (ASSESS; VALIDATE; UP-SCALE—Steps 14, 15 and 16 from [4]); ensuring a close commissioning and post-intervention development, exploring potential replication of successful actions in other areas of the city.

2.2.3. Urban Energy Planning Tools

IEA-EBC’s Annex 63 also claims for data certainty, which will reinforce improved decision-making, as well as the public acceptance of those urban energy planning decisions. In this sense, Planning and Decision Support Systems (PDSS) are encouraged to integrate spatial (GIS-based), technical, and local information to guide and support the decision-making process. Furthermore, these kinds of tools will be able to evaluate the performance of decarbonisation policies incorporating the spatial variable, following their effectiveness up at the city and regional levels [8].
In recent years, in parallel to the popularisation of energy efficiency and renewable technology integration concepts in the urban environment and the increase of distributed energy resources (DER), several software tools were developed for urban energy planning. Available review studies assess these tools [9,10,11,12,13,14,15], which present diverse approaches, functionalities, scales, and often focused on the DER aspects. In particular, Ferrari et al. [16] carried out a comprehensive review of 17 well-documented energy assessment tools at urban/district scale, classifying them according to their features (license type, user-interface, output time resolution, energy services, scale, analysis type). Among them, six tools with good usability level and user-friendly interface were identified as the most appropriate ones for energy planners: EnergyPLAN, energyPRO, HOMER, iHOGA, SIREN, WebOpt. Some of these tools, such as iHOGA and SIREN, are oriented to renewable electricity production, while other ones include also heating and cooling services, being EnergyPLAN the one that covers the widest variety of energy supply technologies. On the other hand, spatial representation features are included in energyPRO, iHOGA, and SIREN, such as geographic localisation of the case study and relations to environmental conditions (i.e., solar resource estimation based on latitude), but do not address urban geography in detail, information such as the geometric distribution of buildings and urban elements, not tapping into the potential of georeferenced information. Finally, these tools enable various grades of complexity in modelling energy projects and results’ assessment, but require gathering and manually introducing correct datasets from the case study, along with profiles selection, which is time-consuming, and, in case of wrong assumptions or poor inputs, leads to deviated energy analysis outputs and incorrect conclusions for the decision making.
After all, the digitalisation of the building sector and the spread of IoT connected devices are main attributes of smart buildings and smart cities, which lead to automatic data generation and gathering processes that energy planners should take advantage of. These urban asset data sources should be combined with complementary sources under Open Data initiatives for a holistic analysis (i.e., Copernicus [17]; governmental open data initiatives [18]).
Along with this, an urban decarbonisation tool should exploit real data from smart devices, which, combined with georeferenced information of the sources, loads and decarbonisation targets, and additional data sources should be processed for an integrated and georeferenced urban energy analysis, enriching an assessed decision-making.

3. Results

Following the workflow described in Section 2, Results presents the requisites and functionalities from a DSS perspective that must be regarded in the generation of a tool able to support strategic city decarbonisation processes.

3.1. ENER-BI DSS for Urban Decarbonisation Planning: Main Requisites

In terms of requisites for ENER-BI DSS, the aforementioned tests from different sources allow to distil those requisites according to the following sections:

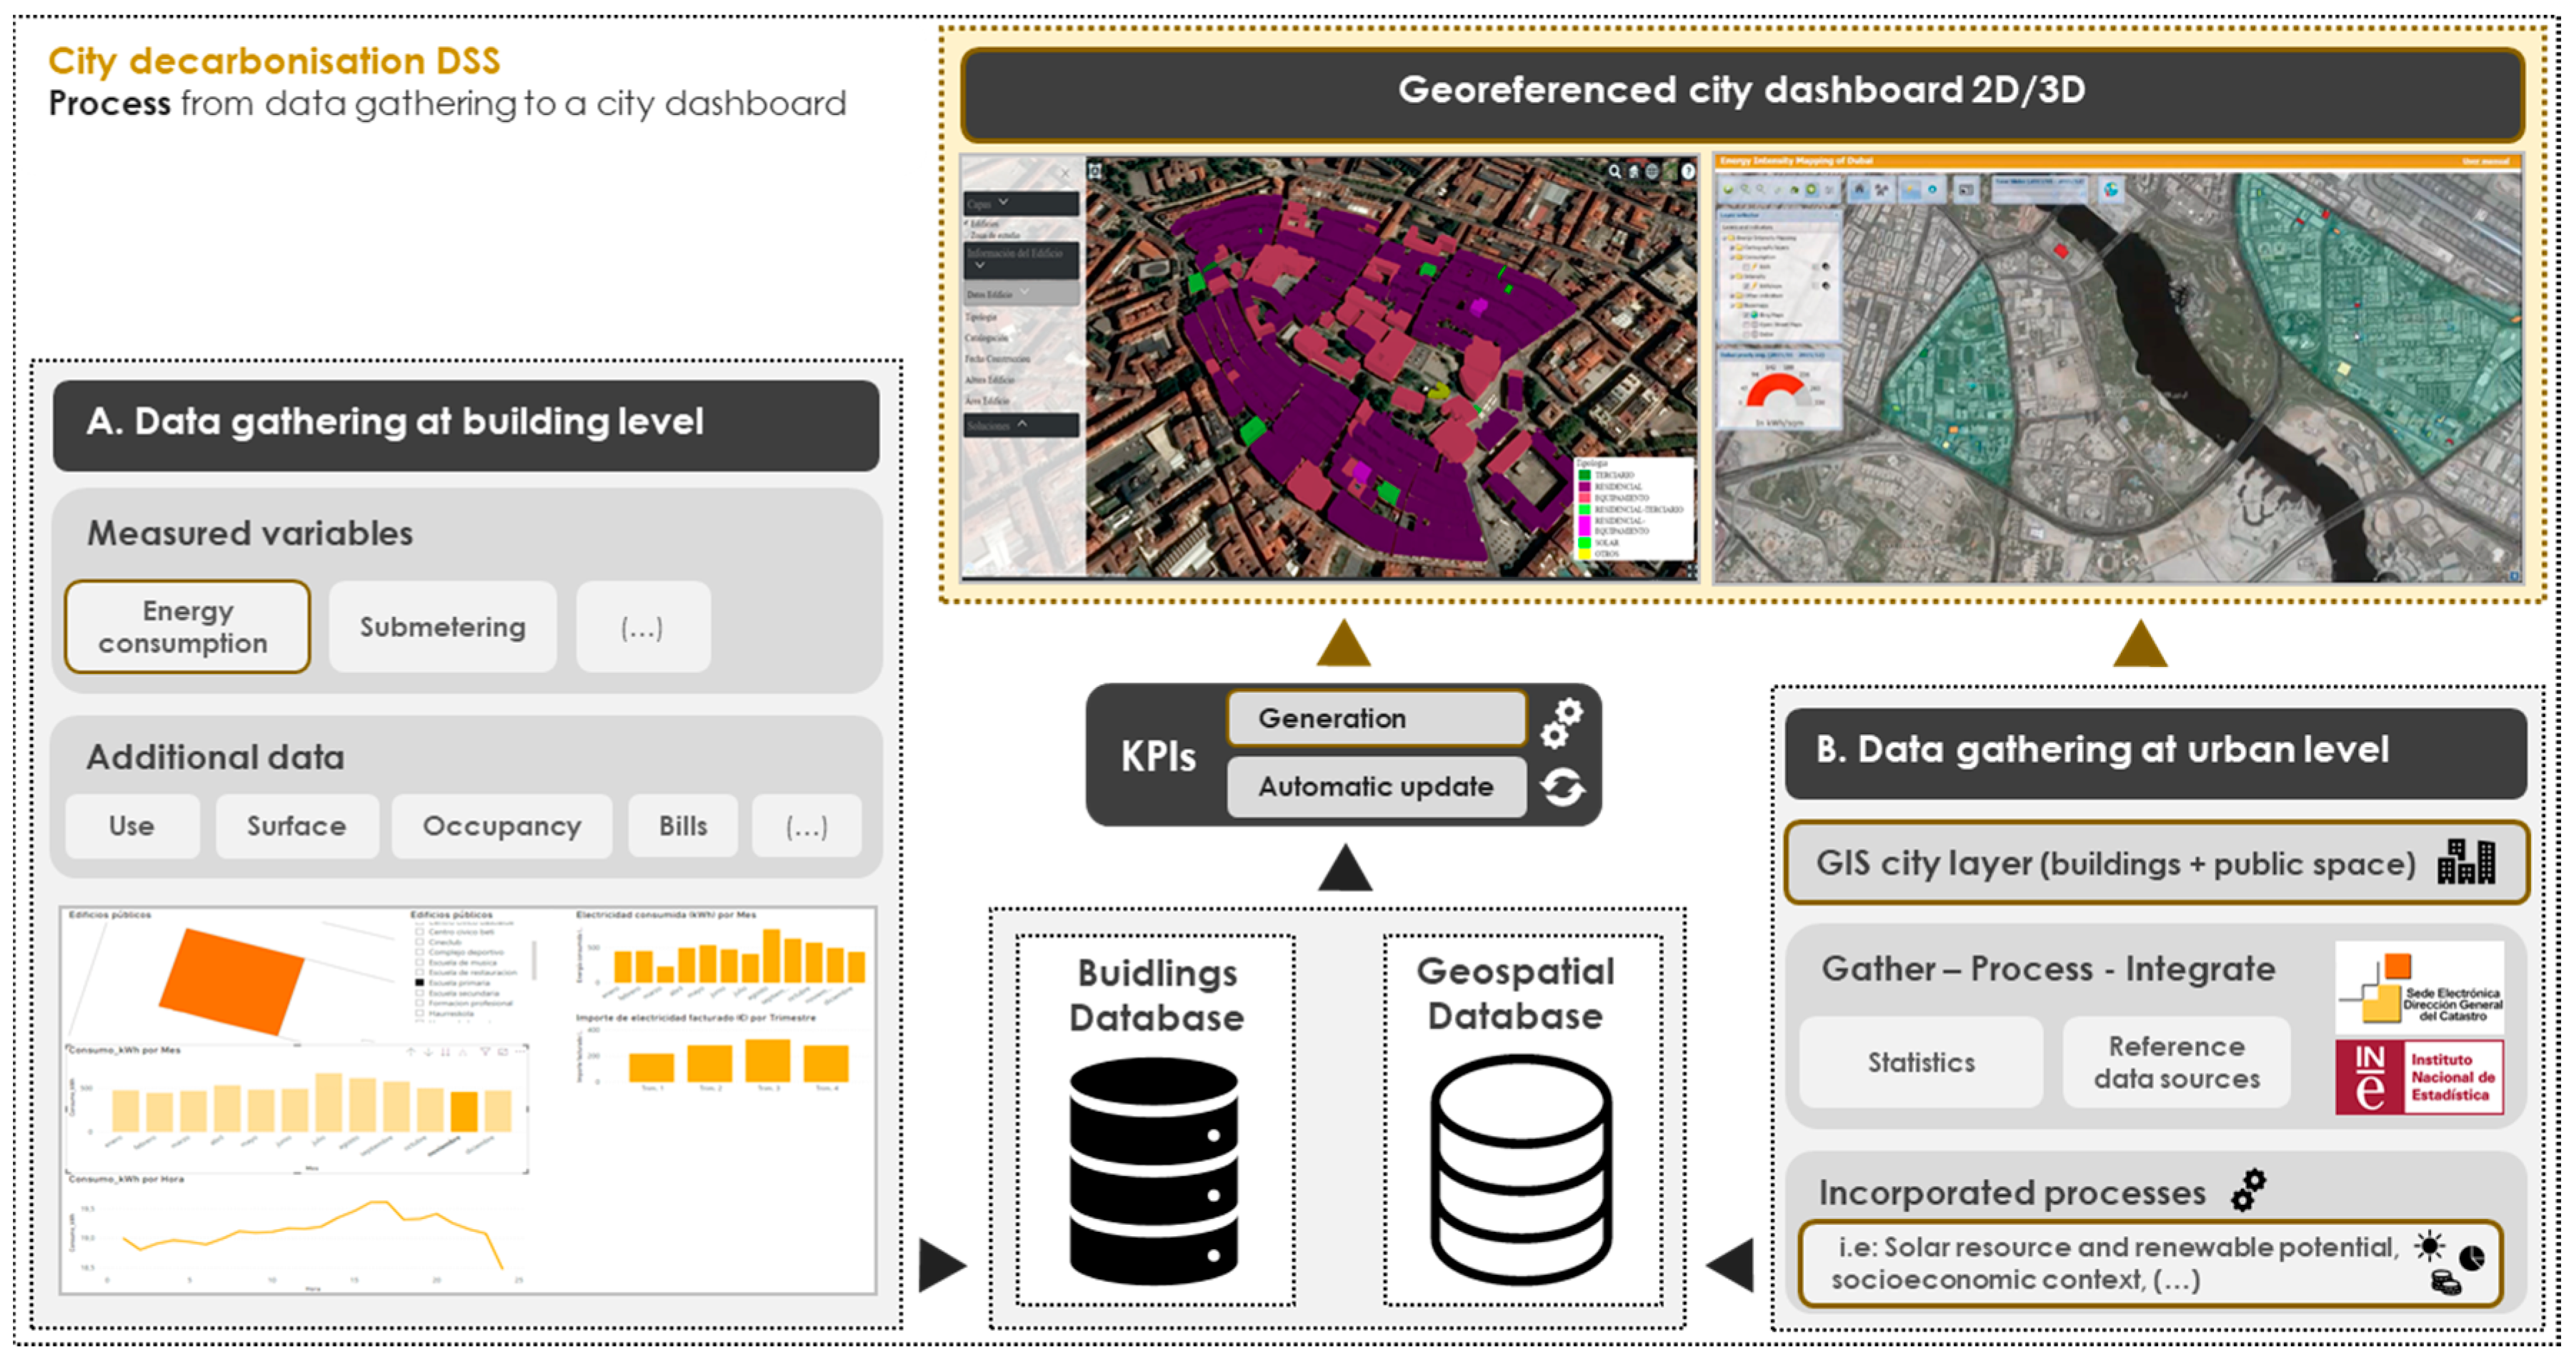
3.1.1. Information-Gathering as Input for ENER-BI DSS

The information is divided into two subsections; information needed by the decarbonisation target (Table 1), and complementary information for urban analysis that can contribute to a more integrated decision-making process by planners (Table 2). In this information-gathering process, and depending on the topic, local authorities will have to retrieve and integrate data from both public sources, often more easily accessible [19]; and private sources, which can become challenging sometimes.

3.1.2. Information Storage

Regarding the information gathered, ENER-BI DSS combines different kinds of information; static, dynamic, and georeferenced; and consequently, diverse formats of information (.csv, .shp, .gml, etc.).

Static Information

It consists of information that is not going to change over time. It includes the georeferenced structural information, as well as the semantic one for characterisation. The elements that are going to be part of this set of information are public buildings and facilities, private buildings, and public lightning furniture. For instance, metadata for building characterisation includes cadastral data, typology, number of floors, area, use, height, number of dwellings, roof type, heating system, etc. For lightning, the metadata associated entails features, such as the type of lights, height, support, power, life expectancy or lumens.
The selected information allows creating a 3D City Model that will be stored following the Open Geospatial Consortium (OGC) CityGML standard data model [22]. Once created, these data model will then be included in a 3D City Database. A correctly georeferenced model is crucial, as many of the indicator results rely on the localisation of the assets on the field.
Finally, access to the city model can be enabled by publishing the data through a Degree Server. This server must implement the OGC Standards, such as Web Map Service (WMS), Web Feature Service (WFS), Catalogue Service (CSW), Web Coverage Service (WCS), Web Processing Service (WPS), and Web Map Tile Service (WMTS); these allow geoprocessing operations more efficiently. Furthermore, and for visualisation purposes, it is possible to directly convert the City Model (including semantic data) to KML or 3DTiles.

Dynamic Information

This information is changing over time, such as the large amount of data that will be generated by the IoT devices or sensors used to monitor the state of the area of interest at any given time, or to implement temporal series; e.g., building energy consumptions.
To store dynamic information, it is essential to use a database designed to handle this kind of data. In this case, InfluxDB would be appropriate as it is designed and optimized to store time series and manage them efficiently. The access and manipulation of these data can be done through the InfluxDB API (Application Programming Interface); InfluxDB can connect with sensors, through the API, and store their data. However, in most cases, a pre-processing task is needed to adapt raw data to final users’ needs. Furthermore, a module for data treatment should be implemented in Influx to perform operations, such as applying filters, formatting, changing units or calculating data aggregations, before storing the data in the InfluxDB.
There is also some data that can be considered as semi-dynamic, such as some elements regarding the general context definition, or the generation of potential future scenarios. Those can be elements such as climatic zones, regional regulations, directives, energy prices, and any other associated information that would be valuable when assessing the state of an area or region, and that may change depending on the context. These data can be stored in a PostgreSQL relational database.
Furthermore, a PostgreSQL database can be deployed to store the results after the Key Performance Indicators (KPIs) calculation. That way, KPIs results would be saved into these database, avoiding the need for recalculating them during a project lifespan. In addition, a baseline can be calculated and compared with potential future scenarios, obtained as the result of applying different city solutions, which provides a significant asset for decision-makers. Another functionality could be to calculate and compare KPIs among the entire city and smaller areas, addressing different city scales.

3.1.3. Data Integration, Treatment and KPI Calculations

As presented above, there are diverse alternatives to store the information depending on its nature: structural, semantics, context-based data, and temporal data. However, all of that information must be connected and accessible by the different tools to be able to perform analyses, KPI calculations, and geoprocessing tasks. Sensor data must therefore be linked with structural information included in the 3DCity Model. This link can be established by two approaches:
  • By sharing IDs between sensor and elements (i.e., building/public lamppost); hence, the sensor detects the element is connected to via ID and vice versa.
  • By the location, the elements in the model are georeferenced, so they can be retrieved when selecting an area of interest.
All type of information stored (static and dynamic, gathered at building, and urban levels) are interpreted for the generation of meaningful KPIs (Figure 1). Some of these indicators derive directly from measured data (i.e., annual electrical consumption of a public building as the aggregation of hourly readings from a smart meter), whilst other have a hybrid measurement-model approach (i.e., CO2 emissions related to the annual electrical consumption).
Each variable and KPI requires a defined procedure on data integration and analysis across the diverse data stores and steps. In the following lines, as an additional example, how both types of KPIs can be derived from the same data source (an urban weather station) is described, in order to calculate annual solar irradiation (kWh/m2·y, integrating measured data) and the renewable electricity potential of a group of roofs if photovoltaic (PV) modules are deployed (electrical kWh/m2·y, hybrid KPI, combining measured solar resource and geospatial data with a mathematical model of a generic PV module). The steps would be:
  • Define the area of interest.
  • Set-up the scenario data.
  • Select the structural elements inside the area of interest through the WFS 3D City Model published on degree and retrieve geometric information, as well as the useful metadata, such as rooftop area, building orientation, or shading grade.
  • Get context data associated with the calculation scenario connecting to the PostgreSQL database (e.g., climatic zone, usage rate).
  • Collect sensor data using the InfluxAPI to obtain solar irradiance.
  • Process the data, with the defined procedures for each KPI, based on a service implemented specifically via REST API.
  • Return the data via service, to be loaded on a map or dashboard.

3.1.4. DSS Outputs for Decision-Makers

The requisites of data gathering, storage, treatment, and KPI calculations pursue one main goal: providing city planners with key city data to inform, support, and enable traceability of their decisions. In this case, the research team has taken the Law 4/2019 on Energy Sustainability of the Basque Community, an example of regional EU directive transposition, as a reference to show which DSS outputs decision-makers need to plan and follow cities decarbonisations up.
Within this law, outputs are condensed in three main sectors regarding energy consumption and CO2 emissions: building stock, public lighting and mobility. In the case of buildings, main outputs point at electric and thermal energy consumption (heating/cooling/domestic hot water (DHW)/lighting; preferably as a monthly aggregation) as well as its equivalence on CO2 emissions; the costs associated to that consumption (by month), and the characteristics of buildings (age, indoor area, typology, energy certification, renovation date), and installations (type, year of installation, energy source, power, efficiency). Additionally, the research team has considered relevant, in terms of energy-retrofitting planning, outputs connected to the solar resource, leveraging the collector potential of buildings rooftops, such as rooftop useful surface, PV/Solar Thermal (ST) installable capacity, PV/ST annual generation, related economic savings and investments’ payback period, and associated CO2 emissions avoided.
Regarding public lighting, the output is simpler than in the case of the buildings, targeting aggregated monthly energy consumption and its equivalence on CO2 emissions as the key output; the type of lighting spot and its efficiency are also interesting elements for planning potential renovations. Both in public lighting and buildings cases, the georeferentiation of each element is crucial for a 2D/3D analysis. Finally, in terms of mobility, the targeted output must be the overall fuel/ energy consumption of all vehicles and its equivalence on CO2 emissions depending on the fuel of each vehicle. An inventory of all public fleets and public transport vehicles is relevant for planning fleet renovations within the public sector. The monitoring of all those collective vehicles should not be a problem for public administration, as they belong to the public sector. Hence, the targeted output for the DSS is feasible; however, the same level of monitoring would be desirable for private vehicles, which is a challenge at a city level, partially solved by estimations anchored on reference terms, such as vehicles excise duties, traffic intensity on certain streets, fuel imports, average km per type of vehicle (national sources), etc.
For a comprehensive city analysis, outputs regarding complementary decarbonisation city systems, such as green infrastructures (CO2 sinks; i.e., green areas surface), waste management or water management are recommended to be included in the overall equation and the DSS outputs.

3.1.5. Representation/Visualisation

The target users of ENER-BI DSS are city managers, supporting their diagnosis, planning, and follow-up tasks within the city decarbonisation process. For this reason, it is essential to create an intuitive, attractive, simple, and user-friendly system, combining 2D and 3D georeferenced information and presenting data through interactive graphs and diagrams that can show KPIs, aggregation of elements or temporal series in a clear, concise, and understandable manner. Accordingly, a dashboard including combined functions could be the most suitable choice.

3.2. ENER-BI DSS for Urban Decarbonisation Planning: Functionalities

Once presented the leading requisites for ENER-BI DSS, this section describes the main functionalities of the tool to effectively support a city decarbonisation process.
Regarding the visualisation and use of the tool, the research team developed several tests with Power BI software (Figure 2 and Figure 3), creating a dashboard that presents the foremost information of the city. Through this software, the city team can connect to the different databases, edit, and visualize both static and dynamic data/KPIs; it is possible to aggregate elements and update the information receiving temporal series when the source files are updated, following the requisites described in Section 3.1. This software can also process and present georeferenced data, allowing the user to crosscheck different sets of data within the map of the dashboard, facilitating an integrated analysis by city planners.
Regarding the quantification of CO2 emissions reduction and energy savings, the functionalities of ENER-BI DSS have been split into three modules, according to the different needs of the city decarbonisation planning process, taking the steps of Cities4ZERO decarbonisation methodology as a reference.

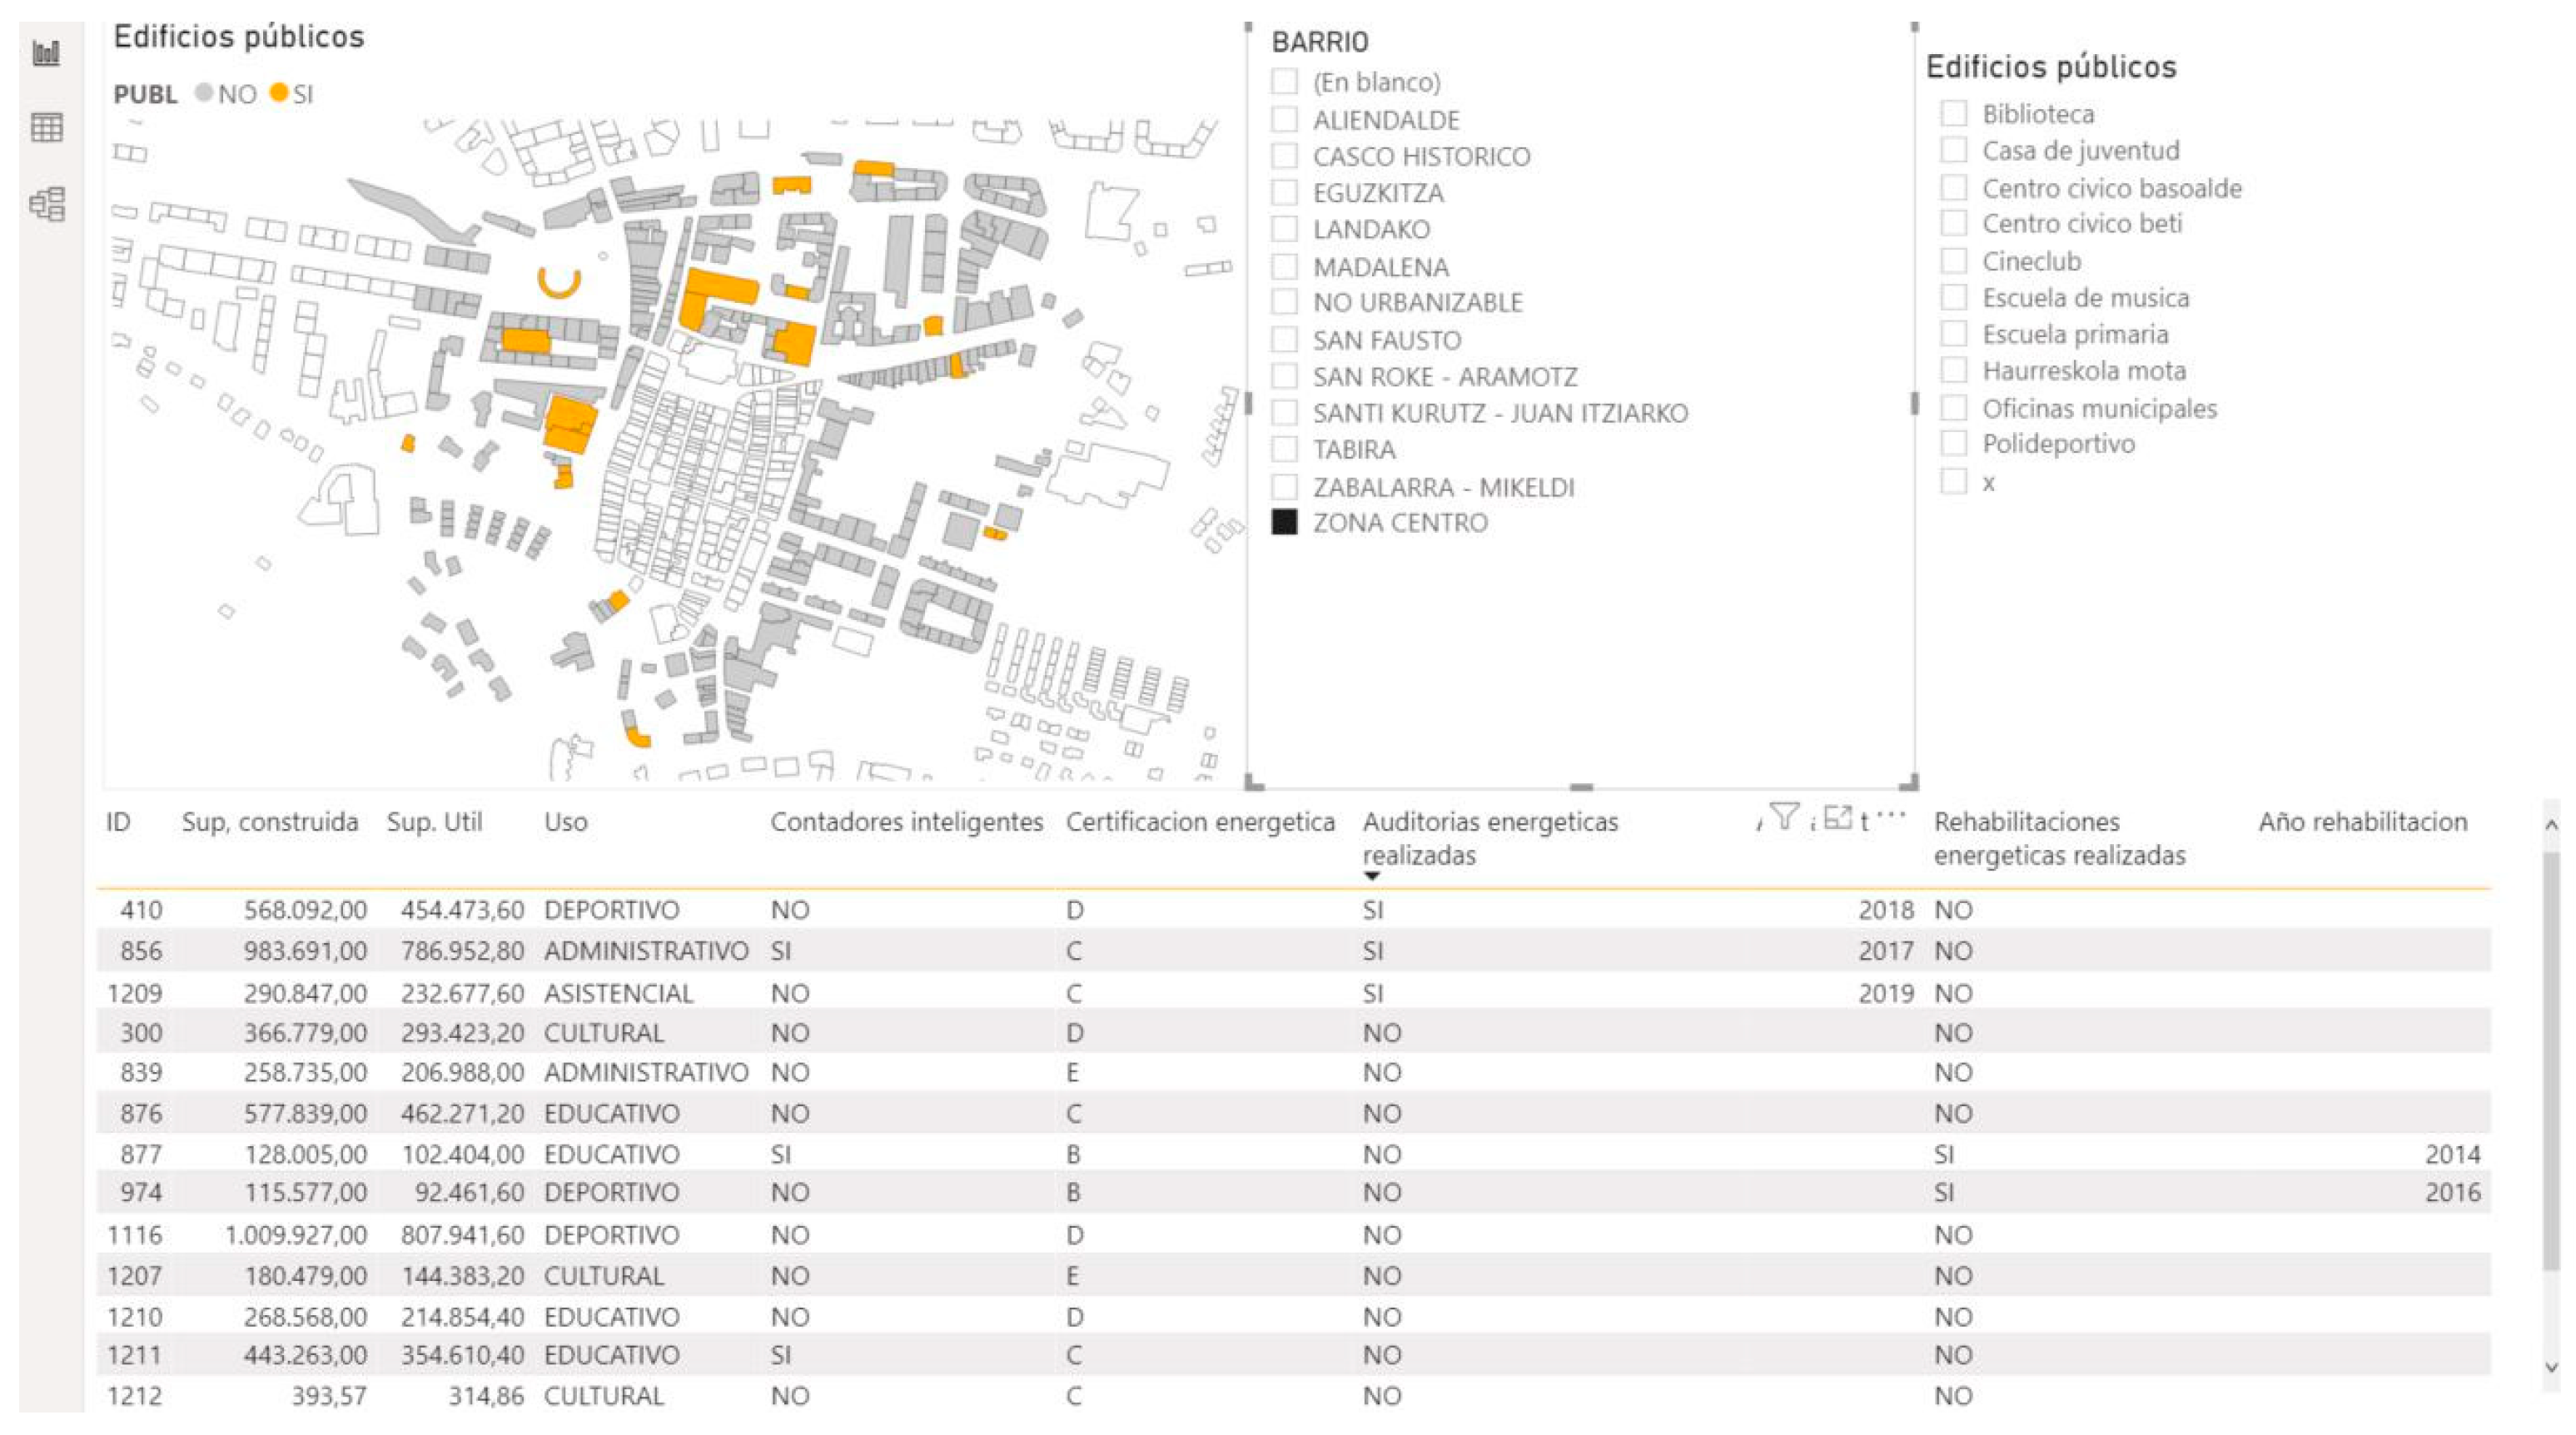
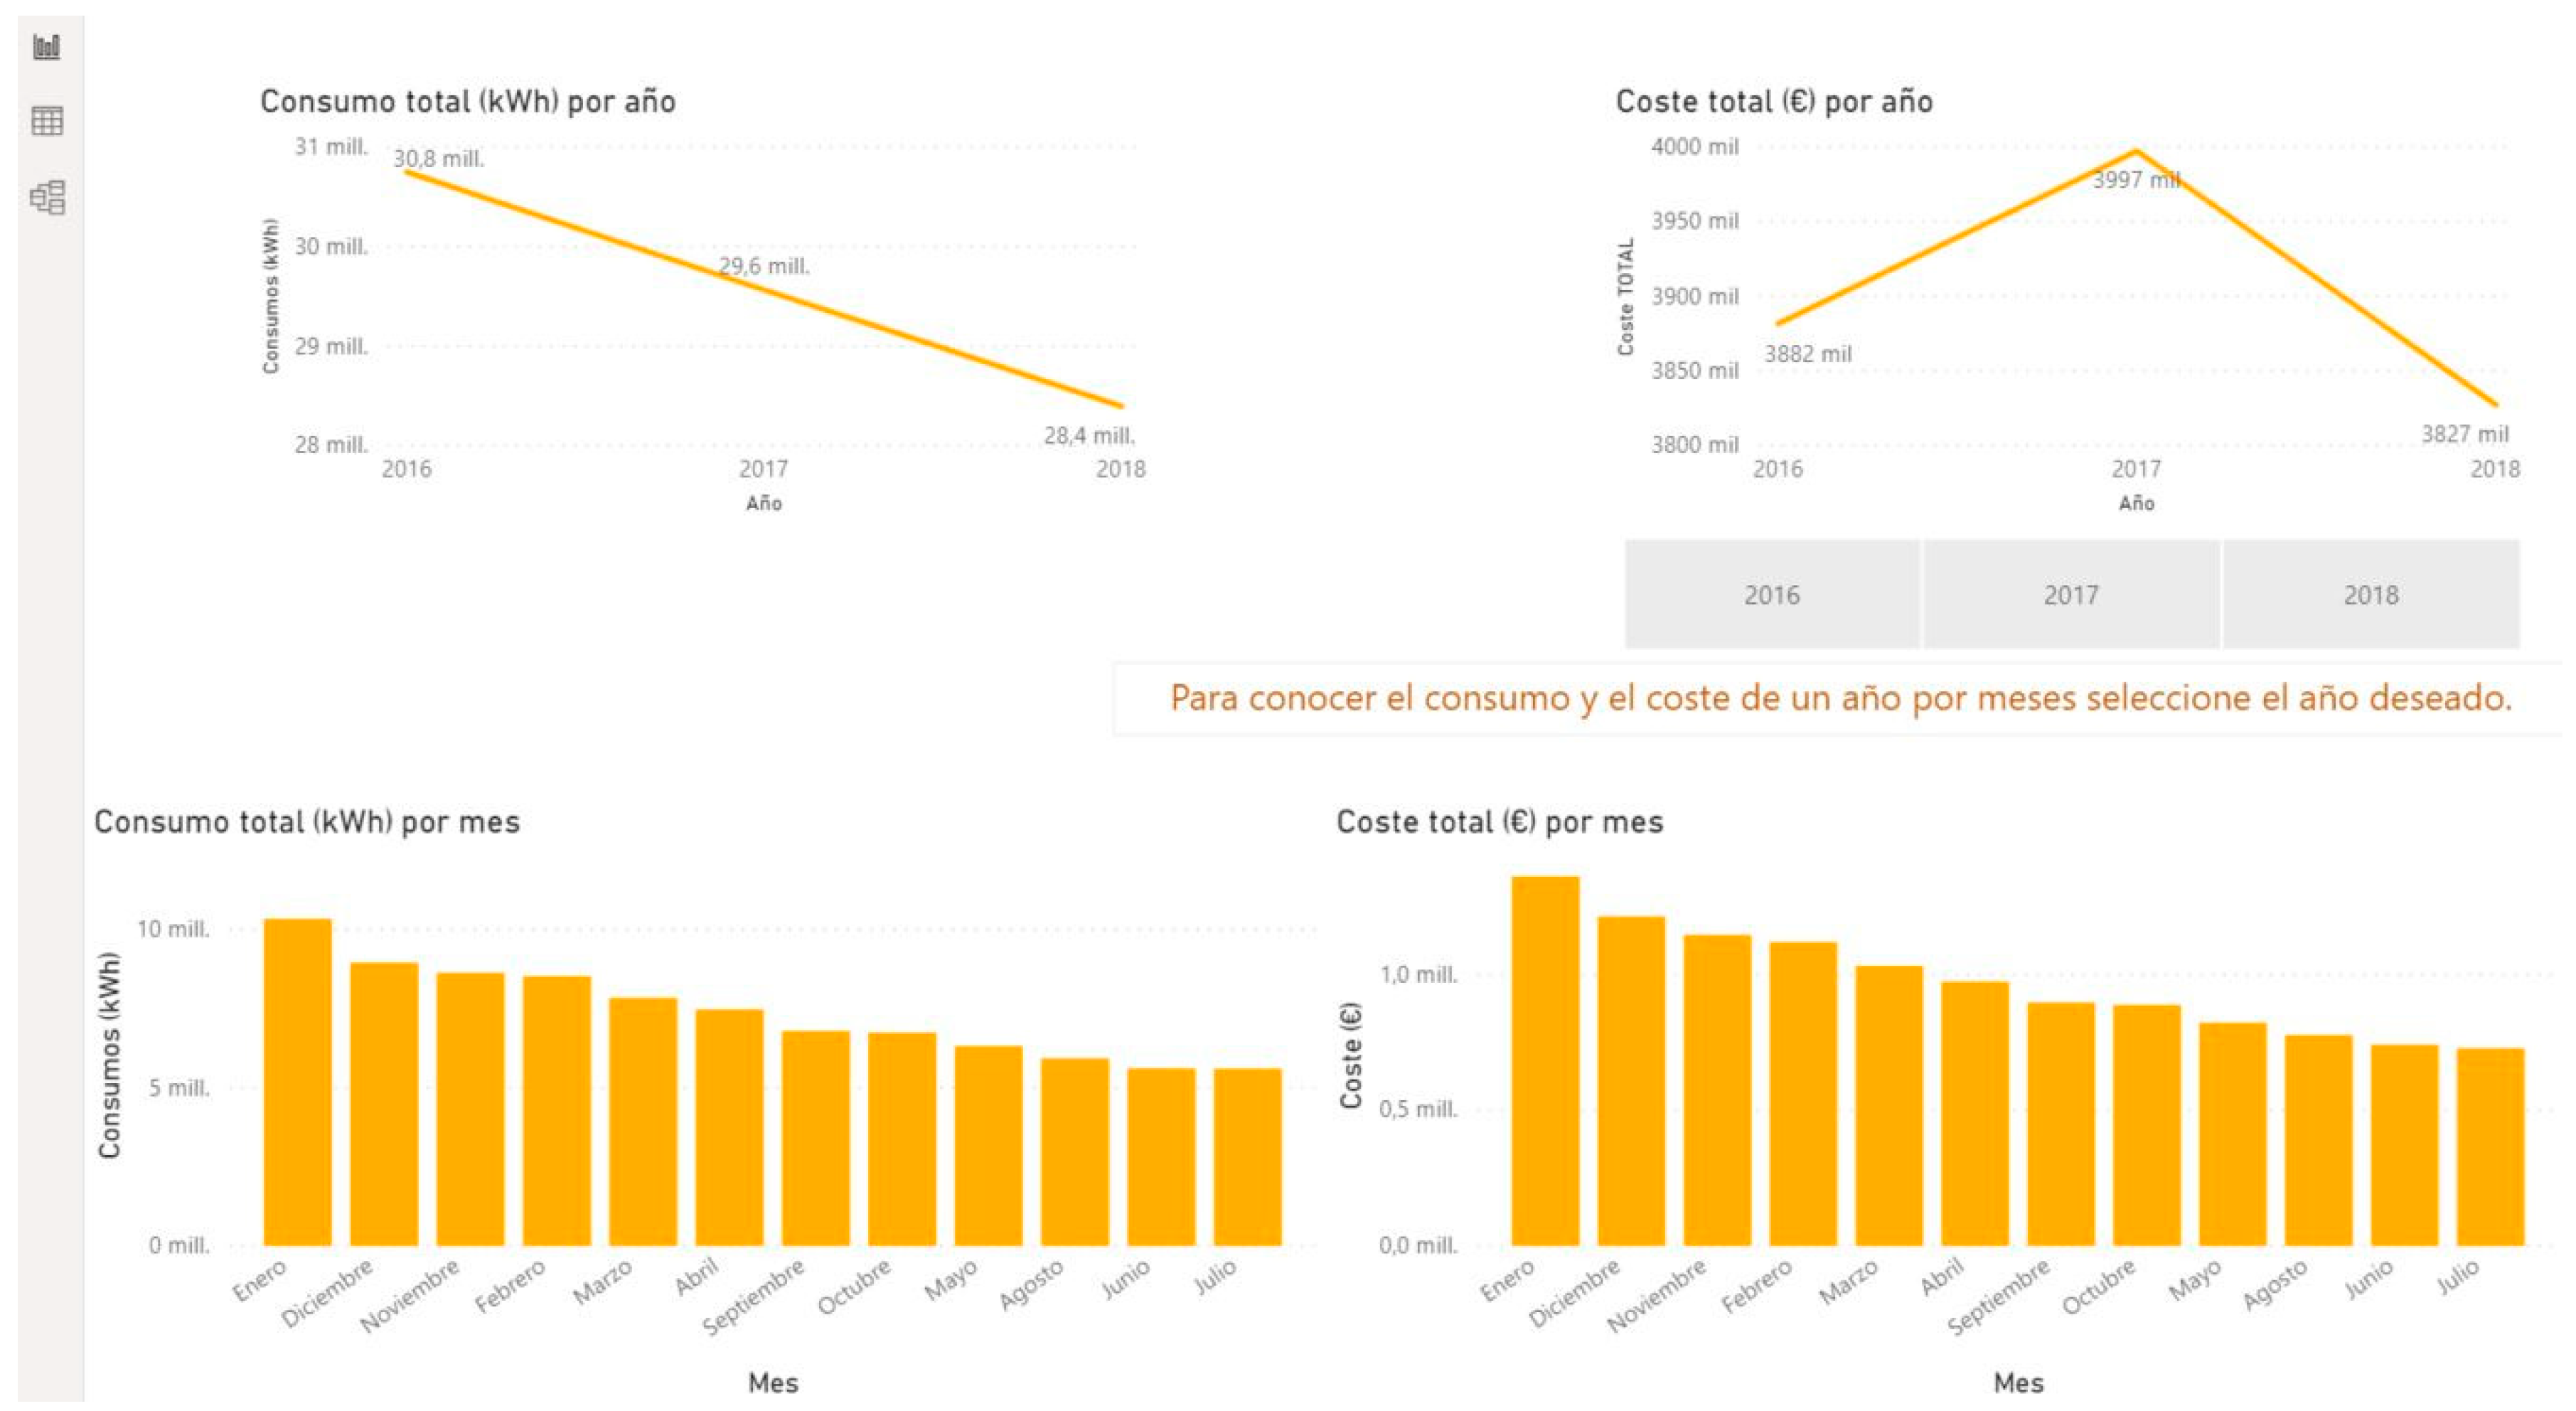
3.2.1. Module 0—Inventory, Characterisation, and Monitoring

The main objective of this module is to gather and integrate all necessary information to provide planners with effective support in the city decarbonisation process. Firstly, Module 0 entails the information gathering mechanisms to provide a comprehensive inventory of all decarbonisation targets. This inventory includes monitoring those decarbonisation targets and their elements with the suitable periodicity each element requires. The monitoring task is different from element-to-element; some need to import data from existing sources (i.e., cadaster); others bring remote data from sensors; others retrieve information from electricity companies’ devices; others need to be monitored by planners (i.e., audits and studies). Here the objective is to develop this inventory as automatically as possible; the research team explored ways to facilitate a regular automatic update of each element without the intervention of a practitioner, who would have to update it manually, so city planners can be as autonomous as possible in the use of ENER-BI DSS. Table 3 shows the main elements gathered, monitored, and integrated into the PowerBI dashboard.
Through this inventory supported by ENER-BI DSS, planners will be able to perform a quantitative city characterisation regarding the main decarbonisation targets (Public Lighting example on Figure 3), corresponding to Step 2 (ANALYSE) of Cities4ZERO methodology. This city characterisation has to include the aforementioned inventory, which will be the base to create a CO2 emissions baseline, and which can be complemented by a qualitative analysis, providing a more comprehensive understanding of the city status: a literature review on a city level (existing policies, regulations, strategies and plans), semi-structured interviews with sectorial experts (energy, building stock, mobility, public space, Information and Communication Technologies (ICTs), engagement, waste, water, etc.), and surveys on citizens perception.

3.2.2. Module 1—Scenarios Generation for Decarbonisation Planning

This module intends to support a diagnosis of the inventory developed in Module 0, both in technical and socioeconomic terms, before generating future potential decarbonisation scenarios. This module seeks to standardize and automatize the calculation processes of algorithms applied in urban energy-retrofitting, public lighting and mobility projects by the research team, now integrated as a part of ENER-BI DSS (Table 4). Through the embedded algorithms, the DSS can calculate CO2 emissions reductions, as a result of implementing a set of projects and strategies in the city including, for instance, an increase on local renewable energy production.
Through the possibility of calculating the impact of potential future projects and strategies, ENER-BI DSS can support the generation of future scenarios. To determine the impact and progressive implementation of such initiatives, the DSS must estimate what the trends are and the quantitative references of each city system for the following years, so specific projections can be addressed to each initiative (i.e., electric vehicle penetration rate per year; public/private building stock retrofitting rate per year). In this line, city planners will have to set a level of ambition according to the city decarbonisation targets, being aware of what is doable, according to their baseline, context, and resources.
In this sense, Cities4ZERO methodology suggests the co-generation of future scenarios (in Step 4 of [4]; ENVISION), engaging key local stakeholders, specifically incorporating to the debate those with the key city competences, who will be potentially involved in the implementation of the actions of the decarbonisation plan. The support of ENER-BI DSS to complement the envisioning co-generation workshops with quantitative data will upgrade the debate, showing participants, which would be the potential future consequences of present decisions in each city system. Through this debate, local stakeholders will be able to reach consensus on a “master scenario” for 2030/2050 and will be able to participate in the design of the actions included in the roadmap 2030/2050 to achieve that scenario (Step 5 of [4]; PLANCity Level), envisioning the city of the future and jointly planning the pathway towards it.

3.2.3. Module 2—Decarbonisation Follow Up

Once city planners achieve a “master scenario” and develop an Action Plan towards decarbonisation, ENER-BI DSS must support the fulfilment of that plan, setting a follow-up framework that enables the fulfilment of the actions in the coming years. Furthermore, that framework must allow the quantitative review of the actions, as well as for deciding corrective mechanisms, if necessary. Accordingly, this module must incorporate follow-up KPIs addressing each decarbonisation target, and even the specific initiatives of the Action Plan too. Once decided all KPIs to be included, ENER-BI DSS must allow studying that data over time, hence, showing the historical evolution of those KPIs over months/years (steps 12–16 within the Intervention and Assessment Stage of Cities 4ZERO methodology [4]).
In this sense, Module 2 is supported by Modules 0 and 1:
  • The automatization of the updating process of the inventory of Module 0 is a significant asset within this follow-up process of Module 2, as it always provides city planners with updated information.
  • If corrective mechanisms are needed over time, the calculation processes of Module 1 for generating scenarios are also valid in the follow-up process, recalculating the potential impact of those corrections.
An additional feature of this module can be the link between the DSS and the digitalization of some city procedures (e.g., building permits/licenses), which would provide the DSS with some valuable skills for city planners’ daily tasks, becoming a transversal software within planning departments. However, the research team has not explored this possibility.
Overall, these three modules provide rigorous quantitative data within decarbonisation planning, which can additionally fulfil transparency requisites of public administrations, enabling fair and understandable sets of data, which can be publicly presented to the citizenship for an informative and engaging decarbonisation local process.

4. Discussion

Overall, ENER-BI DSS supports decarbonisation planning through an automatic update of real data collected by sensors; automatizes calculation processes connected to decarbonisation planning and urban analysis; and provides georeferenced data of elements to be decarbonised, a key aspect for an integrated urban energy analysis.
From a city planning perspective, ENER-BI fosters the practical integration of energy and urban planning processes as defined by the Cities4ZERO methodology, helping to overcome traditional siloed approaches to energy planning that have been applied in, for instance, Sustainable Energy Action Plans (SEAP)/ Sustainable Energy and Climate Action Plans (SECAP) processes in the framework of the Covenant of Mayors. In this sense, it provides a data-led approach to the complex process of decision-making for urban decarbonisation planning, where several competing interests exist, and where different stakeholders are engaged at different levels and moments of the process (politicians, civil servants with technical responsibilities, private energy companies, building owners, and the civil society at broad).
In addition, ENER-BI has a balanced level of detail on the energy assessing and modelling aspects that enable decision making at urban/district level. After that, dedicated energy project-oriented planning tools can be used for a detailed scenario or intervention design. Authors have followed a similar methodology on [24], where energy efficiency and socio-economic vulnerability in districts were assessed through GIS, building data and model-based KPIs, and once the retrofitting needs were identified and prioritized, the intervention in a selected neighbourhood was designed through EnergyPLAN; ENER-BI can therefore be complementary of project-oriented tools. Furthermore, ENER-BI fills the gap in the decision-making chain between those project-oriented tools, which go directly on the technical details of engineering preliminary projects that do not address the urban dimension, and the current urban planning paradigm, where decisions affecting energy planning are usually based on non-georeferenced static analysis.
ENER-BI is the result of the integration of several steps needed along the decarbonisation planning process at a local level: baseline definition, diagnosis, strategic planning, evaluation of the implementation, etc. Each of the modules can be adapted and refined separately and linked back to the DSS. This modular approach gives ENER-BI DSS the needed flexibility to be useful in different places since the planning process is very context-sensitive: it heavily relies on the local/regional regulation, competencies distribution, governance model, data gathering and availability, etc. Therefore, ENER-BI offers a systematic approach to the process, based on a sound planning methodology (Cities4ZERO) that can be tailored to the specific context.
However, in the process of developing the tool, several limitations have been detected. The main barrier regarding data gathering is the lack of information about one energy-intensive sector, such as private mobility. In terms of functionalities definition, the tool was designed to fulfil the specific requirements for municipalities of the Basque Region’s Law on Energy Sustainability; this law aims to transpose the European Directives related to the “Clean Energy for all Europeans”, and as such, it is conceptually aligned with it. However, it does not cover all of the aspects covered by such directives, being mainly focused on public action at a local level.
Once the conceptual design of the tool has been defined, future research should focus on testing it in a real-case environment, as a support tool for the implementation of the Cities4ZERO methodology in a city. In this process, it is to be expected that several barriers will be encountered when actually integrating information sources. Moreover, further research will be needed to gather essential information such as energy consumed by private vehicles, beyond the current consumption and emissions’ estimates. In this sense, and after this first approach (buildings/mobility/public lighting), any additional urban information that can affect the development of a city decarbonisation plan must be incorporated (i.e., energy network’s distribution typology; bike paths and pedestrian areas; waste-to-energy potential; etc.). Moreover, once the tool has been refined, further work will be needed in order to develop a commercial, user-friendly, and intuitive interface to facilitate its wider use.
Finally, and regarding the current EU Green Deal and COVID-19 recovery fund framework, municipalities expect significant resources to be allocated to climate mitigation and adaptation projects during next years. Accordingly, municipalities need georeferenced quantitative support on this, so they can effectively draft strategies, plan actions, prioritize their implementation and monitor their performance, in the most meaningful and rigorous manner, for the broader benefit of local communities. If these investments are not perceived by citizens and institutions as appropriately appointed and executed, the perception on society’s capacity to cope with climate change will suffer a severe dent; this is a window of opportunity that Europe cannot squander.

Author Contributions

Conceptualization, K.U.-A., E.U.-F., P.M.-C., P.D.A.-C., and M.B.-B.; methodology, E.U.-F., K.U.-A., and P.D.A.-C.; software, E.U.-F. and M.B.-B.; validation, E.U.-F., P.D.A.-C., M.B.-B., and K.U.-A.; investigation, E.U.-F., P.D.A.-C., M.B.-B., and K.U.-A.; data curation, E.U.-F. and M.B.-B.; writing—original draft preparation, K.U.-A., E.U.-F., P.M.-C., P.D.A.-C., M.B.-B.; writing—review and editing, K.U.-A., E.U.-F., P.M.-C., P.D.A.-C., M.B.-B., I.F.-A.; visualisation, E.U.-F.; supervision, P.M.-C. and I.F.-A.; project administration, E.U.-F. and P.M.-C.; funding acquisition, K.U.-A. and E.U.-F. All authors have read and agreed to the published version of the manuscript.

Funding

This research was funded by European Commission, grant number 691883.

Acknowledgments

Deep thanks to the European Commission for funding SmartEnCity project, the frame of this research, and to the Basque Government for its significant support to the Basque research and innovation paradigm.

Conflicts of Interest

The authors declare no conflict of interest. The funders had no role in the design of the study; in the collection, analyses, or interpretation of data; in the writing of the manuscript, or in the decision to publish the results.

References

  1. Angel, S.; Parent, J.; Civco, D.; Blei, A.; Potere, D.T. A Planet of Cities: Urban Land Cover Estimates and Projections for All Countries, 2000–2050; no. November 2014; Lincoln Institute of Land Policy: Cambridge, MA, USA, 2010; pp. 2000–2050. [Google Scholar]
  2. World Health Organization. 9 out of 10 People Worldwide Breathe Polluted Air. 2018. Available online: https://www.who.int/news-room/detail/02-05-2018-9-out-of-10-people-worldwide-breathe-polluted-air-but-more-countries-are-taking-action (accessed on 9 March 2020).
  3. Lelieveld, J.; Klingmüller, K.; Pozzer, A.; Pöschl, U.; Fnais, M.; Daiber, A.; Münzel, T. Cardiovascular disease burden from ambient air pollution in Europe reassessed using novel hazard ratio functions. Eur. Heart J. 2019, 40, 1590–1596. [Google Scholar] [CrossRef] [PubMed] [Green Version]
  4. Urrutia-Azcona, K.; Tatar, M.; Molina-Costa, P.; Flores-Abascal, I. Cities4ZERO: Overcoming Carbon Lock-in in Municipalities through Smart Urban Transformation Processes. Sustainability 2020, 12, 3590. [Google Scholar] [CrossRef]
  5. Urrutia-Azcona, K.; Sorensen, S.; Molina-Costa, P.; Flores-Abascal, I. Smart Zero Carbon City: Key Factors Towards Smart Urban Decarbonisation. DYNA 2019, 94, 676–683. [Google Scholar] [CrossRef] [Green Version]
  6. Molina-Costa, P.; Arana, M.; Jimenez, C. Integrating Smart City projects into Urban Planning Processes. In Proceedings of the 6th European Conference on Energy Efficiency and Sustainability in Architecture and Planning, San Sebastián, Spain, 29 June–1 July 2015. [Google Scholar]
  7. Basque Government. Law 4/2019 on Energy Sustainability of the Basque Communit; BOPV no 42, 28-Feb-2019; Basque Government: Vitoria-Gasteiz, Spain, 2019.
  8. Strasser, H.; Kimman, J.; Koch, A.; Tinkhof, O.M.A.; Müller, D.; Schiefelbein, J.; Slotterback, C. IEA EBC annex 63—Implementation of energy strategies in communities. Energy Build. 2018, 158, 123–134. [Google Scholar] [CrossRef]
  9. Oregi, X.; Roth, E.; Alsema, E.; Van Ginkel, M.; Struik, D. Use of ICT Tools for Integration of Energy in Urban Planning Projects. Energy Procedia 2015, 83, 157–166. [Google Scholar] [CrossRef] [Green Version]
  10. Ferrando, M.; Causone, F.; Hong, T.; Chen, Y. Urban building energy modeling (UBEM) tools: A state-of-the-art review of bottom-up physics-based approaches. Sustain. Cities Soc. 2020, 62, 102408. [Google Scholar] [CrossRef]
  11. Sola, A.; Corchero, C.; Salom, J.; Sanmarti, M. Multi-domain urban-scale energy modelling tools: A review. Sustain. Cities Soc. 2020, 54, 101872. [Google Scholar] [CrossRef]
  12. Moghadam, S.T.; Delmastro, C.; Corgnati, S.P.; Lombardi, P. Urban energy planning procedure for sustainable development in the built environment: A review of available spatial approaches. J. Clean. Prod. 2017, 165, 811–827. [Google Scholar] [CrossRef]
  13. Tozzi, P.; Jo, J.H. A comparative analysis of renewable energy simulation tools: Performance simulation model vs. system optimization. Renew. Sustain. Energy Rev. 2017, 80, 390–398. [Google Scholar] [CrossRef]
  14. Markovic, D.; Cvetkovic, D.; Masic, B. Survey of software tools for energy efficiency in a community. Renew. Sustain. Energy Rev. 2011, 15, 4897–4903. [Google Scholar] [CrossRef]
  15. Manfren, M.; Caputo, P.; Costa, G. Paradigm shift in urban energy systems through distributed generation: Methods and models. Appl. Energy 2011, 88, 1032–1048. [Google Scholar] [CrossRef]
  16. Ferrari, S.; Zagarella, F.; Caputo, P.; Bonomolo, M. Assessment of tools for urban energy planning. Energy 2019, 176, 544–551. [Google Scholar] [CrossRef]
  17. European Commission. Copernicus. Europe’s Eyes on Earth. 2020. Available online: https://www.copernicus.eu/en (accessed on 16 October 2020).
  18. Spanish Ministry of Economy and Digital Transformation. Open Data Initative from Spanish Government. 2020. Available online: https://datos.gob.es/ (accessed on 20 October 2020).
  19. Urrutia, K.; Fontán, L.; Díez, F.J.; Rodíguez, F.; Vicente, J. Smart Zero Carbon City Readiness Level: Indicator System for City Diagnosis in the Basque Country moving towards Decarbonization. DYNA 2018, 94, 332–338. [Google Scholar]
  20. de Cos Guerra, O.; Usobiaga, E.F. Retos metodológicos para estudiar la vulnerabilidad demográfica y residencial a nivel intraurbano ante los cambios en las fuentes estadísticas habituales. Scr. Nova Rev. Electrónica Geogr. Ciencias Soc. 2019, 23. [Google Scholar] [CrossRef]
  21. Mateos, R.S.; Urra, S.; Rodríguez, F.; Usobiaga, E.; Garmendia, L. Methodology of diagnosis in the district of Coronation for the transformation of the neighborhood in zero co2 in the context of smartencity project. In Proceedings of the 7th European Conference on Energy Efficiency and Sustainability in Architecture and Planning, San Sebastián, Spain, 4–6 July 2016; p. 14. [Google Scholar]
  22. OGC. Open Geospatial Consortium Standards. 2020. Available online: https://www.ogc.org/standards/citygml#:~:text=CityGML (accessed on 12 October 2020).
  23. Prieto, I.; Izkara, J.L.; Usobiaga, E. The Application of LiDAR Data for the Solar Potential Analysis Based on Urban 3D Model. Remote Sens. 2019, 11, 2348. [Google Scholar] [CrossRef] [Green Version]
  24. Eguiarte-Fernández, O.; de Agustin-Camacho, P.; Uriarte, A.; Usobiaga, E. Energy transition towards sustainable districts through renewable energy nodes. In Proceedings of the 10th European Conference on Energy Efficiency and Sustainability in Architecture and Planning, Vitoria-Gasteiz, Spain, 11–12 September 2019; pp. 251–264. [Google Scholar]
Figure 1. Information flow: from data gathering at building/city levels to a city dashboard.
Sustainability 13 00383 g001
Figure 2. Example of PowerBI city dashboard; public buildings analysis in a Basque urban area (Spain).
Sustainability 13 00383 g002
Figure 3. Example of PowerBI city dashboard; summary of Vitoria-Gasteiz (Spain) public lighting inventory; years 2016–2018.
Sustainability 13 00383 g003
Table 1. Information needed by decarbonisation target.
Decarbonisation TargetInformationDisaggregation DegreeFormatPeriodicity
Public buildingsBuilding characteristics (i.e., age, indoor area, typology, energy certification)BuildingGeoreferenced databaseYearly, at least
Electricity consumptionElectricity meter/supply point.txt, .csv or databaseMonthly/hourly 1
Gas consumptionGas meter/supply point .txt, .csv or databaseMonthly
Other energy carriers’ consumption (i.e., District Heating)Meter/supply point .txt, .csv or databaseMonthly
Public facilitiesElectricity consumptionElectricity meter/supply point.txt, .csv or databaseMonthly/hourly 1
Public lightingElectricity consumptionLamppost/ node of lampposts.txt, .csv or databaseMonthly
Public transport
and fleets
Fuel consumption and KmsVehicle by type of fuel.csv or databaseMonthly
Private buildingsGeometry of buildingsBuildingGeoreferenced (.shp, .gml, etc.)Yearly
Characteristics: use, no. of floors and dwellings, effective m2, year of construction, inhabitantsBuildingGeoreferenced databaseYearly, at least
1 Increase of smart electricity meters allow to gather hourly data, which can be of interest for specific scenarios analysis (i.e., photovoltaic (PV) self-consumption promotion, demand aggregation).
Table 2. Complementary information for urban analysis.
TopicInformationDisaggregation DegreeFormatPeriodicity
Ageing population% Population >79 years [20]Census trackGeoreferenced (.shp)Annually
Socio-economic deprivation% low-income population Census trackGeoreferenced (.shp)Annually
UnemploymentUnemployment rateCensus trackGeoreferenced (.shp)Annually
Living conditions [21]Average of occupants per dwellingCensus trackGeoreferenced (.shp)Annually
% of rented dwellingsCensus trackGeoreferenced (.shp)2, 5, or 10 years (depending on the availability)
% of dwellings without heating systemCensus trackGeoreferenced (.shp)
% of dwellings with bad conservation statusCensus trackGeoreferenced (.shp)
Table 3. Elements monitored in Module 0 Inventory, characterisation, and monitoring.
Decarbonisation TargetMain Elements
Public buildingsGeoreferenced inventory and characterisation (geometry and characteristics of public building stock)
Energy consumption (monitoring)
Energy audits (study results)
Private buildingsGeoreferenced inventory and characterisation (geometry and characteristics of private building stock)
Public lightingGeoreferenced inventory
Energy consumption (monitoring)
Energy audits (study results)
MobilityPublic fuel consumption (monitoring of public transport and fleets)
Private mobility (studies and estimations)
Active mobility (study results)
Socio-economic/socio-demographic
(urban analysis)
Vulnerability (index monitoring)
Table 4. Automatized/semi-automatized calculation processes embedded in Module 1.
Decarbonisation TargetCalculation Processes
Public buildings
  • Solar potential on rooftops and Renewable Energy Sources (RES) penetration scenarios [23]
  • Viability of energy nodes (local renewable production feeding adjacent buildings) [24]
Private buildings
  • Energy consumption and CO2 emissions
  • Upgrade potential after energy-retrofitting
  • Solar potential in rooftops and RES penetration scenarios
  • Demand aggregation and synergies (depending on final energy use)
Public lighting
  • Efficiency improvement of public lighting
Mobility
  • Vehicle replacement (public fleets and public transport)
  • CO2 reduction from private vehicles use decrease
  • Progressive increase of electric energy demand (e-charging points)
Socioeconomic
  • Socioeconomic viability of generated scenarios
Publisher’s Note: MDPI stays neutral with regard to jurisdictional claims in published maps and institutional affiliations.

