Article

Thermal Performance Assessment of Walls Made of Three Types of Sustainable Concrete Blocks by Means of FEM and Validated through an Extensive Measurement Campaign

by
Jesús M. Blanco
1,*,
Yokasta García Frómeta
2,
Maggi Madrid
3 and
Jesús Cuadrado
3
1
Energy Engineering Department, School of Engineering, Building I, University of the Basque Country, UPV/EHU, Plaza Ingeniero Torres Quevedo s/n, 48013 Bilbao, Spain
2
Vicerrectoria de Investigación e Innovación, Pontificia Universidad Católica Madre y Maestra (PUCMM), Av. Abraham Lincoln esq. Av. Simón Bolívar, Santo Domingo 10109, Dominican Republic
3
Mechanical Engineering Department, School of Engineering, Building I, University of the Basque Country, UPV/EHU, Plaza Ingeniero Torres Quevedo s/n, 48013 Bilbao, Spain
*
Author to whom correspondence should be addressed.
Sustainability 2021, 13(1), 386; https://0-doi-org.brum.beds.ac.uk/10.3390/su13010386
Submission received: 22 November 2020 / Revised: 22 December 2020 / Accepted: 30 December 2020 / Published: 4 January 2021
(This article belongs to the Special Issue Sustainable Construction and Innovative Building Materials)

Abstract

:
The thermal behavior of three different walls, made with and without by-products, is assessed by means of the Finite Element Method, aiming to evaluate its performance in terms of the sustainable construction of the blocks. Results were compared to those obtained from an experimental campaign, aiming at validation of the model. The by-products used for the blocks were “lime sludge” and “sawdust”, whose performance was compared against the traditional blocks made of concrete as a reference, aiming to demonstrate its sustainability, showing decreases of the thermal transmittance up to 10.5%. Additionally, following the same methodology, the thermal behavior of these above-mentioned blocks but now with added internal insulation made of “recycled cellulose” was assessed, showing higher decreases up to 25.5%, increasing sustainability by addressing an additional reduction in waste, so the right combination of using by-products and the insulating filler in their cavities has been revealed as a promising way of optimizing the walls, offering a relevant improvement in energy savings. Finally, when comparing the U-values of the blocks made of concrete without insulation versus those made of by-products, with insulation, improvements up to 33.3% were reached. The adaptation of the procedure through a moisture correction factor was also incorporated.

1. Introduction

The continuous need to minimize energy consumption leading to designing sustainable buildings, implies that the correct evaluation of the thermal behavior of all components of the enclosure is a strict requirement [1,2]. Sustainable buildings are designed to reduce the overall impact on the environment and human health both during and after construction. This is accomplished by preserving and protecting the natural resources around the project site. Since it is not practical to experimentally measure the thermal properties of all the components and construction systems, it is advisable to use advanced and accurate methods to reliably predict their thermal performance [3]. From reducing carbon footprints by using renewable energy, using on-site water treatment plants to minimize waste, to recycling and building with renewable or waste materials, like bricks, there are still many ways in which sustainability of the building construction can be improved [4].
These methods allow designers to estimate the energy consumptions associated with all types of construction systems, e.g., masonry [5,6]. It allows us to select the most appropriate systems that will provide an efficient and sustainable design reducing this way the building’s Heating Ventilation and Air Conditioning (HVAC) loads. By designing a sustainable building method, the use of energy, water, land, and raw materials must be minimized, reducing emissions, pollution, waste and also the running costs of any building [7]. A sustainable construction should be energy efficient and cheaper to run, durable, and made of environmentally friendly materials so waste during the whole construction period should be considered, for both cost and environmental impact. Sustainable materials are used throughout our industrial economy and can be produced without depleting non-renewable resources and without disrupting the established steady-state equilibrium of the environment and key natural resource systems [8].
The Finite Element Method (FEM) has become a common technique in many areas of engineering and physics [9,10,11]. The versatility of the FEM lies in its ability to model structures with arbitrary shapes, work with complex materials, and apply various types of boundary conditions [12] where it was demonstrated that numerical methods allow accurate estimation of the thermal behavior of the walls. This method can easily adapt different sets of constitutive equations, which makes it particularly attractive for physical simulations in many fields [13,14,15].
On the one hand, there are several research works [16,17,18,19,20], that reported the application of thermal-numerical analysis techniques in different types of constructive elements applied to external walls [21,22] or even looking for comfort conditions inside the building [23,24]. Unfortunately, there is a relatively small amount of previous work [25,26], validating the numerical analysis by comparing the results of experimental tests with those obtained numerically [27,28,29].
On the other hand, the heat transfer process and fluid flow within a wall made of hollow concrete blocks is a complex task [30], since it occurs by combining the three heat transfer phenomena, such as conduction, convection, and radiation modes [31,32]. It is well known that the general heat transfer process from inside a space to the surrounding environment is composed of several ways: From the inner side to the inner surface of the wall by convection and radiation, from the inner surface of the wall to the external surface of the wall through conduction, and from the external surface of the wall to the environment through convection and radiation ways [33]. While inside, the cavities of the blocks the heat transfer mechanism is mainly characterized by radiation through the hollow.
In previous studies conducted by [34,35], experimental tests were carried out with three sample walls (Length × Width × Height) 1190 mm × 190 mm × 1000 mm, by using three types of blocks 400 mm × 200 mm × 200 mm. Two of the groups of blocks studied presented a replacement in their components, varying their volume. In the first case, 5% of the fine aggregate was replaced by sawdust (MS); another was carried out through a combination of two by-products, in which 5% of the fine aggregate was replaced by sawdust whereas 15% of the cement was also replaced by lime sludge (MSLM) [36,37,38]. The third type was the traditional commercial block made of concrete, taken as a reference model (MREF). For each wall, 15 blocks of each type were used. For the joints, a commercial mortar formulated with cement, lime, siliceous aggregate, and additive was used; which complies with the specifications of the UNE-EN 998-1 standard regulation [39].
Using FEM, the predicted thermal behavior of the walls [40,41] was very close to the one obtained in the experimental tests, regarding the thermal transmittance (U value), with low differences. Additionally, the use of filling insulation in the cavities of the blocks, as an alternative way to optimize the thermal behavior of the walls, offers a relevant improvement in comparison to the same topology of blocks without insulation.
Also, it is important to point out that an additional advantage of using FEM to evaluate the thermal behavior of concrete blocks is the remarkable reduction of time and effort involved in the design and construction stages of the walls from the very beginning of the engineering process.

2. Aims and Methodology

The main objective of this research is to determine the thermal properties of walls made of three types of blocks, by means of FEM simulations [42]. These results were compared to those obtained from experimental tests [34], in order to validate the numerical model. In addition, the thermal behavior of the blocks was analyzed and compared when incorporating insulation material in their holes.
For this, two different models were built and later tested for validation purposes, one of them considering just air in the internal cavities of the blocks and the second one considering these cavities fully filled with recycled insulation material, aiming to address the different performances of those typologies, including a moisture correction factor. Finally, the error treatment was presented demonstrating the reliability and robustness of the whole process.

3. Experimental Work

The first input data needed to perform the simulations are the thermal conductivity and the thermal emissivity of the blocks. It was performed by means of Guarded Hot Box (GHB) experimental test equipment.

3.1. Description of the GHB (THERMO 3 Thermal Cell for Building Materials)

The guarded hot-box device, designed and calibrated according to standard UNE-EN ISO 8990 [43], consists of 2 isolated chambers, one of them with a temperature-controlled cold chamber and another one with a hot enclosure equipped with temperature or flow regulation. The cold chamber makes it possible to simulate climatic conditions both outside and inside the building, with temperatures that can be regulated from −5 to 20 °C. The hot chamber permits a simulation of the indoor temperature conditions of the building and its temperature can be regulated from 10 to 30 °C. The faces of the wall that are not in contact with the chambers were fully sealed through wood fiber insulation, aiming to prevent lateral (parasitic) thermal exchanges. For the experiments, constant temperatures were maintained on both the hot side (inside of the building) at 20 °C and cold side (outside of the building) at 5 °C. Once the steady state was reached, the temperature gradient can be evaluated, as specified in the standard UNE-EN 8990 regulations [43].

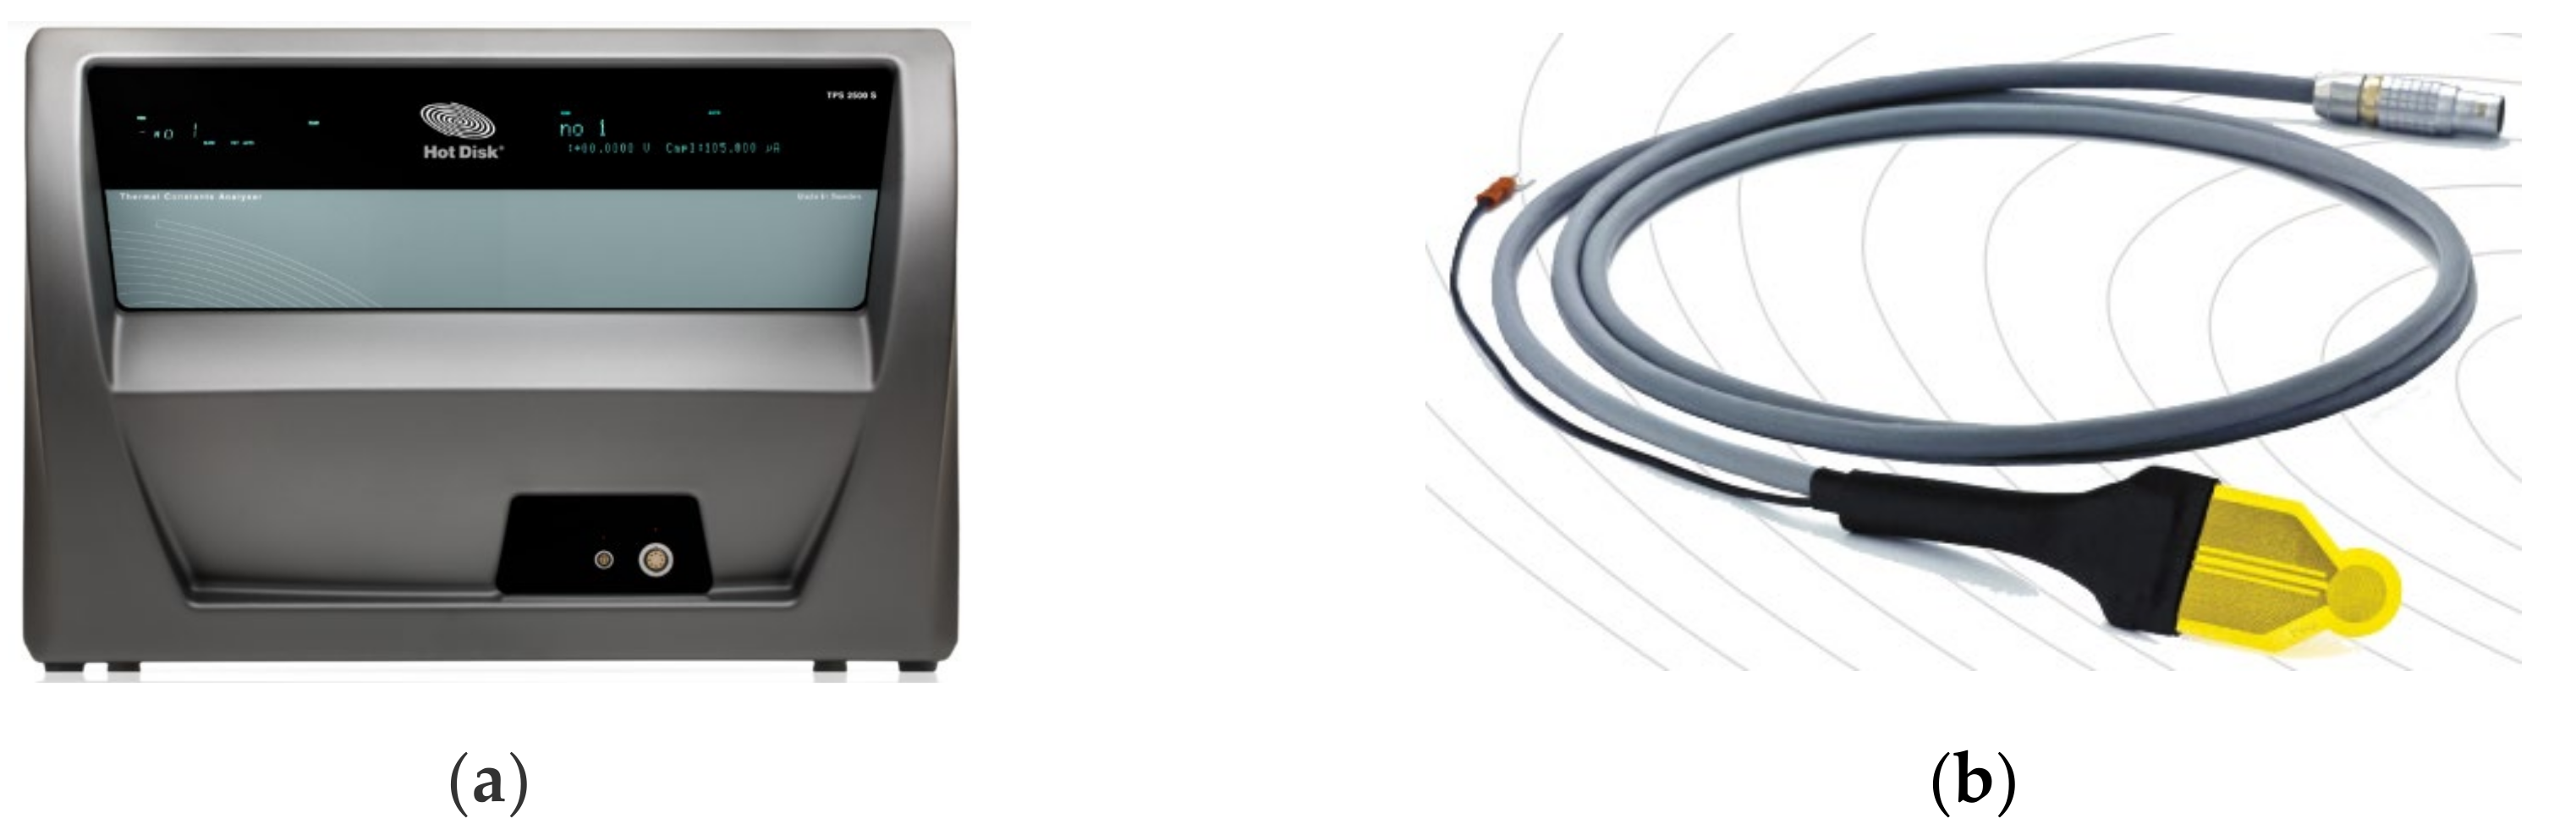
3.2. Evaluation of the Thermal Conductivity of Materials

The Transient Plane Source (TPS) method was used to determine the thermal conductivity of the specimens [44], in accordance with EN ISO 22007-2 regulations [45]. The test was carried out with a Hot Disk equipment (Figure 1), model TPS 2500 S, whose main specifications are shown below in Table 1.
Prior to the beginning of the test campaign, three specimens of 100 mm × 100 mm × 100 mm were cut to obtain two identical samples of 100 mm × 100 mm × 50 mm. The surfaces in contact with the sensor were sanded to minimize the air intake entrance, and then dried in the oven at 50 °C until a constant weight was reached. Finally, once cooled, the sensors were placed between the two pieces, and the thermal conductivity was finally measured. For each specimen, 3 tests were performed in different positions. The tests were carried out at room temperature reference T0 = 20 ± 2 °C, with an initial coefficient of resistance R = 0.0047 K−1. The sensor measured a heat flow (Q), between 0.06 and 0.17 W, for a measurement time range (t) of 40–80 s.
The results from the experimental tests were obtained from walls not in moisture-free conditions. Given that the thermal conductivities of the materials vary depending on the moisture content, these values were adjusted so that the results are fully comparable.
In addition, the guide of the American Concrete Institute ACI 122R-14 establishes that a correction of the thermal conductivities of the samples dried in the kiln must be carried out, in order to obtain practical design values, since the concrete is usually not found in these conditions at the stage of using it [46]. Accordingly, the thermal conductivity values of the materials in the dry state were corrected by a moisture factor. Results of the real thermal conductivity (K) obtained in such conditions are shown below in Table 2 for the three samples, including the mortar used.
According to this previous guide, a moisture correction factor of 1.22 can be used to correct the thermal conductivities of concrete with limestone [46]. For the cases of mixtures with the incorporation of by-products such as “lime sludge” and “sawdust”, a slightly higher correction factor of 1.25 was assumed, since these types of concrete are more porous and therefore its content of moisture at the time of the test was slightly higher. It should be noted that this value is rather modest compared to those suggested by this guide for other types of concrete (with pumice stone, perlite, vermiculite, fly ash, slag, or coal ash), whose correction factor is 1.30. Regarding the mortar, this guide establishes a moisture correction factor of 1.20.

3.3. Evaluation of the Thermal Emissivity of Materials

The method used to determine the thermal emissivity consisted in placing a piece of insulating tape (with a known high thermal emissivity) in the block and heating the sample to 40 °C. Then, an infrared camera was used and self-adjusted, obtaining a frozen image. The emissivity was set to a value of 0.95 [47]. The temperature of the tape was measured by the isotherm measurement function and was recorded. Finally, the emissivity setting was changed until the temperature remains constant (stationary state), so the thermal emissivity was obtained.
The surface aspect of the three samples Model of lime sludge (MSML), Model of sawdust (MS), and Model of reference (MREF), respectively, are shown below in Figure 2. It is hard to appreciate the external differences amongst them.

4. Building the Numerical Model

The methodology implemented in the finite element analysis [48], considers the mathematical model of concrete based on the “Drucker-Praguer” model for compression stresses [49], and the “William & Warnke” model for stresses [50], predicting the failure modes of the material: Cracking and crushing, and the rest of parameters required by the DOE (design of experiments) procedure.
The numerical analysis for the evaluation of the thermal behavior of the abovementioned three samples was carried out through the commercial software package ANSYS v. 16© [51] by means of a 2-D simulation, in stationary state [52], because, according to previous studies, it was demonstrated that the 2-D analysis, using this software, accurately reproduces the behavior of the blocks, close to those obtained in a 3-D analysis for this specific type of polyhedral geometries [53,54].
The calculation method used is provided in the standard UNE-EN 1745 regulation [55]. The model combines the Workbench environment of ANSYS with codes programmed using APDL (ANSYS Parametric Design Language) the command language for the ANSYS Mechanical to assessing performance of the blocks.

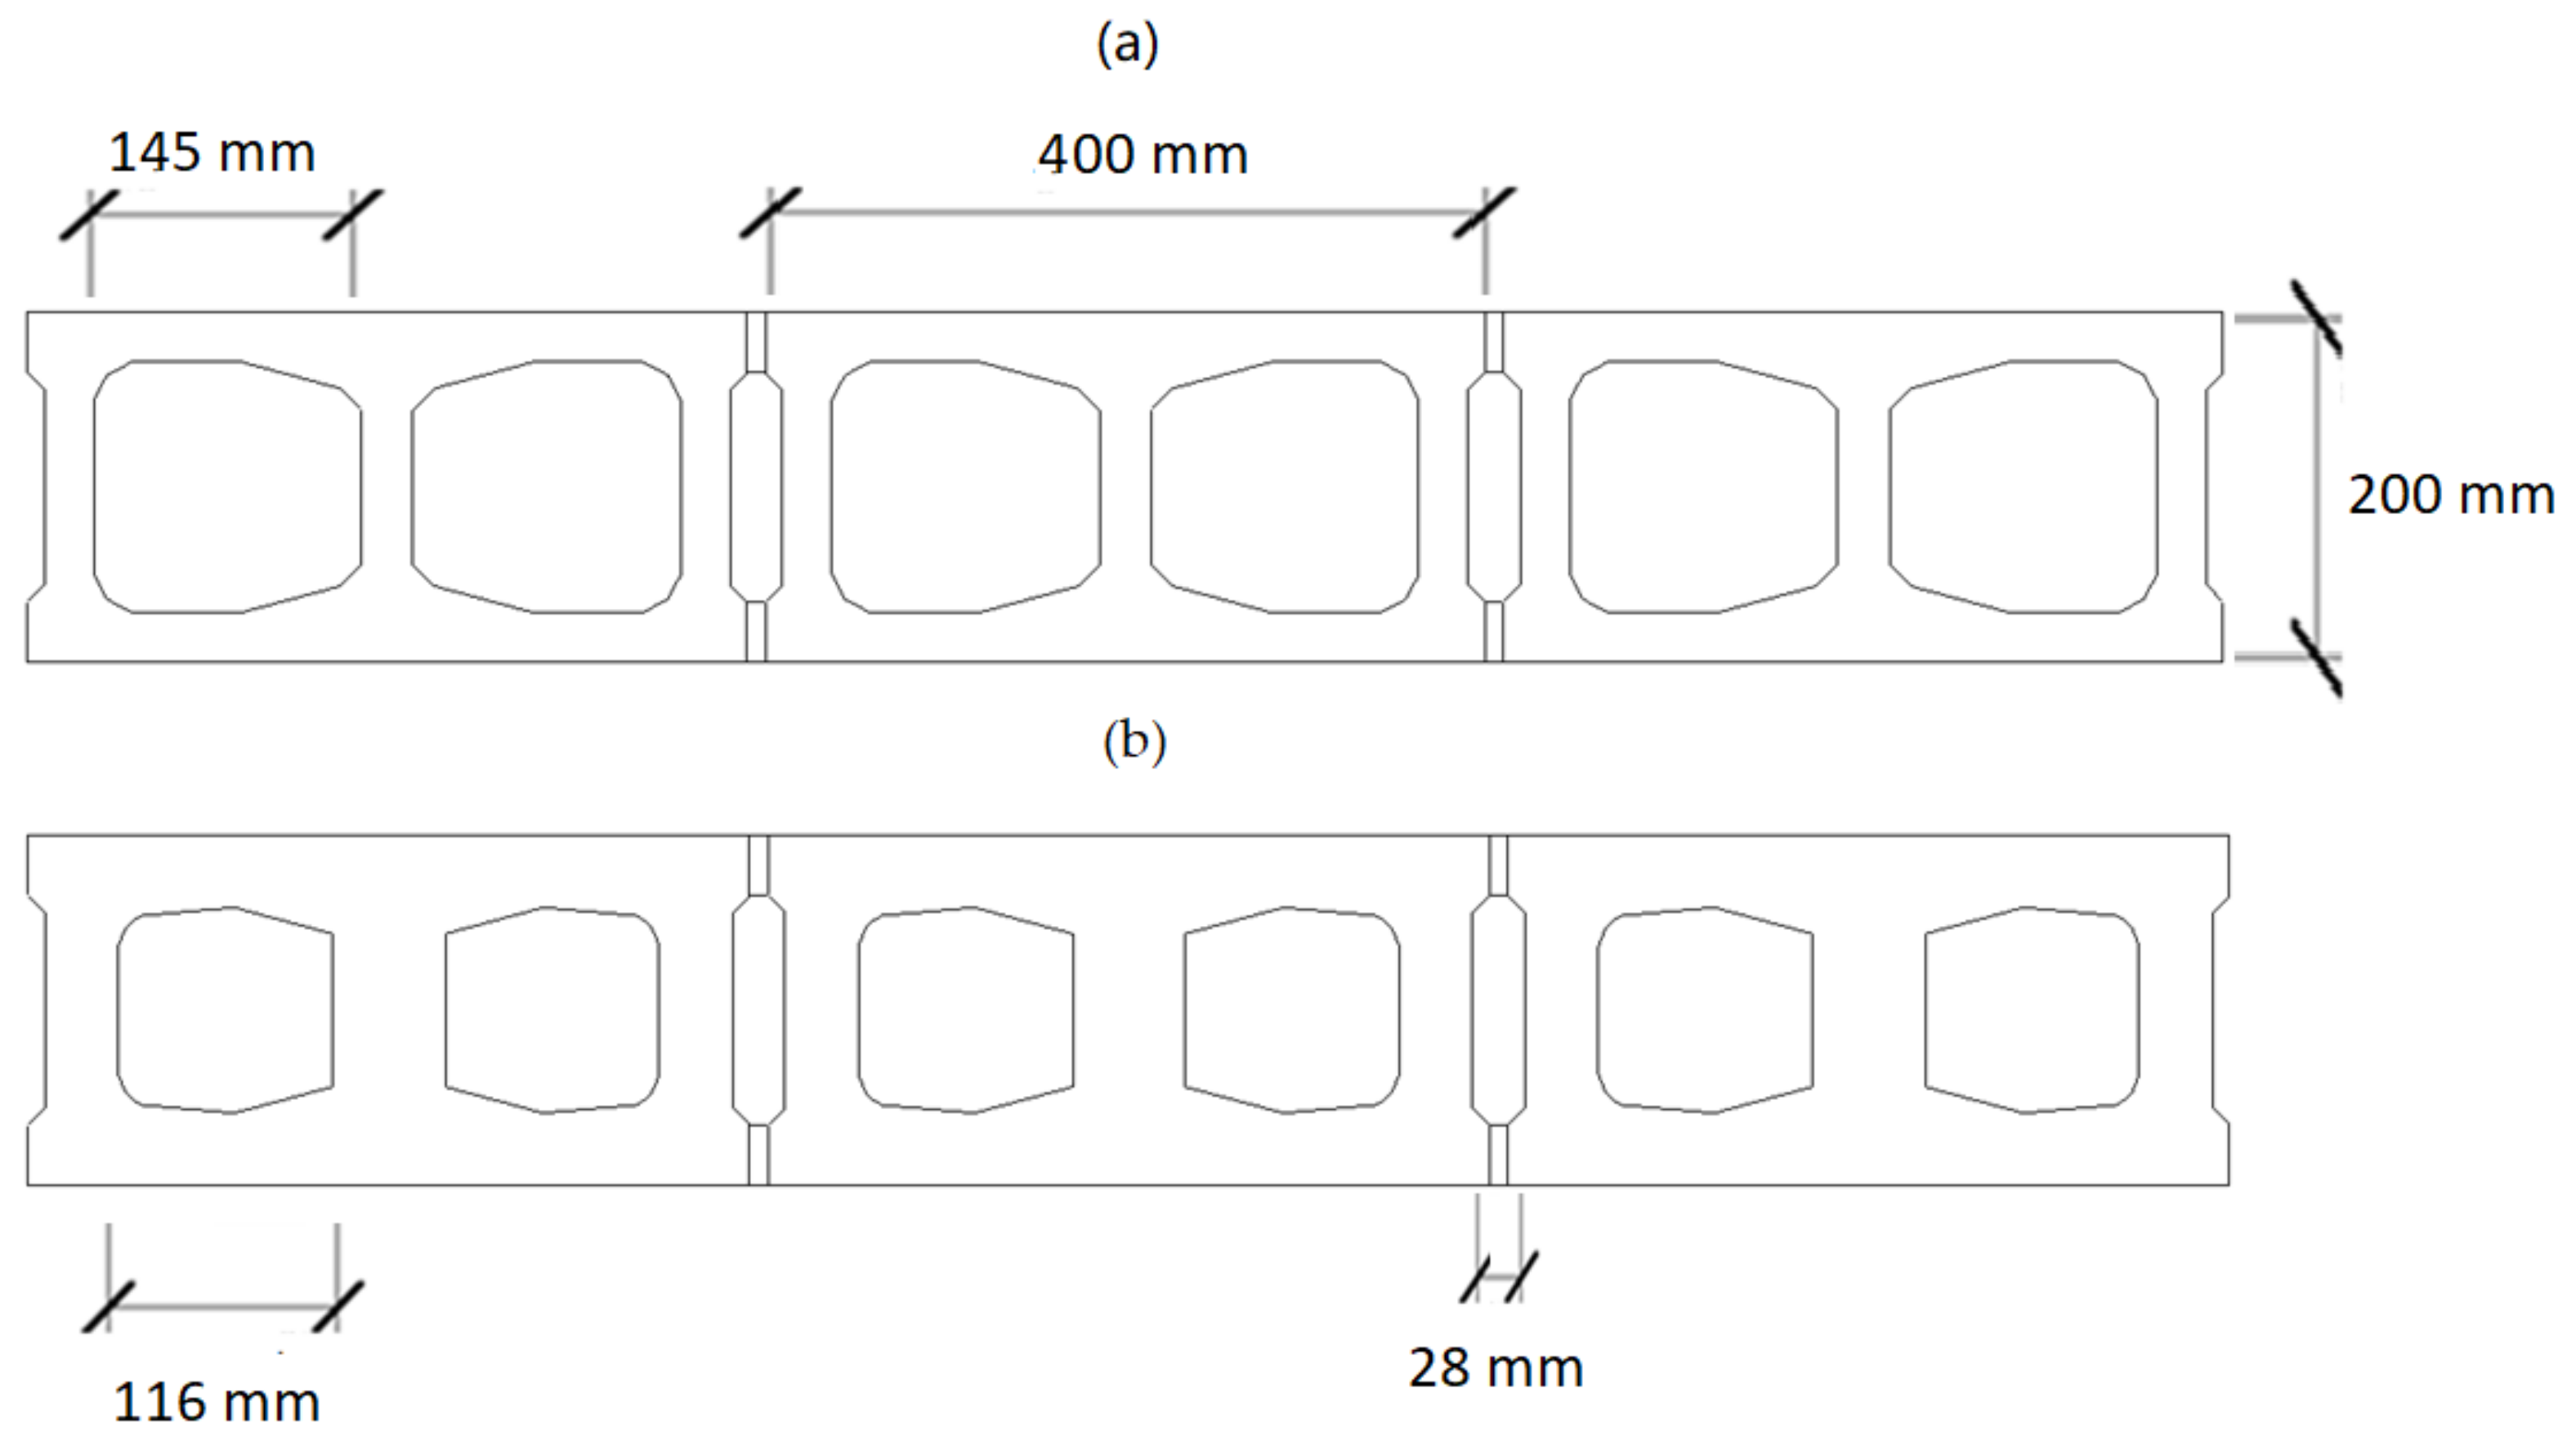
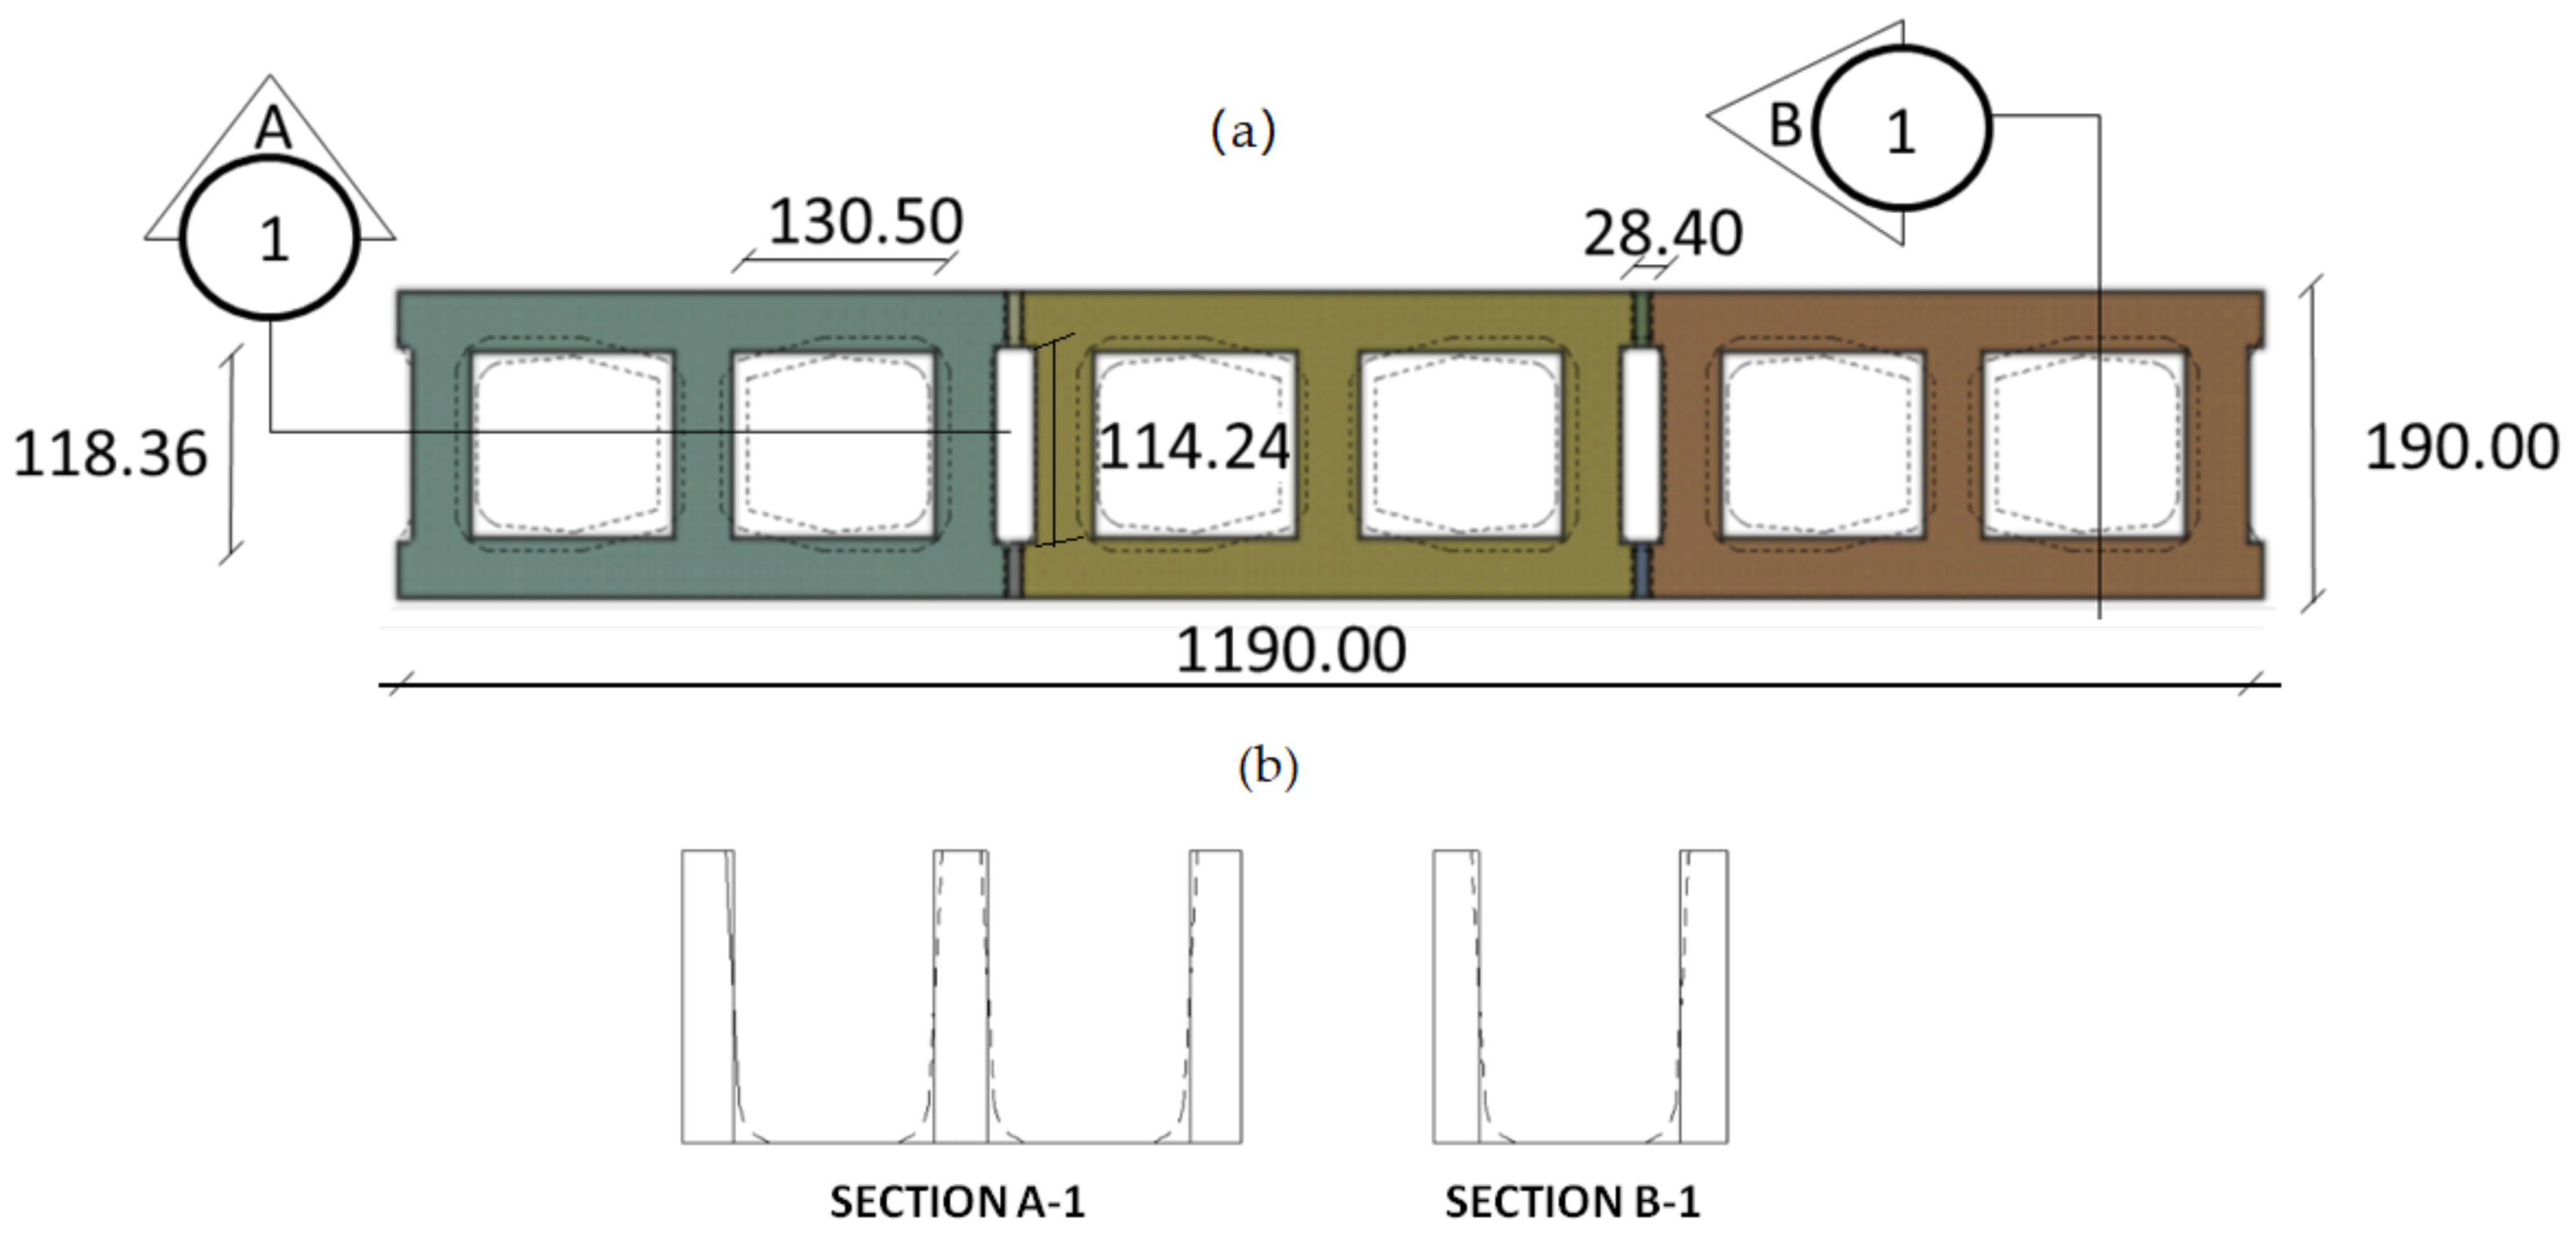
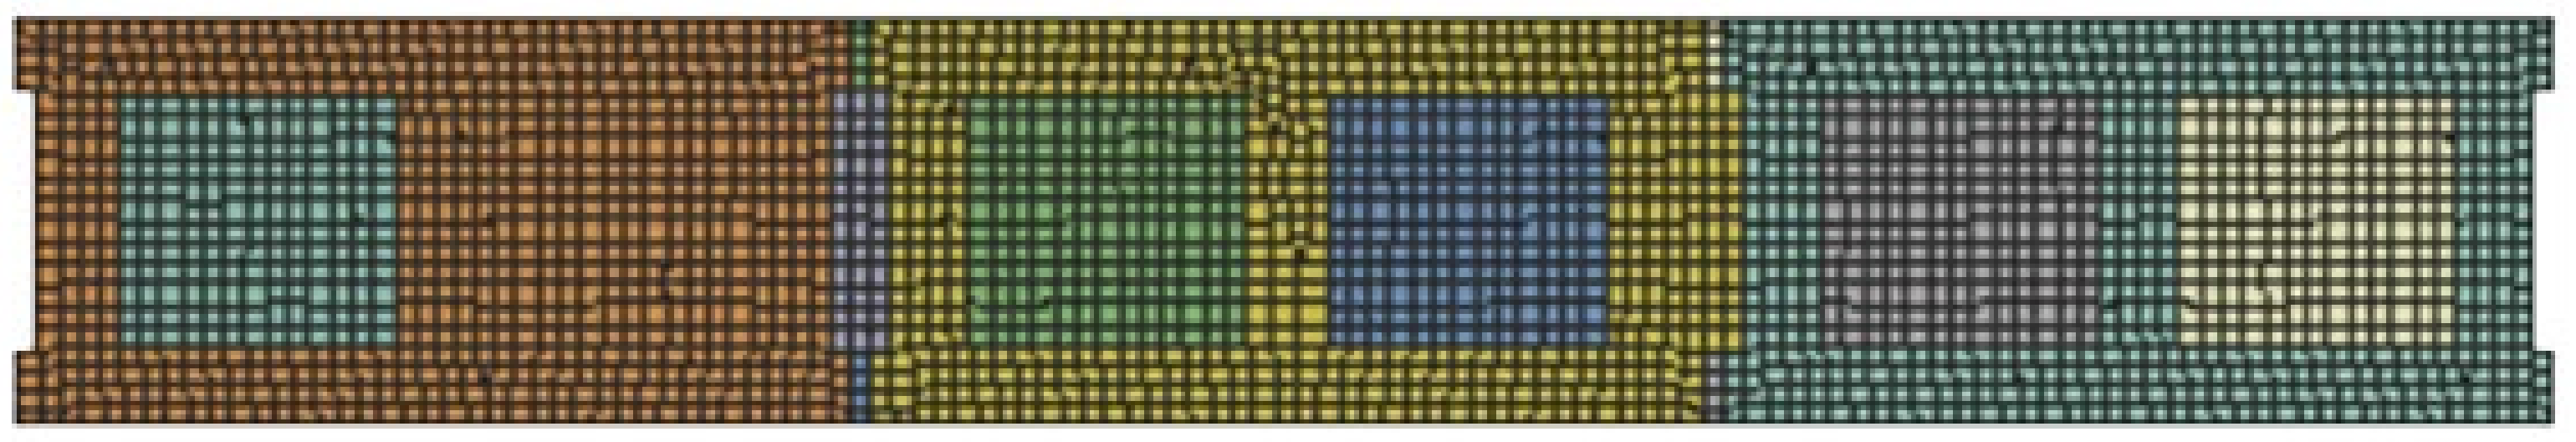
4.1. Definition of the Geometry

The geometry of the 2-D numerical model was defined considering a row of the wall analyzed in the Guarded Hot Box experimental test equipment, which consisted of three pieces joined by a 10 mm thickness mortar. Figure 3 shows the geometry of the row, from top Figure 3a,b points of view, respectively.
As can be observed, it presents different types of non-rectangular internal holes, formed by the joints of consecutive blocks and those internals of the blocks itself. The difference between the areas of the holes in the upper and lower parts is due to the fact that the internal holes in the blocks present a truncated pyramid shape, with the aim of facilitating the demolding of the pieces in the manufacturing process.
The geometry of the wall was simplified, in such a way that in the new geometry the same volumes for both concrete and holes respectively were preserved, with the difference that in the new geometry all the holes were rectangular, as depicted below in Figure 4.
The following assumptions were followed:
The equivalent holes will be rectangles defined by a length “b” (in this case for the two types of holes would be b’ and b”) perpendicular to the heat flow (Q), and by a thickness “d” (d’ and d”) parallel to the heat flow, as shown below in Figure 5.
For the case of the internal block holes, due to its real shape, it presents upper (b’sup) and a lower (b’inf) dimensions, so to determine the final figure b’, the two values were averaged. Results are shown below in Figure 6.
The thickness of the equivalent hole “d” (d’ and d”) was the resultant of the quotient of the area of the real hole and the length “b” (b’ and b”) of the equivalent hole. For the case of the gaps formed by the joint of the blocks, this was not necessary, since b’’ is constant for the whole height of the block. The area of the wall gaps were determined from digital photographs, which were imported into a Computer Aided Design (CAD) software used for 2-D drawing.
The dimensions used to graph the holes are shown below in Table 3. For this first analysis, all the holes contained air inside.

4.2. Determination of the Radiation Coefficient Inside the Holes

Aiming to simulate the heat exchange within the cavities, an algorithm was developed based on a standardized method to calculate the cavity radiation coefficient. This method is established in the UNE-EN ISO 6946 standard regulation [56], which defines the applicable expression in the determination of the radiation coefficient for unventilated air holes with rectangular shapes characterized by a length “b” (perpendicular to the heat flow) and a thickness “d” (parallel to the heat flow). The radiation coefficient ( h r ) is given then by Equation (1).
h r = h r 0 1 E 1 + 2 1 d b + 1 + d 2 b 2
where   h r 0 is the radiation coefficient for a black surface or body which is given by h r 0 = 4 σ T m 3 , where σ is the Stefan–Boltzman constant, [5.67 × 10⁻⁸ W/m2 K4]; T m is the average thermodynamic temperature of the surface and its surroundings, which for all the cavities will be taken as T m = 283 K; and E is the emissivity factor between surfaces that is given by Equation (2):
E = 1 1 ε 1 + 1 ε 2 1
where ε 1   y   ε 2 are the hemispheric emissivities of the surfaces in the confined space. Radiation values for the three block types are shown below in Table 4.

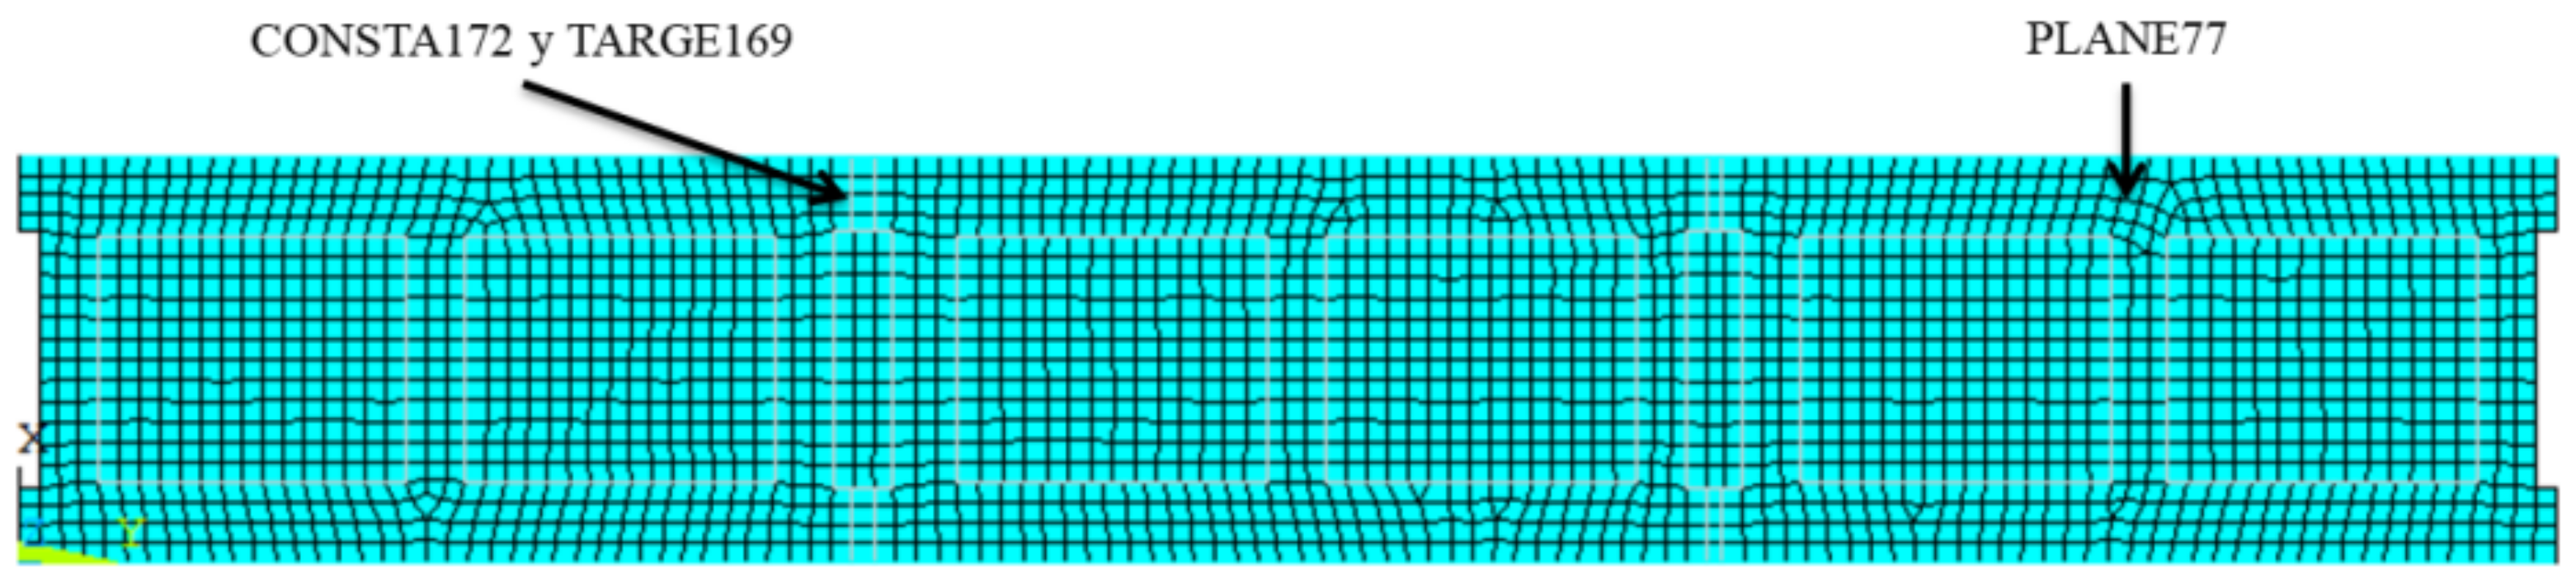
4.3. Computational Mesh

The model contains a uniform mesh along to the entire wall, including the joints, accounting 2119 cells (elements), with an average cell size of 1 mm. The appearance of the mesh is depicted below in Figure 7. According to previous studies, the meshing scheme has no practical influence in the accuracy of the thermal calculation, [5,25] but it is strongly encouraged to use uniform cells with an aspect ratio closer to 1 in order to facilitate the transfer of information amongst the cells.
When performing any analysis using a program based on finite elements, it is essential to select the most appropriate type of elements and attributes, which will depend on the specifications of the problem. The elements used here were: PLANE77, CONSTA172, TARGE169, and SURF151 [57]. The first three are created by default and the last one has been introduced through APDL programming. The element “PLANE77” was used for the simulation of the solid zones of the block, whereas “CONSTA172” and “TARGE169” are the elements defining the contact between blocks, defined by a pair of elements, the named contact and objective elements, respectively. Finally, the element “SURF151” was used for the outline of the holes. The characteristics of this last element were introduced through a specific command that allows the specific characterization of those elements. They present a central node (extra node), acting as a core and transfers the heat to the surrounding elements, in this particular case to those elements in the contour of the hole. These nodes were located in the center of each of the holes and are allowed to reliably simulatinge the heat transfer through the air of the holes as can be seen below in Figure 8.

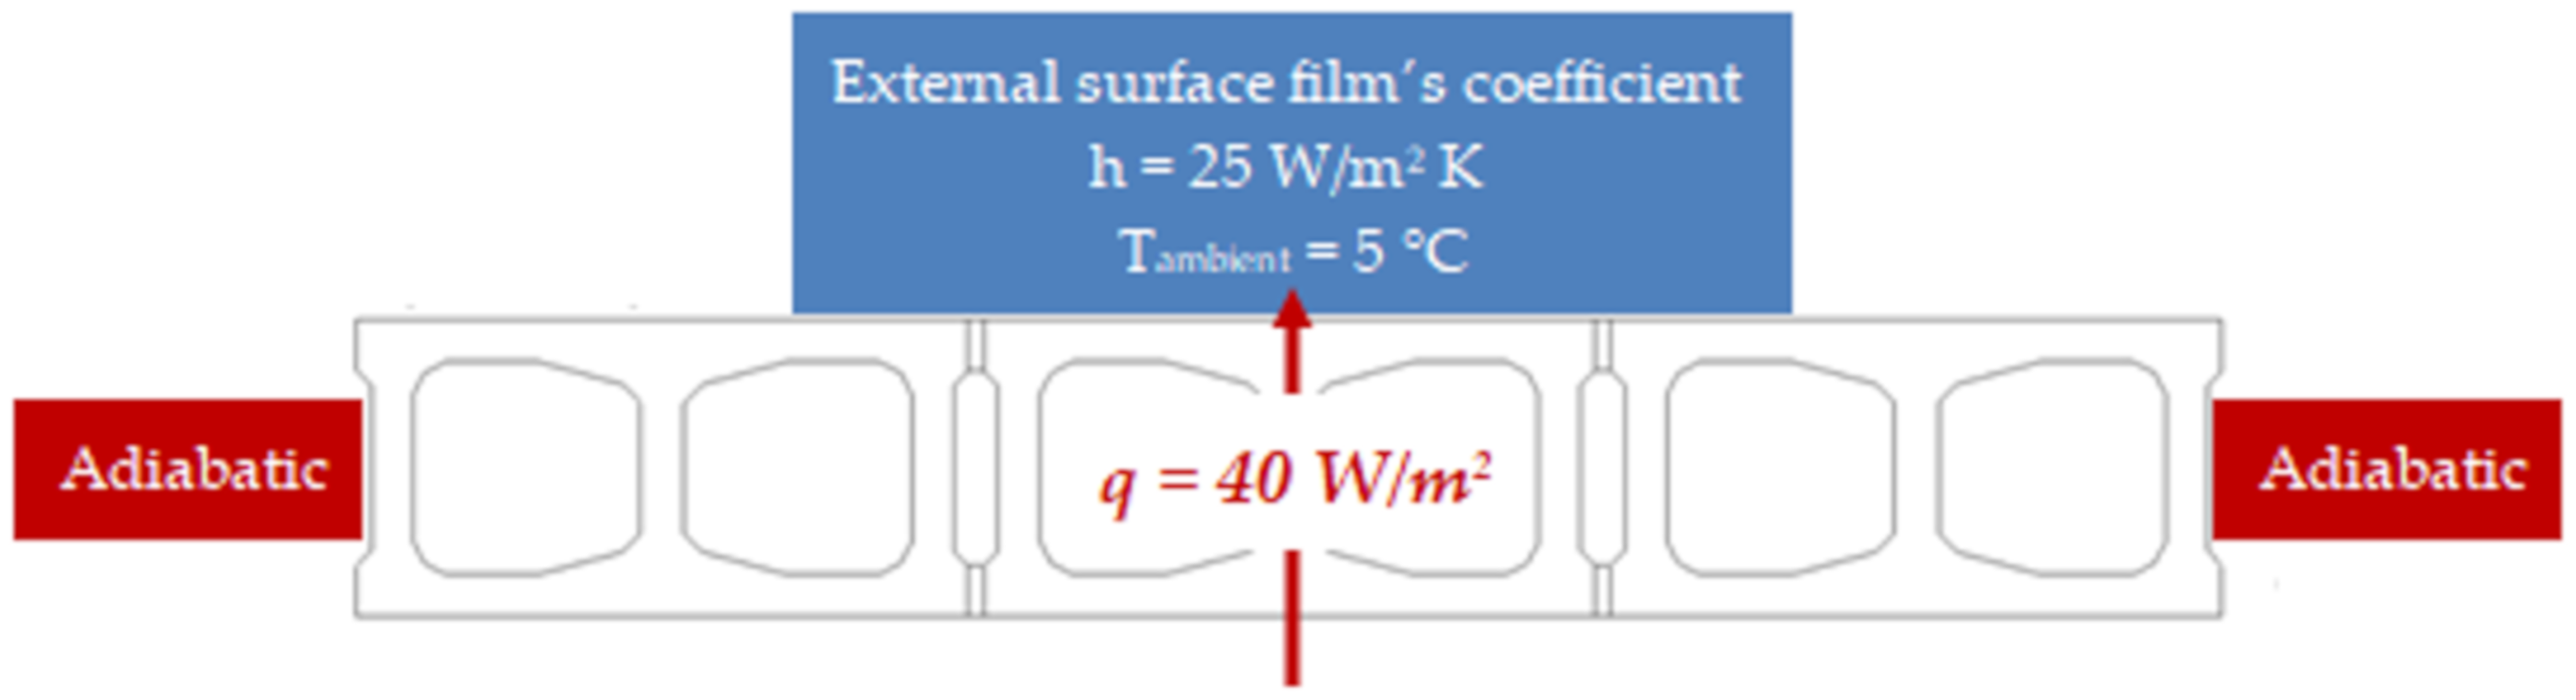
4.4. Boundary Conditions

Based on the fundamental physical process and according to the initial conditions of the experimental test, the following boundary conditions were considered for the simulation, as established in Annex A of the UNE EN-ISO 6946 Standard regulation [56]:
  • A specific heat flow: q = 40 W/m2 applied on the inner side of the wall.
  • An external film coefficient: h = 25 W/m2 K, and an external surface thermal resistance coefficient R = 0.04 m2 K/W, that is used on the outer faces of the envelope.
  • An outside ambient temperature of 5°C, simulating the same temperature field used in the experimental test.
The other two surfaces were considered adiabatic, simulating the effect of the insulation around the wall, in the experimental test. All of this is summarized below in Figure 9.

4.5. Determination of Thermal Properties

The determination of the main thermal properties such as thermal resistance R (m2 K/W), thermal conductivity K (W/m K), and thermal transmittance U (W/m2 K) of the wall, were calculated through Equations (3)–(5), respectively:
R = A · Δ T Q = A · T h T c Q
where A (m2) is the surface of the wall to be tested, ΔT is the temperature difference between the opposite sides of the wall, Th (K) is the surface temperature of the wall on the hot side of the wall, Tc (K) is the surface temperature on the cold side of the wall, and Q (W) is the heat flow through the wall.
K = e R
where e (m) is the thickness of the wall.
U = 1 R T = 1 R s i + R + R s o
where R T is the total thermal resistance, composed of R s i and R s o which are the resistances of the inner and outer surfaces, respectively, and finally R, which is the thermal resistance of each layer. In the case of horizontal heat flow, the standard EN-ISO 6946 regulation [56] establishes, in Section 5.2, the values for R s i = 0.13 m2 K/W and R s o = 0.04 m2 K/W, respectively.

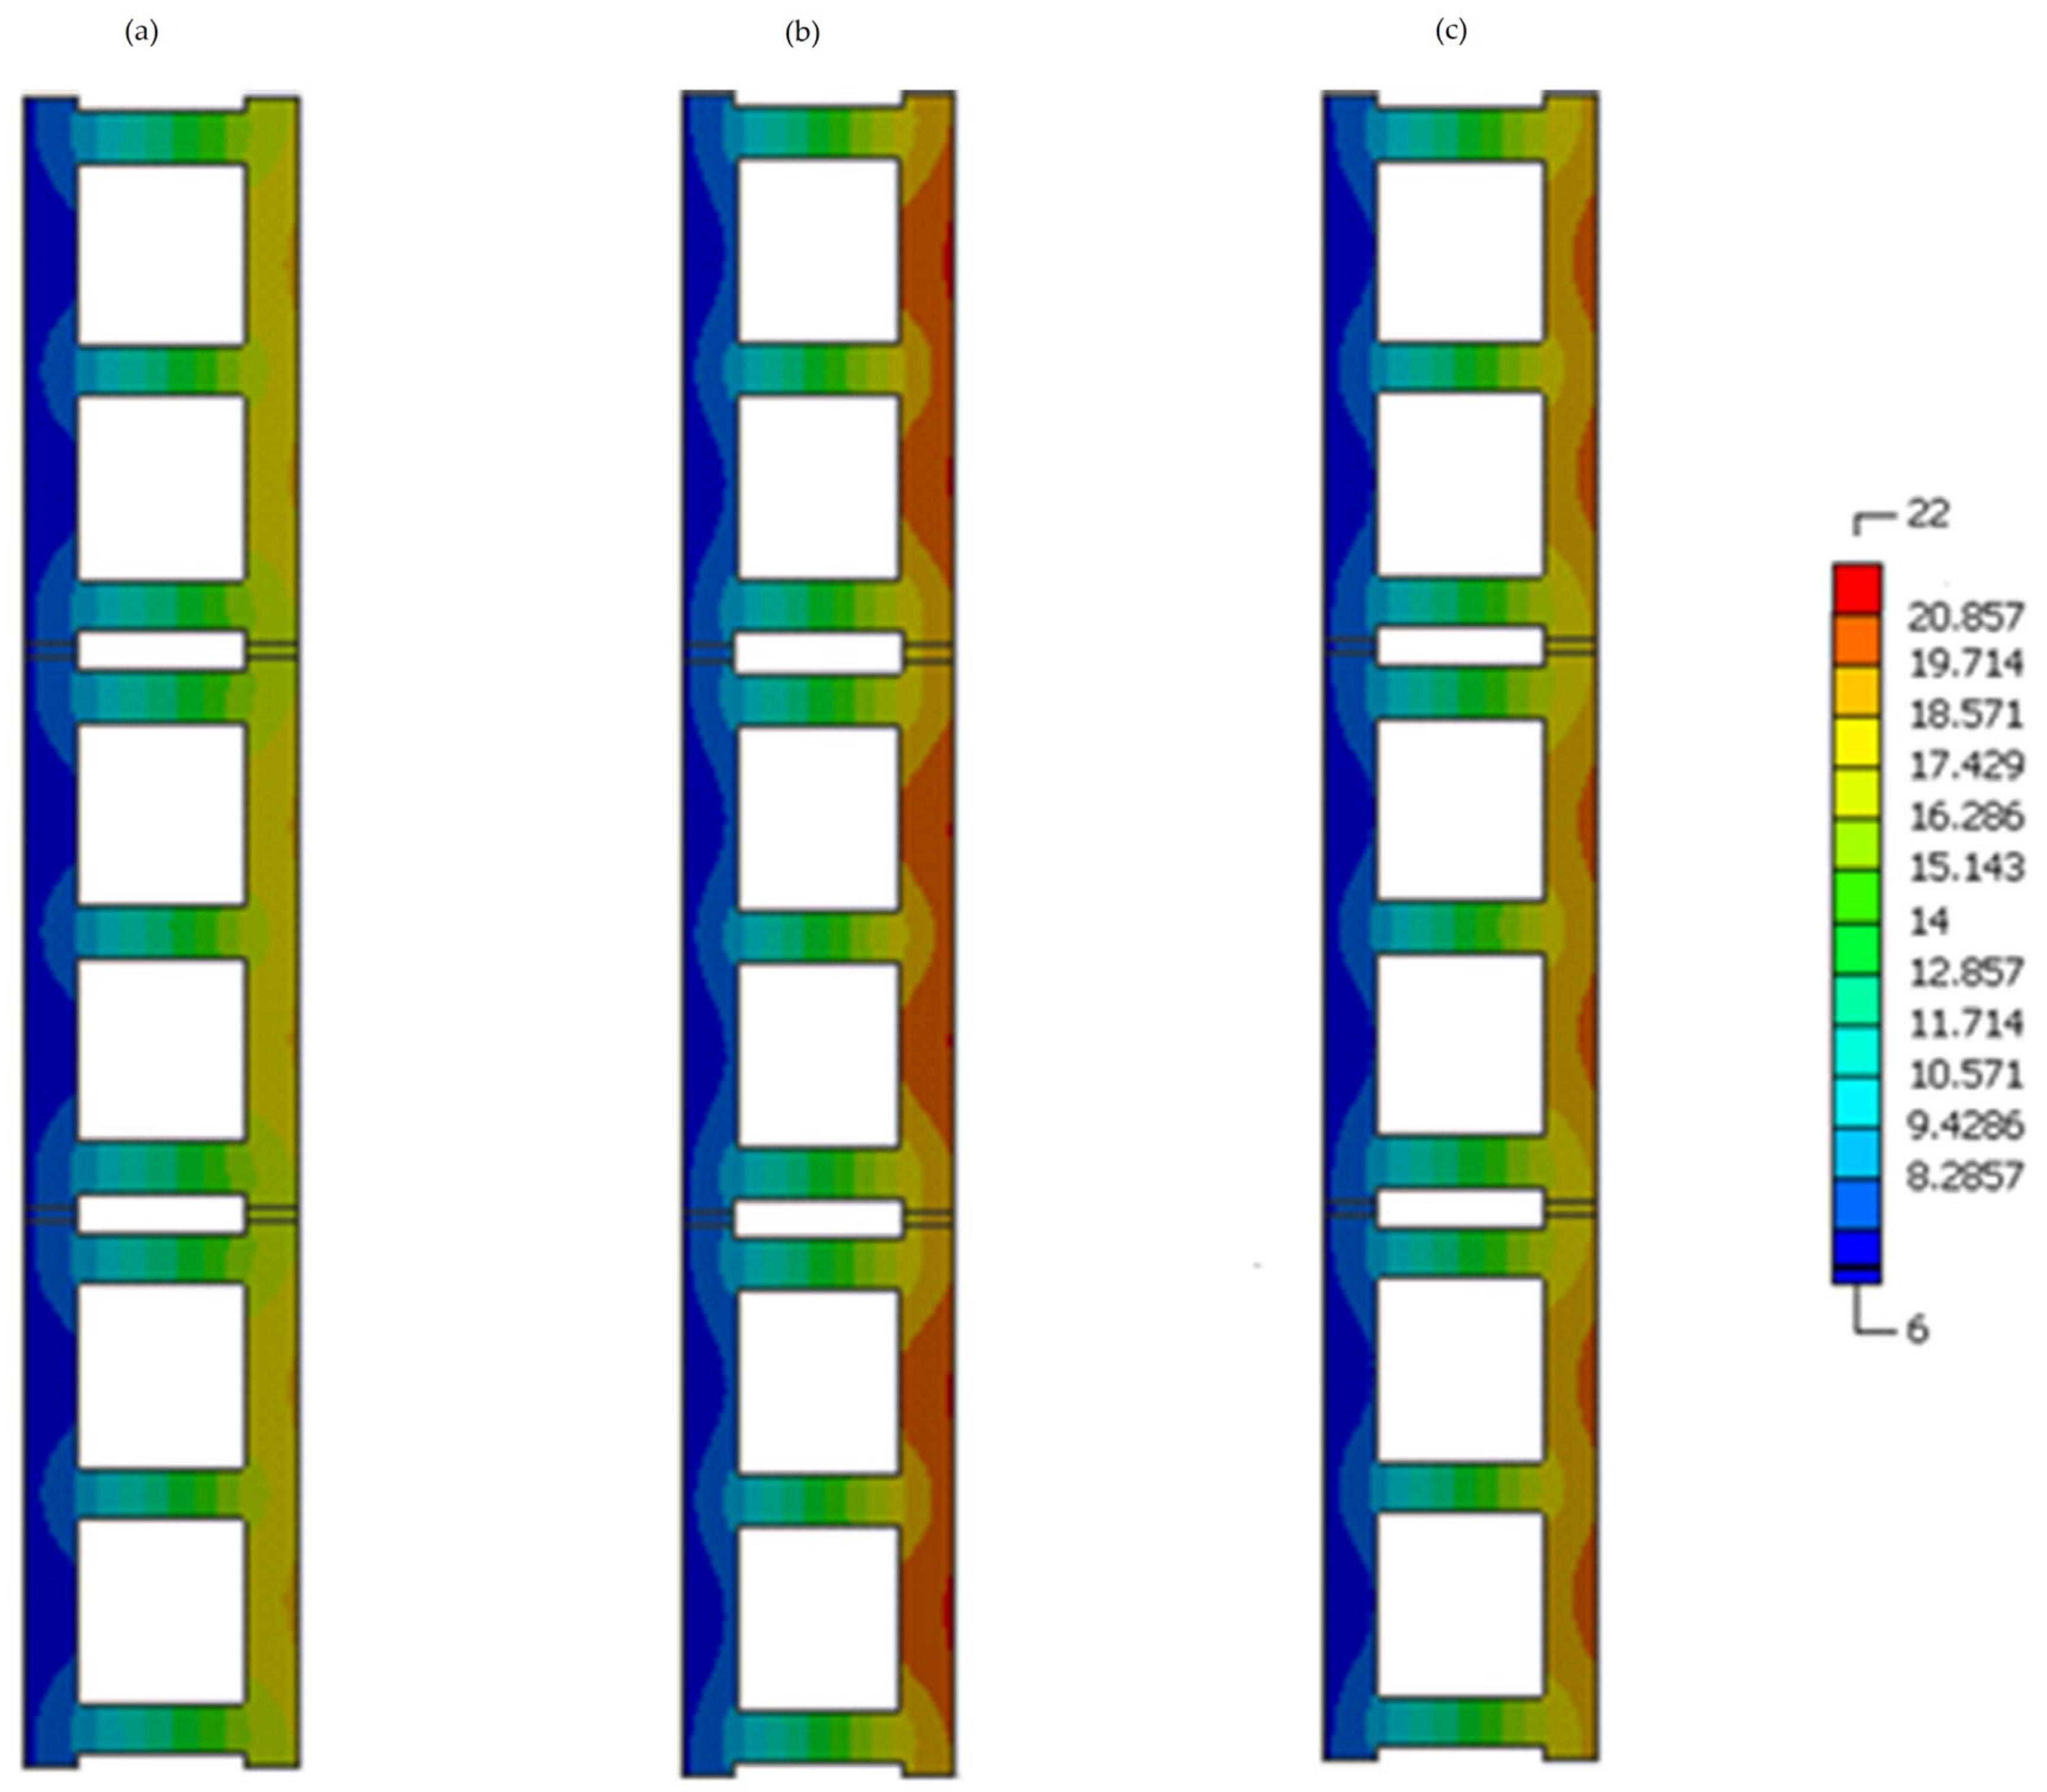
5. Results and Discussion

5.1. Model with Empty Cavities

Figure 10 depicts the temperature field distribution for the three types of blocks studied (hot side on the right and the cold side on the left).
It allows for identifying the thermal bridges of the block walls, which are found to a greater extent both in the area where two blocks meet but also in the transverse partitions of the blocks itself and therefore the insulating effect of the cavities is broken severely in such zones.
On the contrary, in the surfaces around the midpoint of the cavities, on the inside part of the wall, a greater insulation effect is observed due to the presence of the cavities (holes), since the heat transfer decreases, in a different way for each type of wall. Table 5 below shows the minimum, maximum, and averaged temperatures of the three walls obtained in the simulation for both cold and hot sides, respectively.

5.2. Error Treatment

Table 6 presents a summary of the temperatures obtained in the full-scale tests.
When comparing such temperatures with those calculated through the numerical analysis (see Table 5 above), it can be seen that the difference between the measurements and the simulations can be considered negligible, so the numerical model could be considered fully validated.
Besides, the results of thermal resistance, thermal conductivity, and U-value of the walls, obtained by FEM (simulations), as well as those obtained with the Guarded Hot Box (measurements), are shown in Table 7.
MS and MSLM present lower values for thermal transmittance (U) than the MREF, with the lowest values being reached at the MS wall.
Likewise, it can be observed that the U-values obtained in the numerical analysis (model) were slightly lower than the results measured (experim.), with a small difference ranged between 2.9% and 4.4%.
Based on these results, it can be concluded that the finite elements model reproduces, with enough precision, the heat transfer mechanism in the walls. Other studies, such as Principi and Fioretti [23], found this difference around 7% whereas Ghazi and Tanner found it up to 5% [26].
Performing a 3-D analysis and considering then the horizontal mortar between the courses, as well as the excess of mortar that is found in the cavities of the blocks, [26] it will generate higher thermal bridges, which slightly reduces the volume of the cavities and would result in a wall with less thermal resistance, given that the mortar would essentially provide less thermal resistance to the wall than the air itself in the cavities. However, estimating the volume of excess of mortar can be a very complex task since it isa manual technique so it would become a random error. The excess of mortar will depend on both the force applied when striking the blocks and the weight of the block itself, in this case being different for the three block types analyzed.
Other aspects that could have slightly influenced the difference of the results were: The moisture correction factors of the blocks used, and the simplified calculation with which the radiation coefficient of the wall gaps was determined due to the fact that the block holes constitute an important portion of the total volume of the whole block. Additionally, the geometric approximation that was made in the holes could have had an influence, since the holes present slightly truncated pyramid geometry, and in the numerical simulation, the thickness of the block was considered constant although the estimated error was considered negligible.

5.3. Model with the Cavities Filled with InsulationMaterial

In this section, a second analysis was performed, consisting of the incorporation of insulation material inside the cavities of the blocks [58]. This technique was already studied by some authors [23,59,60], where a significant improvement in the thermal behavior of the blocks was achieved. Although it presents an added cost, it has the key advantage of greater ease of execution of the enclosures. This, in turn, means a saving in thethickness of the walls, with no need of additional layers, but also savings in the time of execution for the construction of the whole wall.
Based on these premises, a numerical analysis was carried out in parallel, aiming to study the thermal response of the three walls with blocks whose holes were now filled with insulating material. In this case, heat transfer by convection and radiation mechanisms in the holes were replaced by conduction mode between the different materials [61,62]. The thermal behavior of these blocks with the added internal insulation was evaluated and compared against the results obtained with the numerical method in the previous section.
For the analysis, recycled cellulose fibers were considered as insulation material, whose average density and thermal conductivity were 0.04 g/cm3 and 0.030 W/m2 K, respectively. The reason for its selection is that this type of so called “eco-composites” presents very good performance in terms of water absorption, strength, toughness, and is available in the market in two different ways, as panel or blown on site. It was also chosen since it is a sustainable raw material (by-product destined to waste), with an affordable cost and easy application, compared to foams presenting similar values of thermal conductivity but that are not sustainable materials.
The computational mesh was formed by 4239 elements, as now the cavities must also be meshed. Once again, a sensitive mesh analysis was performed, so the final selected mesh also presented an average cell size of 1 mm, aiming to offer comparable results with the previous cases simulated without insulation. The appearance of the selected mesh can be seen in Figure 11.
The elements used for this case were: PLANE77, CONSTA172, and TARGE169 respectively. The element “PLANE77” was used for the solid zones of the wall (block and insulation, respectively), while the elements “CONSTA172” and “TARGE169” were used to define the contact between the different materials (see Figure 12).
Figure 13 below shows the temperature field obtained in the new simulations, with the imposed conditions. The highest values in the hot zones are reached by MS wall type, while once again, the lowest ones are for the MREF, showing the real effect of the insulation material over the different types of walls tested here. Compared to those previously obtained for the walls without insulation, as were shown in Figure 10, the differences are quite remarkable, and will be discussed later in detail, as the model was considered fully validated.
Thermal bridging in these walls with insulation clearly diminish and reveal a more uniform shape due to the continuity solution of the filling material together with the ribs of the block itself, but compared to the results obtained for these walls without insulation, as were previously shown in Figure 10, on the internal walls of the block it is clearly appreciated how a thermal bridge occurs in that area, as it is a less insulating material. Differences are quite remarkable with maximum temperatures of the order of 19 °C for the cases of non insulating walls (Figure 10) whereas almost 29 °C was reached for the cases of internal insulating walls (as can seen below in Figure 13).
In this figure, it does not stand out visually as would have been expected, but the color scale selected was the one offering the best possible resolution in the transition between the hot and the cold zones, so it can be concluded that the sustainable effect of the additional insulation placed inside the blocks is clearly addressed in this study when compared with the same blocks but without insulation for the same external temperature conditions. This experiment can be fully applied to different external conditions.
Table 8 highlights average, minimum, and maximum temperatures recorded for the three types of blocks studied here. As had happened in the previous analysis, the thermal bridges of the walls of blocks with insulation were found in the area where two blocks meet, but also in the transverse partitions of the block.
The comparative figures of thermal resistance, thermal conductivity, and U-value for all cases obtained from the simulations are shown in Table 9.
As can be seen, the incorporation of by-products improved significantly the U-values up to 10.5% (MS) and 6.84% (MSLM) with regard to the MREF. Additionally, the insulation in the walls with MREF improved the U-values by 20% compared to the same type but without isolation, while MS and MSLM walls with insulation greatly improved the values by 25.5% and 23.5%, respectively, compared to the same typology without isolation. When comparing the U-values of the MS and MSML walls with insulation, with respect to the MREF wall without isolation, the optimization was much more noticeable, being 33.3% and 28.8%, respectively. It should be emphasized that, of said improvement percentages, almost one-third corresponds to the new blocks made with by-products.
It should also be noted that, although the walls made of blocks with insulation on the interior side of the wall present lower U-values than the walls made of blocks without insulation, the latter exceed the maximum values allowed by the Spanish regulation, so-called “Technical Code for building” (CTE) [63], which will also require the placement of an additional layer of thermal insulation as part of the components of the whole façade. Thus, the labor cost for the placement of the insulation inside the blocks would greatly compensate the increase in the cost of such additional layer in walls made of block without insulation. In summary, this technique could increase the useful internal volume, by reducing the thickness of the façade itself.

6. Conclusions

Aiming to optimize sustainable construction solutions associated with building enclosures, the use of waste materials or by-products has been increasingly incorporated into the construction process, and so in this study, a numerical model was built and validated by using the Finite Element Method (FEM), in order to evaluate the thermal behavior of walls made by different type of blocks. From the results obtained in this research, the following conclusions can be drawn:
  • The numerical analysis allows to accurately predict the thermal behavior of the walls, in good agreement with experimental values obtained through a guarded hot-box device, with differences of the U-values in the range of 2.9–4.4% that are certainly negligible.
  • This procedure will contribute to the reduction of time and effort involved in the optimization of the walls. This means that it can be implemented especially since the conceptual design stage.
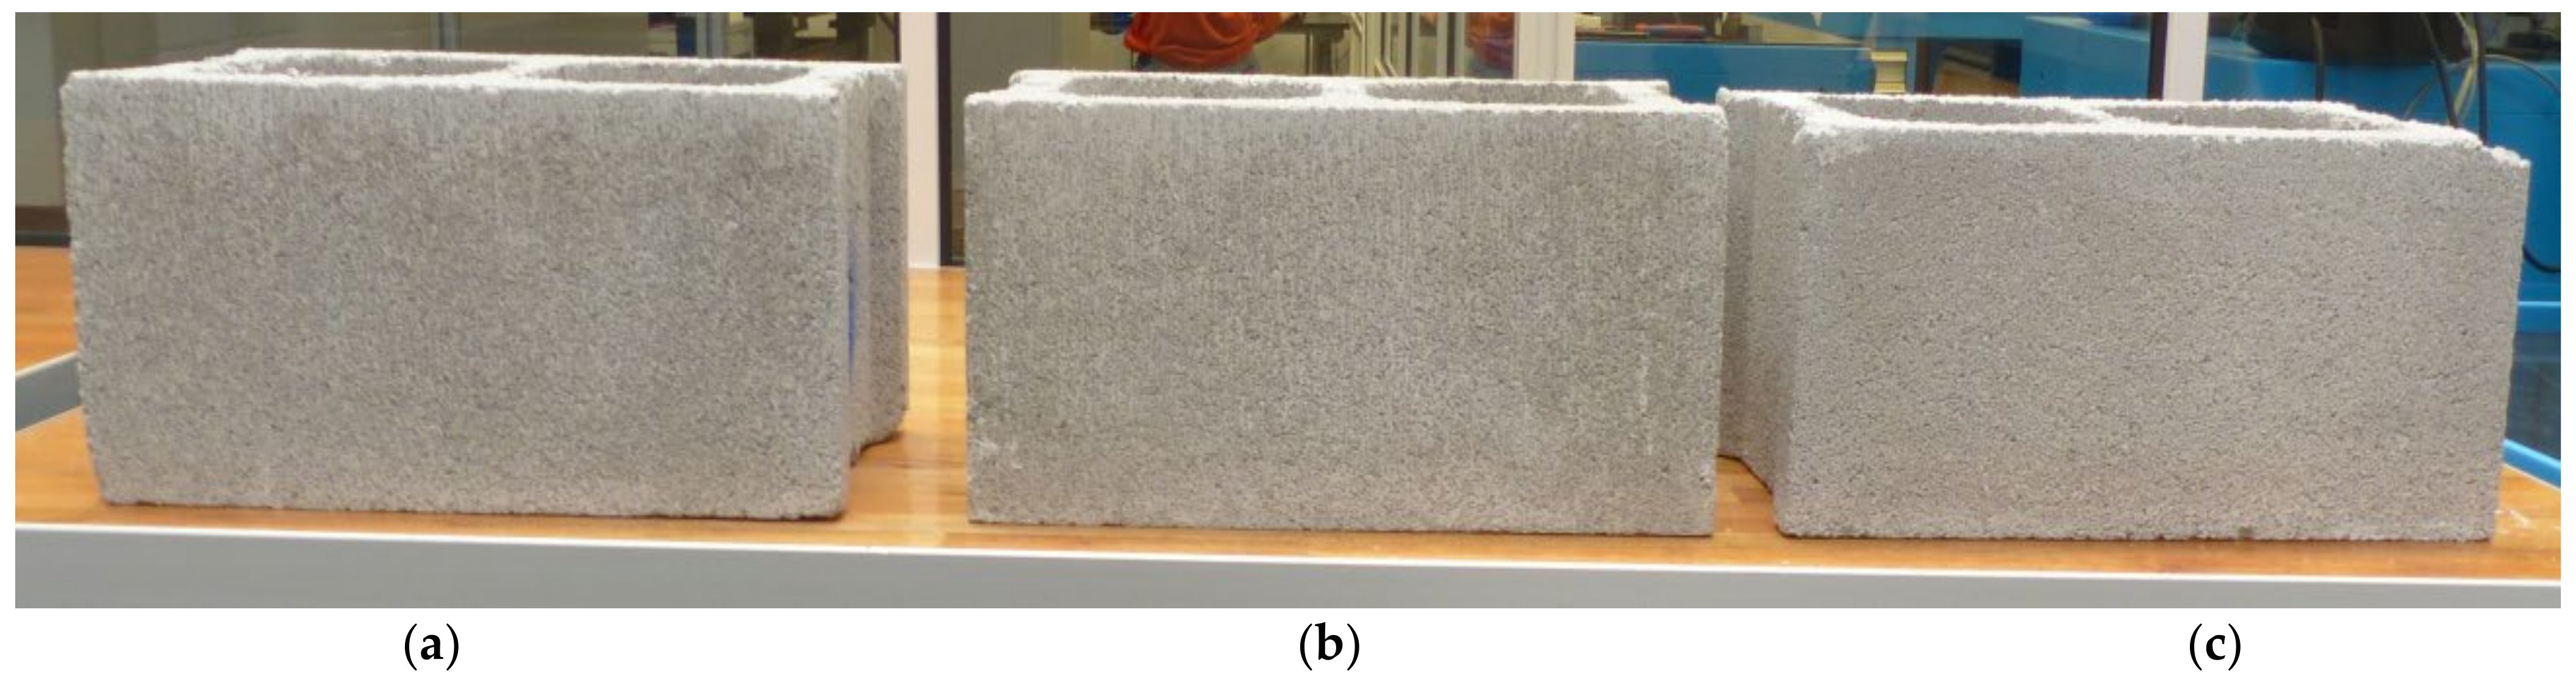
  • It has also been demonstrated that incorporating by-products (waste material) of low thermal conductivity represents a clear improvement in the thermal performance but also means a reduction in the cost, aiming sustainable building procedures. In this study, walls made of two different types of blocks were studied, such as: “lime sludge” (MSLM) and “sawdust” (MS), respectively, whose results were compared to those blocks made by the traditional concrete (MREF), showing great decreases of the U-values up to 10.5% for the case of the MS.
  • Additionally, the use of insulating filler in the cavities of these blocks, with material made of “recycled cellulose”, as an alternative way to optimize the thermal behavior of the walls, indeed offers a relevant improvement compared to the outcomes of walls made of blocks of the same typology but without insulation, improving the U-values up to 25.5% this time also for the case of the MS.
  • Finally, when comparing the U-values of the MREF without insulation with those cases with insulation corresponding to the blocks made of by-products, significant improvements up to 33.3% (once again for the case of the MS) were reached.
  • MS was revealed as a promising sustainable material for building block walls in terms of energy savings.

Author Contributions

M.M. and Y.G.F. conceived and designed the whole experimental procedure assisted with planning trials, methodology, writing—original draft preparation, and interpretation of results. J.M.B. and J.C. provided constructive instructions in the methodology used for the preparation and post-processing of this study and supervision of the manuscript. All authors contributed equally in the preparation of this manuscript. All authors have read and agreed to the published version of the manuscript.

Funding

This research received no external funding.

Institutional Review Board Statement

Not applicable.

Informed Consent Statement

Not applicable.

Data Availability Statement

Data sharing not applicable.

Acknowledgments

Authors wish to express their gratitude to the IT1314-19 (Basque Government) and GIU19/029 (UPV/EHU) research groups. The authors also are thankful to the companies “Prefabricados Alberdi” S.A. and Smurfit Kappa Nervión S.A. for providing the materials used throughout this work.

Conflicts of Interest

The authors declare no conflict of interest.

Abbreviations

The following abbreviations are used in this manuscript:
AArea of the wall (m2)
AvgAverage
ACIAmerican concrete institute
APDLANSY parametric design language
CADComputer aided design
CFDComputational Fluid Dynamics
CTETechnical code for building
DOEDesign of Experiments
dThickness of the block (mm)
eThickness of the wall (m)
EEmissivity factor
FEMFinite Element Method
GHBGuarded Hot Box
hFilm coefficient (W/m2 K)
hrRadiation coefficient (W/m2 K)
hr0Radiation coefficient for a black surface (W/m2 K)
HVACHeating Ventilation and Air Conditioning
KThermal conductivity (W/m K)
LLength (mm)
MSLMModel of lime sludge
MREFModel of reference
MSModel of sawdust
QHeat flow (W)
qSpecific heat flow (W/m2)
RCoefficient of thermal Resistance (m2 K/W)
SArea of the blocks (mm2)
tTime (s)
TTemperature (°C)
TmAverage thermodynamic temperature
TPSTransient Plane Source method
UThermal transmittance (W/m2 K)
ΔLength Scale
σStefan-Boltzmann constant, (5.67 × 10⁻⁸ W/m2 K4)
εHemispheric emissivity

References

  1. Pei, P.; Huo, Z.; Martínez, O.S.; Crespo, R.G. Minimal Green Energy Consumption and Workload Management for Data Centers on Smart City Platforms. Sustainability 2020, 12, 3140. [Google Scholar] [CrossRef] [Green Version]
  2. Mugnini, A.; Coccia, G.; Polonara, F.; Arteconi, A. Performance Assessment of Data-Driven and Physical-Based Models to Predict Building Energy Demand in Model Predictive Controls. Energies 2020, 13, 3125. [Google Scholar] [CrossRef]
  3. Leang, E.; Tittelein, P.; Zalewski, L.; Lassue, S. Design Optimization of a Composite Solar Wall Integrating a PCM in a Individual House: Heating Demand and Thermal Comfort Considerations. Energies 2020, 13, 5640. [Google Scholar] [CrossRef]
  4. Ribeiro, M.; Fiúza, A.; Ferreira, A.; Dinis, M.; Meira Castro, A.; Meixedo, J.; Alvim, M. Recycling Approach towards Sustainability Advance of Composite Materials’Industry. Recycling 2016, 1, 178. [Google Scholar] [CrossRef] [Green Version]
  5. Del Coz, J.J.; García, P.J.; Domínguez, J.; Suárez, A. Thermal design optimization of light weight concrete blocks for internal one-way spanning slabs floors by FEM. Energy Build. 2009, 41, 1276–1287. [Google Scholar] [CrossRef]
  6. Del Coz, J.J.; García, P.J.; Domínguez, J.; Álvarez, F.P. A FEM comparative analysis of the thermal efficiency among floors made up of clay, concrete and light weight concrete hollow blocks. Appl. Therm. Eng. 2010, 30, 2822–2826. [Google Scholar] [CrossRef] [Green Version]
  7. Omrany, H.; Soebarto, V.; Sharifi, E.; Soltani, A. Application of Life Cycle Energy Assessment in Residential Buildings: A Critical Review of Recent Trends. Sustainability 2020, 12, 351. [Google Scholar] [CrossRef] [Green Version]
  8. Sakir, S.; Raman, S.; Safiuddin, M.; Kaish, A.; Mutalib, A. Utilization of By-Products and Wastes as Supplementary Cementitious Materials in Structural Mortar for Sustainable Construction. Sustainability 2020, 12, 3888. [Google Scholar] [CrossRef]
  9. Alghamdi, A.A.; Alharthi, H.A. Multiscale 3D finite-element modelling of the thermal conductivity of clay brick walls. Constr. Build. Mater. 2017, 157, 1–9. [Google Scholar] [CrossRef]
  10. Michael, J.; Smith, S.H.; Durham, S.A.; Chorzepa, M.G. Crack control in concrete walls through novel mixture design, full-scale testing, and finite element analysis. Constr. Build. Mater. 2018, 166, 301–314. [Google Scholar] [CrossRef]
  11. Yin, Y.; Liu, Y. FEM Analysis of Fluid-Structure Interaction in Thermal Heavy Oil Recovery Operations. Sustainability 2015, 7, 4035–4048. [Google Scholar] [CrossRef] [Green Version]
  12. Oluwole, O.; Joshua, J.; Nwagwo, H. Finite element modeling of low heat conducting building bricks. J. Miner. Mater. Charact. Eng. 2012, 11, 800–806. [Google Scholar] [CrossRef]
  13. Nguyen-Ngoc, H.; Dang, B.L.; Nguyen-Xuan, H.; Thao, H.D.; Abdel Wahab, M. Three-dimensional analysis of an innovative hollow concrete block of interlocking revetment. In International Conference on Numerical Modelling in Engineering; Springer: Ghent, Belgium, 2019; Volume 20, pp. 112–122. ISBN 9789811324048. [Google Scholar]
  14. López-Ruiz, G.; Fernández-Akarregui, A.R.; Diaz, L.; Urresti, I.; Alava, I.; Blanco, J.M. Numerical Study of a Laminar Hydrogen Diffusion Flame Based on the Non-Premixed Finite-Rate Chemistry Model; Thermal NOx Assessment. Int. J. Hydrogen Energy 2019, 44, 20426–20439. [Google Scholar] [CrossRef]
  15. Orlowski, K.; Shanaka, K.; Mendis, P. Manufacturing, Modeling, Implementation and Evaluation of a Weatherproof Seal for Prefabricated Construction. Buildings 2018, 8, 120. [Google Scholar] [CrossRef] [Green Version]
  16. Arendt, K.; Krzaczek, M.; Florczuk, J. Numerical analysis by FEM and analytical study of the dynamic thermal behavior of hollow bricks with different cavity concentration. Int. J. Sci. 2011, 50, 1543–1553. [Google Scholar] [CrossRef]
  17. Sun, J.; Fang, L. Numerical simulation of concrete hollow bricks by the finite volume method. Int. J. Heat Mass Transf. 2009, 52, 5598–5607. [Google Scholar] [CrossRef]
  18. Bouchair, A. Steady state theoretical model of fired clay hollowbricks for enhanced external wall thermal insulation. Build. Environ. 2008, 43, 1603–1618. [Google Scholar] [CrossRef]
  19. Coz, J.J.; Nieto, P.J.G.; Rodríguez, A.M.; Martínez-Luengas, A.L.; Biempica, C.B. Non-linear thermal analysis of light concrete hollow brick walls by the finite element method and experimental validation. Appl. Therm. Eng. 2006, 26, 777–786. [Google Scholar] [CrossRef]
  20. Coz Díaz, J.J.; García Nieto, P.J.; Betegón Biempica, C.; Prendes Gero, M.B. Analysis and optimization of the heat-insulating light concrete hollow brick walls design by the finite element method. Appl. Therm. Eng. 2007, 27, 1445–1456. [Google Scholar] [CrossRef]
  21. Deng, X.; Tan, Z. Numerical analysis of local thermal comfort in a plan office under natural ventilation. Indoor Built Environ. 2020, 29, 972–986. [Google Scholar] [CrossRef]
  22. Yuan, J. Impact of Insulation Type and Thickness on the Dynamic Thermal Characteristics of an External Wall Structure. Sustainability 2018, 10, 2835. [Google Scholar] [CrossRef] [Green Version]
  23. Principi, P.; Fioretti, R. Thermal analysis of the application of pcm and low emissivity coating in hollow bricks. Energy Build. 2012, 51, 131–142. [Google Scholar] [CrossRef]
  24. García, Y.; Cuadrado, J.; Blanco, J.M.; Roji, E. Optimizing the indoor thermal behaviour of housing units in hot humid climates: Analysis and modelling of sustainable constructive alternatives. Indoor Built Environ. 2019, 28, 772–789. [Google Scholar] [CrossRef]
  25. Zukowski, M.; Haese, G. Experimental and numerical investigation of a hollow brick filled with perlite insulation. Energy Build. 2010, 42, 1402–1408. [Google Scholar] [CrossRef] [Green Version]
  26. Ghazi, K.; Tanner, C. U-value of a dried wall made of perforated porous clay bricks: Hotbox measurement versus numerical analysis. Energy Build. 2003, 35, 675–680. [Google Scholar] [CrossRef]
  27. Bouziadi, F.; Boulekbache, B.; Haddi, A.; Djelal, C.; Hamrat, M. Numerical analysis of shrinkage of steelfiber reinforced high-strength concrete subjected to thermal loading. Constr. Build. Mater. 2018, 181, 381–393. [Google Scholar] [CrossRef]
  28. Chen, J.; Chu, R.; Wang, H.; Xie, P. Experimental measurement and microstructure-based simulation of thermal conductivity of unbound aggregates. Constr. Build. Mater. 2018, 189, 8–18. [Google Scholar] [CrossRef]
  29. Park, G.; Lee, C. Experimental and Numerical Study on the Characteristics of the Thermal Design of a Large-Area Hot Plate for Nano imprint Equipment. Sustainability 2019, 11, 4795. [Google Scholar] [CrossRef] [Green Version]
  30. Wang, R.; Yang, C.; Ni, L.; Yao, Y. Experimental study on heat transfer of soil with different moisture contents and seepage for ground source heat pump. Indoor Built Environ. 2020, 29, 1238–1248. [Google Scholar] [CrossRef]
  31. Li, L.P.; Wu, Z.G.; He, Y.L.; Lauriat, G.; Tao, W.Q. Optimization of the configuration of 290×140×90 hollow clay bricks with 3-D numerical simulation by finite volume method. Energy Build. 2008, 40, 1790–1798. [Google Scholar] [CrossRef]
  32. Al-Hazmy, M.M. Analysis of coupled natural convection–conduction effects on the heat transport through hollow building blocks. Energy Build. 2006, 38, 515–521. [Google Scholar] [CrossRef]
  33. Blanco, J.M.; Buruaga, A.; Cuadrado, J.; Zapico, A. Assessment on the influence of the façade location and orientation in the thermal behavior of double skin building envelopes with perforated metal sheets, through Design Builder; A case study in Spain. Build Environ. 2019, 163, 106325. [Google Scholar] [CrossRef]
  34. Madrid, M.; Orbe, A.; Carré, H.; García, Y. Thermal performance of sawdust and lime-mud concrete masonry units. Constr. Build. Mater. 2018, 169, 113–123. [Google Scholar] [CrossRef]
  35. Madrid, M.; Orbe, A.; Rojí, E.; Cuadrado, J. The effects of by-products incorporated in low-strength concrete for concrete masonry units. Constr. Build. Mater. 2017, 153, 117–128. [Google Scholar] [CrossRef]
  36. Pešta, J.; Pavlů, T.; Fořtová, K.; Kočí, V. Sustainable Masonry Made from Recycled Aggregates: LCA Case Study. Sustainability 2020, 12, 1581. [Google Scholar] [CrossRef] [Green Version]
  37. Fava, G.; Naik, T.; Pierpaoli, M. Compressive Strength and Leaching Behavior of Mortars with Biomass Ash. Recycling 2018, 3, 46. [Google Scholar] [CrossRef] [Green Version]
  38. Nowoświat, A.; Gołaszewski, J. Influence of the Variability of Calcareous Fly Ash Properties on Rheological Properties of Fresh Mortar with Its Addition. Materials 2019, 12, 1942. [Google Scholar] [CrossRef] [Green Version]
  39. UNEStd. UNE-EN 998-1:2010—Specification for Mortar for Masonry–Part 1: Rendering and Plastering Mortar; European Committee for Standardization: Brussels, Belgium, 2010. [Google Scholar]
  40. Kisilewicz, T. On the Role of External Walls in the Reduction of Energy Demand and the Mitigation of Human Thermal Discomfort. Sustainability 2019, 11, 1061. [Google Scholar] [CrossRef] [Green Version]
  41. Coz, J.J.; Nieto, P.J.G.; Sierra, J.L.S.; Biempica, C.B. Nonlinear thermal optimization of external light concrete multi-holed brick walls by the finite element method. Int. J. Heat Mass Transf. 2008, 51, 1530–1541. [Google Scholar] [CrossRef]
  42. Nshimiyimana, P.; Messan, A.; Courard, L. Physico-Mechanical and Hygro-Thermal Properties of Compressed Earth Blocks Stabilized with Industrial and Agro By-Product Binders. Materials 2020, 13, 3769. [Google Scholar] [CrossRef]
  43. UNEStd. UNE-EN ISO 8990—Thermal Insulation. Determination of Steady-State Thermal Transmission Properties—Calibrated and Guarded Hot Box; European Committee for Standardization: Brussels, Belgium, 1997. [Google Scholar]
  44. Gustafsson, S.E. Transient plane source techniques for thermal conductivity and thermal diffusivity measurements of solid materials. Rev. Sci. Instrum. 1991, 62, 797–804. [Google Scholar] [CrossRef]
  45. European Committee for standardization. ISO 22007-2:2015—Plastics—Determination of Thermal Conductivity and Thermal Diffusivity—Part 2: Transient plane Heat Source (Hot Disc) Method; ISO: Genève, Switzerland, 2015. [Google Scholar]
  46. Szoke, S.S.; ACI/TMS Committee 122. ACI 122R-14—Guide to Thermal Properties of Concrete and Masonry Systems; American Concrete Institute: Farmington Hills, MI, USA, 2014; ISBN 978-0-87031-971-6. [Google Scholar]
  47. Avdelidis, N.P.; Moropoulou, A. Emissivity considerations in building thermography. Energy Build. 2003, 35, 663–667. [Google Scholar] [CrossRef]
  48. Coz Díaz, J.J.; García, P.J.; Álvarez, F.P.; Lozano, A. Design and shape optimization of a new type of hollow concrete masonry block using the finite element method. Eng. Struct. 2011, 33, 1–9. [Google Scholar] [CrossRef]
  49. Luo, Y.; Kang, Z. Topology optimization of continuum structures with Drucker–Prager yield stress constraints. Comput. Struct. 2012, 90, 65–75. [Google Scholar] [CrossRef]
  50. Turgay, T.; Köksal, H.O.; Polat, Z.; Karakoc, C. Stress–strain model for concrete confined with CFRP jackets. Mater. Des. 2009, 30, 3243–3251. [Google Scholar] [CrossRef]
  51. Available online: https://www.ansys.com/products/fluids/ansys-fluent (accessed on 22 November 2020).
  52. Stitic, A.; Nguyen, A.; RezaeiRad, A.; Weinand, Y. Numerical Simulation of the Semi-Rigid Behaviour of Integrally Attached Timber Folded Surface Structures. Buildings 2019, 9, 55. [Google Scholar] [CrossRef] [Green Version]
  53. Del Coz Díaz, J.J.; García Nieto, P.J.; Suárez Sierra, J.L.; Peñuelas Sánchez, I. Non-linear thermal optimization and design improvement of a new internal light concrete multi-holed brick walls by FEM. Appl. Therm. Eng. 2008, 28, 1090–1100. [Google Scholar] [CrossRef]
  54. Lee, S.W.; Leigh, S.B.; Kim, T.; Cheong, C.H.; Cho, S. Cooling energy reduction effect of parallel double-window system operation in residential buildings in South Korea. Indoor Built Environ. 2019, 28, 636–658. [Google Scholar] [CrossRef]
  55. UNEStd. UNE-EN 1745: 2020—Masonry and Masonry Products—Methods for Determining Thermal Properties; European Committee for Standardization: Brussels, Belgium, 2020. [Google Scholar]
  56. UNEStd. UNE-EN ISO 6946: 2012—Building Components and Building Elements—Thermal Resistance and Thermal Transmittance—Calculation Method; European Committee for Standardization: Brussels, Belgium, 2012. [Google Scholar]
  57. Release, A.12.0 Documentation; Ansys Inc.: Canonsburg, PA, USA, 2009; Available online: https://www.ansys.com/-/media/ansys/corporate/resourcelibrary/article/aa-v3-i1-full-version.pdf (accessed on 3 January 2020).
  58. Al-Tamimi, A.S.; Baghabra, O.S.; Al-Osta, M.A.; Ali, M.R.; Ahmad, A. Effect of insulation materials and cavity layout on heat transfer of concrete masonry hollow blocks. Constr. Build. Mater. 2020, 254, 119300. [Google Scholar] [CrossRef]
  59. Hichem, N.; Noureddine, S.; Nadia, S.; Djamila, D. Experimental and Numerical Study of a Usual Brick Filled with PCM to Improve the Thermal Inertia of Buildings. Energy Procedia 2013, 36, 766–775. [Google Scholar] [CrossRef] [Green Version]
  60. Zhang, C.; Chen, Y.; Wu, L.; Shi, M. Thermal response of brick wall filled with phase change materials (PCM) under fluctuating outdoor temperatures. Energy Build. 2011, 43, 3514–3520. [Google Scholar] [CrossRef]
  61. Blanco, J.M.; Buruaga, A.; Rojí, E.; Cuadrado, J.; Pelaz, B. Energy assessment and optimization of perforated metal sheet double skin façades through Design Builder; A case study in Spain. Energy Build. 2016, 111, 326–336. [Google Scholar] [CrossRef]
  62. Antar, M.A.; Baig, H. Conjugate conduction-natural convection heat transfer in a hollow building block. Appl. Therm. Eng. 2009, 29, 3716–3720. [Google Scholar] [CrossRef]
  63. Ministerio de Fomento. CTE-DB SE-F—Código Técnico de la Edificación—(Technical code for Building): Documento Básico Seguridad Estructural: Fábrica; 2019 Royal Decree 732/2019; Ministerio de Fomento: Madrid, Spain, 2019.
Figure 1. Thermal constants analyzer TPS 2500 S: (a) Hot Disk, (b) sensor.
Sustainability 13 00386 g001
Figure 2. Appearance of the three types of blocks: (a) MSML, (b) MS, and (c) MREF.
Sustainability 13 00386 g002
Figure 3. Real geometry of a row of the wall, (a) upper view and (b) lower view.
Sustainability 13 00386 g003
Figure 4. Simplified geometry of the model (mm), (a) plan view of the wall, and (b) sections of the block, with the real geometry for both upper and lower views (dashed lines) and the representative geometry (solid lines).
Sustainability 13 00386 g004
Figure 5. Lengths “b” perpendicular to the heat flow, and thicknesses “d” parallel to the heat flow.
Sustainability 13 00386 g005
Figure 6. Real areas and lengths of the internal holes of the blocks, (a) upper view, (b) lower view, and (c) gap formed by the joint of the blocks.
Sustainability 13 00386 g006
Figure 7. Global aspect of the final mesh of the whole model with the empty cavities.
Sustainability 13 00386 g007
Figure 8. Representation of all the elements in the model.
Sustainability 13 00386 g008
Figure 9. Boundary conditions of the model.
Sustainability 13 00386 g009
Figure 10. Temperature distribution for the walls without insulation: (a) MREF, (b) MS, and (c) MSLM.
Sustainability 13 00386 g010
Figure 11. Global aspect of the mesh of the model with insulation inside the cavities.
Sustainability 13 00386 g011
Figure 12. Representation of the elements in the wall.
Sustainability 13 00386 g012
Figure 13. Temperature distribution for the walls with insulation: (a) MREF, (b) MS, and (c) MSLM.
Sustainability 13 00386 g013
Table 1. Main features of the Hot Disk TPS 2500 S.
Thermal Conductivity0.005 to 1800 W/m K.
Thermal Diffusivity0.01 to 1200 mm2/s.
Specific Heat CapacityUp to 5 MJ/m3K.
Measurement Time1 to 2560 s.
Accuracy1%.
TemperatureRange−253 to 1000 °C.
Core InstrumentAmbient
With FurnaceUp to 750 °C [1000 °C oxygen free].
With Circulator−35 to 200 °C.
Table 2. Thermal conductivity of materials corrected for moisture.
MaterialDry Thermal Conductivity [W/m K]Moisture Correction Factor ACI 122R-14Corrected Thermal Conductivity [W/m K]
MREF1.121.221.37
MS0.831.251.04
MSLM0.921.251.15
Mortar0.701.200.84
Table 3. Final dimensions of the two types of holes.
DimensionsUnitsHole of the BlocksHole between Blocks
Area (S)mm214,908.603313.98
Length (b)mm130.5028.40
Thickness (d)mm118.36114.24
Table 4. Thermal characterization of the different holes.
PropertiesUnitInternal Block HoleJoint of Blocks
ε 1 = ε 2 Dimensionless0.950.94
EDimensionless0.890.89
h r 0 W/m2 K5.145.14
h r W/m2 K3.422.68
Table 5. Temperatures obtained from the numerical analysisfor the block walls without insulation (model).
Wall Temperature (°C)MREFMSMSLM
Avg.Min.Max.Avg.Min.Max.Avg.Min.Max.
Hot side18.117.418.820.319.521.119.518.720.3
Cool side6.76.37.06.76.37.06.76.37.0
Table 6. Temperatures obtained through the experimental tests for the block walls without insulation (experim).
Wall Temperature (°C)MREFMSMSLM
Avg.Min.Max.Avg.Min.Max.Avg.Min.Max.
Hot side19.217.619.319.618.420.719.419.119.9
Cool side7.36.87.97.57.18.17.37.28.1
Table 7. Thermal resistance, conductivity, and transmittance of the walls obtained from the simulations (model) compared to the values from the experimental tests (experim.).
Wall TypeR (m2 K/W) K (W/m K)U (W/m2 K)
ModelExperim.ModelExperim.ModelExperim.
MREF0.290.270.660.692.192.26
MS0.340.330.550.601.962.05
MSLM0.320.300.590.632.042.10
Table 8. Temperatures obtained with the thermal-numerical analysis, for the walls of blocks filled with insulation.
Wall Temperature (°C)MREFMSMSLM
Avg.Min.Max.Avg.Min.Max.Avg.Min.Max.
Hot side22.721.424.027.325.728.925.524.027.0
Cool side6.76.17.36.76.17.36.76.17.3
Table 9. Thermal resistance, thermal conductivity, and U-value of the walls with and without insulation, obtained from the simulations.
Wall TypeR (m2 K/W) K U (W/m2 K)
With InsulationWithout
Insulation
With InsulationWithout
Insulation
With InsulationWithout
Insulation
MREF0.400.290.4750.6641.752.19
MS0.520.340.3690.5571.461.96
MSLM0.470.320.4040.5911.562.04
Publisher’s Note: MDPI stays neutral with regard to jurisdictional claims in published maps and institutional affiliations.

