Article

Identification and Prediction of Wetland Ecological Risk in Key Cities of the Yangtze River Economic Belt: From the Perspective of Land Development

1
College of Resources and Environmental Sciences, Henan Agricultural University, Zhengzhou 450002, China
2
School of Resource and Environmental Sciences, Wuhan University, Wuhan 430079, China
3
College of Water Sciences, Beijing Normal University, Beijing 100875, China
4
College of Land Management, Huazhong Agricultural University, Wuhan 430070, China
5
College of Plant Protection, Henan Agricultural University, Zhengzhou 450002, China
*
Authors to whom correspondence should be addressed.
Sustainability 2021, 13(1), 411; https://0-doi-org.brum.beds.ac.uk/10.3390/su13010411
Submission received: 7 December 2020 / Revised: 31 December 2020 / Accepted: 31 December 2020 / Published: 5 January 2021

Abstract

:
Rapid urbanization aggravates the degradation of wetland function. However, few studies have quantitatively analyzed and predicted the comprehensive impacts of different scenarios and types of human activities on wetland ecosystems from the perspective of land development. Combined with the Habitat Risk Assessment (HRA) model and the Cellular Automata (Ca)-Markov model, this study quantitatively measured the impact intensity and spatial distribution of different types of human activities on the wetland ecosystem in 2015, simulated and predicted the ecological pressure on the wetland in 2030, and identified the ecological risk hotspots of the Yangtze River waterfront along the upper, middle, and lower reaches of the Yangtze River Economic Belt. The results showed that the ecological risk of wetlands in the study area was low in the urban core and high in the suburbs. Construction activities posed a greater risk to wetlands. The intensity of human activities in the ecological protection scenario will be significantly lower than that in the natural development scenario in 2030. The waterfront in the middle and lower reaches of the Yangtze River will face more ecological risks. The results of the study can provide theoretical and technical support for wetland conservation policy formulation and waterfront development in the Yangtze River Economic Belt.

1. Introduction

Wetland, known as the “kidney of the earth”, can provide a variety of ecosystem services, such as carbon storage, biodiversity conservation, and climate regulation [1,2,3,4]. With the development of science and technology and the dramatic increase in population, human activities have had a major impact on the environment in the past few decades [5,6]. A series of factors, including urbanization, infrastructure construction, and agricultural activities, have led to and are accelerating environmental problems, such as the deterioration of water quality in wetlands, the decline in biodiversity, and lake shrinking [7,8,9]. These environmental problems have led to a reduction in the supply of ecosystem services [10,11,12,13]. Due to economic development and human disturbance, more than half of the world’s wetlands have disappeared, while the existing wetlands are still deteriorating [14,15]. To address this challenge, scientists, policymakers, governments, and stakeholders call for ecosystem-based management to understand the impact of the location and intensity of human activities on wetland ecosystems, and to comprehensively manage wetlands to ensure the sustainable supply of these services [16].
The previous studies about wetlands mainly focused on wetland changes [1], the impact of human activities on wetlands [17,18], the ecological effects of wetland evolution [19,20], wetland ecosystem assessment [1,21], wetland restoration [22], and the carbon cycle [23,24]. However, few studies focus on the impact of the location and intensity of human activities on wetland ecosystems. Because of the different location and intensity of human activities, it has been difficult to quantify the intensity of human activities on wetlands. Recently, some scholars have used hemeroby index [25,26] to study the effects of human activities on wetlands to analyze the effects of human activities on wetland ecosystem evolution and landscape patterns from the perspective of specific human activities [27]. Hemeroby is a comprehensive index used to measure the impact and degree of all human interventions on ecological components or ecosystems, which is related to human disturbance in landscape [25]. However, the combined effects of different types of human activities on wetland ecosystems are difficult to discern from previous studies. In addition, most of the current studies involve factor analysis of ecological pressure, and there are few quantitative studies to predict the pressure on wetlands.
Ecological risk assessment (ERA) represents an effective tool for wetland ecosystem management. As a new tool that can link human activities with the environment, ERA can quantitatively assess potential ecological risks. ERA generates scientific information for planning how to reduce pollution and other ecological damage to support the decision-making needs of environmental managers. Many studies demonstrated that ERA can effectively evaluate structural and functional responses in various ecosystems [28,29]. Currently, several studies have applied ERA to assess the ecological risk of wetlands [30,31]. However, the traditional ERA is based on existing knowledge and analytical techniques, such as ecotoxicology, environmental chemistry, and biology [32]. Research on risk receptors mainly focuses on species and populations on the micro-scale. The main process of ERA is to estimate the potential hazards or threats of stressors (chemical, physical, or biological) to wetland biology and/or abiotic components [33]. However, the assessment is not only costly, but also difficult to quantitatively predict the pressure on wetlands. Many ERAs are limited to specific regions, states, or wetland types, and no evaluation index system and evaluation standards have yet been established [34]. Many studies have only superimposed multiple stressors or risk sources, but still lack a regional cumulative or comprehensive risk assessment [35]. Most ERAs have been limited to the study of the aquatic environment, and the required ecotoxicological data are challenging to collect, organize, and integrate.
The Stanford University Natural Capital Project team recently developed the Habitat Risk Assessment (HRA) model, which allowed users to assess the threats to ecosystems and species health from human activities. We can use this model to analyze the location and intensity of human impacts on nearshore ecosystems to identify areas of greatest risk of degradation and their primary causes. The model has been successfully applied around the world [34,36,37,38,39,40]. The model can use land-use data to evaluate the impact of human activities on the environment from the land development perspective [34,40]. Land-use type is the result of the interaction between human activities and natural processes, and is a comprehensive reflection of human economic and social activities on the land surface and the natural environment [41]. Compared with ecotoxicological data, the widespread application of remote sensing technology is a guarantee for land use data acquisition. Zhai [34] and Chen [40] have demonstrated that HRA can be performed using land-use data. In addition, the Cellular Automata (Ca)-Markov model combines the ability of CA to simulate the spatial variation of complex systems and the advantages of Markov’s long-term prediction, and can effectively simulate the spatial variation of land use patterns [42,43,44]. By combining the two models, this study can analyze the comprehensive impact of various human activities on wetland ecosystems and quantitatively predict the ecological pressure of future wetlands.
Chongqing, Wuhan, and Nanjing are typical urban representatives of the upper, middle, and lower reaches of the Yangtze River, and dense wetlands are distributed in each city. As a special ecological system, the urban wetland is an important part of the urban environment [45,46]. It plays an indispensable role in conserving water sources, preventing floods, ensuring urban security, regulating urban microclimate, and alleviating urban heat island effects [2,47,48]. With the rapid development of the social economy and the dramatic increase in population, the urban wetland has become fragmented. The ecological degradation trend has further intensified, seriously affecting the urban human settlement environment [49]. Accurate assessment of the impact of human activities on wetland ecosystems is important for the overall management of wetland ecosystems. Owing to the continuous urbanization, waterfront development and utilization is a major urgent. Nowadays, the resources of the Yangtze River waterfront are being exploited at an unprecedented rate. During the development process, many environmental problems, such as shrinkage of the wetland area, degradation of ecosystems, and biodiversity reduction, are inevitable. Currently, studies on the Yangtze River waterfront mainly involves the evolution of the Yangtze River waterfront, waterfront development suitability assessment, and waterfront zoning [50]. There are relatively few studies on the impact of human activities on the waterfront. In 2015, the Yangtze River Economic Belt was officially recognized as China’s three major development strategies by the Chinese government. The contradiction between the development of the Yangtze River waterfront and the protection of wetlands represents a source of contention. Moreover, in the Outline of the Development Plan for the Yangtze River Economic Belt, 2030 was also a crucial development node. Therefore, this study selected Chongqing, Wuhan, and Nanjing as the study areas. Cellular automata (CA)-Markov model was used to simulate and predict the land use pattern of natural development and ecological protection scenarios in the study area in 2030 through scenario setting. Combined with HRA model, this study quantificationally measured the location and intensity of different types of human activities on the wetland ecosystem in 2015 and different scenarios in 2030 and finally identified the hot spots of ecological risk in different cities along the Yangtze River. The research results could provide references for formulating policies for the waterfront development and wetland protection along the Yangtze River Economic Belt.

2. Materials and Methods
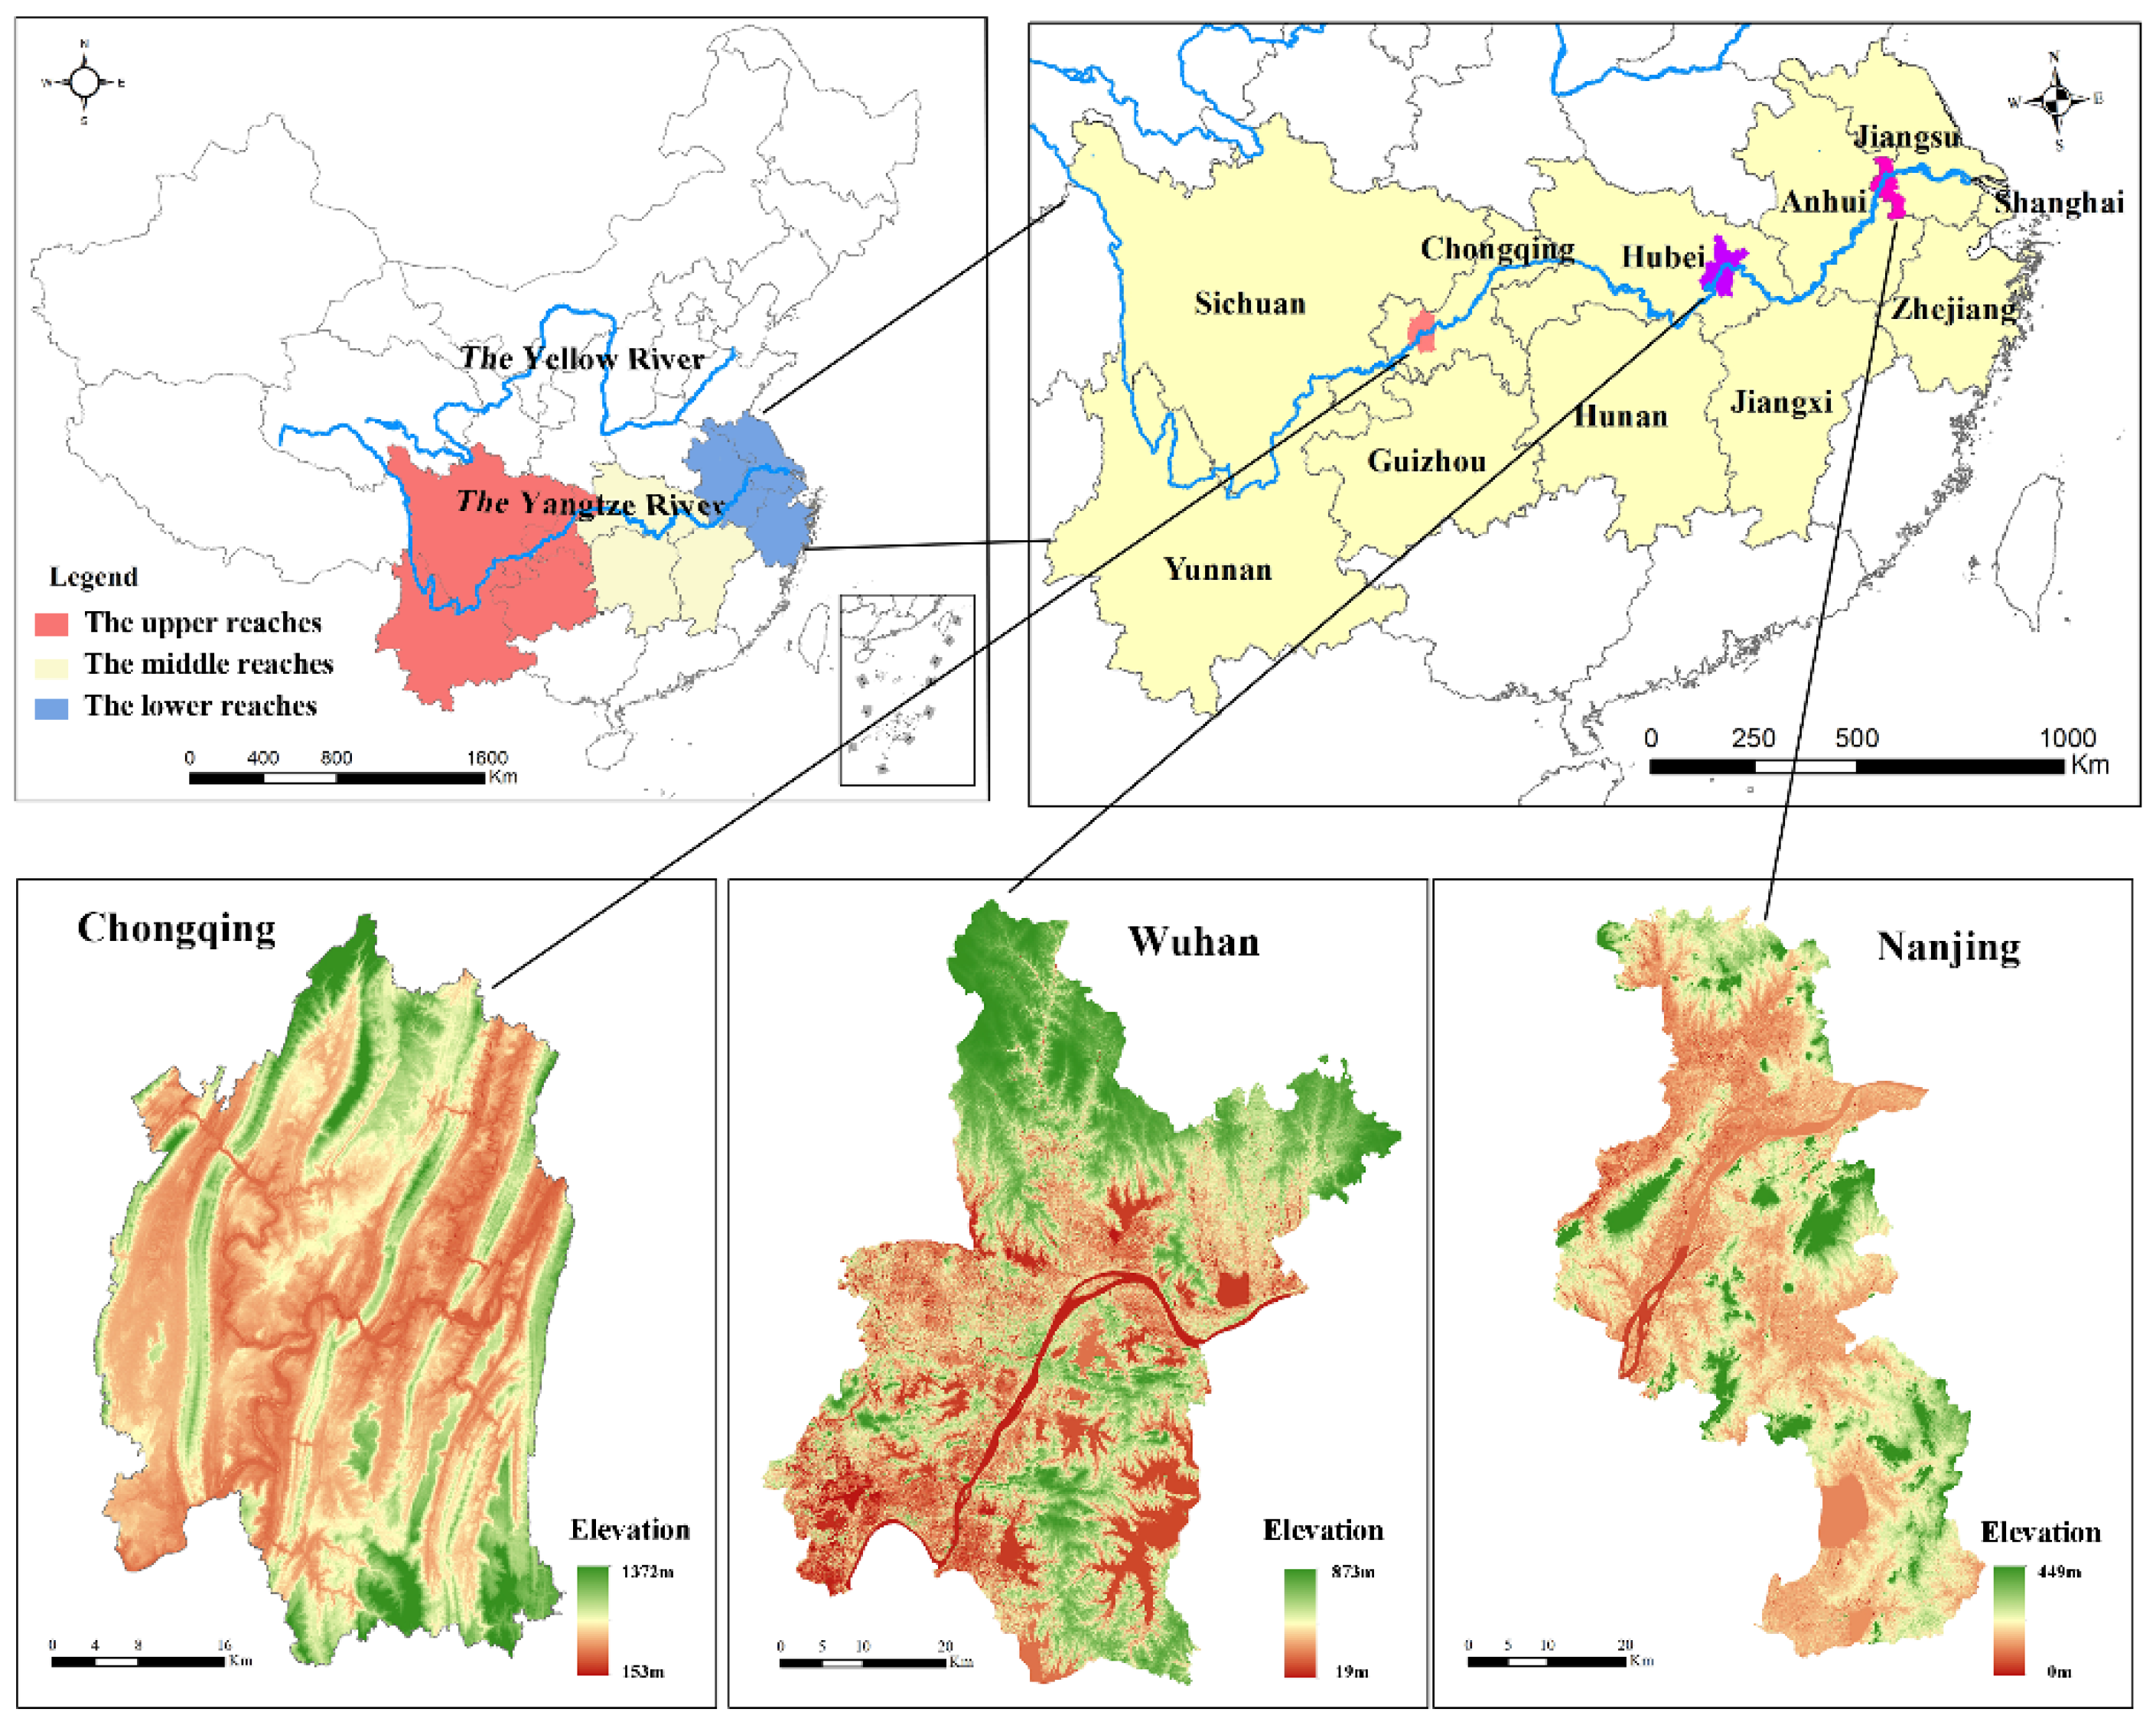
2.1. Study Area

The Yangtze River Economic Belt is an important axis spanning the east and west of China, with a total area of about 2.05 million square kilometers [51]. It is the most populous watershed economic belt in the world. Cities around the shoreline are densely populated. Among them, Chongqing, Wuhan, and Nanjing are the core cities of the Yangtze River main stream, as well as the representative cities in the upper, middle, and lower reaches of the Yangtze River Basin [52], as shown in Figure 1. Wuhan and Chongqing have been supported by the central government to establish a national central city. Nanjing is the only city defined as a “mega-city” by the State Council of China. The education, scientific research, and medical care of the three cities are relatively developed. They have efficient transportation and urban infrastructure, and their comprehensive economic competitiveness far exceeds that of other second-tier cities. The three cities are rich in wetland resources, and the trunk and tributaries of the Yangtze River flow through the urban areas. However, in the process of rapid urbanization and industrialization, a variety of human activities have posed a serious threat to the wetland environment, and the systematic management of urban wetland needs to be strengthened. Chongqing is a municipality and has a large area. Therefore, this study selected the metropolitan area in the urban and rural master plan of Chongqing.

2.2. Data Sources and Processing

The land use data of Chongqing, Wuhan, and Nanjing from 1990 to 2015 were provided by the Resource and Environmental Science Data Center (RESDC) (http://www.resdc.cn/). The resolution was 30 m. The data include six primary types, and 25 s-class types. To facilitate the study, 25 s-class types were merged into nine categories, including paddy field, dryland, grassland, woodland, wetland, city, rural settlement, other construction land, and barren land. Elevation data with a resolution of 30 m was obtained from ASTER Global DEM Version 2 (GDEMV2) data. Slope data was calculated by ArcGIS and road data was obtained from local land departments.
Different land-use types represent different human activities here. In this study, the wetland was taken as the object of habitat risk assessment. Meanwhile, dryland, city, rural settlement, and other construction land were selected as habitat threats. Dryland represented agricultural development; city represented urban development; rural settlement represented rural development; and other construction land represented urban infrastructure construction. Sharp [53] showed that there may also be potential threats beyond the boundaries of specific areas. Considering that anthropogenic impacts had an extension beyond the area in which they were located, this study treated the overlap between anthropogenic activities and their buffer zones and wetlands as part of the spatial and temporal overlap between anthropogenic ecological stressors and wetlands [34]. Referring to Chen’s findings [40], buffer zones were established for different ecological stressors. The software used includes ArcGIS, IDRISI, and InVEST.

2.3. Research Methods

2.3.1. CA-Markov Model

Cellular automata (CA) is a dynamic system with discrete-time, space, and state. Cellular space, cell and states, neighbors, and transition rules are the components of the model. CA is not a definite mathematical function, but a bottom-up research idea, that is, the simple behavior of local cellular individuals can produce a global, orderly pattern of complex systems [54]. So it can be expressed as follows:
S t + 1 = f N ( S t )
where S is the limited set with discrete cellular states, f is a transfer function that defines the transition of the cell from moment t to moment t + 1, and N is the neighborhoods of the cell.
The Markov model is a predictive model based on the current situation of events to predict possible changes in the future, characterized by stability and no aftereffects. Land use and land cover change is also characterized by no aftereffects; the Markov model can predict the trend of land use and land cover change [55,56]. The formula for the Markov model is as follows:
X ( t + 1 ) = X ( t ) × P
P = ( P i j ) = [ P 11 P 12 P 1 m P 21 P 22 P 2 m P m 1 P m 2 P m m ]
where X ( t ) is the state of the random event at time t, X ( t + 1 ) is the state of the random event at time t + 1,   P is the state transition probability matrix. The transfer matrix has two properties: 0 ≤ Pij ≤ 1 and   P i   =   1 . The key to land use/cover prediction using Markov model is to determine state transition probability matrix P.
The accuracy of the simulation results is evaluated using Kappa coefficient [57]. The calculation formula is expressed as:
K = ( P o P c ) / ( 1 P c )
where K is Kappa index, P o is the ratio of correct simulation, and P c is the correct analog ratio expected for random conditions. The Kappa coefficient is between −1 and 1.
CA-Markov model can reconstruct the spatial pattern of land use in the future based on the quantitative prediction of Markov model, so as to improve the efficiency of land use model [58,59,60]. The specific steps are as follows:
(1).
Transformation rules. Based on the land use data of 2005 and 2010 in the study area, this study used the Markov model to set the data interval and forecast time period to 5 years, and the proportional error was set to 0.15 to obtain the land use conversion area and conversion probability matrix from 2005 to 2010.
(2).
Making suitability atlas. With reference to the relevant studies [61,62] and the characteristics of the study area, this study took wetland as the limiting factor. Elevation, slope, distance from urban construction land, distance from the road, and distance from the wetland was selected as the limiting conditions in this paper. The suitability atlas of the study area was made by using multi-criteria evaluation (MCE) and Collection Edit module, and the state of the cell at the next moment was determined according to the suitability atlas.
(3).
Determination of CA filter. Referring to related study results [57,58], a 5 × 5 CA model spatial filter was constructed.
(4).
Model verification. With 2010 as the starting time, this study set the number of CA iterations as 5, and simulated the land use pattern of the study area in 2015 by combining the suitability atlas and the land use transfer matrix. Then the Kappa coefficient was used to compare the simulation results with actual land use data in the study area in 2015 to verify the feasibility of the model. Kappa coefficients of Chongqing, Wuhan, and Nanjing were 0.8526, 0.9002, and 0.8913, respectively, indicating that the experimental results were ideal and can meet the simulation requirements.
(5).
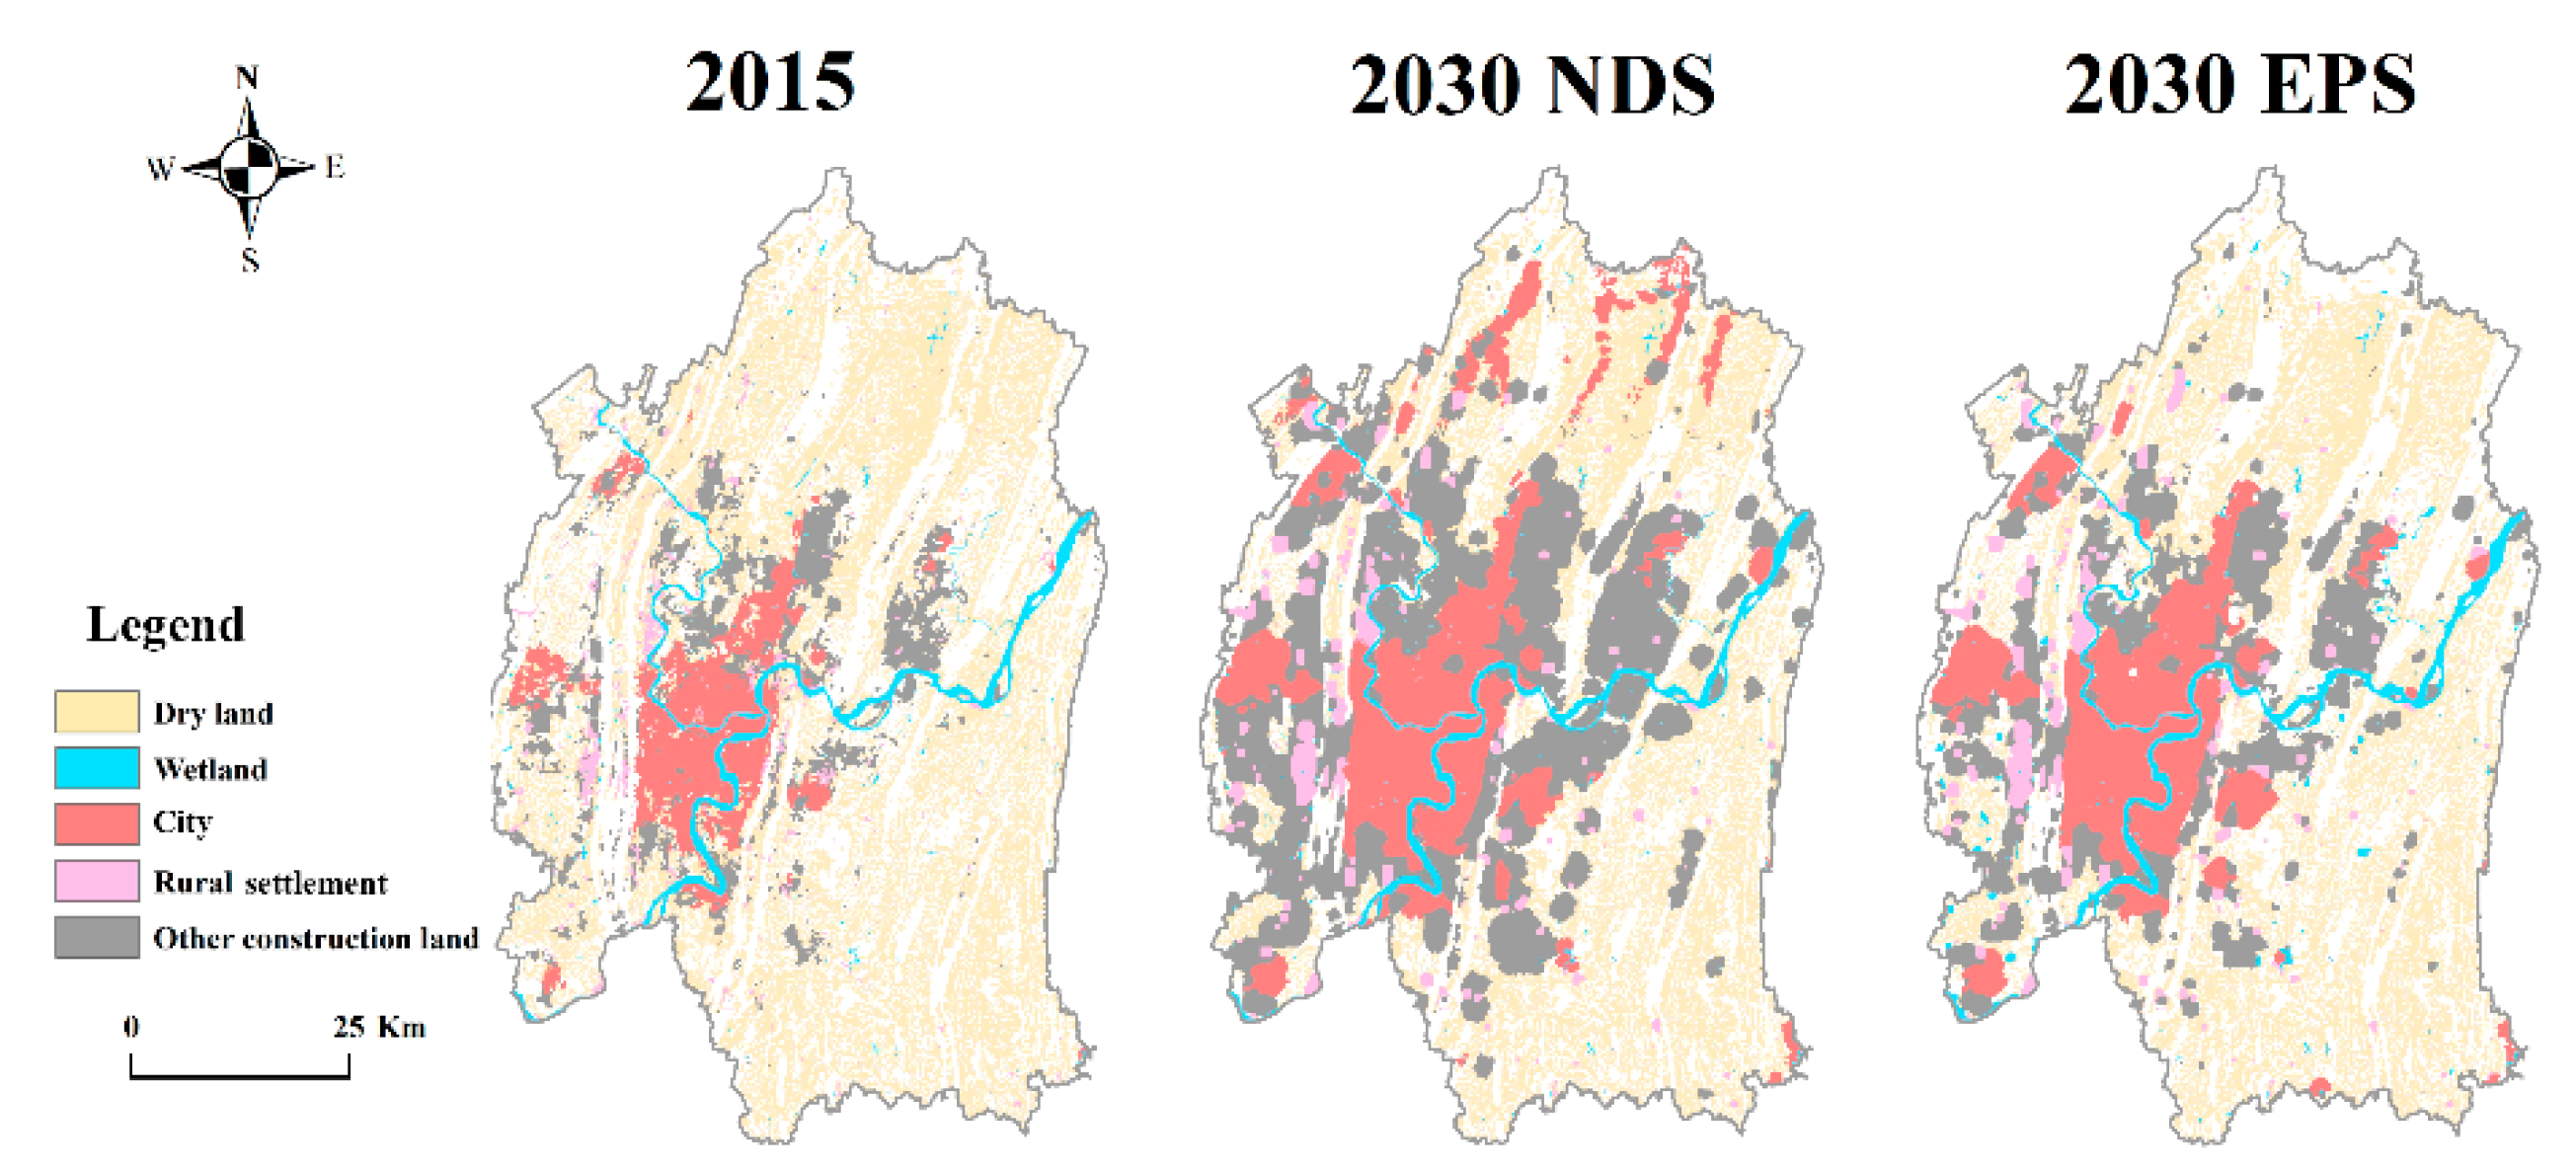
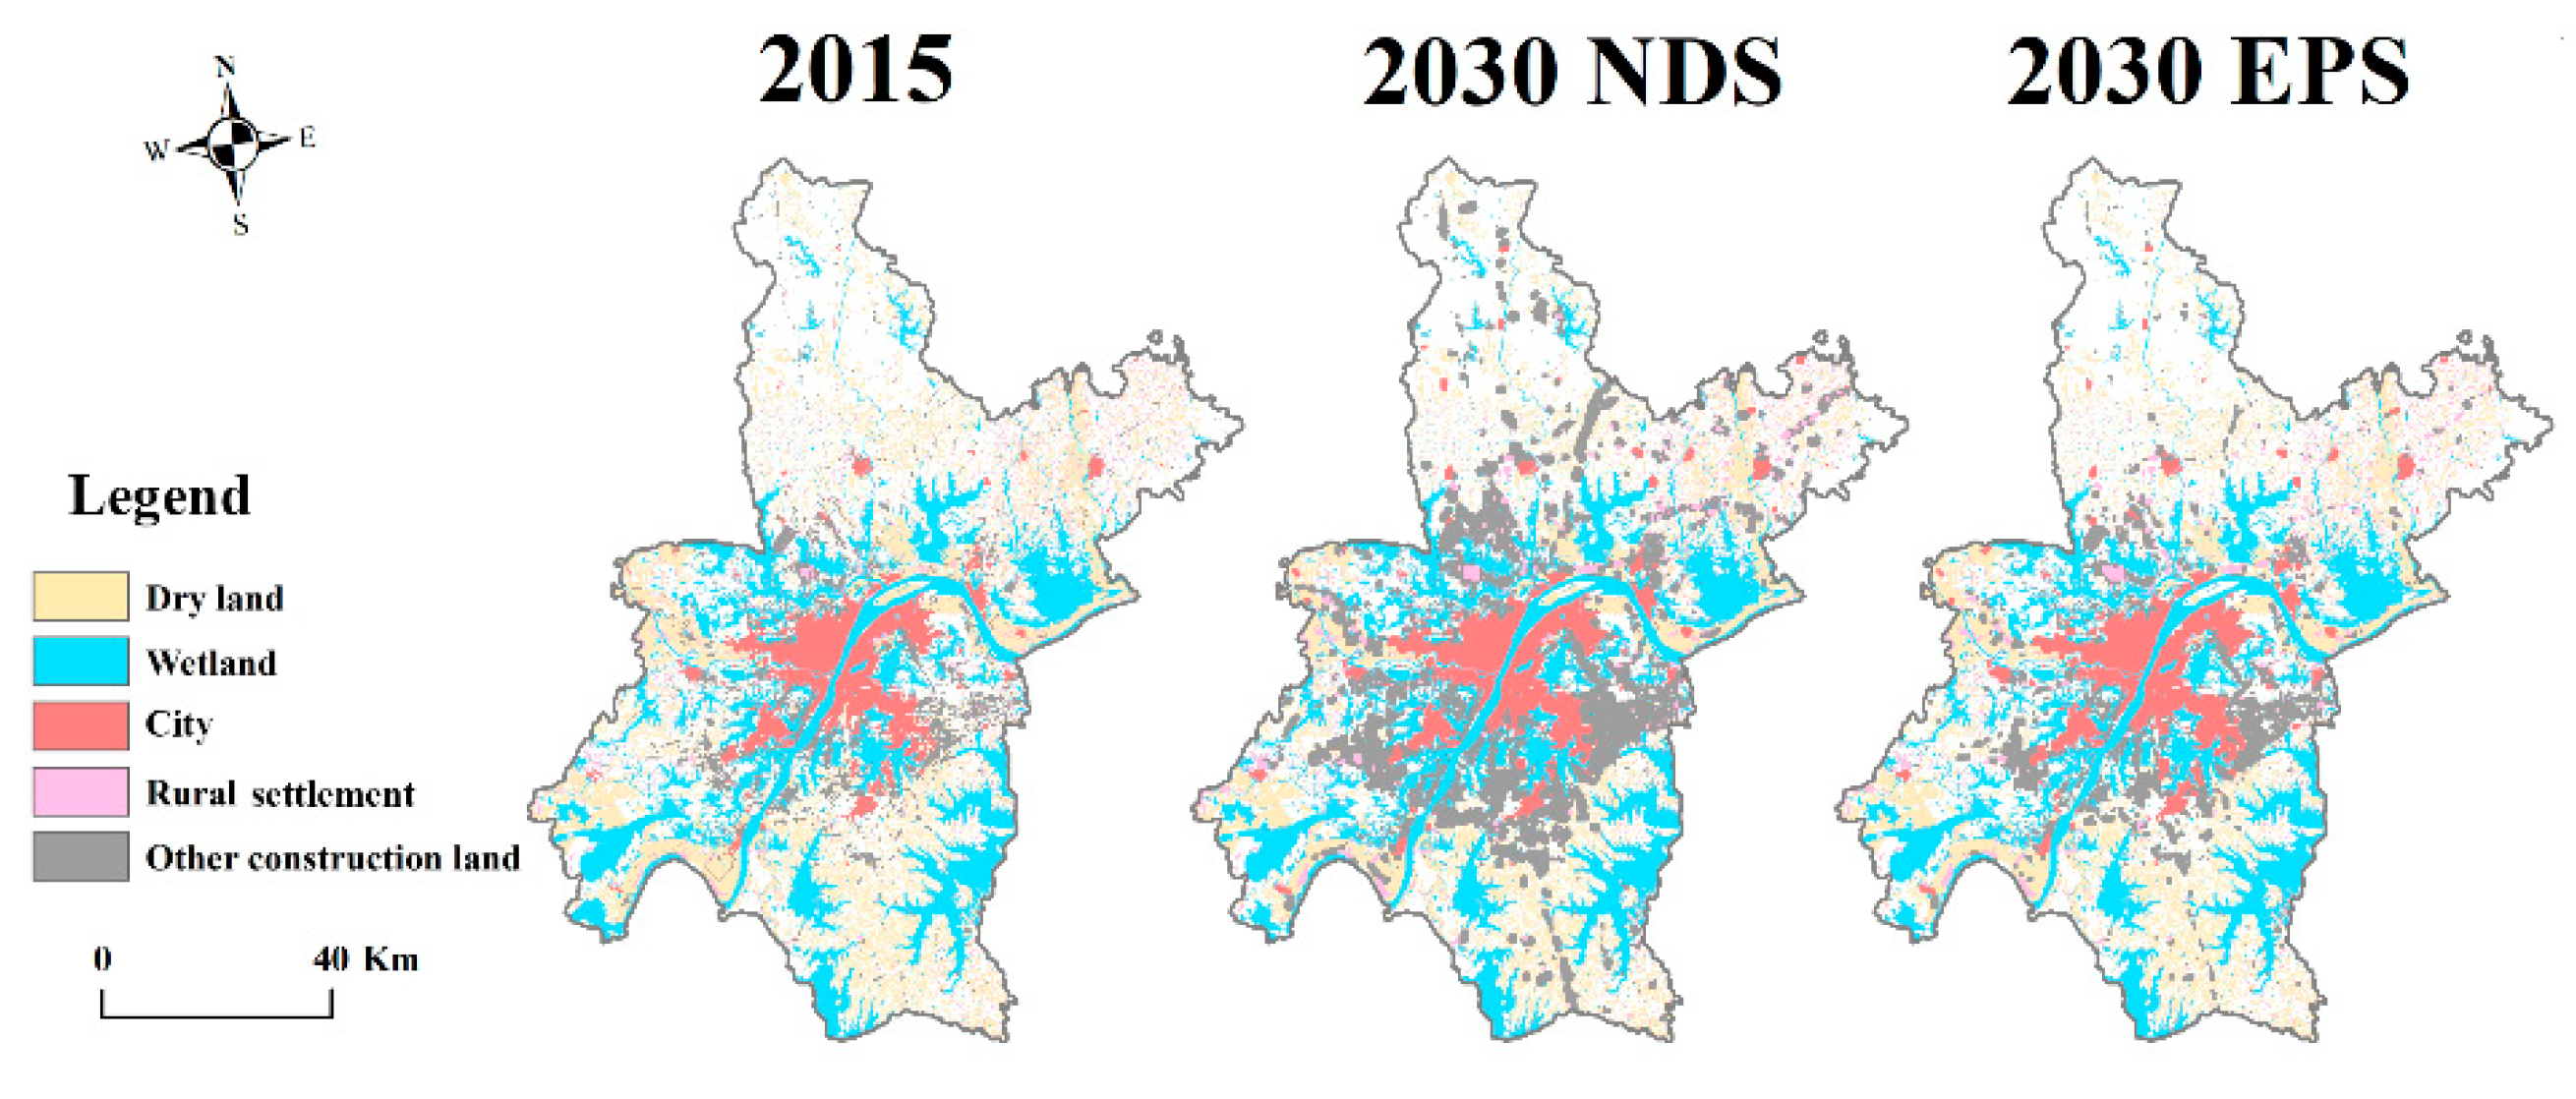
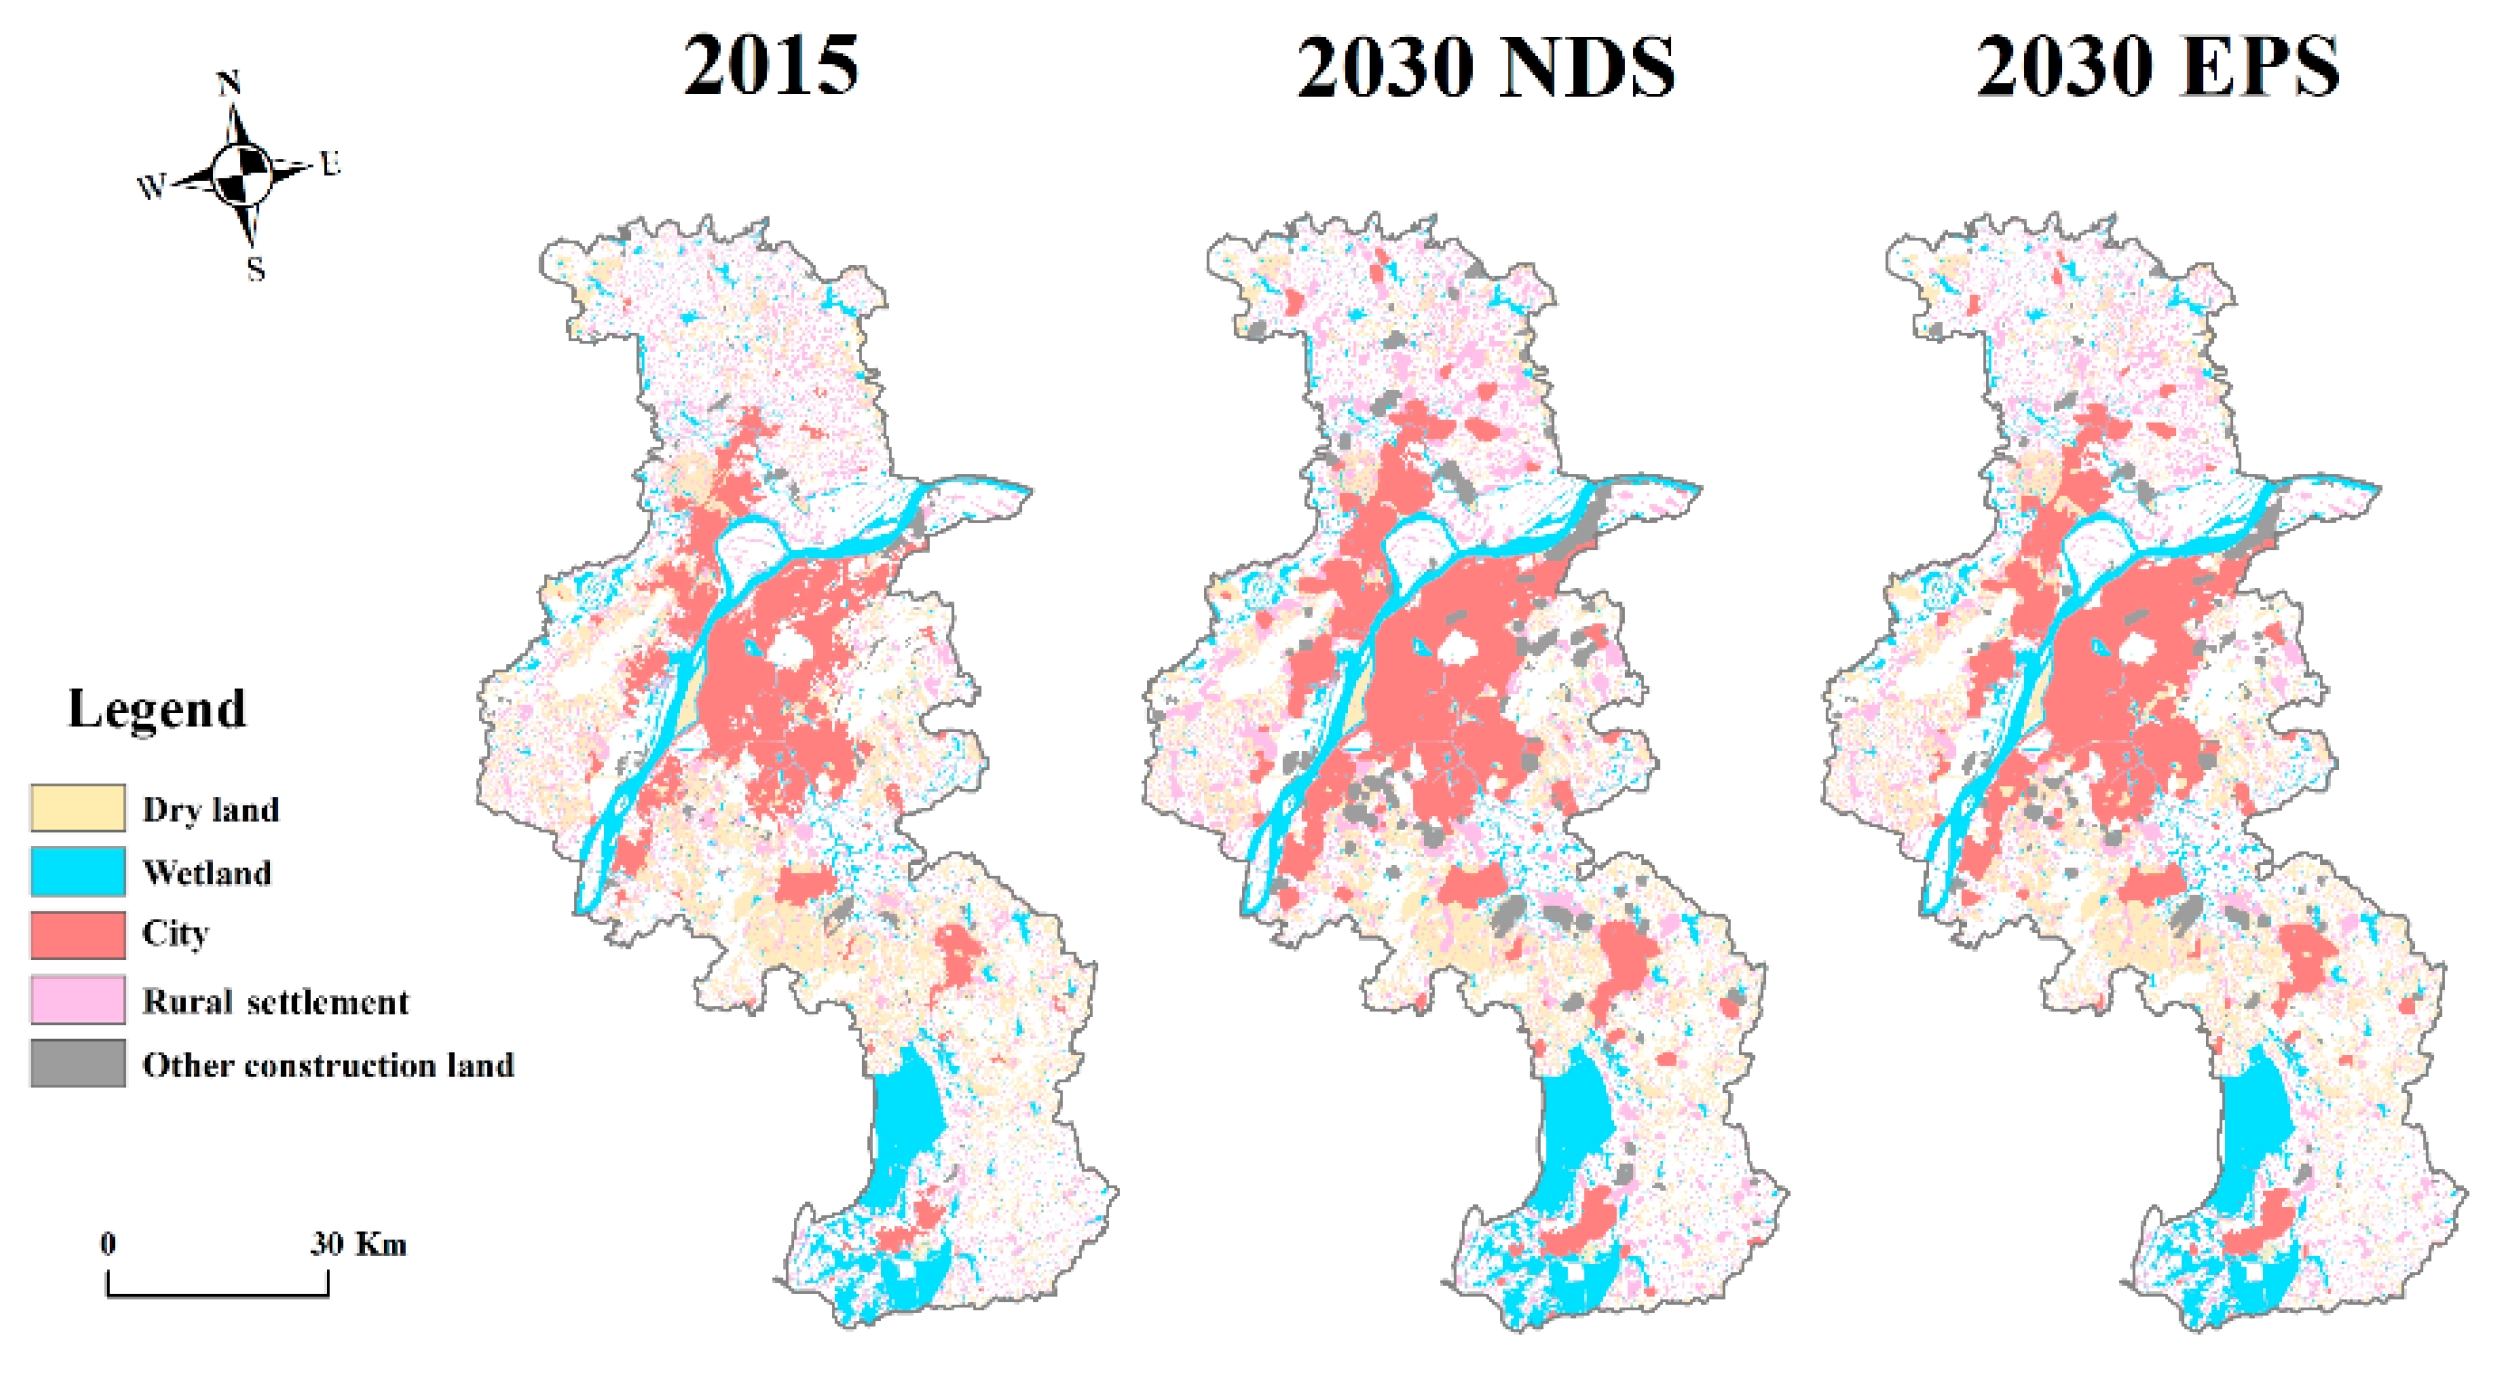
Scenario setting. Natural development scenario (NDS) and ecological protection scenario (EPS) were set up by changing the parameters of the land use transfer matrix of the model from 2010 to 2015. Under the NDS, the original land use transfer matrix was used to carry out the simulation. The conversion from ecological land to construction land was strictly restricted under the EPS, and the transfer probability was controlled below 10%. Meanwhile, the conversion ratio of construction land to ecological land was increased. The transfer probability of construction land to woodland, grassland, and wetland was increased by 2%, 1%, and 1%, respectively.
(6).
Future multi-scenario simulation. This study set 2015 as the base year, and the number of iterations of CA was 15 to simulate the land use pattern of NDS and EPS in 2030, respectively.

2.3.2. Habitat Risk Assessment Model

The HRA model is capable of assessing the risk of various human activities to critical habitats. In the HRA model, the risk is defined as the possibility that human activities will reduce the quality of coastal habitats to indicate where their ability to deliver ecosystem services is impaired [34,36]. The HRA model is well suited for screening the risks of current and future human activities to prioritize the best management strategies for risk mitigation. There are two dimensions of information used to calculate the risk or impact of the ecosystem in the HRA model, which is called “exposure” and “consequence” [37,39]. The HRA model makes full use of GIS spatial superposition analysis technology and assesses the risk of wetland degradation caused by different stressors according to several “exposure” and “consequence” indicators [34,38]. There are 11 indicators of “exposure” and “consequence “, details of which can be found in this literature [53]. Based on the collected data, six of the indicators were selected for wetland ecological risk assessment, as shown in Table 1. The intensity score was obtained by consulting expert assessment, and the remaining indicator scores were obtained from Table 1.
Both exposure (E) and consequence (C) are determined by assigning a score (value ranging from 1 to 3, with 0 representing no score) to a set of metrics for each attribute. The total E and C scores are weighted averages of the exposure (ei) and consequence (ci) values for each indicator i:
E = i = 1 N e i d i · w i i = 1 N 1 d i · w i
C = i = 1 N c i d i · w i i = 1 N 1 d i · w i
where d i represents the data quality rating for indicator i, w i represents the importance weighing for indicator i, and N is the number of indicators evaluated for each wetland [38].
Then, the risk to wetland i caused by stressor j ( R i j ) is calculated as:
R i j = ( E 1 ) 2 + ( C 1 ) 2
Finally, the cumulative risk for wetland i is the sum of all risk scores for each wetland:
R i = j = 1 J R i j
In addition, the HRA model can simultaneously determine high-risk wetland areas and identify the impact of different human activities on wetlands. Based on the risks caused by the cumulative effects of a single stressor or multiple stressors, wetlands can be divided into three risk levels: high, medium, and low. Wetlands are classified as high if the cumulative risk score of the raster is 66% greater than the maximum risk value for either stressor-habitat combination, or 66% greater than the overall possible cumulative risk. If cumulative risk scores are between 33% and 66%, wetlands are classified as medium. If cumulative risk scores are less than 33%, wetlands are classified as low.

3. Results

3.1. Analysis on the Change of Wetland and Its Ecological Pressure Sources

From 1990 to 2015, the study area showed a trend that the area of dryland decreased while the area of city, rural settlement and other construction land increased, as shown in Figure 2. By 2030, the land use pattern of NDS and EPS also showed an increase in the area of construction land and a decrease in the area of dryland. The wetland area remained relatively stable. In terms of quantity, the change of wetland, city, and rural settlement in Chongqing and Wuhan was relatively small under the two scenarios, while dryland and other construction land had a big gap. Under the EPS, due to the strict control of the conversion of ecological land to construction land, the area of all kinds of construction land in the study area is almost smaller than that in the NDS, and the area of dryland and wetland is larger than that in the NDS. From the perspective of spatial layout, the development directions of the three cities are also different. Chongqing is based on the current situation in 2015 and expands around the city. Wuhan is southwest and southeast. Nanjing expands along the edge on the basis of the existing city. The development trend of the three cities is shown in Figure 3, Figure 4 and Figure 5. It should be noted that the scenarios for Chongqing and Wuhan is different; the area of other construction land varies greatly. Compared with Nanjing, the area of other construction land in the two cities shows a significant increasing trend. This is mainly due to the fact that the upper and middle reaches of the Yangtze River are still in the stage of rapid urbanization. The proportion of the urban population in Wuhan and Chongqing is 52.86% and 36.48%, respectively, both of which are far lower than 73.02% in Nanjing. Therefore, Chongqing and Wuhan will inevitably occupy other land for urban construction in the future. In the development of cities in the upper and middle reaches of the Yangtze River, the government should pay close attention to the conversion of various types of land to other construction land to prevent ecological damage.

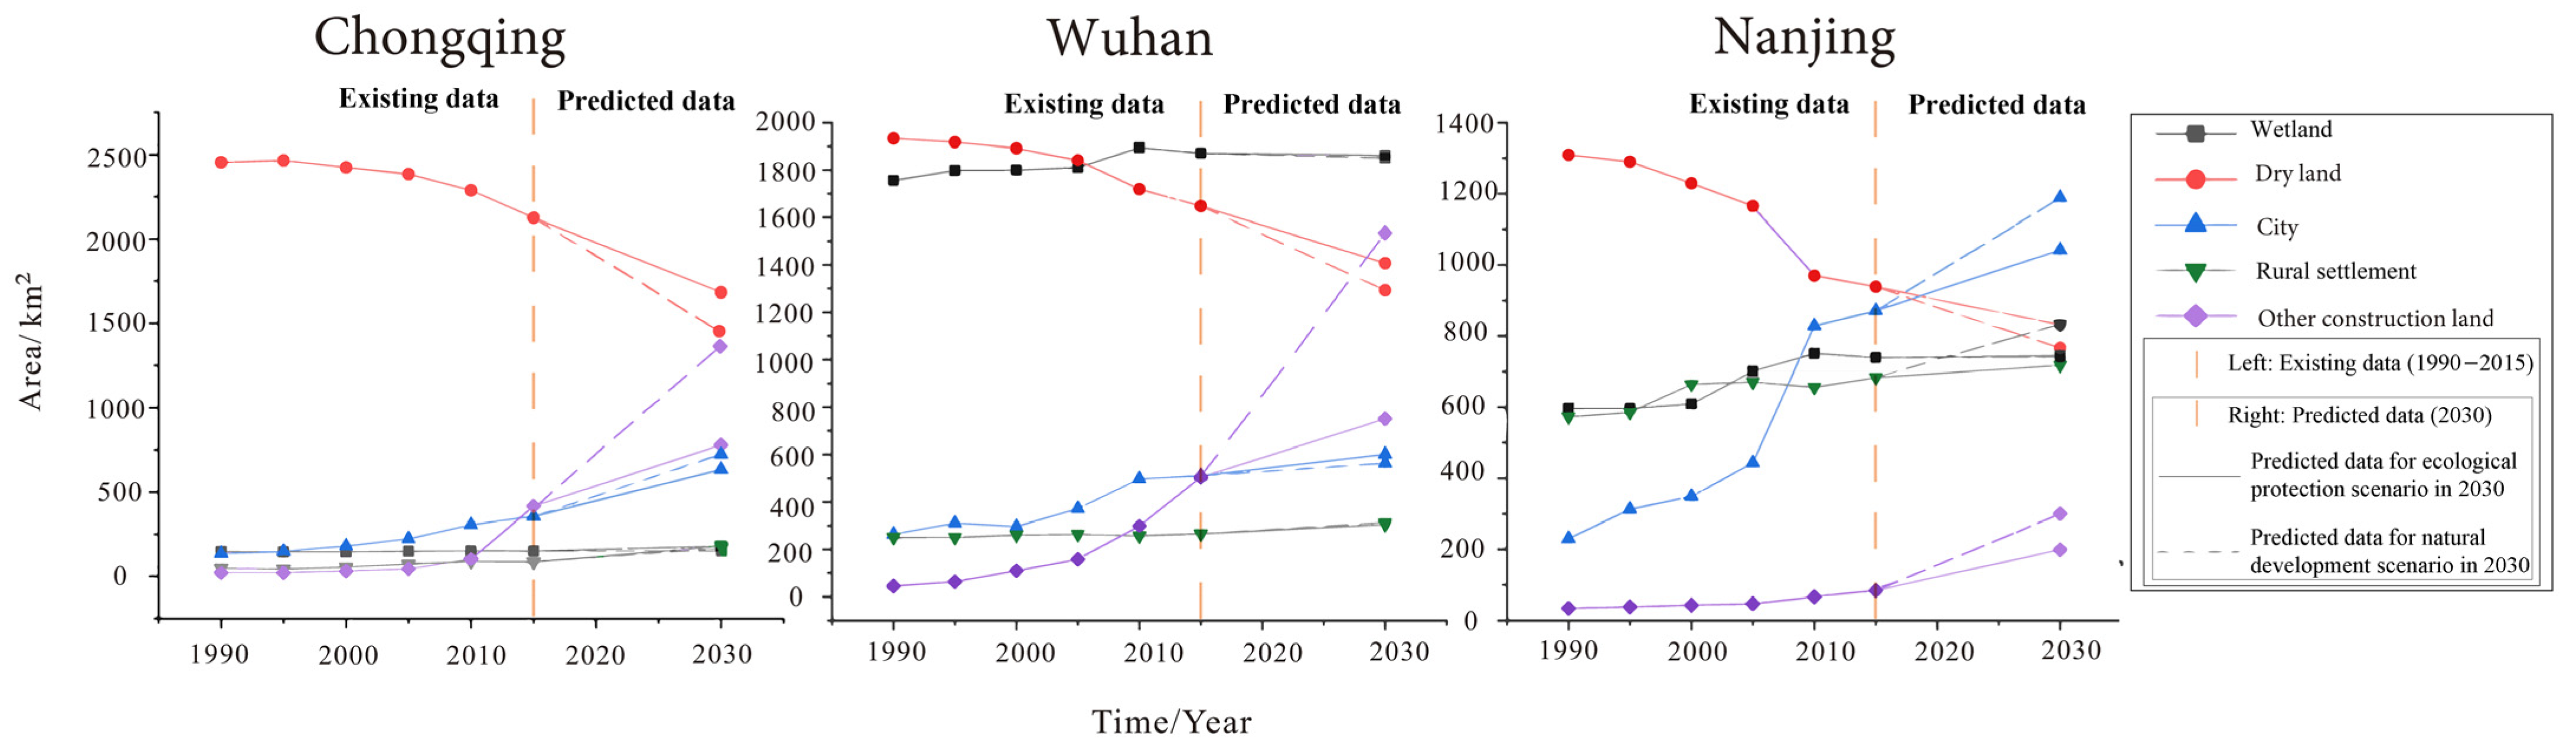
3.2. Impact of Human Activities on Wetlands and Its Prediction

Figure 6, Figure 7, Figure 8 and Figure 9 showed the cumulative risk to wetlands from different ecological stressors. In order to facilitate the comparison of the results in different years, the results were standardized by the method of range standardization. The normalized range of the cumulative risk became from 0 to 1.
Wetlands with high-risk were mainly distributed in the Yangtze River and Jialing River, as shown in Figure 6. These areas were mainly located in the periphery of the urban core. Wetlands were not only affected by urban human activities, but agricultural activities and other construction activities also increased the risks. The wetlands in the core area of Chongqing, were greatly affected by urban development, while other human activities were small. The wetlands in eastern Chongqing also received a little impact. Because the wetlands in this area were far from the city, most wetlands were mainly affected by agricultural production activities. Other types of human activity had little impact. Compared with 2015, the impact of human activities on wetlands in 2030 is different. Under the NDS, affected by the main extension direction of the urban area of Chongqing, the eastern section of the Yangtze River in Chongqing will be more affected by urban development and urban infrastructure construction, and the wetland risk will obviously increase. The risks in the southern section of the Yangtze River and the urban core will be reduced. Under the EPS, the risk of the Yangtze River in the eastern part of Chongqing will also decrease, which is much smaller than that in the NDS.
The wetlands affected by human activities in Wuhan in 2015 were mainly distributed outside the second ring road, pertaining to the compound influence of various human activities, including urban expansion, urban infrastructure construction, and agricultural planting. Liangzi Lake, Hammerhead Lake, Zhangdu Lake, Lu Lake, Wuhu Lake, and other lakes in the outlying urban area were mainly affected by agrarian production, which faced lower ecological risk. Similar to the urban center of Chongqing, the wetlands in the second ring line of Wuhan were mainly affected by urban development, and other human activities had little impact, so the ecological risk was low. Under the NDS, because of the expansion of urban construction land, the ecological risks will be significantly increased in 2030. As can be seen from Figure 7, the radius of the ecological risk high-value area is larger than that in 2015. Under the EPS in 2030, the impact of human activities on wetlands will be also stronger than that in 2015, especially in the southwest and southeast of Wuhan. The main reason is the expansion of the city and other construction land in these regions, which increases the impact on wetlands. In 2030, the risks in the urban core will change little.
The wetlands in Nanjing were severely impacted by human activities in 2015, and they were mainly located in the suburbs. The areas with the highest risk were mainly located in the Yangtze River, as shown in Figure 8. The risk of wetlands, such as Chuhe and Lishui River, was also high. The areas with low risk were scattered around the high-risk areas, such as Shijiu Lake and Gucheng Lake in the south of Nanjing. There is non-significant difference in the impact of human activities on wetlands in Nanjing in 2030 under the two scenarios. Due to the expansion of urban construction land, the risks faced by the wetlands in the urban core of Nanjing will enhance. Owing to the increase in dry land and construction land around Shijiu Lake and Gucheng Lake, agricultural production and construction, and development activities will bring greater ecological risks to wetlands.

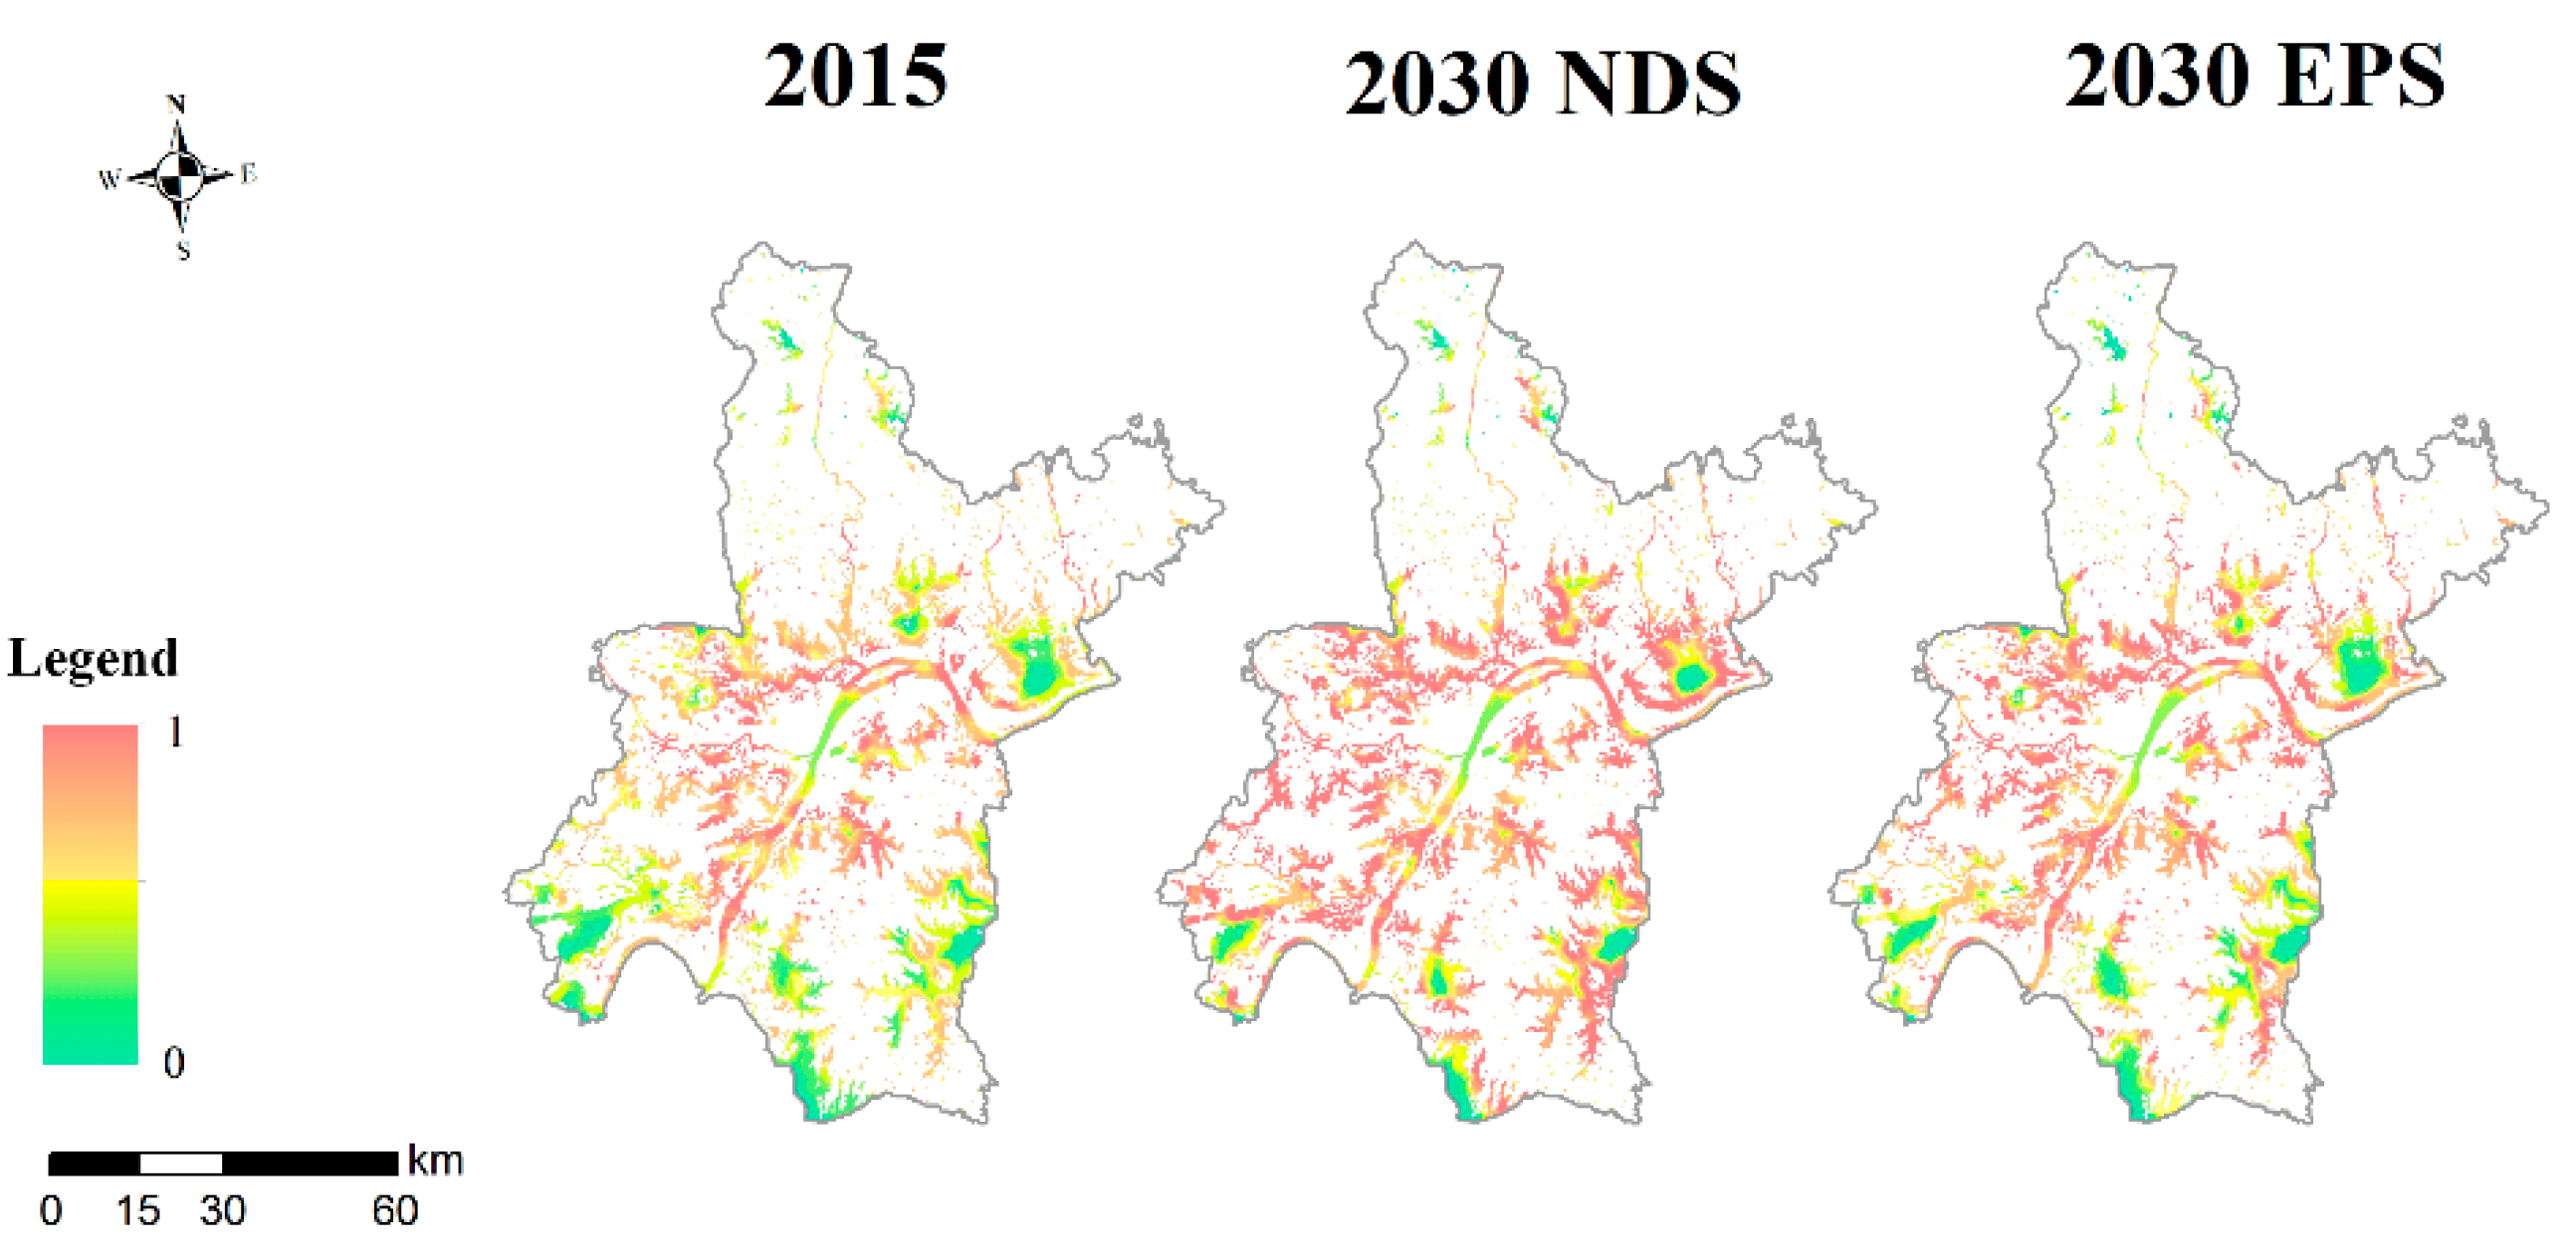
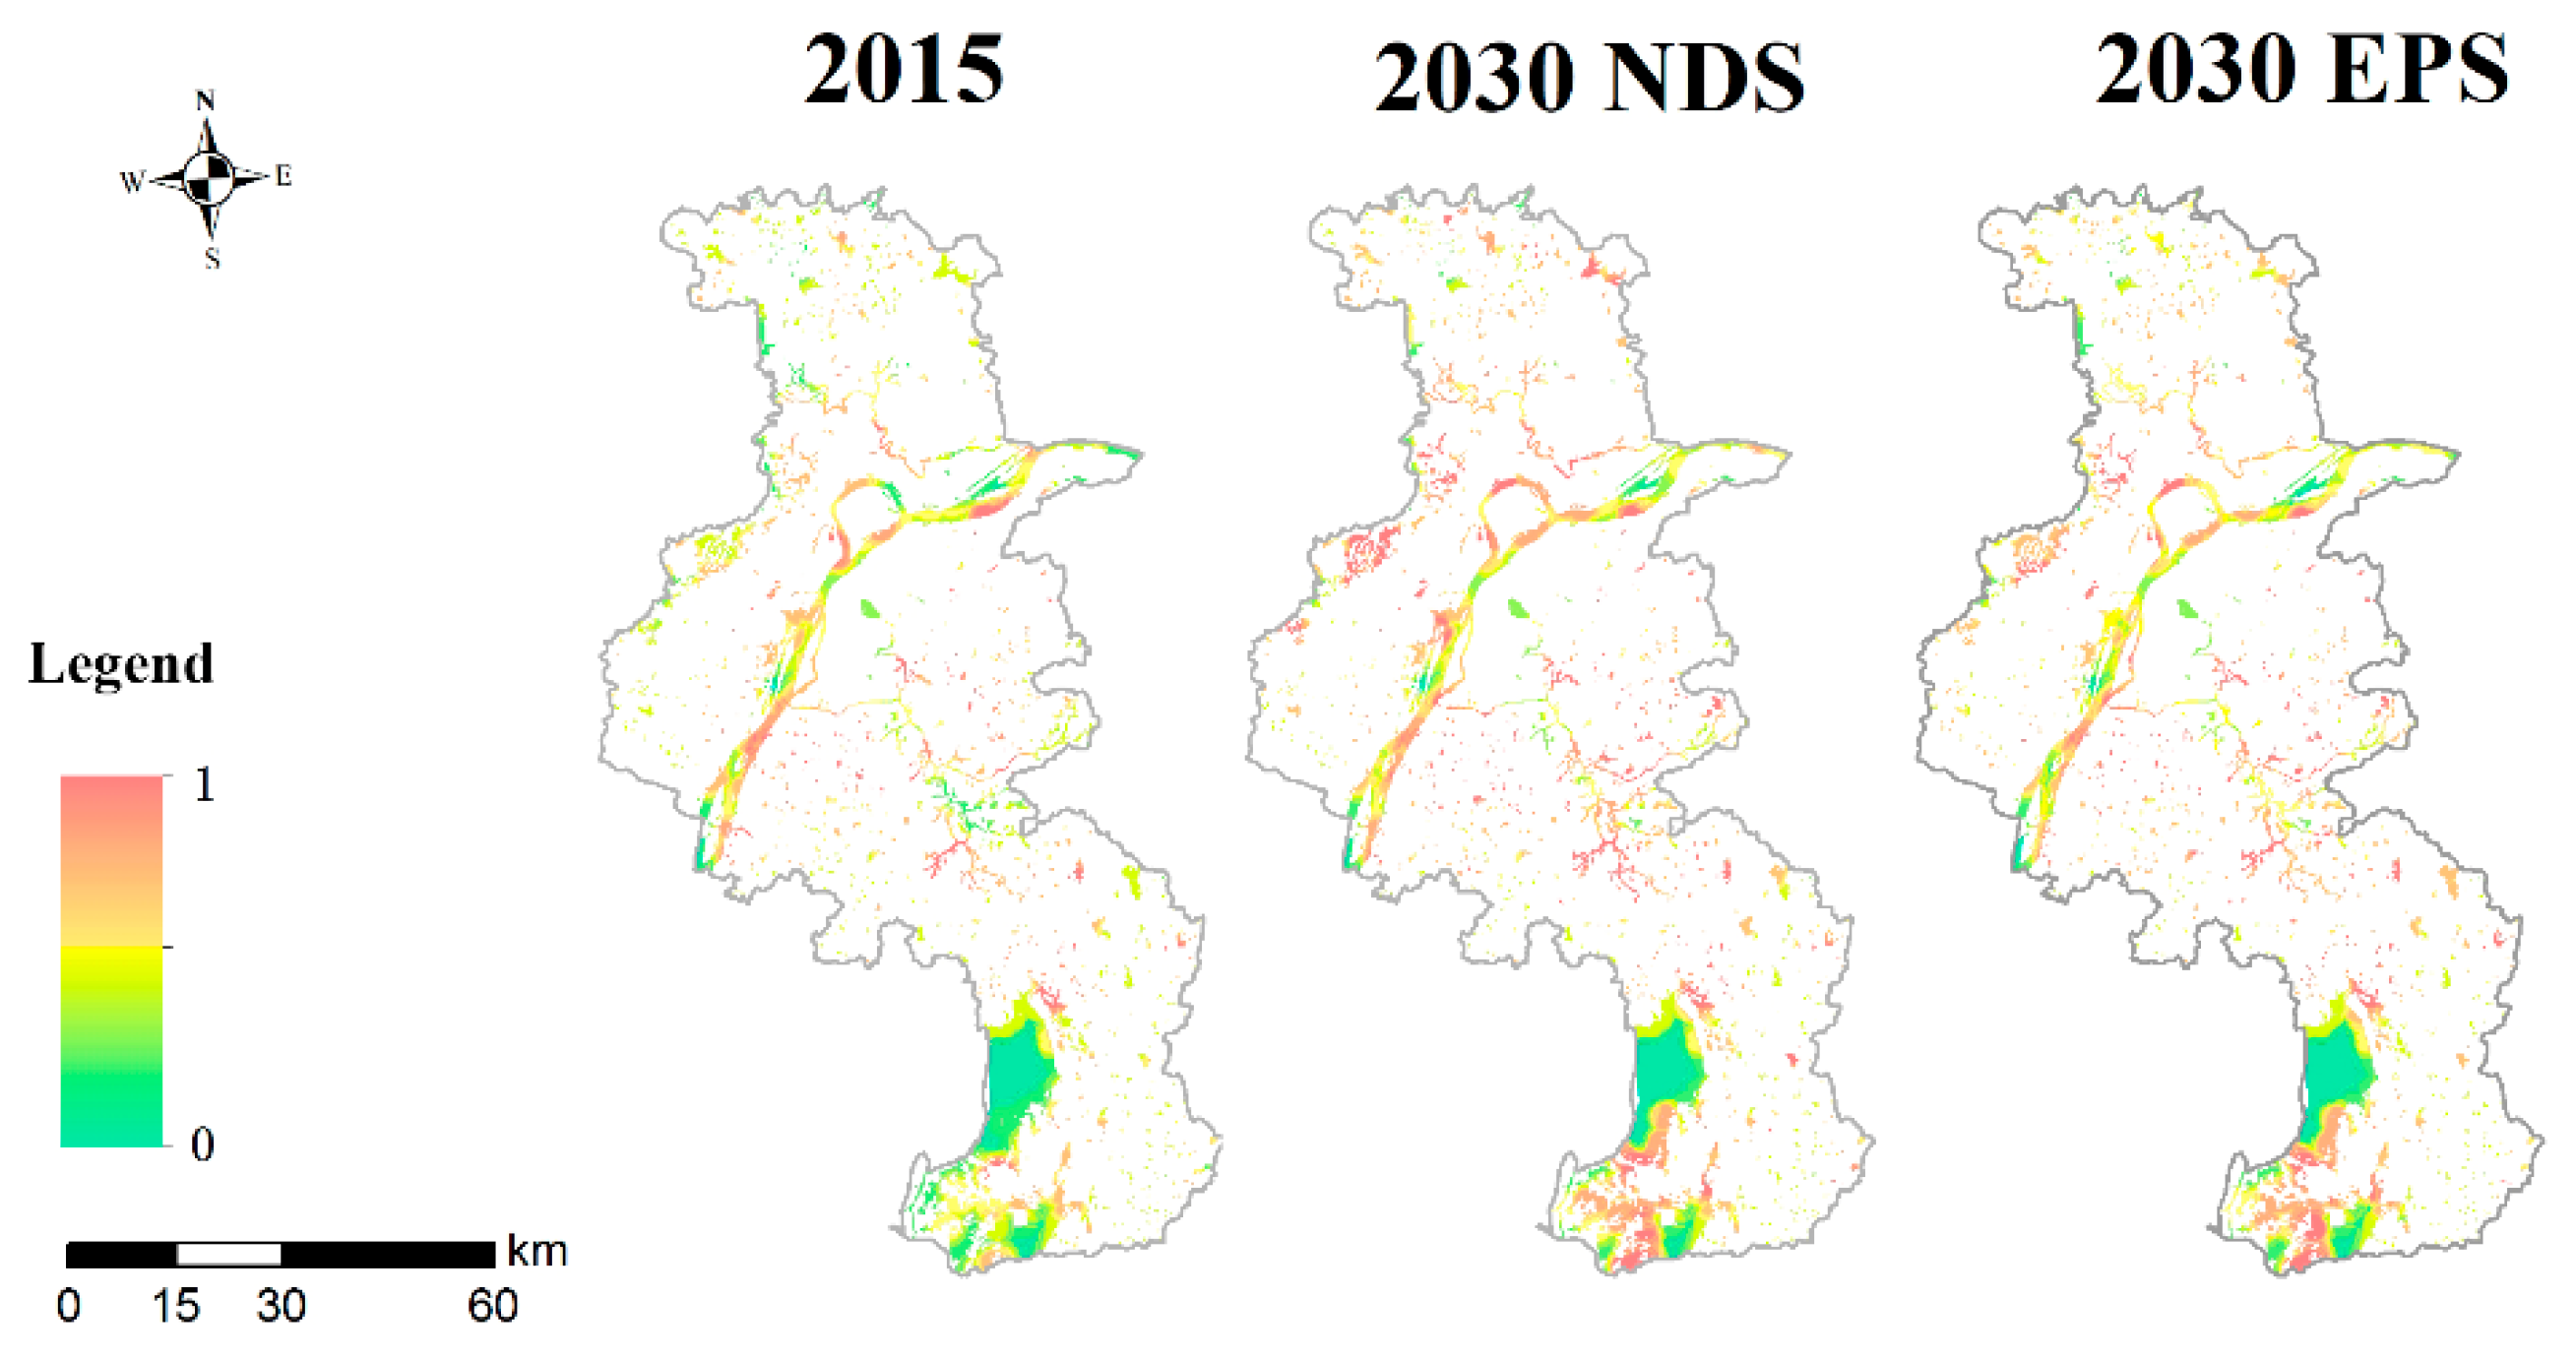
3.3. Factor Analysis of Wetland Risk Caused by Human Activities

The risks faced by wetlands were caused by a combination of various human factors, but the impact of human activities on wetlands varied in different regions. Table 2 showed the ecological risks posed by four types of ecological stressors to wetlands in different regions, years, and simulation scenarios. Specifically, by 2015, the greatest impact of Chongqing on wetlands was agricultural production activities (R = 1.63), followed by urban infrastructure construction, urban development and rural development. Wetlands in Wuhan were the most affected by urban infrastructure construction (R = 1.78). Rural (R = 1.62) and urban development (R = 1.59) brought the greatest risks in Nanjing, as shown in Table 2. Therefore, the decision-makers should strengthen the supervision of the above-mentioned human activities to reduce the risk. In addition, the impact of various human activities on wetlands varies under different scenarios in 2030. Under the NDS, due to urban expansion, a large number of other types of land will convert to construction land, resulting in the increasing impact of urban development and construction activities on wetlands in the study area. The urban development of Wuhan (R = 1.9) and Nanjing (R = 1.71) has the most significant impact, while the urban infrastructure construction of Chongqing (R = 1.8) is the greatest. Under the EPS, the conversion from ecological land to construction land is limited. The impact of construction land on wetlands in the study area is obviously less than that in the NDS. However, the urban development and construction activities (Chongqing R = 1.8, Nanjing R = 1.68, Wuhan R = 1.79) still have the most significant impact on wetlands in the study area.

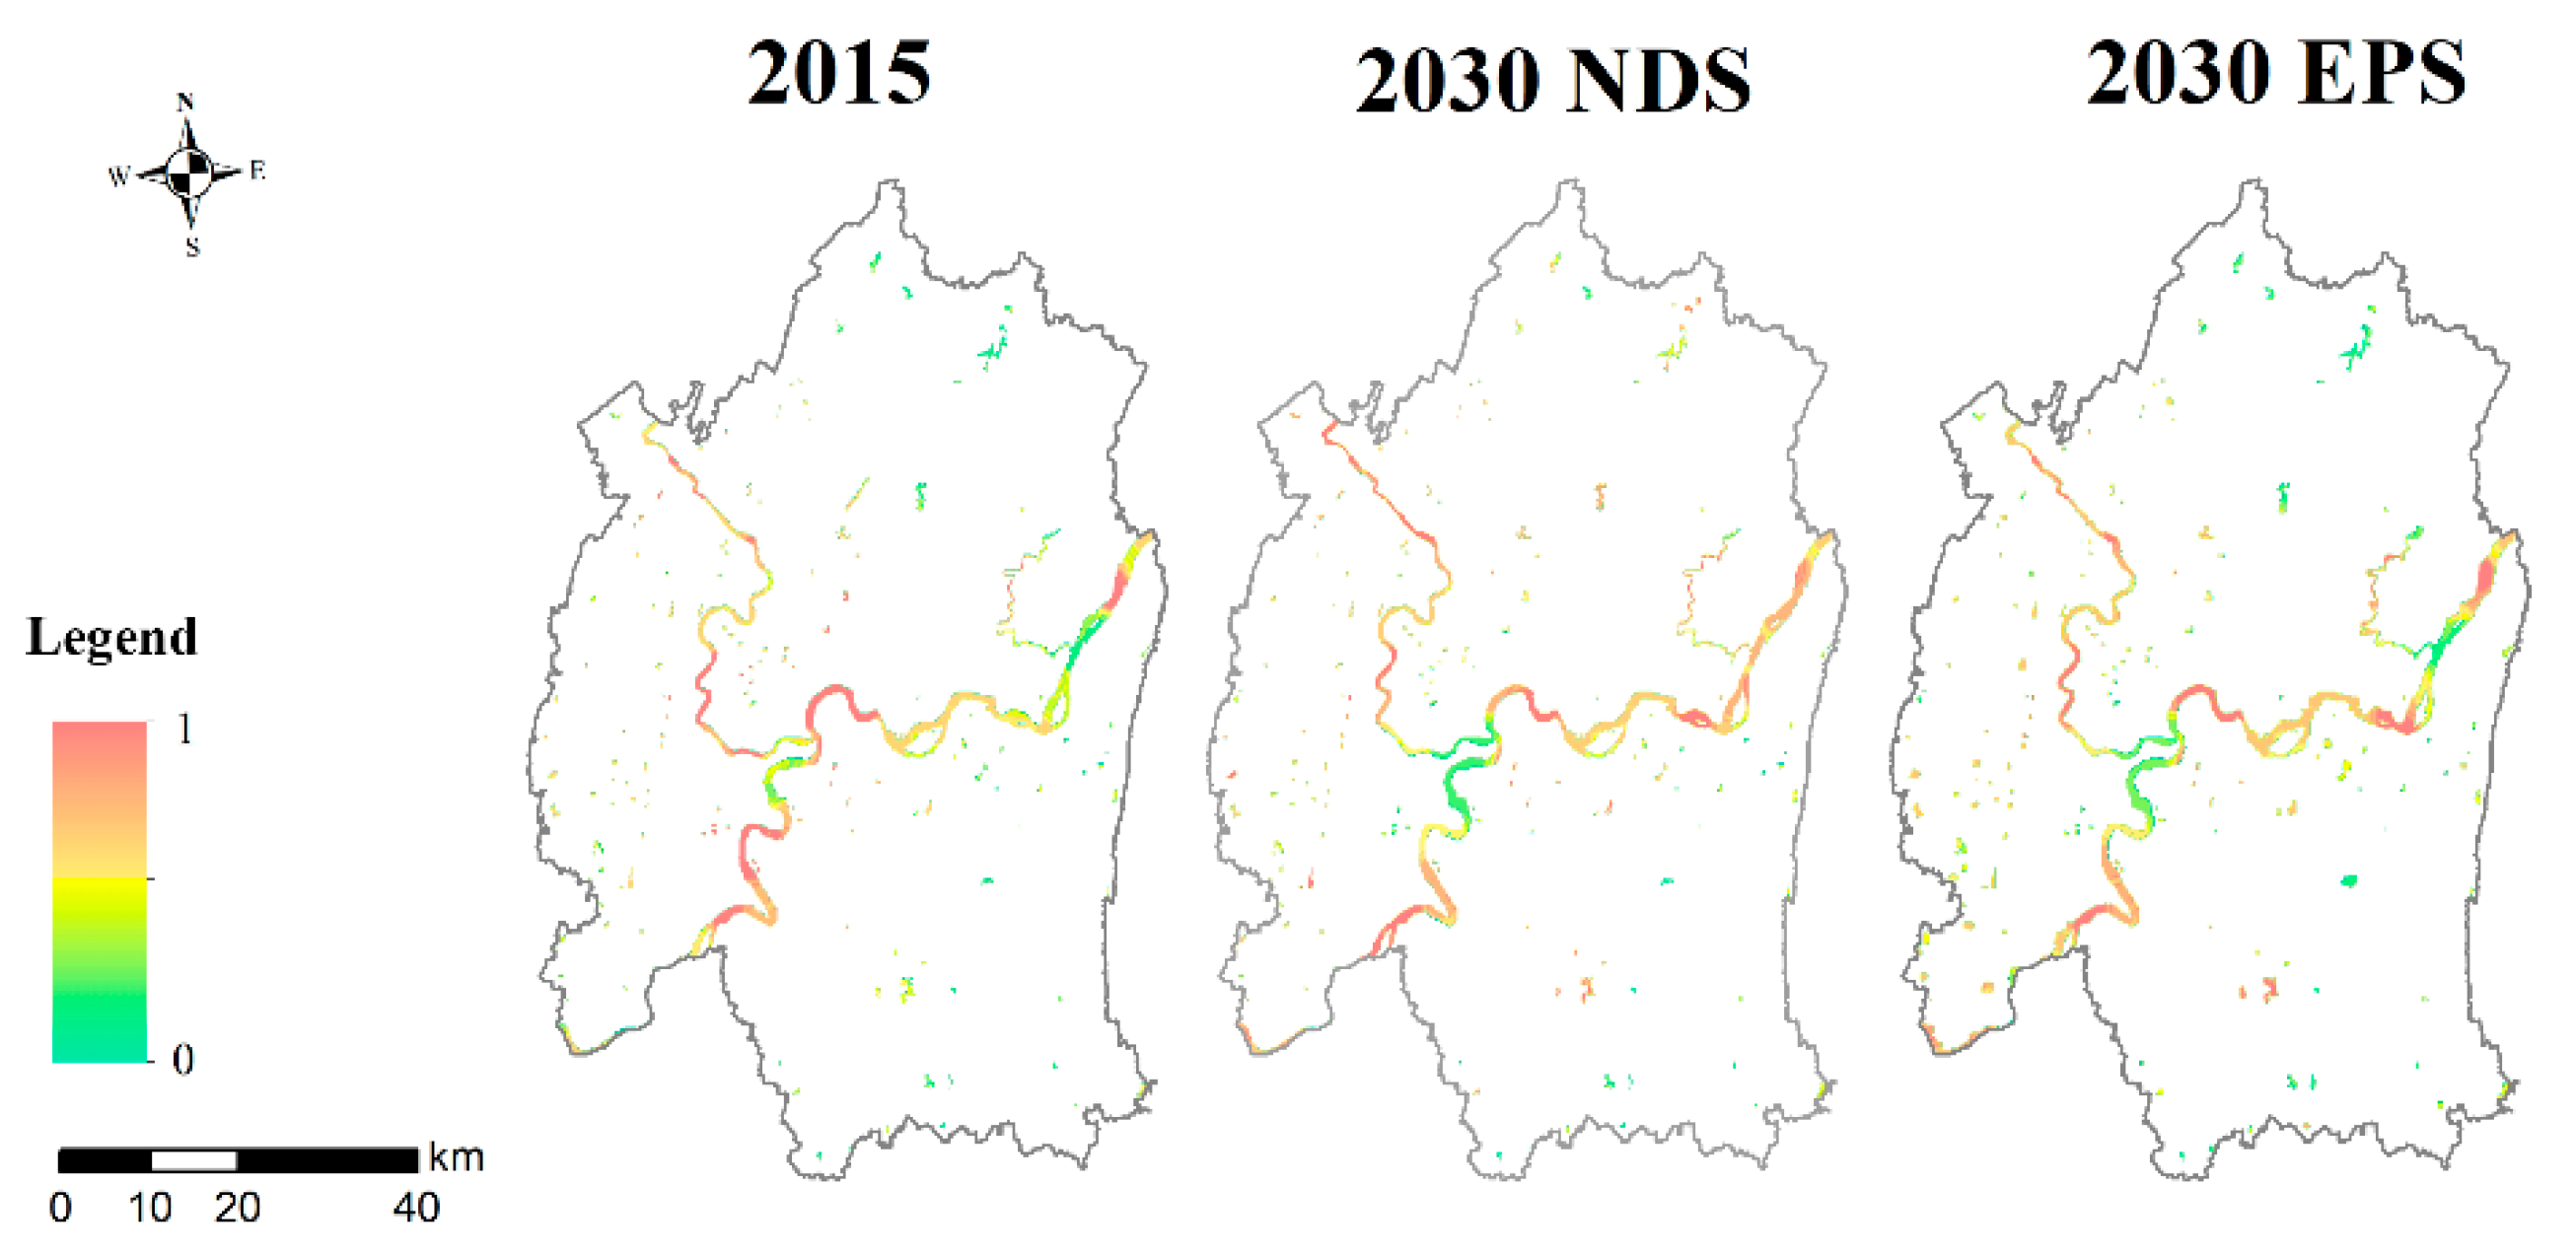
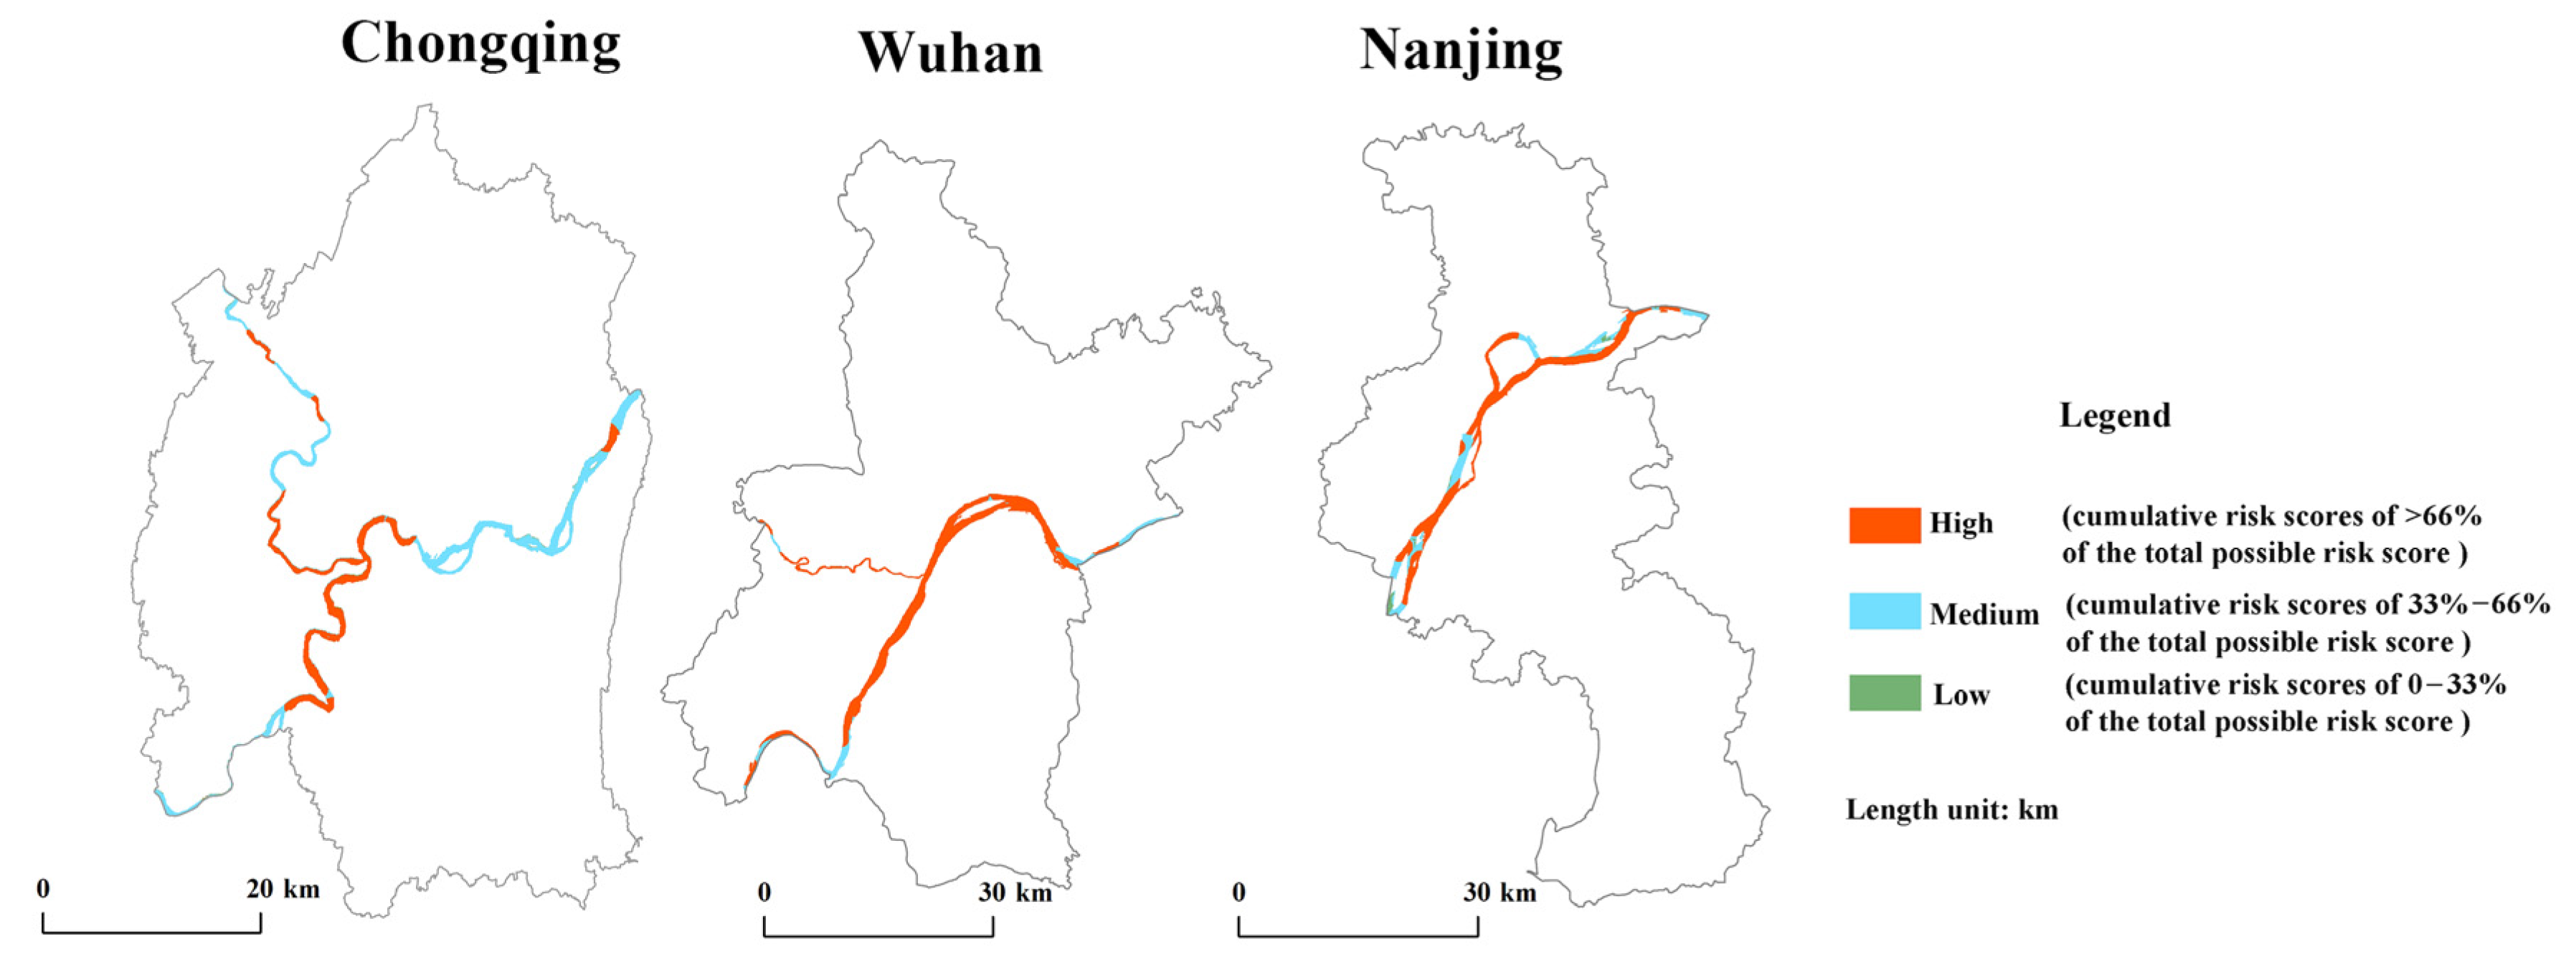
3.4. Ecological Risk Analysis of the Yangtze River Shoreline

This study further assessed the risks faced by the waterfront of the Yangtze River and its tributaries (Jialing River and Hanjiang River). According to the proportion of cumulative risk scores in the total possible cumulative risk score, waterfront is divided into three grades: high, medium, and low. The results of 2015 showed that due to the relatively flat topography of Wuhan and Nanjing, various human activities, such as agricultural planting, engineering construction, brought high risks to the main river and tributaries of the Yangtze River. The total length of high-risk rivers in Wuhan and Nanjing was 149 km and 96 km, respectively. The length of trunk stream and tributary under medium-risk was relatively short, and it was mainly located in the south and the east of Wuhan, as well as in the east of Nanjing, as shown in Figure 9. The topography of eastern Chongqing is undulating, and the impact of human activities was small, leading to the waterfront of 107 km in Chongqing facing medium ecological risk. The high ecological risk areas were located in the south of Chongqing, with a total length of 90 km.

4. Discussion

There were differences in the scale of different land types under the NDS and EPS in the study area in 2030, but the trend of the increase of construction land area and the decrease of the farmland area did not change. The trend was similar to that in other parts of China. According to statistics, by the end of 2017, the cultivated land in China had been reduced by 60,900 hectares, and construction land had increased by 534,400 hectares [63]. Most urban areas in China had the problem of the reduction of cultivated land and the increase in construction land. Because China was still in the process of rapid urbanization, all kinds of urban development and construction activities would inevitably occupy cultivated land and other ecological land. With the population growth and urban development demand, the situation of cultivated land protection was still very grim [64,65,66]. The study also found that the ecological risks posed by construction land were generally greater than other land types. Numerous studies had similar results. For example, Liu [67] and Wang [68] found that the landscape pattern of construction land was riskier than other types in different landscape types. By 2030, the demand for population and construction land in the study area will inevitably increase. Therefore, it is imperative to prevent the conversion of important wetlands into construction land.
According to the analysis, the wetlands in the study area changed little. However, it does not mean that the wetland in the study area had not been degraded. Except for changes in the wetland area, wetland degradation was more manifested in chemical and biological degradation. In the past few decades, waste discharge, heavy metal pollution, domestic sewage discharge, ship navigation, and oily wastewater discharge in the industrial process have made the Yangtze River the most polluted region in the world [69]. The Yangtze River has been ranked by the World Wildlife Fund as one of the top ten rivers at risk in the world [70]. The Yangtze River Basin Water Environment Monitoring Center monitored organic pollutants in the Yangtze River, and the results showed that 266 harmful organic chemicals were detected in the water, and 106 harmful organic chemicals were detected in the sediments, 17 of which were priority controlled pollutants in the United States [71]. There were also more detailed studies showing that the bioavailability of CD, Cu, Zn, and Pb in wetland sediment in Wuhan was higher, which posed a greater ecological risk [72]. Currently, the level of biodiversity in the Yangtze River wetlands has decreased, the level of net productivity is decreasing, and the eutrophication of water bodies has intensified. It is urgent to carry out the wetland ecological restoration project in the Yangtze River Basin [73].
The results also indicated that the ecological risk of wetlands in the three cities was low in the urban core and high in the suburbs. This was primarily due to the relatively low population density in the suburbs but extremely high population growth rates. In addition, the suburban area was a new urban development area, and the wetlands in the suburban area were facing the dual pressure of improving the living environment of urban residents and meeting the economic development of the transition zone. In the future, due to the rapid increase of population, the continuous expansion of construction land will destroy the continuity of the ecological process. The spatial adjacency between the ecological land and construction land will affect the function of ecological land, rapidly increase the possibility of wetland ecological risk, and reduce the connectivity and resilience of wetland ecosystems. The urban core has reached the stage of comprehensive urbanization with the highest population density. Although these areas cannot significantly reduce the possibility of ecological risk, the governments of different cities have implemented various measures to help reduce the risk, such as green infrastructure construction, to a certain extent, alleviating the ecological risk within cities [74,75,76]. The population density was quite low, and the growth rate was the lowest in the outskirts of the city (rural settlement). Moreover, the outskirts of the city were mostly natural ecosystems, which were important ecological barriers for different cities, and all kinds of development and construction activities had the least impact on wetlands. Analogous results were obtained for Luo [77] and Huang [78]. According to the characteristics of different cities, urban managers should maintain and repair the urban natural ecosystem, strengthen the guarantee of ecological environment quality, expand the ecological space, such as urban green space and water area, construct ecological corridor, and form a complete ecological network of urban green space, wetland and cultivated land [79,80].
The study also found that the waterfront in the middle and lower reaches of the Yangtze River was facing more ecological risks. The Water Resources Bulletin of Yangtze River Basin and Southwest Rivers in 2017 also showed that the waste and sewage discharged into the Yangtze River was mainly distributed in the middle and lower reaches of the Yangtze River from the Dongting Lake to the Taihu Lake [81]. Hunan, Hubei, and Jiangsu were the provinces with the largest amount of sewage discharge in the Yangtze River Economic Belt. Human activities had a greater impact on wetlands in this region. Therefore, the government should improve and perfect the wetland management system, implement wetland protection and restoration projects, improve wetland monitoring and evaluation system, and reasonable plan and sustainable use of wetland resources. Meanwhile, regional cooperation and interest coordination should be enhanced. On the basis of learning from other countries’ ecological compensation, direct compensation for significant public benefits, such as upstream water source protection and ecological conservation, should be increased, and the basin ecological compensation should be improved to solve the regional economic and social imbalance and realize the harmonious coexistence of ecological environment protection and economic society.
Combined with the HRA model and CA-Markov model, this study quantitatively predicted and analyzed the relatively high-risk areas and risk degree of wetlands in the study area, and assessed the impact of ecological pressure sources related to human activities on the wetland. Decision-makers can clearly identify the areas that need to be protected and restored. However, there are a few shortcomings in this paper. Because the paddy field is a special wetland, it is not included in the ecological stressor in this study. Moreover, this study only used dryland to represent agricultural production activities, which may not be able to fully identify the impact of agricultural activities on wetlands. In the simulating process of CA-Markov model, the scale of the land use unit, and the size of the cellular filter will affect the simulation accuracy. In addition, due to the limitation of data acquisition, this study lacked detailed spatial data on human activity types. Therefore, it may not be possible to fully reveal the impact of human activities on the wetland under the condition of using land-use type representing human activities as ecological stressors. The land-use intensity, water pollution, and other environmental problems also lead to ecological risks. Although this study cannot completely replace the ERA based on ecotoxicological data, it can provide a new idea for developing ERA in areas lacking data, and can also provide references for traditional ERA results. In future studies, to achieve higher simulation accuracy and better experimental results, different cell sizes should be used to carry out the simulation and prediction in consideration of scale effects. On the basis of collecting spatial data of human activities as much as possible, a better ecological risk assessment effect can be achieved.

5. Conclusions

The results showed that from 1990 to 2030, the area of construction land in the study area showed a growth trend, while farmland was the opposite. Chongqing and Wuhan were still in the stage of rapid urbanization, which involved invading other land-use types for urban construction in the future. In terms of spatial distribution, the wetlands in Chongqing and Wuhan, which were significantly affected by human activities in 2015, were mainly distributed in the periphery of the urban core, while the wetlands in the urban core and the outer suburbs were relatively less influenced by human activities. Wetlands affected by human activities in Nanjing in 2015 were mainly distributed in suburban areas. In 2030, the impact of human activities on wetlands under the NDS significantly increased the area of high-risk grade, especially the construction land expansion. The risks brought by human activities in the EPS were more concentrated in the medium and low levels. The impact of human activities on wetlands was different. Agricultural development in Chongqing had the greatest impact on wetlands in 2015, while human activity in Wuhan and Nanjing, namely urban infrastructure construction and rural development, respectively, had the greatest impact. In 2030, the intensity of human activities in the EPS was significantly lower than that in the NDS. The waterfront of Wuhan and Nanjing is more high-risk, and the total length of high-risk rivers is up to 149 km and 96 km, respectively. The waterfront of Chongqing is dominated by medium-risk and high-risk, and the lengths are 107 km and 90 km, respectively.

Author Contributions

Conceptualization, T.Z. and J.W.; methodology, T.Z. and J.W.; software, T.Z. and L.H.; formal analysis, T.Z. and J.L.; investigation, T.Z.; resources, T.Z. and J.W.; data curation, T.Z. and Y.F.; writing—original draft preparation, T.Z. and K.C.; writing—review and editing, T.Z. and C.Z.; visualization, T.Z.; supervision, T.Z.; project administration, T.Z.; funding acquisition, J.W. All authors have read and agreed to the published version of the manuscript.

Funding

This research was funded by the National Natural Science Foundation of China, grant number 41871203.

Institutional Review Board Statement

Not applicable.

Informed Consent Statement

Not applicable.

Data Availability Statement

No new data were created or analyzed in this study. Data sharing is not applicable to this article.

Conflicts of Interest

The authors declare no conflict of interest.

References

  1. Gómez-Baggethun, E.; Tudor, M.; Doroftei, M.; Covaliov, S.; Năstase, A.; Onără, D.; Mierlă, M.; Marinov, M.; Doroșencu, A.; Lupu, G.; et al. Changes in ecosystem services from wetland loss and restoration: An ecosystem assessment of the Danube Delta (1960–2010). Ecosyst. Serv. 2019, 39, 100965. [Google Scholar] [CrossRef]
  2. Calder, R.S.; Shi, C.; Mason, S.A.; Olander, L.P.; Borsuk, M.E. Forecasting ecosystem services to guide coastal wetland rehabilitation decisions. Ecosyst. Serv. 2019, 39, 101007. [Google Scholar] [CrossRef]
  3. Li, J.; Pan, Q.; Peng, Y.; Feng, T.; Liu, S.; Cai, X.; Zhong, C.; Yin, Y.; Lai, W. Perceived Quality of Urban Wetland Parks: A Second-Order Factor Structure Equation Modeling. Sustainability 2020, 12, 7204. [Google Scholar] [CrossRef]
  4. Yun, H.J.; Kang, D.J.; Kim, D.; Kang, Y. A GIS-Assisted Assessment and Attribute-Based Clustering of Forest Wetland Utility in South Korea. Sustainability 2019, 11, 4632. [Google Scholar] [CrossRef] [Green Version]
  5. Wang, J.; Lin, Y.; Glendinning, A.; Xu, Y. Land-use changes and land policies evolution in China’s urbanization processes. Land Use Policy 2018, 75, 375–387. [Google Scholar] [CrossRef]
  6. Wang, J.; Zhai, T.; Lin, Y.; Kong, X.; He, T. Spatial imbalance and changes in supply and demand of ecosystem services in China. Sci. Total Environ. 2019, 657, 781–791. [Google Scholar] [CrossRef] [PubMed]
  7. van Roon, M.R. Wetlands in The Netherlands and New Zealand: Optimising biodiversity and carbon sequestration during urbanisation. J. Environ. Manag. 2012, 101, 143–150. [Google Scholar] [CrossRef] [PubMed]
  8. Douglas, I. The challenge of urban poverty for the use of green infrastructure on floodplains and wetlands to reduce flood impacts in intertropical Africa. Landsc. Urban Plan. 2018, 180, 262–272. [Google Scholar] [CrossRef]
  9. Wang, J.; Lin, Y.; Zhai, T.; He, T.; Qi, Y.; Jin, Z.; Cai, Y. The role of human activity in decreasing ecologically sound land use in China. Land Degrad. Dev. 2018, 29, 446–460. [Google Scholar] [CrossRef]
  10. Jiang, B.; Xu, X. China needs to incorporate ecosystem services into wetland conservation policies. Ecosyst. Serv. 2019, 37, 100941. [Google Scholar] [CrossRef]
  11. Zhang, Y.; Jin, R.; Zhu, W.; Zhang, D.; Zhang, X. Impacts of Land Use Changes on Wetland Ecosystem Services in the Tumen River Basin. Sustainability 2020, 12, 9821. [Google Scholar] [CrossRef]
  12. Li, Y.; Qiu, J.; Li, Z.; Li, Y. Assessment of blue carbon storage loss in coastal wetlands under rapid reclamation. Sustainability 2018, 10, 2818. [Google Scholar] [CrossRef] [Green Version]
  13. Jia, Y.; Tang, X.; Liu, W. Spatial–Temporal Evolution and Correlation Analysis of Ecosystem Service Value and Landscape Ecological Risk in Wuhu City. Sustainability 2020, 12, 2803. [Google Scholar] [CrossRef] [Green Version]
  14. Cyranoski, D. Putting China’s wetlands on the map. Nature 2009, 458, 134. [Google Scholar] [CrossRef] [PubMed]
  15. Meng, W.; He, M.; Hu, B.; Mo, X.; Li, H.; Liu, B.; Wang, Z. Status of wetlands in China: A review of extent, degradation, issues and recommendations for improvement. Ocean Coast. Manag. 2017, 146, 50–59. [Google Scholar] [CrossRef]
  16. Dong, T.; Xu, W.; Zheng, H.; Xiao, Y.; Kong, L.; Ouyang, Z. A framework for regional ecological risk warning based on ecosystem service approach: A case study in Ganzi, China. Sustainability 2018, 10, 2699. [Google Scholar] [CrossRef] [Green Version]
  17. Tooth, S.; Rodnight, H.; McCarthy, T.S.; Duller, G.; Grundling, A.T. Late Quaternary dynamics of a South African floodplain wetland and the implications for assessing recent human impacts. Geomorphology 2009, 106, 278–291. [Google Scholar] [CrossRef]
  18. Ficken, C.D.; Cobbaert, D.; Rooney, R.C. Low extent but high impact of human land use on wetland flora across the boreal oil sands region. Sci. Total Environ. 2019, 693, 133647. [Google Scholar] [CrossRef] [PubMed]
  19. Chen, B. Contaminant transport in a two-zone wetland: Dispersion and ecological degradation. J. Hydrol. 2013, 488, 118–125. [Google Scholar] [CrossRef]
  20. Mao, X.; Wei, X.; Jin, X.; Tao, Y.; Zhang, Z.; Wang, W. Monitoring urban wetlands restoration in Qinghai Plateau: Integrated performance from ecological characters, ecological processes to ecosystem services. Ecol. Indic. 2019, 101, 623–631. [Google Scholar] [CrossRef]
  21. Ondiek, R.A.; Kitaka, N.; Oduor, S.O. Assessment of provisioning and cultural ecosystem services in natural wetlands and rice fields in Kano floodplain, Kenya. Ecosyst. Serv. 2016, 21, 166–173. [Google Scholar] [CrossRef]
  22. Sun, J.; Yuan, X.; Liu, G.; Tian, K. Emergy and eco-exergy evaluation of wetland restoration based on the construction of a wetland landscape in the northwest Yunnan Plateau, China. J. Environ. Manag. 2019, 252, 109499. [Google Scholar] [CrossRef] [PubMed]
  23. Johnston, S.G.; Burton, E.D.; Aaso, T.; Tuckerman, G. Sulfur, iron and carbon cycling following hydrological restoration of acidic freshwater wetlands. Chem. Geol. 2014, 371, 9–26. [Google Scholar] [CrossRef]
  24. Haywood, B.J.; Hayes, M.P.; White, J.R.; Cook, R.L. Potential fate of wetland soil carbon in a deltaic coastal wetland subjected to high relative sea level rise. Sci. Total Environ. 2020, 711, 135185. [Google Scholar] [CrossRef]
  25. Testi, A.; Fanelli, G.; Crosti, R.; Castigliani, V.; D’Angeli, D. Characterizing river habitat quality using plant and animal bioindicators: A case study of Tirino River (Abruzzo Region, Central Italy). Ecol. Indic. 2012, 20, 24–33. [Google Scholar] [CrossRef]
  26. Zhou, Y.; Ning, L.; Bai, X. Spatial and temporal changes of human disturbances and their effects on landscape patterns in the Jiangsu coastal zone, China. Ecol. Indic. 2018, 93, 111–122. [Google Scholar] [CrossRef]
  27. Xu, C.Y.; Pu, L.J.; Zhu, M. Effect of reclamation activity on coastal ecological environment: Progress and perspectives. Acta Ecol. Sin. 2018, 38, 411–425. [Google Scholar] [CrossRef]
  28. Christian, R.R.; Brinson, M.M.; Dame, J.K.; Johnson, G.; Peterson, C.H.; Baird, D. Ecological network analyses and their use for establishing reference domain in functional assessment of an estuary. Ecol. Model. 2009, 220, 3113–3122. [Google Scholar] [CrossRef]
  29. Chen, S.; Fath, B.D.; Chen, B. Information-based network environ analysis: A system perspective for ecological risk assessment. Ecol. Indic. 2011, 11, 1664–1672. [Google Scholar] [CrossRef]
  30. Lemly, A.D. PROFILE: Risk Assessment as an Environmental Management Tool: Considerations for Freshwater Wetlands. Environ. Manag. 1997, 21, 343–358. [Google Scholar] [CrossRef]
  31. Qu, C.S.; Chen, W.; Bi, J.; Huang, L.; Li, F.Y. Ecological risk assessment of pesticide residues in Taihu Lake wetland, China. Ecol. Model. 2011, 222, 287–292. [Google Scholar] [CrossRef]
  32. Chai, M.; Ding, H.; Shen, X.; Li, R. Contamination and ecological risk of polybrominated diphenyl ethers (PBDEs) in surface sediments of mangrove wetlands: A nationwide study in China. Environ. Pollut. 2019, 249, 992–1001. [Google Scholar] [CrossRef] [PubMed]
  33. Xu, X.; Lin, H.; Fu, Z. Probe into the method of regional ecological risk assessment—a case study of wetland in the Yellow River Delta in China. J. Environ. Manag. 2004, 70, 253–262. [Google Scholar] [CrossRef]
  34. Zhai, T.; Wang, J.; Fang, Y.; Qin, Y.; Huang, L.; Chen, Y. Assessing ecological risks caused by human activities in rapid urbanization coastal areas: Towards an integrated approach to determining key areas of terrestrial-oceanic ecosystems preservation and restoration. Sci. Total Environ. 2020, 708, 135153. [Google Scholar] [CrossRef] [PubMed]
  35. Hayes, E.H.; Landis, W.G. Regional ecological risk assessment of a near shore marine environment: Cherry Point, WA. Hum. Ecol. Risk Assess. Int. J. 2004, 10, 299–325. [Google Scholar] [CrossRef]
  36. Arkema, K.K.; Verutes, G.; Bernhardt, J.R.; Clarke, C.; Rosado, S.; Canto, M.; Wood, S.A.; Ruckelshaus, M.; Rosenthal, A.; McField, M.; et al. Assessing habitat risk from human activities to inform coastal and marine spatial planning: A demonstration in Belize. Environ. Res. Lett. 2014, 9, 114016. [Google Scholar] [CrossRef]
  37. Duggan, J.M.; Eichelberger, B.A.; Ma, S.; Lawler, J.J.; Ziv, G. Informing management of rare species with an approach combining scenario modeling and spatially explicit risk assessment. Ecosyst. Health Sustain. 2015, 1, 1–18. [Google Scholar] [CrossRef]
  38. Cabral, P.; Levrel, H.; Schoenn, J.; Thiébaut, E.; Le Mao, P.; Mongruel, R.; Rollet, C.; Dedieu, K.; Carrier, S.; Morisseau, F.; et al. Marine habitats ecosystem service potential: A vulnerability approach in the Normand-Breton (Saint Malo) Gulf, France. Ecosyst. Serv. 2015, 16, 306–318. [Google Scholar] [CrossRef]
  39. Wyatt, K.H.; Griffin, R.; Guerry, A.D.; Ruckelshaus, M.; Fogarty, M.; Arkema, K.K. Habitat risk assessment for regional ocean planning in the U.S. Northeast and Mid-Atlantic. PLoS ONE 2017, 12, e0188776. [Google Scholar] [CrossRef]
  40. Chen, Y.; Li, Y.; Qi, X.; Chen, W.; Lin, J. Assessing ecosystem risk in coastal wetland of the South Fujian Golden Delta using a habitat risk assessment model based on the land-use effect on tidal flat wetland. Acta Ecol. Sin. 2018, 38, 4214–4225. [Google Scholar] [CrossRef]
  41. Xu, Y.; Xu, X.; Tang, Q. Human activity intensity of land surface: Concept, methods and application in China. J. Geogr. Sci. 2016, 26, 1349–1361. [Google Scholar] [CrossRef]
  42. Firozjaei, M.K.; Sedighi, A.; Argany, M.; Jelokhani-Niaraki, M.; Arsanjani, J.J. A geographical direction-based approach for capturing the local variation of urban expansion in the application of CA-Markov model. Cities 2019, 93, 120–135. [Google Scholar] [CrossRef]
  43. Zhao, M.; He, Z.; Du, J.; Chen, L.; Lin, P.; Fang, S. Assessing the effects of ecological engineering on carbon storage by linking the CA-Markov and InVEST models. Ecol. Indic. 2019, 98, 29–38. [Google Scholar] [CrossRef]
  44. Mansour, S.; Al-Belushi, M.; Al-Awadhi, T. Monitoring land use and land cover changes in the mountainous cities of Oman using GIS and CA-Markov modelling techniques. Land Use Policy 2020, 91, 104414. [Google Scholar] [CrossRef]
  45. Zhang, L.; Deng, W.; Yan, J.; Tang, X. The Influence of Multi-Dimensional Cognition on the Formation of the Sense of Place in an Urban Riverfront Space. Sustainability 2020, 12, 178. [Google Scholar] [CrossRef] [Green Version]
  46. Shi, S.; Kondolf, G.M.; Dihua, L. Urban River Transformation and the Landscape Garden City Movement in China. Sustainability 2018, 10, 4103. [Google Scholar] [CrossRef] [Green Version]
  47. Zhang, W.; Zhu, Y.; Jiang, J. Effect of the urbanization of wetlands on microclimate: A case study of Xixi Wetland, Hangzhou, China. Sustainability 2016, 8, 885. [Google Scholar] [CrossRef] [Green Version]
  48. Zhao, H.; Wang, X.; Cai, Y.; Liu, W. Wetland transitions and protection under rapid urban expansion: A case study of Pearl River estuary, China. Sustainability 2016, 8, 471. [Google Scholar] [CrossRef] [Green Version]
  49. Song, Y.; Song, X.; Shao, G. Response of Water Quality to Landscape Patterns in an Urbanized Watershed in Hangzhou, China. Sustainability 2020, 12, 5500. [Google Scholar] [CrossRef]
  50. Wang, C.; Li, J.; Zhu, L. Assessment and exploitation of the waterfront resources in the middle and lower reaches of the Yangtze River. J. Geogr. Sci. 2003, 13, 76–84. [Google Scholar] [CrossRef]
  51. Jiang, X.; Zheng, C.; Liu, C.; Zhang, W. Coupling between Carbon Efficiency and Technology Absorptive Capacity—A Case Study of the Yangtze River Economic Belt. Sustainability 2020, 12, 8010. [Google Scholar] [CrossRef]
  52. Bao, H.; Wang, C.; Han, L.; Wu, S.; Lou, L.; Xu, B.; Liu, Y. Resources and Environmental Pressure, Carrying Capacity, And Governance: A Case Study of Yangtze River Economic Belt. Sustainability 2020, 12, 1576. [Google Scholar] [CrossRef] [Green Version]
  53. Sharp, R.; Tallis, H.T.; Ricketts, T.; Guerry, A.D.; Wood, S.A.; Chaplin-Kramer, R.; Nelson, E.; Ennaanay, D.; Wolny, S.; Olwero, N.; et al. InVEST User’s Guide: Integrated Valuation of Ecosystem Services and Tradeoffs, version 3.6.0. 2018. Available online: http://data.naturalcapitalproject.org/nightly-build/invest-users-guide/html/habitat_quality.html (accessed on 1 February 2019).
  54. Wang, L.; Yu, D.; Liu, Z.; Yang, Y.; Zhang, J.; Han, J.; Mao, Z. Study on NDVI changes in Weihe Watershed based on CA-Markov model. Geol. J. 2018, 53, 435–441. [Google Scholar] [CrossRef]
  55. Zhu, H.; Li, X. Discussion on the index method of regional land use change. Acta Geogr. Sin. 2003, 58, 643–650. [Google Scholar] [CrossRef]
  56. Chuang, C.; Lin, C.; Chien, C.; Chou, W. Application of Markov-chain model for vegetation restoration assessment at landslide areas caused by a catastrophic earthquake in Central Taiwan. Ecol. Model. 2011, 222, 835–845. [Google Scholar] [CrossRef]
  57. Fu, X.; Wang, X.; Yang, Y.J. Deriving suitability factors for CA-Markov land use simulation model based on local historical data. J. Environ. Manag. 2018, 206, 10–19. [Google Scholar] [CrossRef]
  58. Halmy, M.W.A.; Gessler, P.E.; Hicke, J.A.; Salem, B.B. Land use/land cover change detection and prediction in the north-western coastal desert of Egypt using Markov-CA. Appl. Geogr. 2015, 63, 101–112. [Google Scholar] [CrossRef]
  59. Faichia, C.; Tong, Z.; Zhang, J.; Liu, X.; Kazuva, E.; Ullah, K.; Al-Shaibah, B. Using RS Data-Based CA–Markov Model for Dynamic Simulation of Historical and Future LUCC in Vientiane, Laos. Sustainability 2020, 12, 8410. [Google Scholar] [CrossRef]
  60. Ruben, G.B.; Zhang, K.; Dong, Z.; Xia, J. Analysis and Projection of Land-Use/Land-Cover Dynamics through Scenario-Based Simulations Using the CA-Markov Model: A Case Study in Guanting Reservoir Basin, China. Sustainability 2020, 12, 3747. [Google Scholar] [CrossRef]
  61. Sang, L.; Zhang, C.; Yang, J.; Zhu, D.; Yun, W. Simulation of land use spatial pattern of towns and villages based on CA-Markov model. Math. Comput. Model. 2011, 54, 938–943. [Google Scholar] [CrossRef]
  62. Aburas, M.M.; Ho, Y.M.; Ramli, M.F.; Ash’Aari, Z.H. Improving the capability of an integrated CA-Markov model to simulate spatio-temporal urban growth trends using an Analytical Hierarchy Process and Frequency Ratio. Int. J. Appl. Earth Obs. Geoinf. 2017, 59, 65–78. [Google Scholar] [CrossRef]
  63. Ministry of Natural Resources. China’s Statistical Bulletin on Land, Mineral and Marine Resources in 2017. 2018. Available online: http://gi.mnr.gov.cn/201805/t20180518_1776792.html (accessed on 18 May 2018).
  64. Li, W.; Feng, T.; Hao, J. The evolving concepts of land administration in China: Cultivated land protection perspective. Land Use Policy 2009, 26, 262–272. [Google Scholar] [CrossRef]
  65. Wu, Y.; Shan, L.; Guo, Z.; Peng, Y. Cultivated land protection policies in China facing 2030: Dynamic balance system versus basic farmland zoning. Habitat Int. 2017, 69, 126–138. [Google Scholar] [CrossRef]
  66. Su, M.; Guo, R.; Hong, W. Institutional transition and implementation path for cultivated land protection in highly urbanized regions: A case study of Shenzhen, China. Land Use Policy 2019, 81, 493–501. [Google Scholar] [CrossRef]
  67. Liu, S.L.; Liu, Q.; Zhang, Z.L.; Deng, L.; Dong, S.K. Landscape ecological risk and driving force analysis in Red river Basin. Acta Ecol. Sin. 2014, 34, 3728–3734. [Google Scholar] [CrossRef] [Green Version]
  68. Wang, P.; Wang, Y.J.; Liu, X.P.; Chen, X.; Kong, F.X. Ecological risk assessment of an ecological migrant resettlement region based on landscape structure: A case study of Hongsibu in Ningxia. Acta Ecol. Sin. 2018, 38, 2672–2682. [Google Scholar] [CrossRef] [Green Version]
  69. Müller, B.; Berg, M.; Yao, Z.P.; Zhang, X.F.; Wang, D.; Pfluger, A. How polluted is the Yangtze river? Water quality downstream from the Three Gorges Dam. Sci. Total Environ. 2008, 402, 232–247. [Google Scholar] [CrossRef]
  70. Wong, C.; Williams, C.; Collier, U.; Schelle, P.; Pittock, J. World’s Top 10 Rivers at Risk. World Wildlife Fund for Nature. 2007. Available online: http://www.unwater.org/downloads/worldstop10riversatriskfinalmarch13_1.pdf (accessed on 16 March 2007).
  71. Floehr, T.; Xiao, H.; Scholz-Starke, B.; Wu, L.; Hou, J.; Yin, D.; Zhang, X.; Ji, R.; Yuan, X.; Ottermanns, R.; et al. Solution by dilution?—A review on the pollution status of the Yangtze River. Environ. Sci. Pollut. Res. 2013, 20, 6934–6971. [Google Scholar] [CrossRef]
  72. Yang, Z.; Wang, Y.; Shen, Z.; Niu, J.; Tang, Z. Distribution and speciation of heavy metals in sediments from the mainstream, tributaries, and lakes of the Yangtze River catchment of Wuhan, China. J. Hazard. Mater. 2009, 166, 1186–1194. [Google Scholar] [CrossRef]
  73. Pan, B.; Yuan, J.; Zhang, X.; Wang, Z.; Chen, J.; Lu, J.; Yang, W.; Li, Z.; Zhao, N.; Xu, M. A review of ecological restoration techniques in fluvial rivers. Int. J. Sediment Res. 2016, 31, 110–119. [Google Scholar] [CrossRef]
  74. Chongqing Urban Rural Development Committee. Implementation Plan of Ecological Restoration in Chongqing City. 2017. Available online: http://zfcxjw.cq.gov.cn/zwxx_166/gsgg/201706/t20170613_4155866.html (accessed on 13 June 2017).
  75. Nanjing Municipal People’s Government. Nanjing Ecological Civilization Construction Plan 2018–2020 (Revised). 2019. Available online: http://www.nanjing.gov.cn/xxgkn/zfgb/201904/t20190428_1523524.html (accessed on 25 February 2019).
  76. Wuhan Ecological Environment Bureau. Implementation of the Special Action Work Plan for the Protection and Restoration of the Yangtze River. 2019. Available online: http://59.173.11.92/wrFzgjz/36875.jhtml (accessed on 19 September 2019).
  77. Luo, F.; Liu, Y.; Peng, J.; Wu, J. Assessing urban landscape ecological risk through an adaptive cycle framework. Landsc. Urban Plan. 2018, 180, 125–134. [Google Scholar] [CrossRef]
  78. Huang, L.Y.; Liu, S.H.; Li, J. Spatial and temporal dynamics of urban ecological land use and its related driving forces: A case study of Wuhan city. Resour. Environ. Yangtze Basin 2019, 28, 1059–1069. [Google Scholar]
  79. Lindley, S.; Pauleit, S.; Yeshitela, K.; Cilliers, S.; Shackleton, C. Rethinking urban green infrastructure and ecosystem services from the perspective of sub-Saharan African cities. Landsc. Urban Plan. 2018, 180, 328–338. [Google Scholar] [CrossRef] [Green Version]
  80. Navarrete-Hernandez, P.; Laffan, K. A greener urban environment: Designing green infrastructure interventions to promote citizens’ subjective wellbeing. Landsc. Urban Plan. 2019, 191, 103618. [Google Scholar] [CrossRef]
  81. Yangtze River Water Conservancy Commission of Ministry of Water Resources. Water Resources Bulletin of Yangtze River Basin and Southwest Rivers in 2017. 2018. Available online: http://www.cjw.gov.cn/UploadFiles/zwzc/2018/9/201809111925363456.pdf (accessed on 11 September 2018).
Figure 1. Distribution of study area.
Sustainability 13 00411 g001
Figure 2. Changes in wetland and ecological pressure source from 1990 to 2030.
Sustainability 13 00411 g002
Figure 3. Land use pattern in 2015 and 2030 (natural development scenario (NDS) and ecological protection scenario (EPS)) in Chongqing.
Sustainability 13 00411 g003
Figure 4. Land use pattern in 2015 and 2030 (NDS and EPS) in Wuhan.
Sustainability 13 00411 g004
Figure 5. Land use pattern in 2015 and 2030 (NDS and EPS) in Nanjing.
Sustainability 13 00411 g005
Figure 6. The impact of human activities on wetlands in 2015 and 2030 (NDS and EPS) in Chongqing.
Sustainability 13 00411 g006
Figure 7. The impact of human activities on wetlands in 2015 and 2030 (NDS and EPS) in Wuhan.
Sustainability 13 00411 g007
Figure 8. The impact of human activities on wetlands in 2015 and 2030 (NDS and EPS) in Nanjing.
Sustainability 13 00411 g008
Figure 9. Ecological risks of riverbank of the Yangtze River in different cities in 2015.
Sustainability 13 00411 g009
Table 1. Grading of exposure and consequence indicators.
CriteriaScore
0123
Exposure
spatial overlapNOYES--
temporal overlap-0–4 months of the year4–8 months of the year8–12 months of the year
intensity-Low intensityMedium intensityHigh intensity
Consequence-
change in area-Low loss in area
(0–20%)
Medium loss in area
(20–50%)
High loss in area
(50–100%)
change in structure-Low loss in structure
(0–20%)
Medium loss in structure
(20–50%)
High loss in structure
(50–100%)
frequency of natural disturbance-Daily to weeklySeveral times per yearAnnually or less often
Table 2. Effects of different human activities on wetlands.
Land Use TypeChongqingWuhanNanjing
20152030 NDS2030 EPS20152030 NDS2030 EPS20152030 NDS2030 EPS
Rural settlement1.421.31.351.491.511.471.621.551.55
Dryland1.631.81.531.591.581.581.291.271.27
Other construction land1.451.81.81.781.821.611.41.681.68
City1.431.561.551.331.91.791.591.711.48
Publisher’s Note: MDPI stays neutral with regard to jurisdictional claims in published maps and institutional affiliations.

