A WebGIS for Visualizing Historical Activities Based on Photos: The Project of Yunnan–Vietnam Railway Web Map


Department of Historical and Geographical Sciences and the Ancient World, University of Padua, 35141 Padova, Italy
*
Author to whom correspondence should be addressed.
Sustainability 2021, 13(1), 419; https://0-doi-org.brum.beds.ac.uk/10.3390/su13010419
Submission received: 8 December 2020
/
Revised: 30 December 2020
/
Accepted: 30 December 2020
/
Published: 5 January 2021
(This article belongs to the Special Issue Remote Sensing for Archaeology and Cultural Landscapes)
Abstract
:Historical photos have significance for historical and social studies. Especially, the introduction of Geographic Information System (GIS) and digitalized historical photos have brought more opportunities and possibilities for interdisciplinary studies and the convenience for normal citizens to participate in the landscape observation. To this aim, this paper first reviews the research related to historical photos and Open GIS, and points out the meaning of historical photos for the Yunnan–Vietnam Railway (YVR). Based on the collected data of original historical photos from archives and the fieldwork data that recorded the landscape along the railway from 2018 to 2019, a WebGIS of Yunnan–Vietnam Railway is designed and implemented with open GIS tools. All the data are processed in the QGIS as vector and raster layers and loaded in PostgreSQL as relational tables. Then, heatmaps are created indicating the density of historical activities of the railway company, the other historical photographers, and current touristic activities. Connected with the PostgreSQL database, the data are uploaded to GeoServer for more GIS functionalities. Finally, the whole system lives in a webpage, implemented in HTML and JavaScript with Leaflet, and the improved functionalities of the Yunnan–Vietnam Railway WebGIS include distance measuring, search engine, and historical information browsing. In the future, further research can be done focusing on the landscape changes along the railway and public participation during the landscape observation.
1. Introduction
On a worldwide scale, natural areas and landscapes are subject to severe shifts owing to human activities, including the agricultural/urban policies and the development of industry, population, and housing. Such changes may lead to serious consequences, such as the decline of biodiversity, deterioration of landscape and environmental quality, and a loss in the sustainable economy. A study of historical activities means a lot for future sustainability. For example, research on past natural resource consumption aids in the prediction of future resource consumption and its environmental impacts [1], as a better understanding of historic landscape serves for future urban and rural planning, heritage protection, and regional sustainable development. Particularly, historical documents play a significant role in this process [2].
Historical documents, such as historical paintings, maps, photographs, and manuscripts, usually involve intellectual contents and knowledge for scientists and normal people, whose loss can result in an impoverishment of the common assets of human beings [3]. Among those, images are one of the media used to express and record history since the birth of photography in the 19th century. Photographic technology has made numerous contributions to helping in the systematic documentation of ethnographic phenomenon [4]; describing the picturesque landscapes in accordance with esthetic practices; highlighting the characteristics of some specific territories and attracting visitors to these new places [5]; and studying environmental changes and landscape perception [6]. When the modern visual media started to be presented in front of the public, images, as not only a supplement to traditional manuscripts but also a unique approach, have been increasingly valued in historical and social studies.
Old photos are one of the main forms of historical image with some characteristics compared with other manuscripts: they are more intuitive, emotional, and visually attractive as artistic works and records of reality. Traditionally, historical photos are interpreted as auxiliary evidence for specific historical events and explain the relationship between different historical figures. Photographic works seem to reproduce the reality objectively, can also be deceptive or misunderstood if lacking corresponding academic backgrounds, affected strongly by personal orientations. For example, during the upsurge of exploring the “Far East” in the 19th century, some Westerners employed locals to capture the constructed scenes to fabricate the Chinese customs, aiming to meet the stereotypes from Western countries [7]. Still, historical photos have an irreplaceable status, which makes up for the shortcomings of traditional literature, enrich teaching processes, disseminate knowledge in a more popular way, and broaden the perspectives of traditional historical research [8]. In some projects, historical photos own a central position, for instance, themed exhibitions and online photo galleries.
Next, the relationship between photography and landscape is close. The first photograph was taken within a topic of urban views by a French inventor, Nicéphore Niépce, known as the father of photography. As a medium for creating images, the early landscape photography in the form of postcards or illustrations resulted in a modern understanding of time and space, which became popular since the early 20th century. The pioneers of landscape photography took a variety of sources as their objects, such as valleys, rivers, mountains, as well as rural landscapes, which promoted an increasing environment awareness and the prominent role of photography in pointing to the character of places [9]. Thus, photography is proved to be an efficient and crucial way of landscape observation in the 21st century, to study the changes over time in natural and cultural landscapes. In this process, it is regarded not only as an interpretative tool but also as a part of heritages with values in itself. A series of scientific results are related to this topic, such as using photography to study urban landscape [10] and national parks [11]. From the viewpoint of historical photographers, their activities indicated the human footprints left in history, which is meaningful for ecological studies, especially during the preservation of ecological functions and maintenance of biodiversity. For example, the settlements of human beings caused the land-use changes; the human-made fires directly lead to changes in vegetation structure and landscape. The historical landscape and human activities can be analyzed quantitatively to reveal the human pressure on the environment and landscape. Nevertheless, using historical photos in these studies is confronting more difficulties, such as the copyright problem, the geotagging process, and information interpretation [12].
Simultaneously, in this information age, technology and history interact more with each other, and history is being recorded and spread in diversified ways [13]. The digitalization of historical documents has already been an important trend, providing more convenience for normal users to get access to those valuable materials and memories. Thus, the historical, economic, and cultural value of old photos induced the use of digital techniques to conserve them as cultural objects and touristic resources, from which also emerged more approaches to present and analyze those photos. Abundant academic results are also produced. Thus, historical photos are used to study the social activities of historical persons with visualization tools, such as their footprints and relationships [14]; present visually for building the augmented reality (AR) for touristic and heritage sites [15]; compare with current photos as the “repeat photography method (rephotography)” for reading, perceiving and studying the past landscape and environment [16,17]; expand the uses of aerial photography in archaeology [18]; study the old photographic techniques [19]; build digital library for knowledge sharing [20,21]; promote public participation during the historic landscape observation [22].
Among different research methods, GIS is a powerful toolset and methodology for supporting design, planning, and decision-making processes in various fields, such as urban and rural planning, environmental monitoring, and heritage protection. It can also provide supports for the digitalization of history and analysis tools for understanding better the history. Using GIS in historical research has some advantages, such as creating spatial database to integrate incompatible historical data; visualizing historical data by animations or virtual landscapes; doing spatial analysis related to historical relationships [23]. Thus, it has been widely associated with the studies relevant to historic village, urban and environmental changes, historical hydrology, urban economy and history, explanation of ancient maps, and so on. [24]. Further, the “spatial turn” in history introduced the birth of Historical-GIS (HGIS) [25].
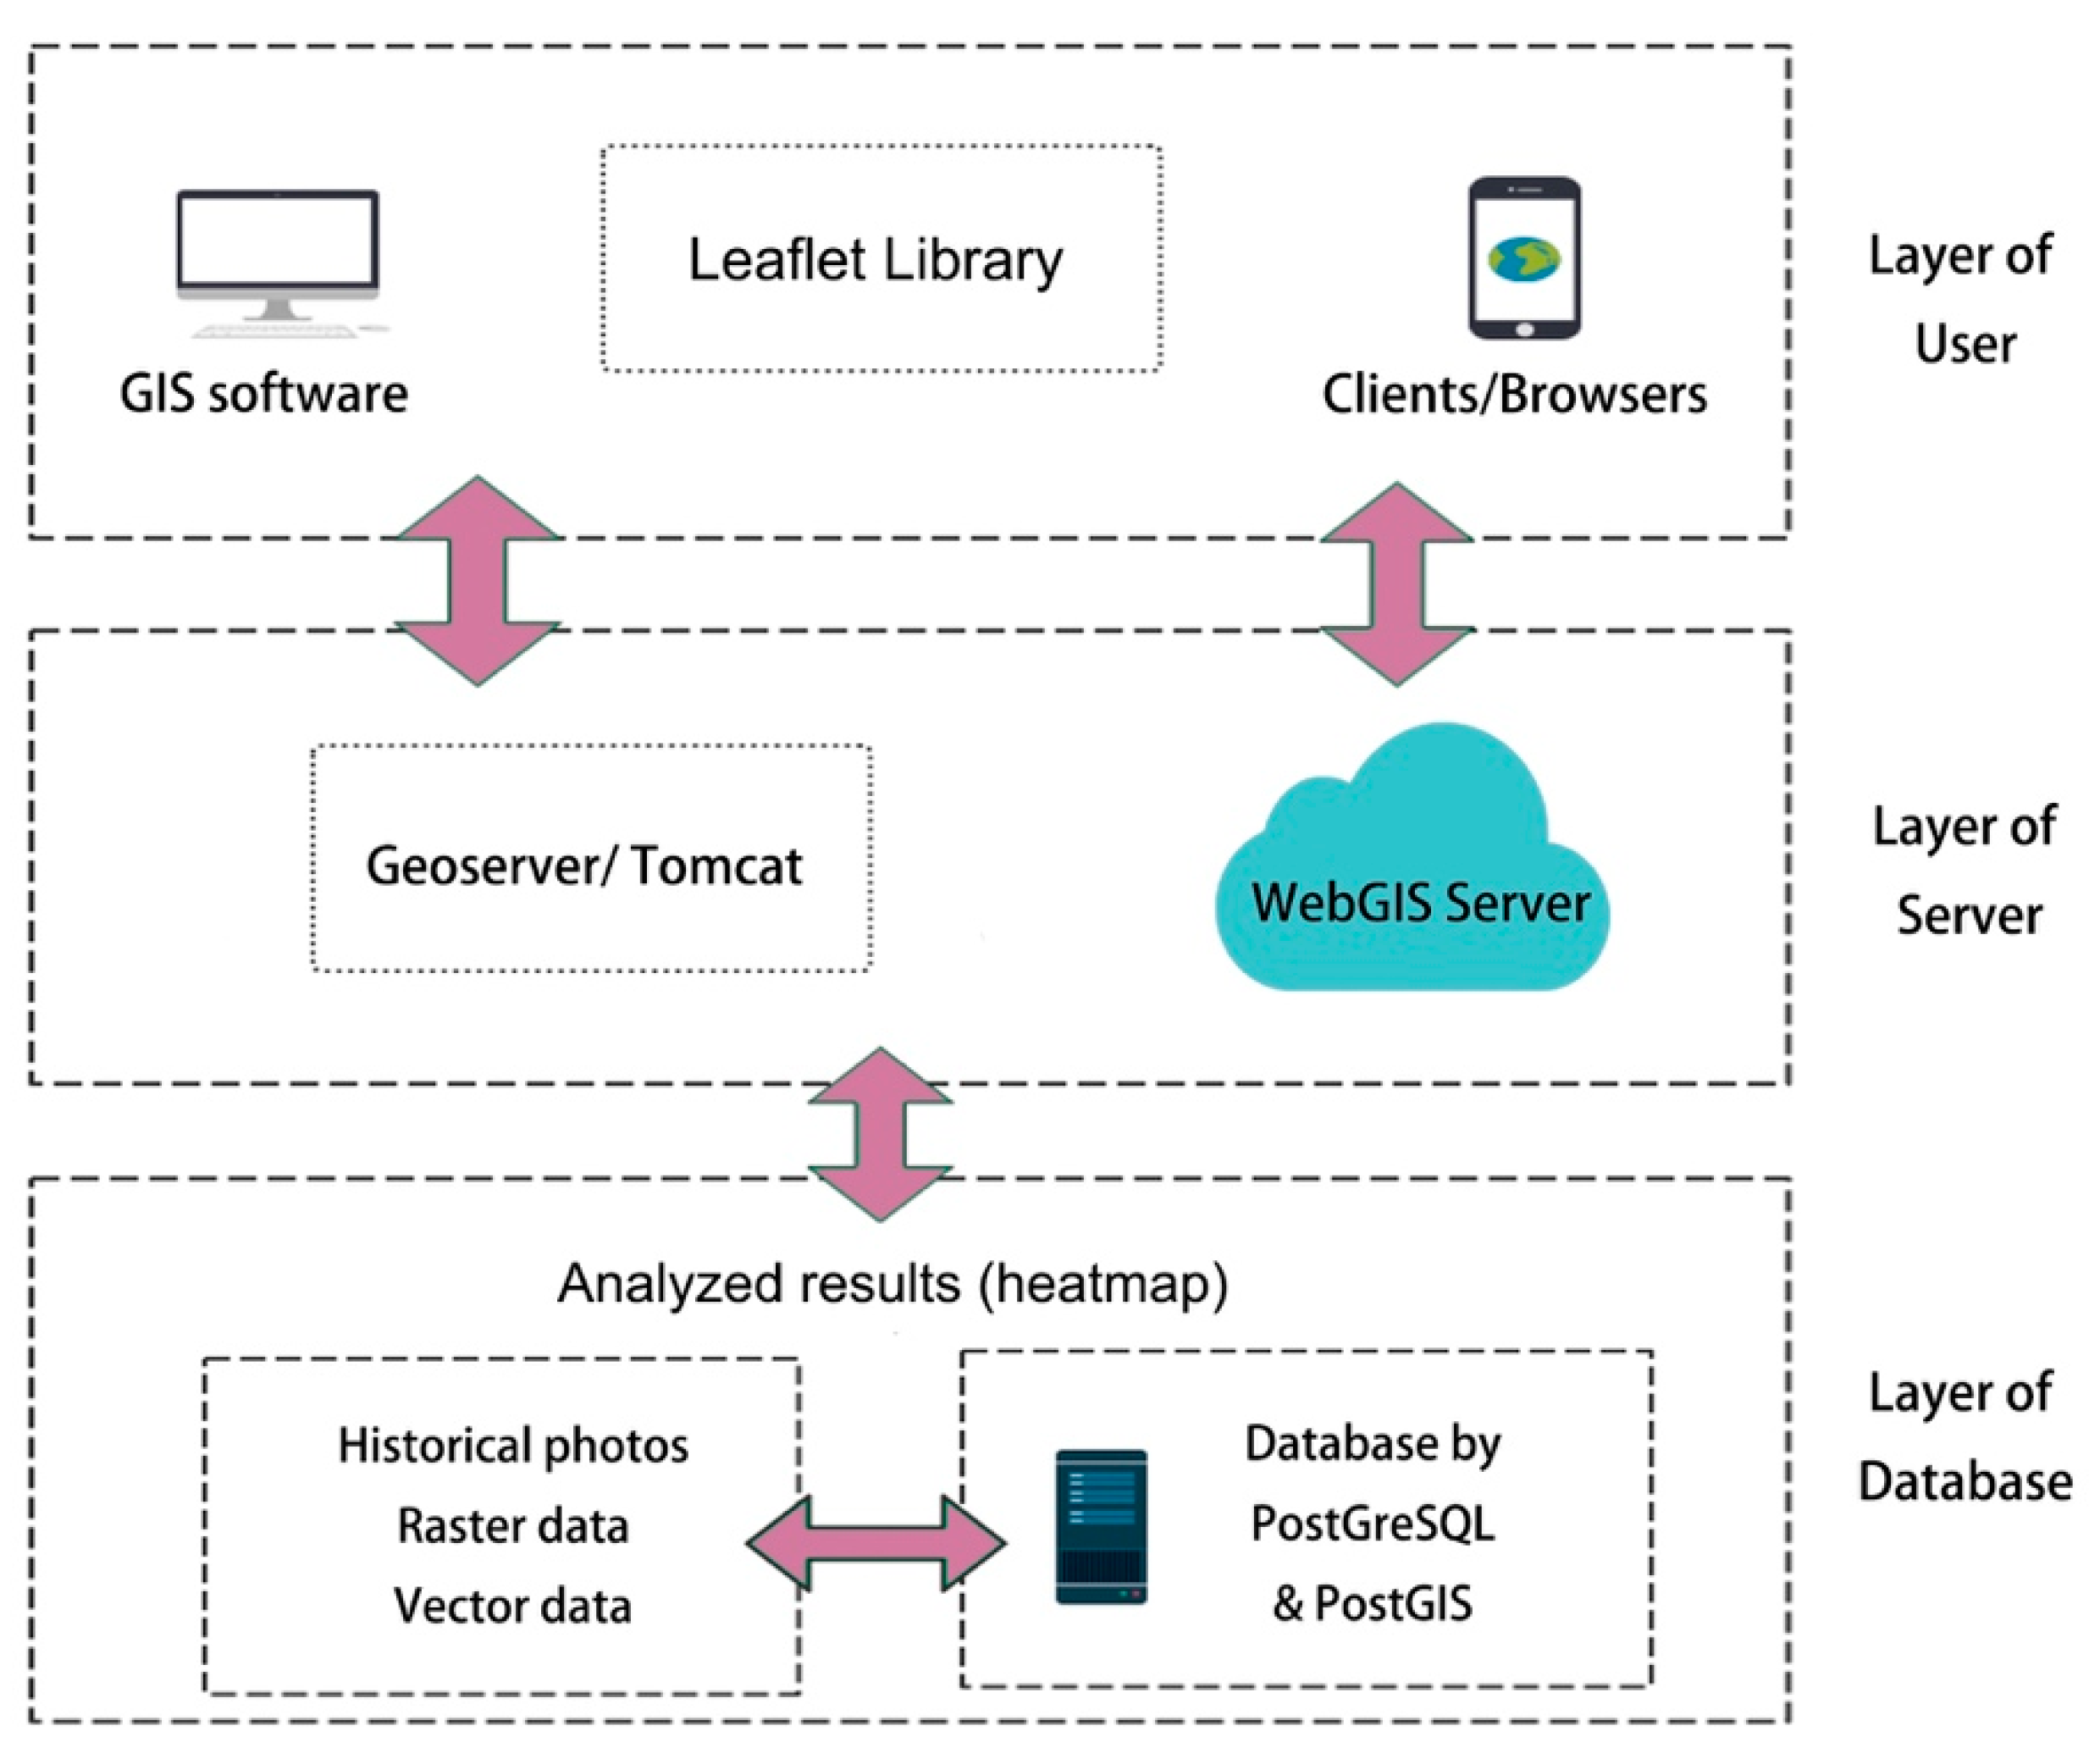
Different from other commercial GIS, Open GIS intends to open and free GIS applications. These platforms can offer more opportunities and convenience for scholarly and non-scholarly users, for example, a powerful engine for dealing with spatial big data; confronting the challenges of the rapidly changing environment; facilitating an open geographic education for universities and other GIS communities [26]. The architecture of using Open GIS to fulfill a WebGIS is discussed in former research [27,28]. For each layer in WebGIS, there are all open tools to support it. In the storage layer, geospatial data, including the metadata, can be connected and stored in the PostgreSQL (https://www.postgresql.org) as geodatabase. Relational tables can be created to store metadata, vector, raster, and the configuration information of the architecture. In the function layer, QGIS (https://qgis.org/en/site/) provides useful spatial tools for doing various kinds of geo-analysis. In the service layer, the GeoServer (http://geoserver.org) played an important role between the browser of client and web server, which provides services of metadata and spatial data based on the function modules, as well as the Application Programming Interface (API) for the integrated web application. Then, the portal site is developed in the application layer to provide a web interface to the public by Leaflet (https://leafletjs.com), as a JavaScript for developing webpages with open codes [29].
Though using GIS for analyzing the shared photos over social media is not a new direction [30,31], digitalized historical photos are not given enough concern. Some scholars discussed the design, usability, and functionality of interactive maps for photographs [32,33], namely the introduction of WebGIS for historical photography. Web technology has brought new possibilities for WebGIS applications. Combining the Internet with spatial data, WebGIS is a pattern that realized the storage, analysis, and mapping of data on the Internet. Also, it is an integrated globalized client/server network system for spatial interoperability and decision-making. Compared with traditional GIS, designed spatial functions can be fulfilled online, which owns the advantages in interactive mapping on cross-platforms, rapid data release, timely updating, and global access. As for the visualization of historical collections, WebGIS improves the usability and effectiveness by presenting history in map applications so that visitors can easily look through the information behind the historical photos, gain cultural knowledge and engage more in local issues. The data shareability is also improved among disciplinary projects [34].
There are already some mature online products. For example, the “Old Photo System (http://140.112.30.226:8021/data_map/)” has collected thousands of historical materials from the 20th century in China. Geotagged the historical photos on web maps, it provides different information searching functions by keywords, regions, and timeline. Through this system, all the data are open, including the title of photo, information of photographers, and description of the places in the photos. Thus, historical knowledge is easily accessed by normal readers. Then, the “Recollecting Landscapes project (http://www.recollectinglandscapes.be/)” successfully applied the rephotography with WebGIS to study the evolution of landscape using the historical photos taken by famous Belgian photographers. The date of the photoshoot, coordinates, and landscape descriptions are attached online with historical photos. Moreover, the “Silk Road Platform (http://www.srhgis.com)” is another comprehensive WebGIS project, which organized the historical data related to cultural exchange, transportation, land use, settlements, relics, religions, and historical environment related to the Silk Road. A history galley is included, containing the spatial information of thousands of old photos and maps. However, in these systems, only the photo locations are attached to the interactive map. Further analysis of the relationship among the photographers and their historical backgrounds have not been discussed.
Based on the discussion above, this paper focuses on a historical railway, the YVR, and the main research objects are the historical photos left from the historical event of building the mountainous railway in Yunnan province (China) from the French colonial age in the early 20th century. YVR is a modern product of industrial technologies, which was constructed by a French railway company—“Compagnie française des chemins de fer de l′Indochine et du Yunnan” (Yunnan–Vietnam Railway Company, abbreviated as CIY) in 1910. It has a length of 855 km, extending from Kunming (capital of Yunnan in Southwest China), via Laocai, terminating in a port in North Vietnam—Haiphong (Figure 1). This paper focuses on only the Chinese section from Kunming to Laocai. The importance of this railway is recognized by international scholars, which is of great outstanding value from the perspectives of culture, art, technology, architecture, landscape, ecology, and tourism [35,36,37]. As a famous narrow-gauge railway in Asia, its construction process left thousands of images from railway contractors or other individuals. Some photographic themed exhibitions have been held successfully in China. However, those historical images conserved in archives have seldom been studied in previous research on YVR, neither in Chinese nor French. Moreover, the value of the historical photographs of YVR can be understood from four perspectives as follows, which also indicates the meanings of this project.
(1) Photographers were playing as participants in historical events. The works of the photographers related to YVR reflected their personal interests, everyday life, and orientation for colonial activities. What is in common is their rich topics of photographs, covering many aspects of life, such as the folk customs, everyday landscape, and the daily working scenes of railway workers. These photos opened a window for anthropological and other social studies, showing a reflection of Chinese society in the eyes of western colonists (the workers of the railway company were mainly from France and Italy during 1901–1910, but the remained photographs are all from the French workers) [38].
(2) Historical images are valuable documents in an auxiliary position for completing the written history. They contain the basic information of the authors and the time and place of shooting. Reading the historical images requires a comprehensive study of the historical context and using different methods to dig deeper information behind it, such as the narrative function, emotions represented, and other variables inside the context. Therefore, the YVR images, as complement materials, are one of the important ways to reconstruct the French colonial history, providing evidence for the study of modern railway technology and environmental changes of the corresponding regions [39].
(3) The YVR photos own the characteristics of the colonial era. During the colonial expansion, photography became a popular method for recording everything for the colonists, to explore the exotic wonders, landscape, culture, and customs. The construction of large-scale railway projects was a method of economic and military expansion in the colony, regarded as visual attractiveness by scholars. Historical pictures were used as mass media tools to shape the image of civilization in the colony, reflected the ambitions of the colonists and their imagination of spreading freedom and equality. These pictures also appeared in the official publications of colonial authorities, to prove the success of the blueprint of colonial constructions [40,41].
(4) Historical photos are also an internal part of movable cultural heritage. They play an indispensable role in the heritage restoration for individual buildings, infrastructure as well as historic landscapes [42]. The defects of historical photos, such as low pixel, distortion, or damages caused by improper storage, are overcome by modern digital technology. In some projects, the digitized historical images of historic buildings are analyzed to show the details of building decorations [43]. Moreover, the photogrammetry method based on historical photos is applied in many cases, for example, the restoration of modern buildings in Berlin after the wars [44].
Therefore, the research question is proposed, namely, how can the WebGIS (open tools) serve for the visualization of historical activities related to the Yunnan–Vietnam Railway. For this question, the aims of this project are threefold: (1) systemize the sources of historical photos of YVR; (2) combine spatial analysis with statistical tools, analyze the historical activity of historical photographers; (3) use open GIS tools to design a WebGIS platform for publishing and visualizing these historical photos and the analyzed results. The proposed framework is based on PostgreSQL as geodatabase, GeoServer as the map server, and Leaflet as the client-side mapping library. The user interface of WebGIS is designed to adapt to various browsers, with features of a desktop GIS, to show specific information on the historical photos. Users can visualize photos taken by the authors during the two-year fieldwork to check the comparison between historical photos and the current landscape. The counties with more historical activities or modern tourism activities are also indicated on the webpage.
2. Materials and Methods
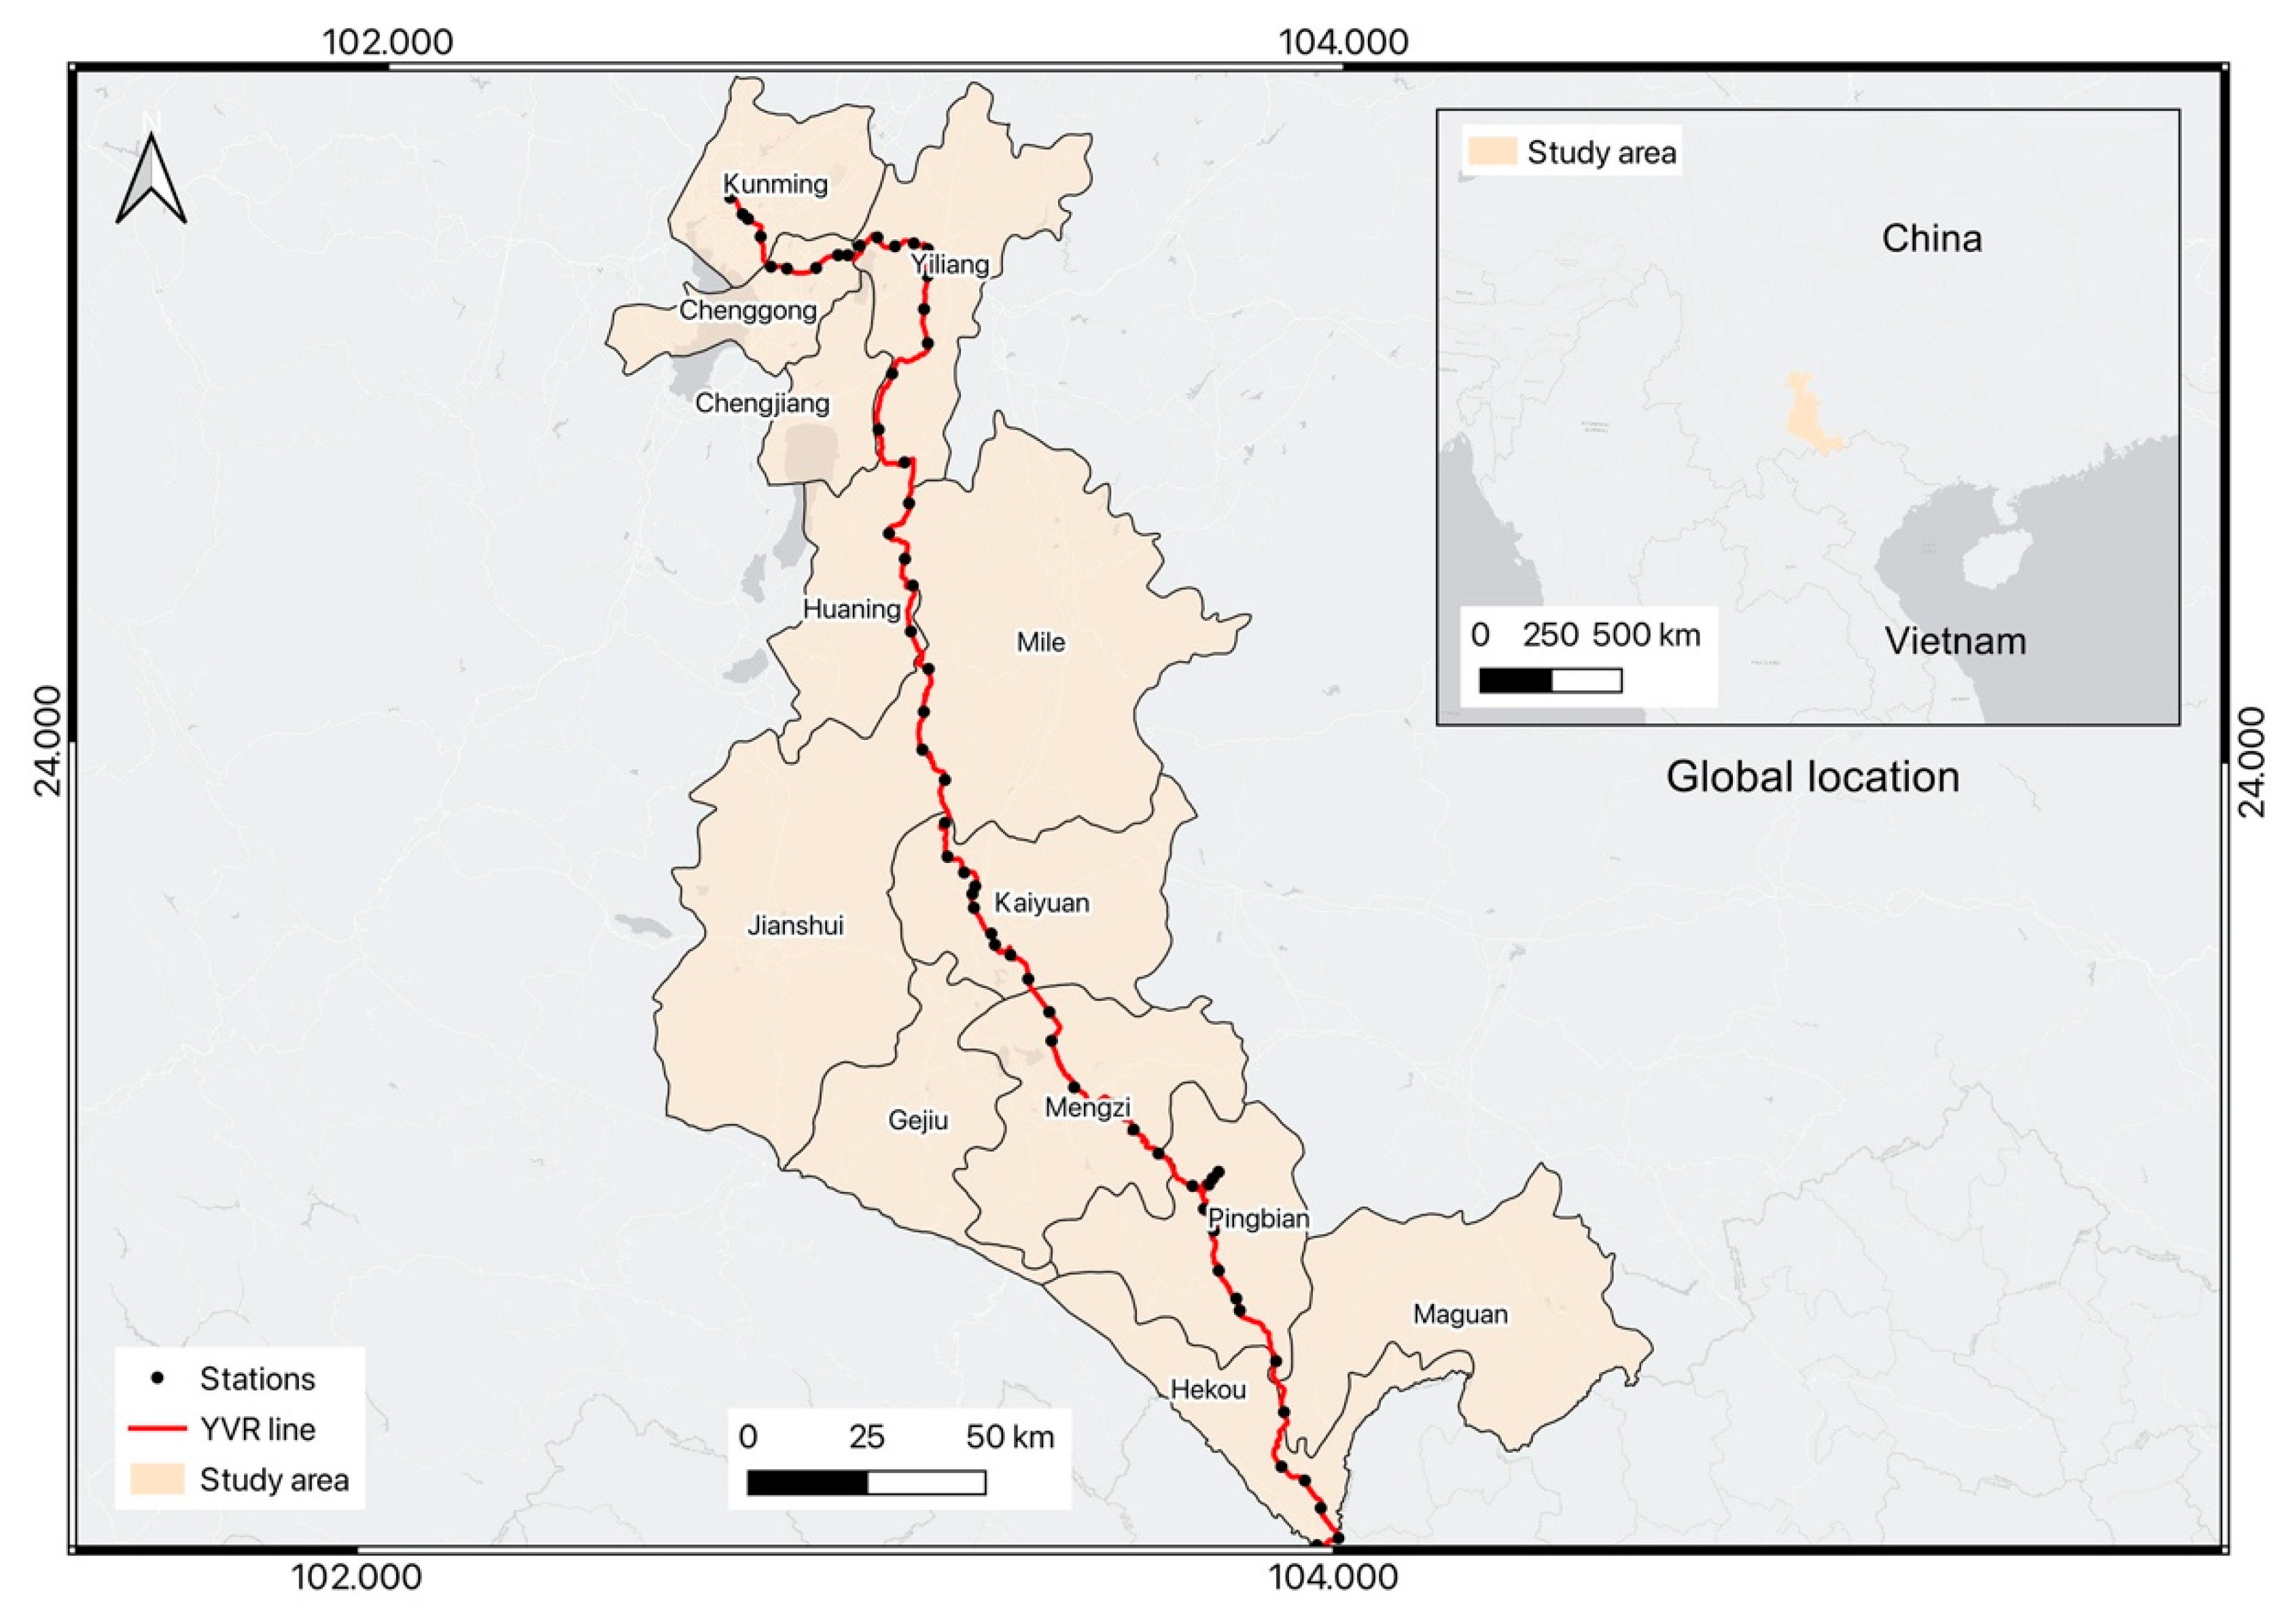
Railway was a principal method for traveling in the 20th century, and its industrial elements, including rail, steam locomotives, and bridges, emerged widely within landscape paintings [45]. After the golden age of railway, there remain many railway images in the forms of paintings, photographs, and postcards, conserved digitally or physically in libraries, museums, or archives [46]. In this study, the historical photos of YVR are regarded as the research object in this paper, and the counties containing the YVR in Yunnan are defined as the study area (Figure 2).
According to fieldwork, currently, the original YVR images are protected in various archives, and three confirmed French photographers are important recorders of the history of Yunnan, namely Auguste Marbotte, Albert Marie, and Auguste François. Moreover, the photographic album of CIY stored in the Archive of Mulhouse also contains thousands of photos recorded the construction process from 1903–1906. The Archives Nationales d′Orere-mer has published online 22 photos taken by Têtard René and Busy Léon. After visiting the archives mentioned above and systemizing the related publications, there are in all 756 photos by CIY, 22 by René & Léon, 103 by François, 41 by Marbotte, and 26 by Marie collected for building the WebGIS and doing further geo-analysis. Table 1 listed all the related photographers and their information. Moreover, the touristic footprints on Flickr are collected to indicate the current popular sites among tourists (4206 points of geotagged locations taken from 2003–2014). The authors have also visited along the railway to record the landscape of YVR during 2018–2019. Therefore, 540 of the fieldwork photos are selected to show together with historical photos on the WebGIS. Because of the copyright problem, not all the original photos can be published online.
Based on the concepts of Historical GIS and WebGIS [47,48], this paper′s methodology is mainly inspired by the WebGIS platforms mentioned above. The traditional GIS is a tool, a technology, and an influential branch of geography, whose framework is composed of acquiring spatial data (land use/cover, soil, topography, hydrology, and so on) combined with remote sensing techniques or data collection through fieldwork with Global Positioning System (GPS), data analyzing in GIS environment (ArcGIS and QGIS) with the spatial tools already designed in the software, and outputting the data in the form of a digital or paper map with graphs, charts, and visualizations that help to interpret data spatially, temporally, and statistically. Meanwhile, the historical GIS usually involves four steps, including building historical GIS databases, processing data in HGIS, visualizing historical data, and exporting historical geographic information on the internet or as a digital library. In comparison, a general WebGIS framework is mainly composed of three parts: web browser as clients for sending their requests; a map server for handling geospatial data, providing data compatible services and spatial functionalities online such as editing, analyzing, routing, and tracking; a web server for responding to the user’s requests [49]. A common character of the WebGIS application is that it can create flexible and practical online tools based on a documented database of historical and modern data, to systemize, query, and present them at different levels of aggregation.
Thus, this paper mainly uses the Open GIS tools (PostgreSQL, QGIS, GeoServer, and Leaflet) for the analysis and visualization of the historical photos on Web mapping, and the heatmaps of historical persons and current touristic activities are also highlighted on the web map. The specific process in the paper is explained in Figure 3.
2.1. Organizing the PostgreSQL Database
Building a database is the first step to organize and systemize all the collected photographic data (the geotagging process of historical photos is not discussed in this paper). The database is designed and implemented using PostgreSQL, an open relational database management system (RDMS). Combined with PostGIS extension, the database can fulfill more spatial functions, which turns the PostgreSQL into a geodatabase with geometries and reference systems. The querying, creating, and editing of database schemas are supported by the structured query language (SQL). In PostgreSQL, geometry is its fundamental spatial data type, which was transformed and imported from Shapefile format in the Database Manager provided by QGIS (Figure 4). Then, PGadmin is the user interface of PostgreSQL for the management of databases, as well as the implementation of SQL. Moreover, in the relational database, a relationship is formed by correlating rows of tables through primary key and foreign key to effectively manage all the data [50]. The geodatabase for YVR photos is structured in relational tables, and all tables and their relationships are designed and shown in Figure 5.
2.2. Analyzing Data
To show the density of historical activities along the railway in Yunnan, the Heatmap tool in QGIS is introduced, which creates rasters of the density of input point data using kernel density estimation (KDE). The number of points in a location is calculated, and a larger value means a higher accumulation of clustered points. The kernel density mapping in this paper applies the formulation as follows (x(i): data point, k: kernel function, h: bandwidth) [51]:
In QGIS, the quartic kernel function is utilized, whose equation is as follows (d: distance):
After calculation, the density maps (heatmaps) are produced, indicating the cluster of historical activities of CIY and other photographers, as well as the modern tourists. Then, based on the kernel value, a statistical tool (Zonal statistics in QGIS) is used to estimate the distribution of historical photos in the study area (Figure 6).
2.3. Connect to GeoServer
GeoServer is an open-source WebGIS development platform, following the Open Geospatial Consortium (OGC) standard. It can be used to publish raster and vector data in Web mode. Many data formats such as shapefile, PostGIS, Oracle Spatial, and Geotiff are supported, which makes the publishing and sharing of spatial data easier and faster. In GeoServer, working space, storage, and layers are combined to complete the deployment of map data. Thus, users can edit, insert, delete, and update the geodata in different browsers. Nowadays, GeoServer can connect data to virtual 3D models (Google Earth), as well as to web maps such as OpenLayers, Leaflet, and Google Maps. In this paper, the PostgreSQL (PostGIS) database is directly connected to the GeoServer, to upload all the collected data on the WebGIS server [52]. The process and parameters are shown in Figure 7.
2.4. Leaflet Web Map
Basically, for designing a webpage, HTML (Hypertext Markup Language) is combined with CSS (cascading style sheets) for rules to limit the display area and objects, and JavaScript for designing the web functions. For programming the YVR interactive web map, the Leaflet is introduced and utilized. Leaflet is a light, open, and efficient JavaScript library for building web mapping applications. It supports the GeoJSON extension (a standard format specially for representing simple geographical features) for the webpages. Thus, all the vector layers are converted to GeoJSON files for their publishing with the help of QGIS [53]. Leaflet also owns abundant plugins, for example, the plugin of Leaflet “Leaflet Panel Layers” is useful for switching on or off the layers. “Leaflet-graphic scale” is the plugin for representing map scales graphically. The “Control Class” can also be used to add lots of operational tools for maps, such as navigation, zooming, roaming, layer control, and so on. After finishing these preparations, a Leaflet is created as an object in the webpage filet. Finally, an interactive web map of YVR is fulfilled and available for users through GitHub: https://vittoriosskk.github.io/Yunnan_Vietnam/.
3. Results
In conclusion, this paper figures out the process of using Open GIS for the visualization of YVR related historical activities on a designed webpage. It first reviews the importance of historical documents in various disciplines, especially the historical photos, which are of great value in landscape and environmental research. At the same time, the introduction of GIS in historical studies gave the birth of Historical GIS. With the help of Open GIS, more possibilities are available to deal with spatial big data, confront the challenges of rapid changes, and provide open geographic education for the public. In the project of Yunnan–Vietnam Railway WebGIS, those collected historical photos are meaningful because of their role in recording historical events, completing the written history, symbolizing the colonial era, and as a part of cultural heritage.
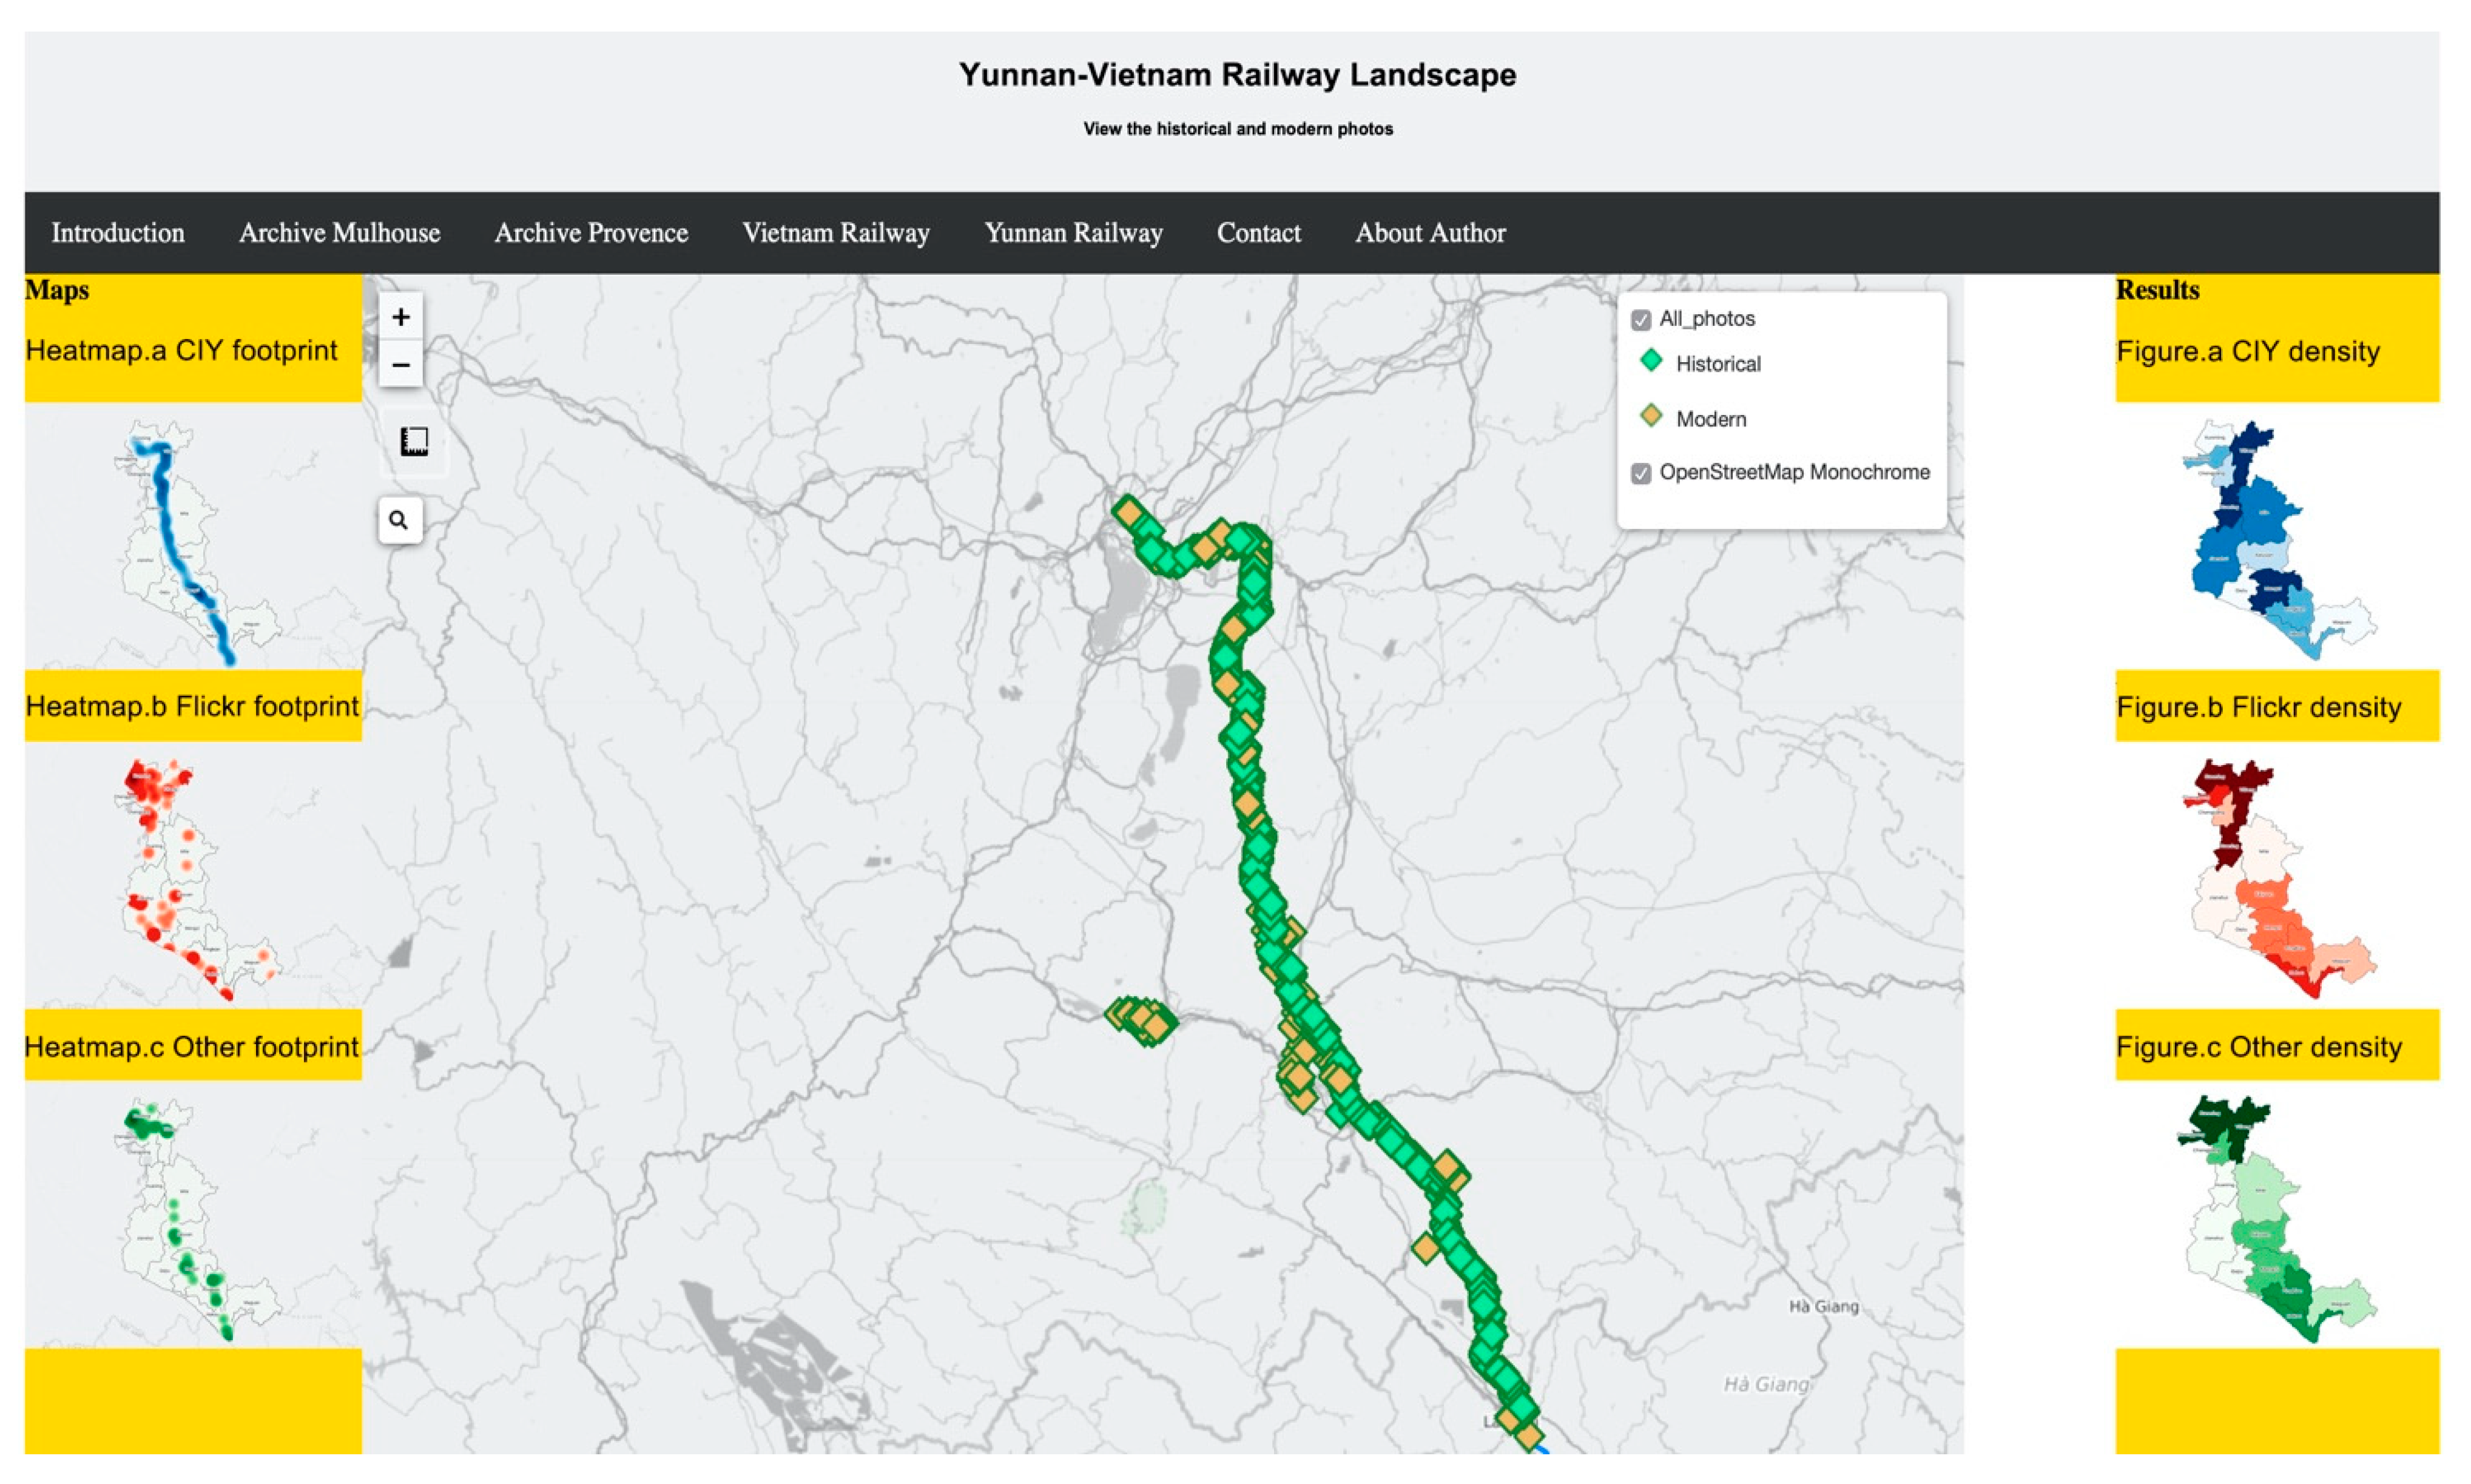
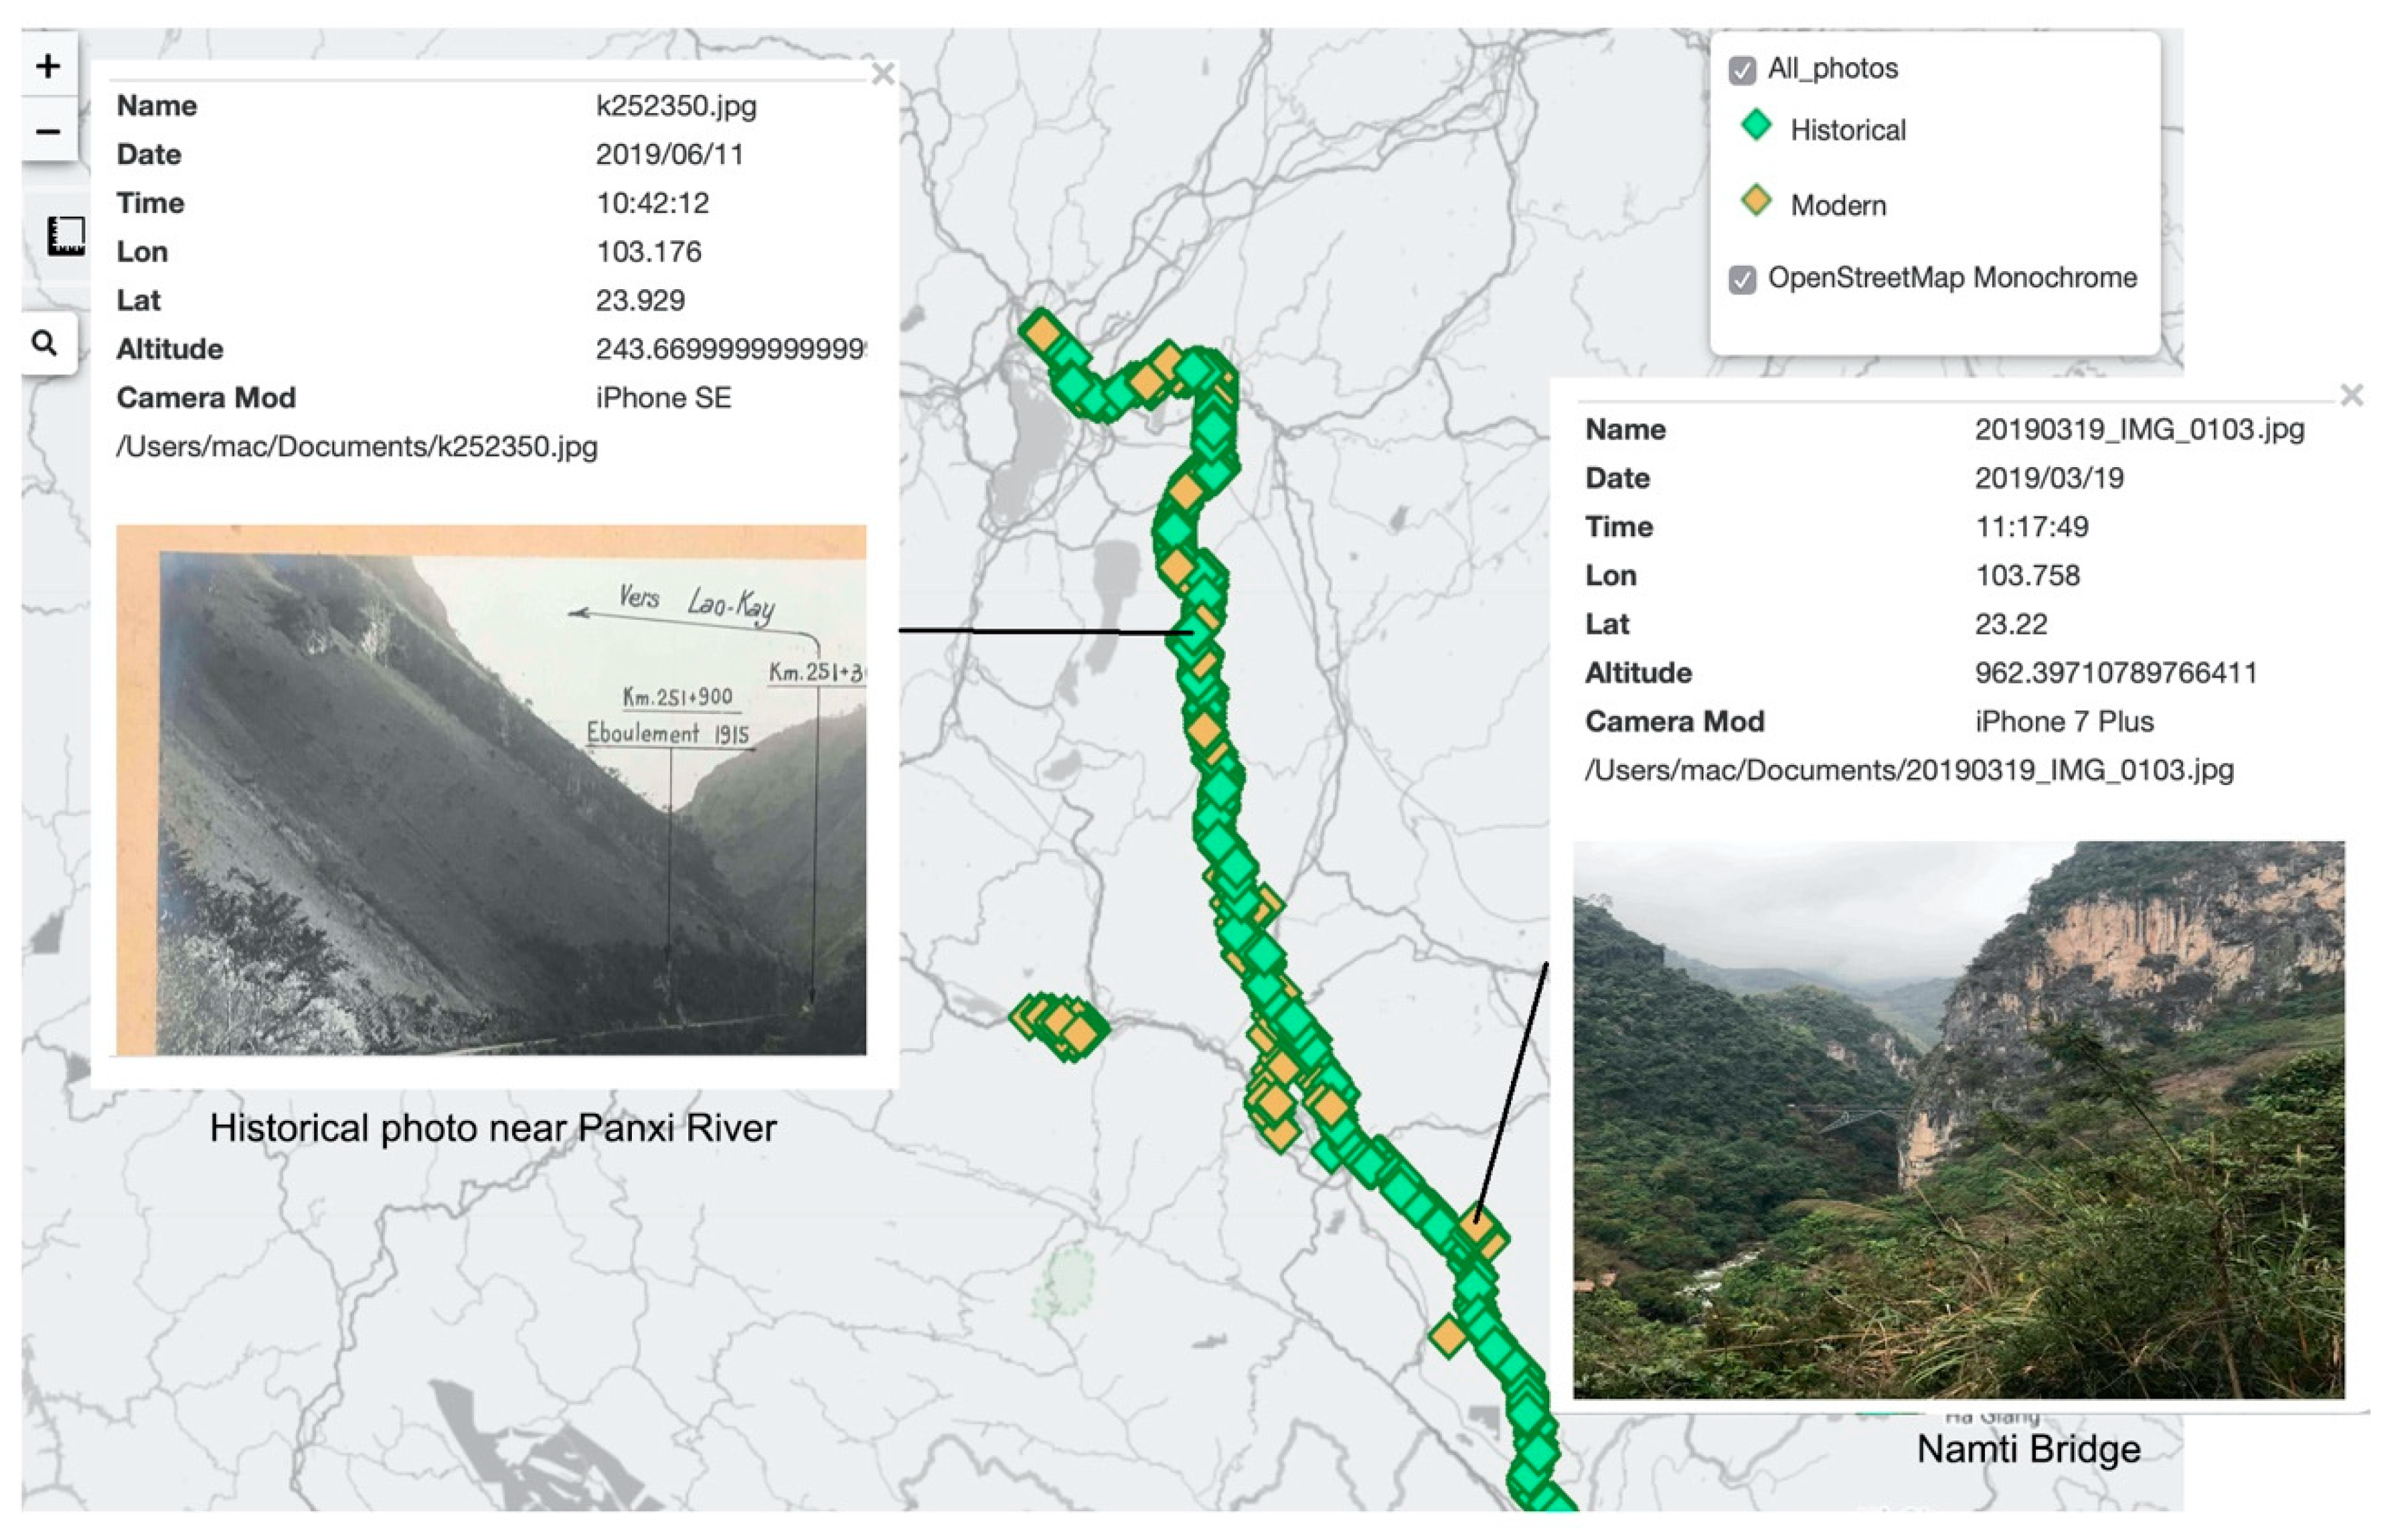
Then, the methodology of Open GIS is discussed, which can be fulfilled along with the PostgreSQL and PostGIS as geodatabase, QGIS as a toolset of spatial analysis, GeoServer as the map server, and Leaflet as the JavaScript base. Based upon all the collected historical photos by various historical photographers and fieldwork photos taken by the authors, the Web map of YVR is designed and divided into five sections: title of the web (Yunnan–Vietnam Railway Landscape), navigation with the related links (data source, a brief introduction and about the authors), figures for showing the heatmap results (right and left sections), the main content of the interactive map and the copyright (Figure 8). For every single point on the web map, a photo is attached through online geotagging tools (https://www.geoimgr.com). The geotagging of historical photos is based on their names, and the titles recorded; and the modern photos are taken with a smartphone equipped with GPS device. Thus, their geographic coordinates are automatically attached. Then, the webpage has the basic functions of zoom in/out, the details of the locations of photo sites, the useful tools for measuring the distance between two points, and the search engine to find a specific place on the map. For the detail of every photo, its metadata includes the title, date and time, longitude and latitude, altitude, camera mod, type of the photo (modern or historical), author’s name, and its copyright (Figure 9). All the data of the webpage was uploaded to the internet so that any user interested in the heritage and landscape of YVR can download it and implement the full functionality of this webpage. As a result, using this open WebGIS system, the user can easily view the data of YVR heritages, including the historical photos, modern photos, and the metadata of these photos; the visitors can preview the landscape of the railway heritage sites, while gaining knowledge by clicking these photos and browsing the information attached. The other scholars can make better use of these historical photos for further studies by downloading the metadata and output maps on the webpage.
Furthermore, the analyzed footprint of historical photographers is also uploaded into the webpage as the findings of this paper. The result shows that, for the “Other photos” (taken by three photographers), Kunming, Yiliang and Chenggong are with the highest activity density; for “Flickr photos” of modern tourism, Kunming, Yiliang, and Huaning show popularity in tourism; for “CIY photos” (taken by the railway company), Yiliang, Huaning, and Mengzi are emerged most frequently. According to the output maps, a clear difference in the mode of activities can be observed. The historical photographers’ footprints mainly concentrated in the northernmost and southernmost counties of Yunnan province, basically following the paths of modern tourism activities. However, the railway company’s activity was mainly focused on the central parts of the province, compared with the other photographic data. The reason for the difference between their activities still needs further studies and discussions.
4. Discussion
Exploring the multi-scale railway territories by relating the historical photos to the data of the present-day environment brings a more in-depth understanding of the heritage and tourism potential of the railway and the regeneration of historic landscape perception. YVR is a historical railway relating to a huge number of spatial data and non-spatial images. To show the current situation of railway sites and related landscape, the authors use photography equipped with GPS to record the fieldwork along the YVR, then attach and display them with the help of WebGIS. However, due to the limited accuracy of the GPS device and the difficulties in accessing all the sites of YVR, the railway heritage and landscape of YVR are partially recorded. Then, the historical photos from archives are also protected for their copyrights. The authors have received the authorization from the Archive of Mulhouse to use and publish them in this research. However, there are lots of historical photos without any records to identify, which increased the difficulty for the geotagging process. Some of the historical photos are geotagged according to the distance information, but other locations are just estimated in GIS with lower accuracy. The discussion of identification and localization of YVR historical photos can be another research project, and the interpretation of the historical photos also needs more helps from the local historians and other YVR experts.
Moreover, compared with the abundant historical records in Yunnan, historical data are lacking within the Vietnamese section of YVR. The reason why the railway company took only photos of the Yunnan section still needs to be discussed further. Because of the language problem, the authors have visited only a few museums in Vietnam. The touristic train in Vietnam only provides services during the night, which makes the data collection difficult in Vietnam. Future research needs more cooperation with local scholars to systemize the Vietnamese documents and make them available for more international scholars and studies. Fieldworks during the day is also necessary to survey and record the landscapes along the trip in Vietnam.
At the same time, old maps and remote sensing images are also important types of historical images, which are not included in this project. However, they contain more information on the land use and land cover changes, as well as the mapping techniques of our ancestors, such as old coordinate systems, the way of projection, and the map representations. A combination of historical photos with historical maps will facilitate a better understanding of historical landscape and activities. Thus, further fieldwork should also collect more types of historical images from complementing each other. Especially for YVR, there also remain many engineering manuscripts and drawings, which are important materials to learn the French railway techniques from the early 20th century [54].
Moreover, to stimulate the public participation in the landscape observation in YVR, the updating of data on the webpage is a significant issue related to the dynamic data accuracy and effectiveness for further research. Some observers or tourists have already visited the railway sites and uploaded their photographic works on social media. The footprints of their published works are collected and analyzed by the authors from Flicker to reflect the popularity of YVR sites among visitors. However, these photos cannot be imported into the database due to the copyright problem. How to import more site photos into the database to cover the whole study area for serving heritage tourism is a problem waiting for solutions. The volunteered geographic information (VGI) and georeferenced crowdsourcing are useful techniques to keep the data update timely and to connect with the public who are interested in this project. For example, the special design of a YVR mobile app will serve more users and tourists [55]. At the same time, they can voluntarily connect and update the database with their cellphones while visiting the related YVR sites. Moreover, the designed WebGIS page still needs evaluations of its usability from the visitors and users, which will help to improve the design and implementation of the WebGIS system.
Author Contributions
Conceptualization, K.S., G.L.F. and S.P.; methodology, K.S. and S.P.; validation, K.S. and S.P.; investigation, K.S.; resources, K.S.; data curation, K.S.; writing—original draft preparation, K.S.; writing—review and editing, S.P.; visualization, K.S.; supervision, G.L.F. All authors have read and agreed to the published version of the manuscript.
Funding
This research was funded by the China Scholarship Council (CSC).
Institutional Review Board Statement
The study did not require ethical approval.
Informed Consent Statement
Informed consent was obtained from all subjects involved in the study.
Conflicts of Interest
The authors declare no conflict of interest.
References
- Dahmus, J.B. Can efficiency improvements reduce resource consumption? A historical analysis of ten activities. J. Ind. Ecol. 2014, 18, 883–897. [Google Scholar] [CrossRef]
- Palang, H.; Spek, T.; Stenseke, M. Digging in the past: New conceptual models in landscape history and their relevance in peri-urban landscapes. Landsc. Urban Plan. 2011, 100, 344–346. [Google Scholar] [CrossRef]
- Abid, A. Memory of the World—Preserving Our Documentary Heritage. In Proceedings of the IATUL Conferences, Yorba Linda, CA, USA, 24–26 June 1996; Available online: https://core.ac.uk/download/pdf/10238289.pdf (accessed on 7 December 2020).
- Harper, D. Visual sociology: Expanding sociological vision. Am. Sociol. 1988, 19, 54–70. [Google Scholar] [CrossRef]
- Karin, B. Photography as a Medium. Int. Encycl. Soc. Behav. Sci. 2015, 17, 11395–11402. [Google Scholar]
- Steen-Jacobsen, J.K. Use of landscape perception methods in tourism studies: A review of photo-based research approaches. Tour. Geogr. 2007, 9, 234–253. [Google Scholar] [CrossRef]
- Lou, G. Picturing the Chinese, Early Western Photographs and Postcards of China; Joint Publishing: Hong Kong, China, 2008. [Google Scholar]
- Wang, Z. Study of Historiography. Ph.D. Thesis, Shandong University, Jinan, China, 2011. [Google Scholar]
- Giblett, R.; Tolonen, J. Photography and Landscape: Photography and Landscape; Intellect Books: Bristol, UK, 2013. [Google Scholar]
- Arreola, D.; Burkhart, N. Photographic Postcards, and Visual Urban Landscape. Urban Geogr. 2010, 31, 885–904. [Google Scholar] [CrossRef]
- Klett, M.; Wolfe, B. Reconstructing the View: The Grand Canyon Photographs of Mark Klett and Byron Wolfe; University of California Press: Berkeley, CA, USA, 2012. [Google Scholar]
- Venter, O.; Sanderson, E.W.; Magrach, A.; Allan, J.R.; Beher, J.; Jones, K.R.; Levy, M.A. Global terrestrial Human Footprint maps for 1993 and 2009. Sci. Data 2016, 3, 1–10. [Google Scholar] [CrossRef] [Green Version]
- Sinn, D. Impact of digital archival collections on historical research. J. Am. Soc. Inf. Sci. Technol. 2012, 63, 1521–1537. [Google Scholar] [CrossRef]
- Wang, N.; Qin, K.; Luo, J.; Chen, K.; Hu, S. Spatial visualization and analysis of trajectories of historical celebrities. J. Geo Inf. Sci. 2020, 22, 978–988. [Google Scholar]
- Dewitz, L.; Kröber, C.; Messemer, H.; Maiwald, F.; Münster, S.; Bruschke, J.; Niebling, F. Historical photos and visualizations: Potential for research. Int. Arch. Photogramm. Remote Sens. Spat. Inf. Sci. 2019, 42, 405–412. [Google Scholar] [CrossRef] [Green Version]
- Kull, C.A. Historical landscape repeat photography as a tool for land-use change research. Norsk Geogr. Tidsskrift Nor. J. Geogr. 2005, 59, 253–268. [Google Scholar] [CrossRef]
- Algeo, K.; Epperson, A.; Brunt, M. Historical GIS as a platform for public memory at Mammoth Cave national park. In Geographic Information Systems: Concepts, Methodologies, Tools, and Applications; IGI Global: Hershey, PA, USA, 2013; pp. 1309–1327. [Google Scholar]
- Hanson, W.S.; Oltean, I.A. Archaeology from Historical Aerial and Satellite Archives; Springer Science & Business Media: New York, NY, USA, 2012. [Google Scholar]
- Ardizzone, E.; De Polo, A.; Dindo, H.; Mazzola, G.; Nanni, C. A dual taxonomy for defects in digitized historical photos. In Proceedings of the 10th International Conference on Document Analysis and Recognition, Barcelona, Spain, 26 July 2009; pp. 1166–1170. [Google Scholar]
- Kustanowitz, J.; Shneiderman, B. Motivating annotation for personal digital photo libraries: Lowering barriers while raising incentives. In University of Maryland Technical Report HCIL-2004; University of Maryland: College Park, MD, USA, 2005; p. 18. [Google Scholar]
- Lim, S.; Liew, C.L. GLAM metadata interoperability. In The International Conference on Asian Digital Libraries; Springer: Berlin/Heidelberg, Germany, 2010; pp. 140–143. [Google Scholar]
- Mulet Gutiérrez, M.J.; Oliver Torelló, J.C.; Sebastián Sebastián, M. Photographic dissemination of historic landscape as a tool for citizenship. Landsc. Res. 2020, 1–16. [Google Scholar] [CrossRef]
- Gregory, I.N.; Kemp, K.; Mostern, R. Geographical Information and historical research: Current progress and future directions. Hist. Comput. 2001, 13, 7–21. [Google Scholar] [CrossRef] [Green Version]
- Hu, B. Application of geographic information systems (GIS) in the history of cartography. World Acad. Sci. Eng. Technol. 2010, 42, 185–189. [Google Scholar]
- Knowles, A.K. Emerging trends in historical GIS. Hist. Geogr. 2005, 33, 7–13. [Google Scholar]
- Sui, D. Opportunities and impediments for open GIS. Trans. GIS 2014, 18, 1–24. [Google Scholar] [CrossRef]
- Li, Y.; Li, H.; Zhao, J. Application of Open-Source GIS to WebGIS. Geospat. Inf. 2010, 2, 100–102. [Google Scholar]
- Singh, P.S.; Chutia, D.; Sudhakar, S. Development of a web based GIS application for spatial natural resources information system using effective open source software and standards. J. Geogr. Inf. Syst. 2012, 4. [Google Scholar] [CrossRef] [Green Version]
- Brovelli, M.A.; Magni, D. An archaeological web GIS application based on Mapserver and PostGIS. Int. Arch. Photogramm. Remote Sens. Spat. Inf. Sci. 2003, 34, 89–94. [Google Scholar]
- Serafinelli, E. Analysis of photo sharing and visual social relationships: Instagram as a case study. Photographies 2017, 10, 91–111. [Google Scholar] [CrossRef] [Green Version]
- Tieskens, K.F.; Van Zanten, B.T.; Schulp, C.J.E.; Verburg, P.H. Aesthetic appreciation of the cultural landscape through social media: Ananalysis of revealed preference in the Dutch river landscape. Landsc. Urban Plan. 2018, 177, 128–137. [Google Scholar] [CrossRef]
- Nivala, A.M. Usability Perspectives for the Design of Interactive Maps; Helsinki University of Technology: Helsinki, Finland, 2007. [Google Scholar]
- Clough, P.; Read, S. Key Design Issues with Visualising Images using Google Earth. In European Conference on Information Retrieval; Springer: Berlin/Heidelberg, Germany, 2008; pp. 570–574. [Google Scholar]
- Chen, W.; Nottveit, T. Digital map application for historical photos. In The International Conference on Asian Digital Libraries; Springer: Berlin/Heidelberg, Germany, 2010; pp. 158–167. [Google Scholar]
- Che, L. Yunnan—Vietnam Railway and the input of modern science and technology to Yunnan. J. Kunming Uni. Sci. Technol. 2006, 6, 25–28. [Google Scholar]
- Fan, Y. An introduction of the development of tourism resources of the Yunnan-Vietnam Railway. Hum. Inhab. 2011, 5, 64–65. [Google Scholar]
- Bordes, J. Le chemin de fer du Yunnan et les Centraliens—1902–1910. Hist. Cent. 2009, 592, 58–61. [Google Scholar]
- Bernaed, O.; Locard, E. Le chemin de fer du Yunnan: Un jeune ingénieur français en route de Saigon à Yleang. Images Mem. 2013, 37, 19–26. [Google Scholar]
- Haskell, F. History and its Images: Art and the Interpretation of the Past; Yale University Press: London, UK, 1993. [Google Scholar]
- Srarostina, N. Engineering the Empire of Images: Constructing Railways in Asia before the Great War. Southeast Rev. Asian Stud. 2009, 31, 181–206. [Google Scholar]
- Srarostina, N. Ambiguous Modernity: Representations of French Colonial Railways in the Third Republic. Proc. West. Soc. Fr. Hist. 2010, 38, 179–199. [Google Scholar]
- UNESCO. Recommendation on the Historic Urban Landscape. 2011. Available online: http://portal.unesco.org/es/ev.php-URL_ID=48857&URL_DO=DO_TOPIC&URL_SECTION=201.html (accessed on 7 December 2020).
- Condorelli, F.; Rinaudo, F. Cultural heritage reconstruction from historical photographs and videos. International Archives of the Photogrammetry. Remote Sens. Spat. Inf. Sci. 2018, 42, 259–264. [Google Scholar]
- Wiedemann, A.; Hemmleb, M.; Albertz, J. Reconstruction of historical buildings based on images from the Meydenbauer archives. Int. Arch. Photogramm. Remote Sens. 2000, 33, 887–893. [Google Scholar]
- Bowser, R.; Croxall, B. Annihilated Time, Smooth Surfaces, and Rough Edges in Steampunk and Schivelbusch’s The Railway Journey: A Departure Point. In Proceedings of the Interdisciplinary Nineteenth-Century Studies Conference, Atlanta, GA, USA, 16–19 April 2015; pp. 1–8. [Google Scholar]
- Purcar, C. Photography, Railways and Landscape in Transylvania, Romania: Case Studies in Digital Humanities. In Mapping Landscapes in Transformation; Leuven University Press: Leuven, Belgium, 2019; pp. 149–174. [Google Scholar]
- Goodchild, M.F. GIS and Modeling Overview. GIS, Spatial Analysis, and Modeling; ESRI Press: Redlands, CA, USA, 2005; pp. 1–18. [Google Scholar]
- Gregory, I.N.; Ell, P.S. Historical GIS: Technologies, Methodologies, and Scholarship; Cambridge University Press: Cambridge, UK, 2007; Volume 39. [Google Scholar]
- Agrawal, S.; Gupta, R.D. Web GIS and its architecture: A review. Arab. J. Geosci. 2017, 10, 518. [Google Scholar] [CrossRef]
- Yin, F.; Feng, M. A WebGIS framework for vector geospatial data sharing based on open source projects. In The 2009 International Symposium on Web Information Systems and Applications; Academy Publisher: Winterbourne, UK, 2009; p. 124. [Google Scholar]
- Hwang, J.; Lay, S.; Lippman, A. Nonparametric multivariate density estimation: A comparative study. IEEE Trans. Signal Process. 1994, 42, 2795–2810. [Google Scholar] [CrossRef] [Green Version]
- Huang, Z.; Xu, Z. A method of using geoserver to publish economy geographical information. In Proceedings of the International Conference on Control, Automation and Systems Engineering, Singapore, 30 July 2011; pp. 1–4. [Google Scholar]
- Donohue, R.G.; Sack, C.M.; Roth, R.E. Time series proportional symbol map with leafet and jquery. Cartogr. Perspect. 2013, 76, 43–66. [Google Scholar]
- Knowles, A.K. Past Time, Past Place: GIS for History, 1st ed.; Esri Press: Redlands, CA, USA, 2002. [Google Scholar]
- Niu, Q.; Dong, Z. Public Participation in Urban Planning Based on New Mobile Social Platform. Management 2017, 9, 46–51. [Google Scholar]
Figure 1.
Yunnan-Vietnam Railway. The whole line is indicated on the map with its terminals (Kunming, Laocai, and Haiphong) and other important railway stations. However, due to the lack of photos in the Vietnamese section, this paper focuses only on the Chinese section, namely from Kunming to Laocai, a length of 469 km, which accounts for 54.8% of the whole line. Furthermore, its global location is also shown on the map, in the Southwest of China and North of Vietnam.

Figure 2.
Yunnan-Vietnam Railway in China and the study area. It contains 13 counties in the Yunnan province. From south to north, they are Hekou, Maguan, Pingbian, Mengzi, Gejiu, Jainshui, Kaiyuan, Mile, Huaning, Chengjiang, Yiliang, Chenggong, and Kunming (not the whole Kunming city but only one district in Kunming.

Figure 3.
Workflow of this paper. It includes mainly three steps: creating the database with the help of PostgreSQL; analyze the data in the database and then upload the results into the GeoServer; design the web of the platform with Leaflet and publish it online, make it open for GIS applications and different browsers available for both normal users and academic uses.

Figure 4.
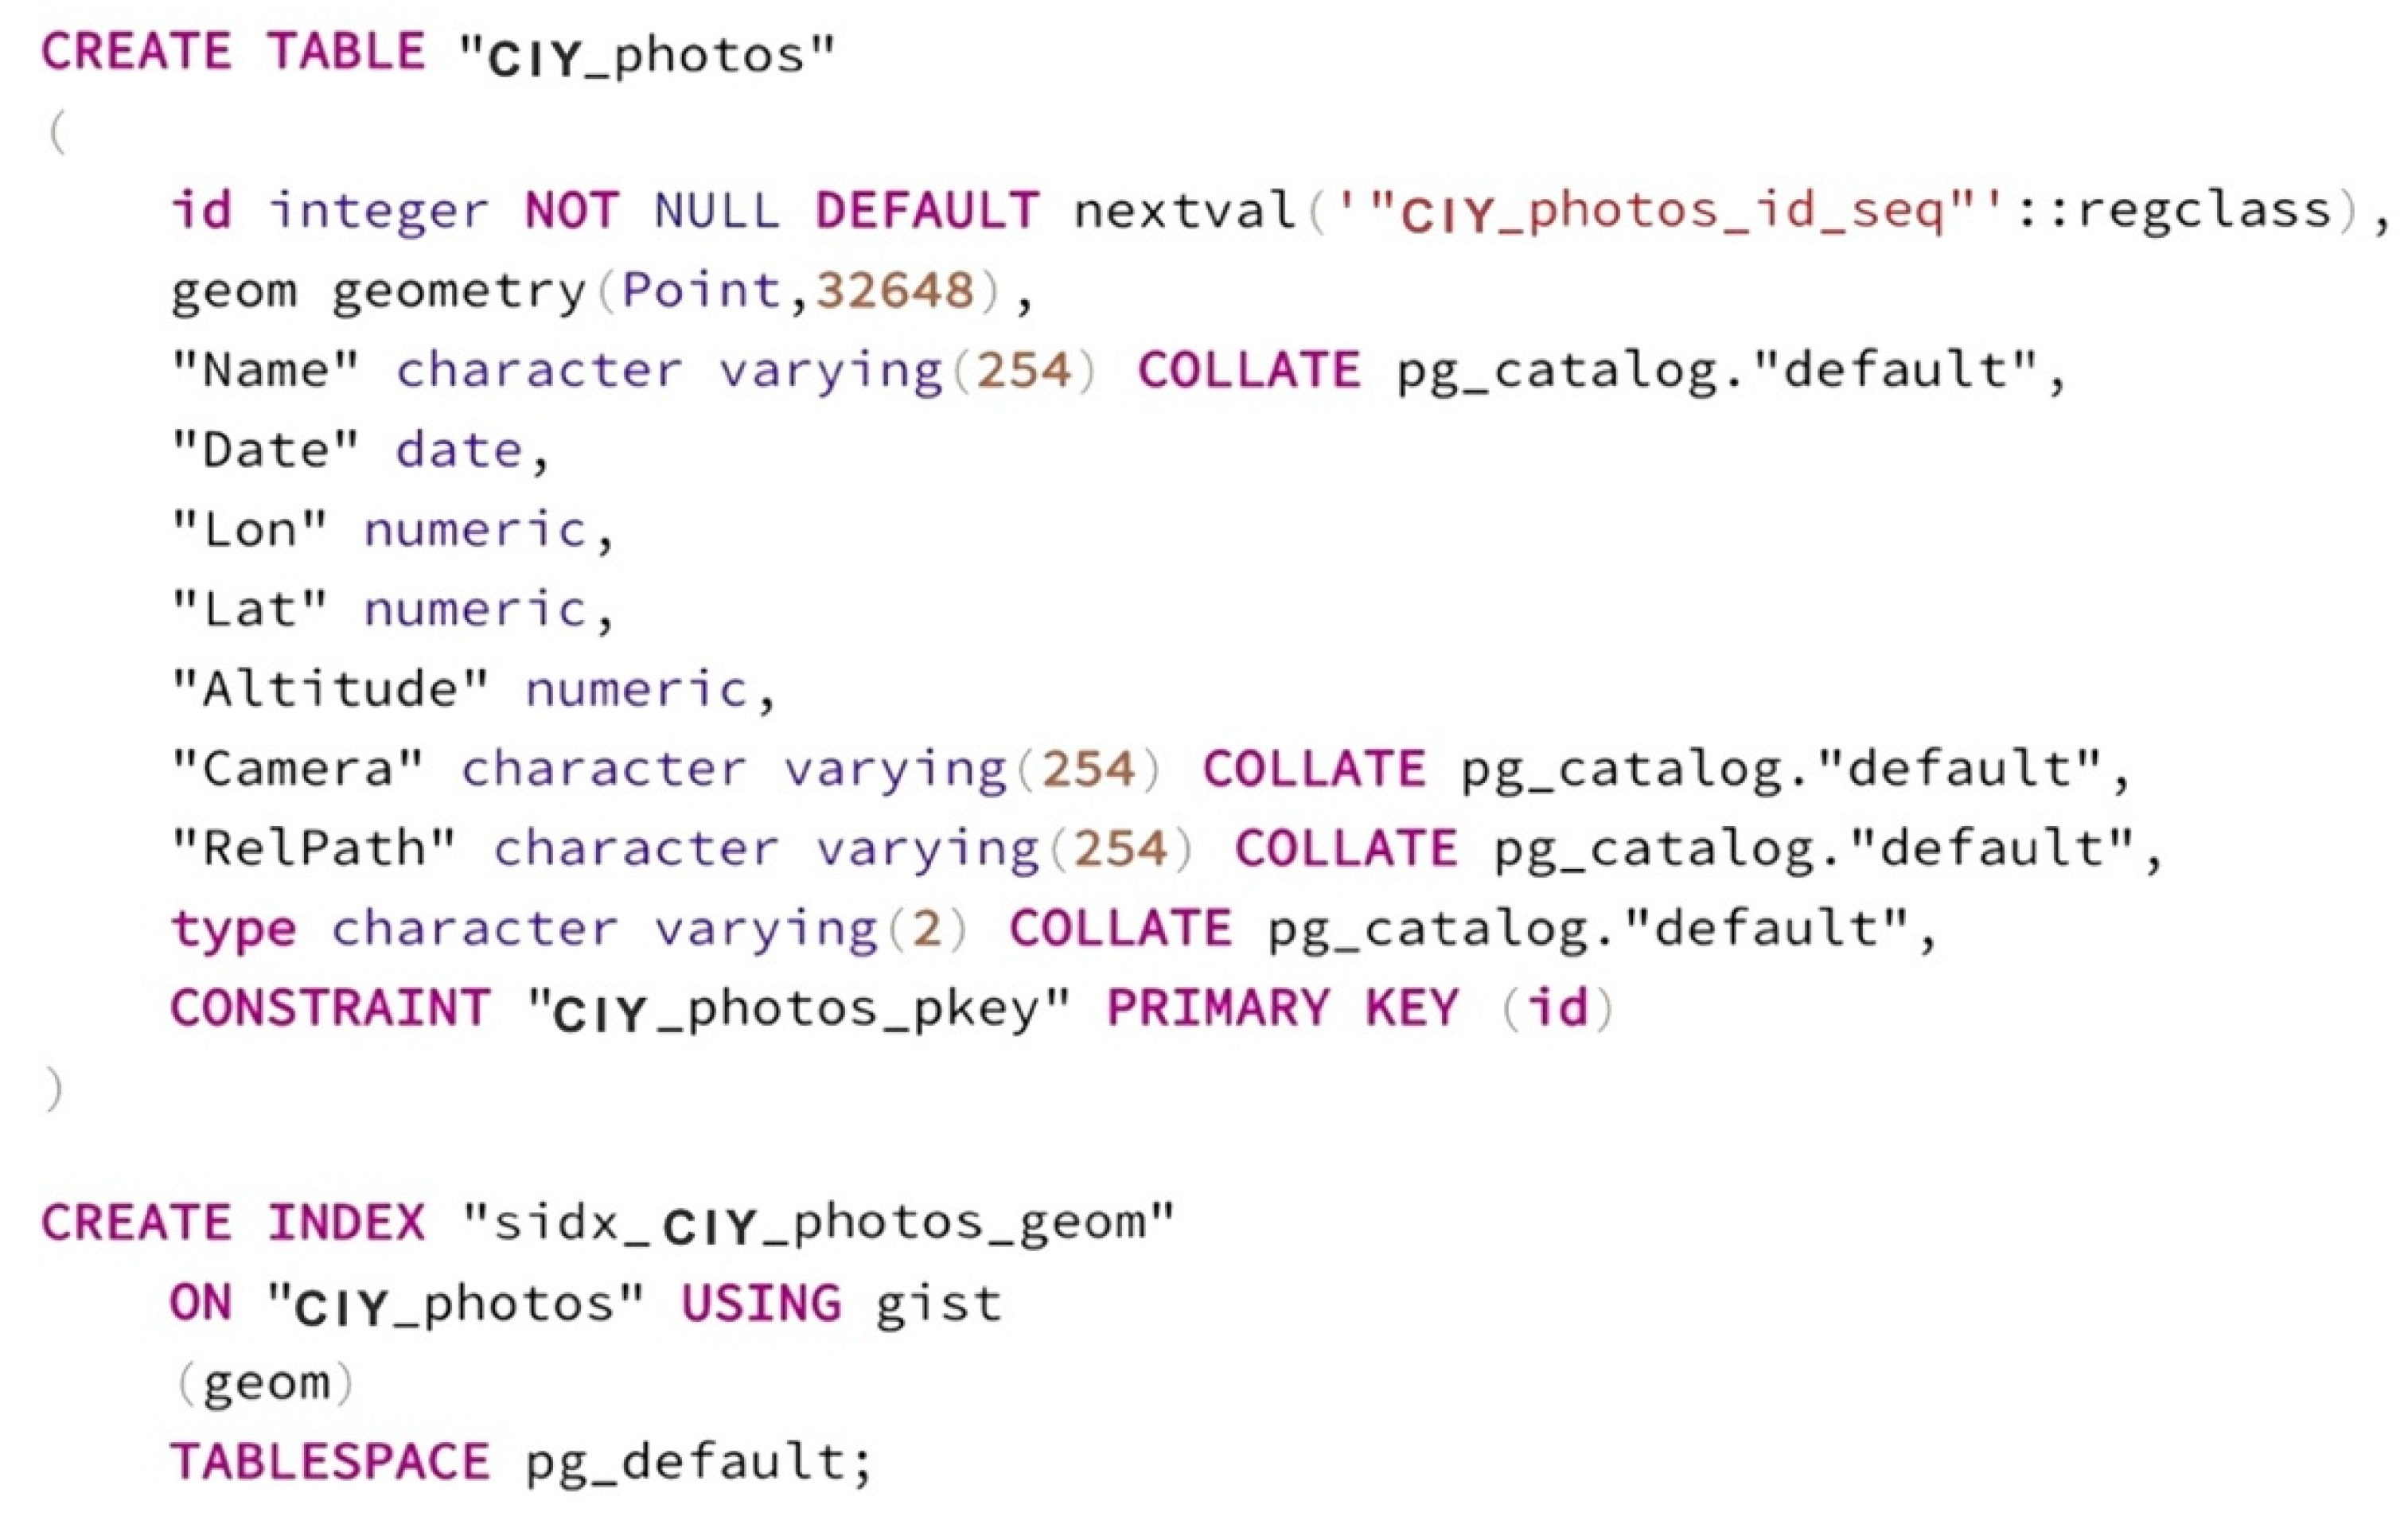
An example of creating tables in PostgreSQL. In QGIS, when importing data into geometry, the SQL operations are generated at the same time. This figure shows an example of the SQL language of creating the table of “CIY_photos” (historical photos taken by the CIY company). The attributes in the table are defined with their names and data type and a spatial index is also attached. Then, the ID of photos is used as the primary key of the table.
Figure 4.
An example of creating tables in PostgreSQL. In QGIS, when importing data into geometry, the SQL operations are generated at the same time. This figure shows an example of the SQL language of creating the table of “CIY_photos” (historical photos taken by the CIY company). The attributes in the table are defined with their names and data type and a spatial index is also attached. Then, the ID of photos is used as the primary key of the table.

Figure 5.
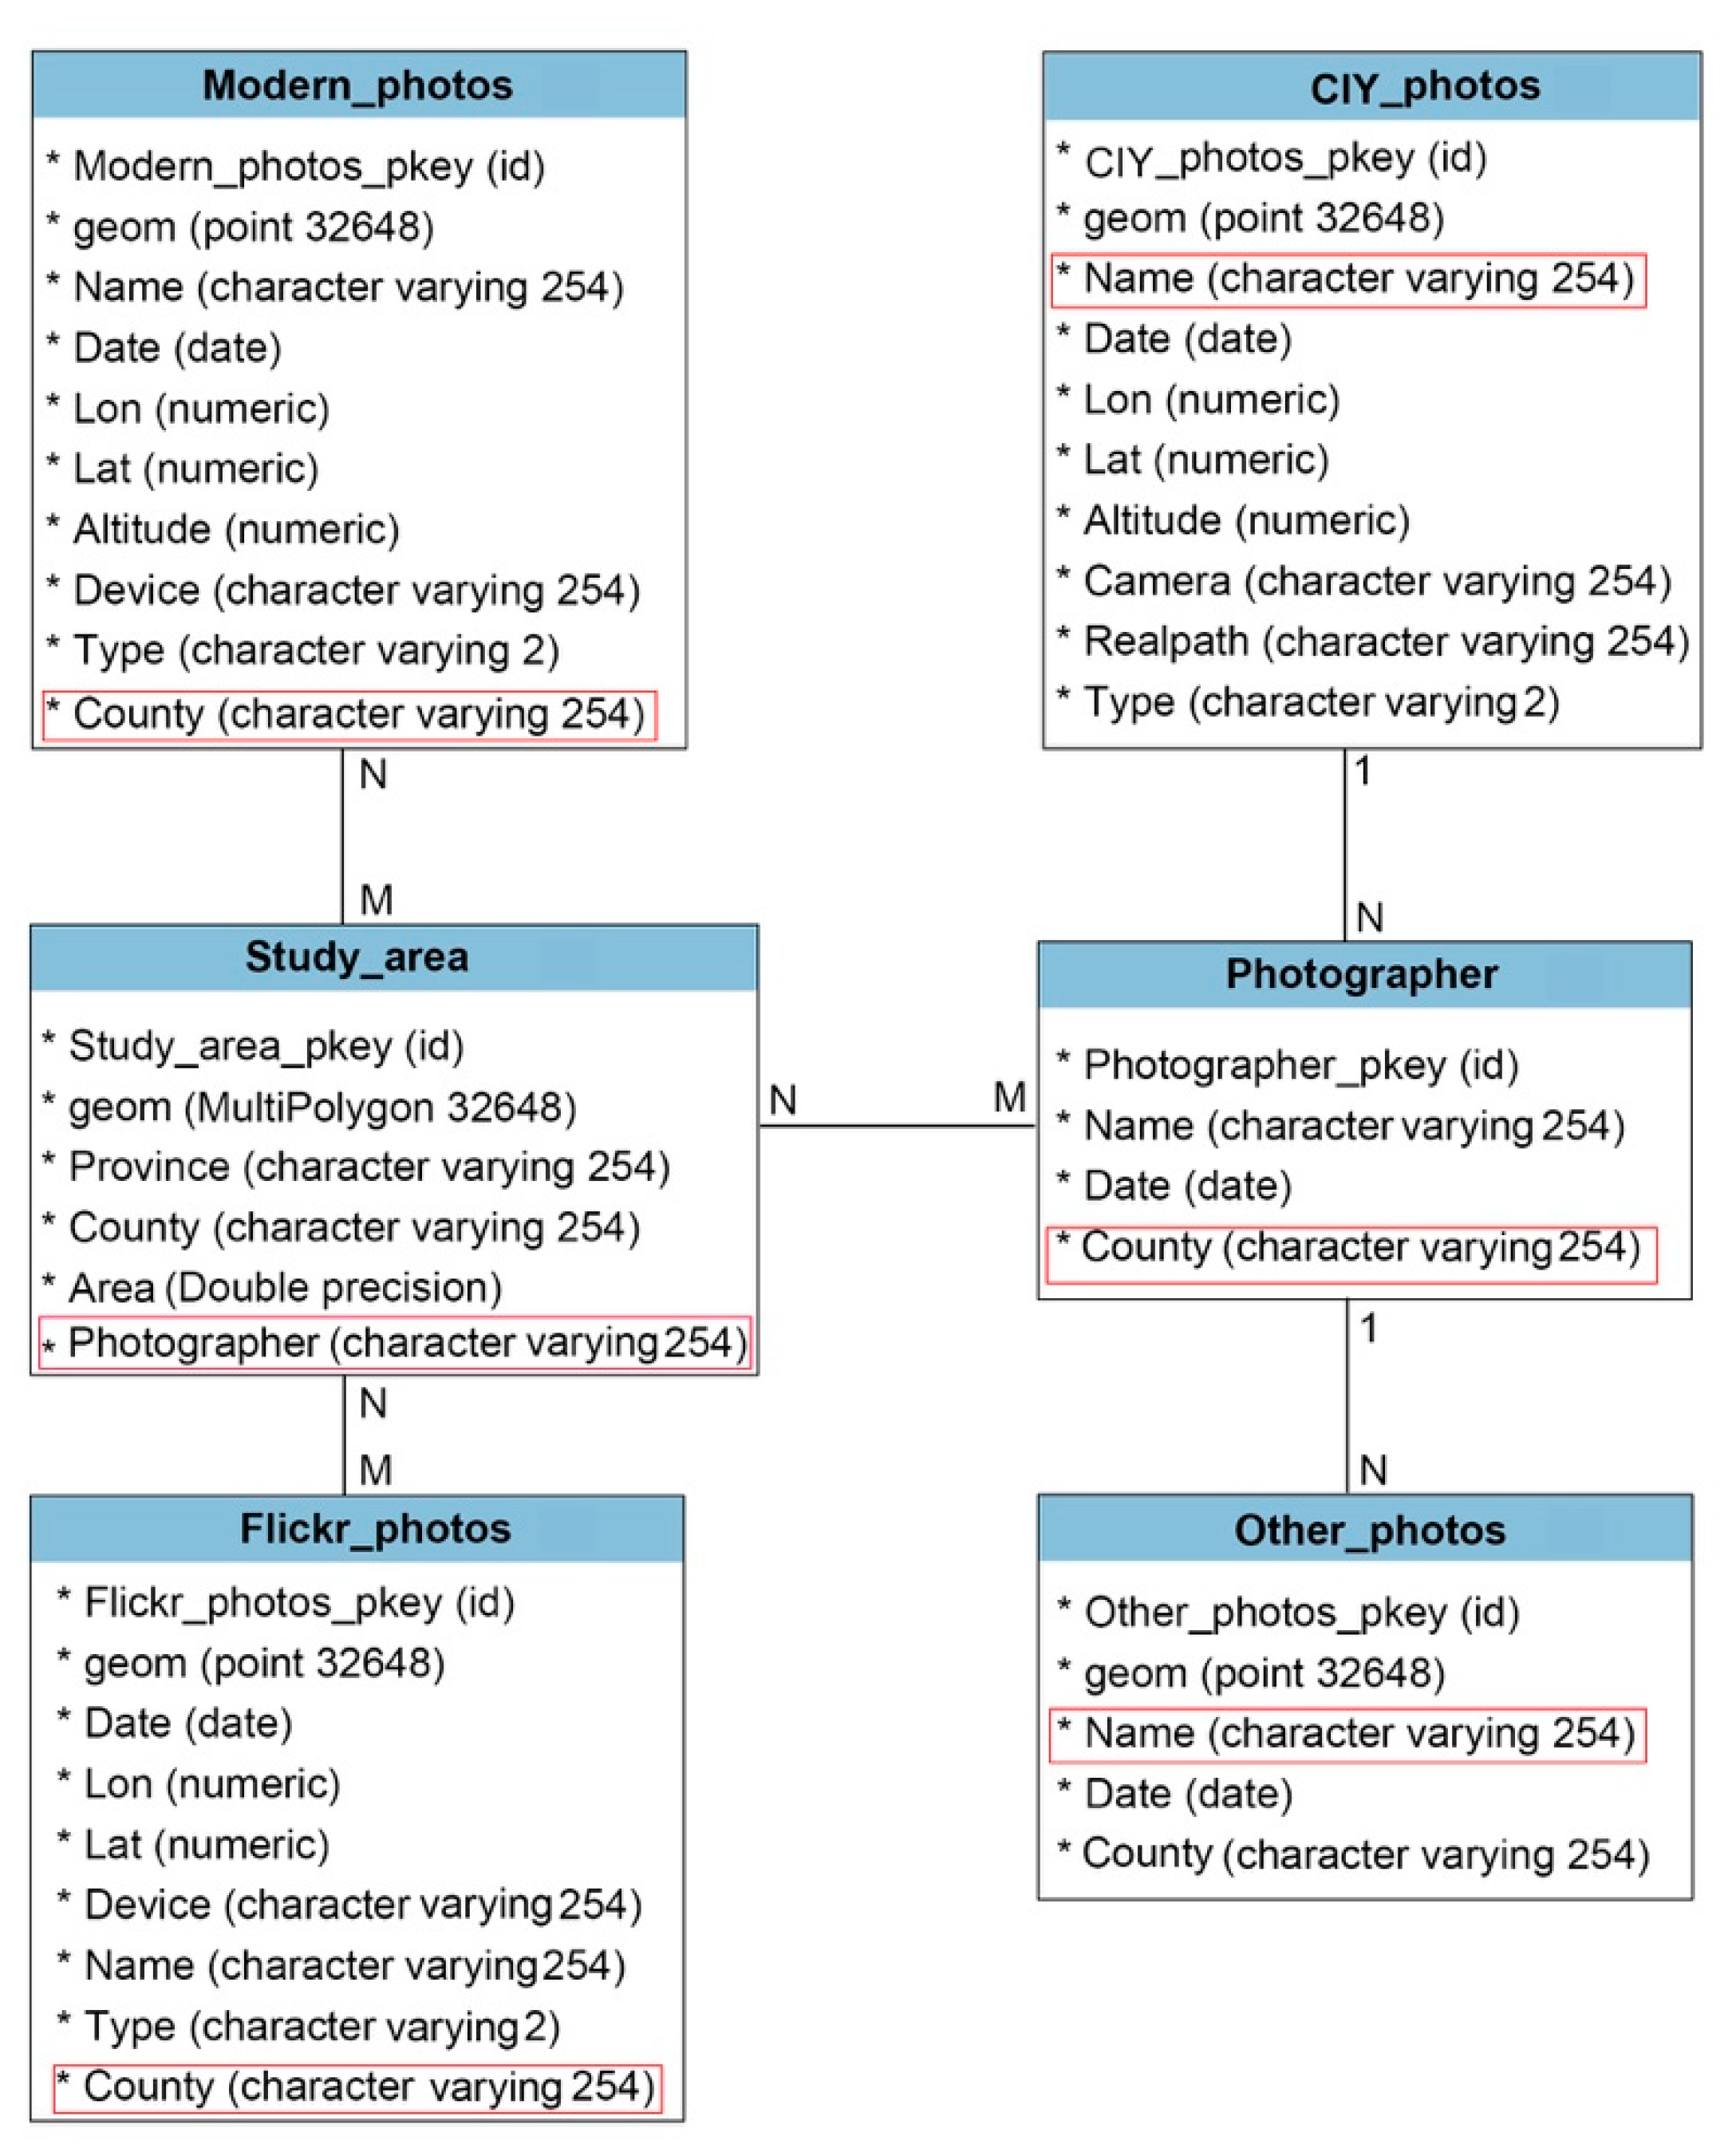
Physical model of the SQL database. The table “Flickr_photos” and “Modern_photos” are connected with the “Study_area” by their location in every county with a type of “N: M” relation. Then, the “CIY_photos” and “Other photos (the photos byA. Marbotte, A. Marie, A. François, Têtard René, and Busy Léon)” are related to the table of “Photographer” by name with the “1: N” relation. The foreign key in each table is remarked in red frames.
Figure 5.
Physical model of the SQL database. The table “Flickr_photos” and “Modern_photos” are connected with the “Study_area” by their location in every county with a type of “N: M” relation. Then, the “CIY_photos” and “Other photos (the photos byA. Marbotte, A. Marie, A. François, Têtard René, and Busy Léon)” are related to the table of “Photographer” by name with the “1: N” relation. The foreign key in each table is remarked in red frames.

Figure 6.
Heatmap of the historical photos. The upper maps show the kernel density values of “Other photos”, “Flickr photos” and “CIY photos”. Then, the lower maps show the mean kernel value in each county, which means a comparison of the distribution of photos in the study area. Classified by the mood of Equal Count (Quantile), the counties are divided into five classes. For the “Other photos”, Kunming, Yiliang, and Chenggong are with the highest kernel value; for “Flickr photos”, Kunming, Yiliang and Huaning show the popularity of touristic activities; for “CIY photos”, Yiliang, Huaning, and Mengzi emerged most frequently.

Figure 7.
Connect the PostGIS database to GeoServer. In the figure, the name of the PostGIS database, its host, port, and schema are indicated. As a result, all the historical photo layers are connected to the server. Besides, the other raster data of the analyzed heatmap are also uploaded.
Figure 7.
Connect the PostGIS database to GeoServer. In the figure, the name of the PostGIS database, its host, port, and schema are indicated. As a result, all the historical photo layers are connected to the server. Besides, the other raster data of the analyzed heatmap are also uploaded.

Figure 8.
Overview of the WebGIS project. The central panel shows the location of the photos, including the historical photos of CIY and the modern photos taken by authors during 2018–2019. Other historical photos are not involved in the WebGIS because of the copyright problem. The analyzed results are also linked to the web. The right part is with the density value calculation (CIY, Flickr, and other photos). The left section indicates the kernel heatmap corresponded to the three layers.

Figure 9.
Example of the details of the photos. Two photos are shown on the map attached with the vector points with their attribute information. The left photo is the historical photo of the Panxi River and the right photo is the current photo taken by authors, showing a famous engineering project—Namti Bridge in Pingbian county in Yunnan.


Table 1.
Information of photographers of YVR. It illustrates the position, year of working of Auguste Marbotte, Albert Marie, Têtard René, Busy Léon, and Auguste François, as well as the quantity and source of their photographic works. Among these, there is no further information and records on Têtard René and Busy Léon online. Thus, they are usually not considered as the major photographers of YVR. The data of the Flickr photos came from the “Beijing City Lab (https://www.beijingcitylab.com)” collected from the website: http://webscope.sandbox.yahoo.com/catalog.php?datatype=i&did=67. The copyright of historical photos belongs to these archives mentioned, and the copyright of the 540 modern landscape photos belongs to the author (Kun Sang). For the WebGIS system, only the CIY photos are attached online. Other photos are also regarded as the materials for analyzing the historical activities.
| Photographer | Year of Activities | Source |
|---|---|---|
| A. Marbotte | 1903–1908 | Musée Guimet, France |
| A. Marie | 1904–1906 | Institute of Southeast Asian Studies, Singapore |
| A. François | 1899–1904 | Musée Guimet, France |
| Têtard René; Busy Léon | 1919–1926 | Archives Nationales d′Orere-mer, France |
| CIY | 1903–1906 | Archive of Mulhouse, France |
| Tourists | 2003–2014 | Flickr |
| Authors | 2018–2019 | fieldwork |
Publisher’s Note: MDPI stays neutral with regard to jurisdictional claims in published maps and institutional affiliations. |
© 2021 by the authors. Licensee MDPI, Basel, Switzerland. This article is an open access article distributed under the terms and conditions of the Creative Commons Attribution (CC BY) license (http://creativecommons.org/licenses/by/4.0/).
Share and Cite
MDPI and ACS Style
Sang, K.; Piovan, S.; Fontana, G.L. A WebGIS for Visualizing Historical Activities Based on Photos: The Project of Yunnan–Vietnam Railway Web Map. Sustainability 2021, 13, 419. https://0-doi-org.brum.beds.ac.uk/10.3390/su13010419
AMA Style
Sang K, Piovan S, Fontana GL. A WebGIS for Visualizing Historical Activities Based on Photos: The Project of Yunnan–Vietnam Railway Web Map. Sustainability. 2021; 13(1):419. https://0-doi-org.brum.beds.ac.uk/10.3390/su13010419
Chicago/Turabian StyleSang, Kun, Silvia Piovan, and Giovanni Luigi Fontana. 2021. "A WebGIS for Visualizing Historical Activities Based on Photos: The Project of Yunnan–Vietnam Railway Web Map" Sustainability 13, no. 1: 419. https://0-doi-org.brum.beds.ac.uk/10.3390/su13010419
Note that from the first issue of 2016, this journal uses article numbers instead of page numbers. See further details here.