Permeability and Strength of Pervious Concrete According to Aggregate Size and Blocking Material


1
Civil Engineering Department, University of Transport and Communications, Ho Chi Minh 700000, Vietnam
2
School of Architecture, Korea National University of Transportation, Chungju 27389, Korea
*
Author to whom correspondence should be addressed.
Sustainability 2021, 13(1), 426; https://0-doi-org.brum.beds.ac.uk/10.3390/su13010426
Submission received: 30 November 2020
/
Revised: 21 December 2020
/
Accepted: 30 December 2020
/
Published: 5 January 2021
(This article belongs to the Special Issue Sustainable Pavement Engineering and Road Materials)
Abstract
:The purpose of this study is to identify the differences in porosity and permeability coefficients when the mixing ratio of aggregates is different and to present the mixing ratio satisfying the strength requirement of compressive specified in a specification of Korea. Three mix ratios were suggested by considering various aggregate sizes and three cylinders were made for each ratio. The porosities of those cylinders were evaluated through the compression and water permeability test, measuring the weight of specimens in underwater and analysis of the pictured Computed Tomography (CT) image. Experiments have shown that it is best to mix 50% for 5–10 mm aggregates, 45% for 2–5 mm aggregates, and 5% for sand in terms of strength and permeability. In addition, as the proportion of fine aggregates increased, the porosity and permeability decreased. Moreover, the effectiveness of maintenance method was also examined in this study.
1. Introduction
Recently, the area of buildings and roads has increased due to the rapid industrial development, which has reduced the permeable area of surface runoff during heavy rains. As a result, the flow of rainwater that has evaporated or flowed into the groundwater in the past has now changed to flow into the stream through the drainage system or accumulated on the surface of the road. Therefore, the flooding damage of cities is increasing, the groundwater level is lowered due to the decrease of the surface penetration of rainwater, and the environmental problems such as heat island phenomenon in urban areas are generated. As such, the amount of damage caused by heavy rains in the last five years (2013–2017) in Korea has been about 439 billion won ($0.37 billion), which is 52% of the total damage of 8,486 billion won ($7.07 billion) in five years related to the disaster [1]. One of the solutions to this problem is to increase the permeable pavement area of urban ground and restore the reduced drainage performance.
Pervious concrete, known as no-fines concrete or permeable concrete, is an environmentally friendly paving material, which has been well recognized as one of the key elements of low-impact sustainable development [2]. In general, it consists of cement, water, uniform/single-sized coarse aggregate, and little or no fine aggregate, resulting in a large, open pore structure. As a result, pervious concrete shows better permeability than conventional impermeable pavements due to the porosity between aggregates [3]. Generally, the permeability of pervious concrete is due to its macropore structure. However, as the use of pavement concrete becomes longer, the pores of pervious concrete are easily clogged by various small particles [4,5,6,7]. The permeability of pervious concrete helps to reduce heat island phenomena, traffic noise, and provides better condition for recharging the underground water source. In addition, it has the advantage of ensuring the driver’s safety by preventing water splash and reducing/eliminating the water film phenomenon on driving surfaces [8]. However, when the sediments, such as leaves, soil, and dust, penetrate the pores, it can be easily noticed that the pores may be blocked and the water permeability decreases. Therefore, continuous or regular maintenance of the pervious concrete is necessary to maintain the permeability performance [9,10].
One of the methods to solve the pore blockage in pervious concrete is the optimum design using the appropriate size aggregate [11,12,13]. Accumulation of the fine particles in the pores of the pervious pavement causes blockages and deposits, which are mainly related to the size of the clogging particles [4,10,11,14]. Although a series of studies [4,7,14,15] on the particle size have been conducted, there is little literature associated with the combined influence of particle size and pore size on clogging because it is difficult to accurately measure the pore size of pervious concrete. In order to solve this problem, recently, research has been conducted to determine the pore blockage of pervious concrete using the CT scanning method [16,17,18,19].
The purpose of this study is to compare and analyze the differences between porosity and permeability coefficient by varying the aggregate mixing ratio of pervious concrete, and to present a mixing ratio that meets the criterion of compressive strength and secures permeability as well. Moreover, in order to investigate the effect of blocking materials to the permeability, experiments on the maintenance of pervious concrete and recovery of permeation performance are carried out by conducting experiments on the pore blocking phenomenon. In addition, pores were identified using the CT scanning method and compared with experimental results.
2. Experiment
2.1. Mixture of Test Specimen
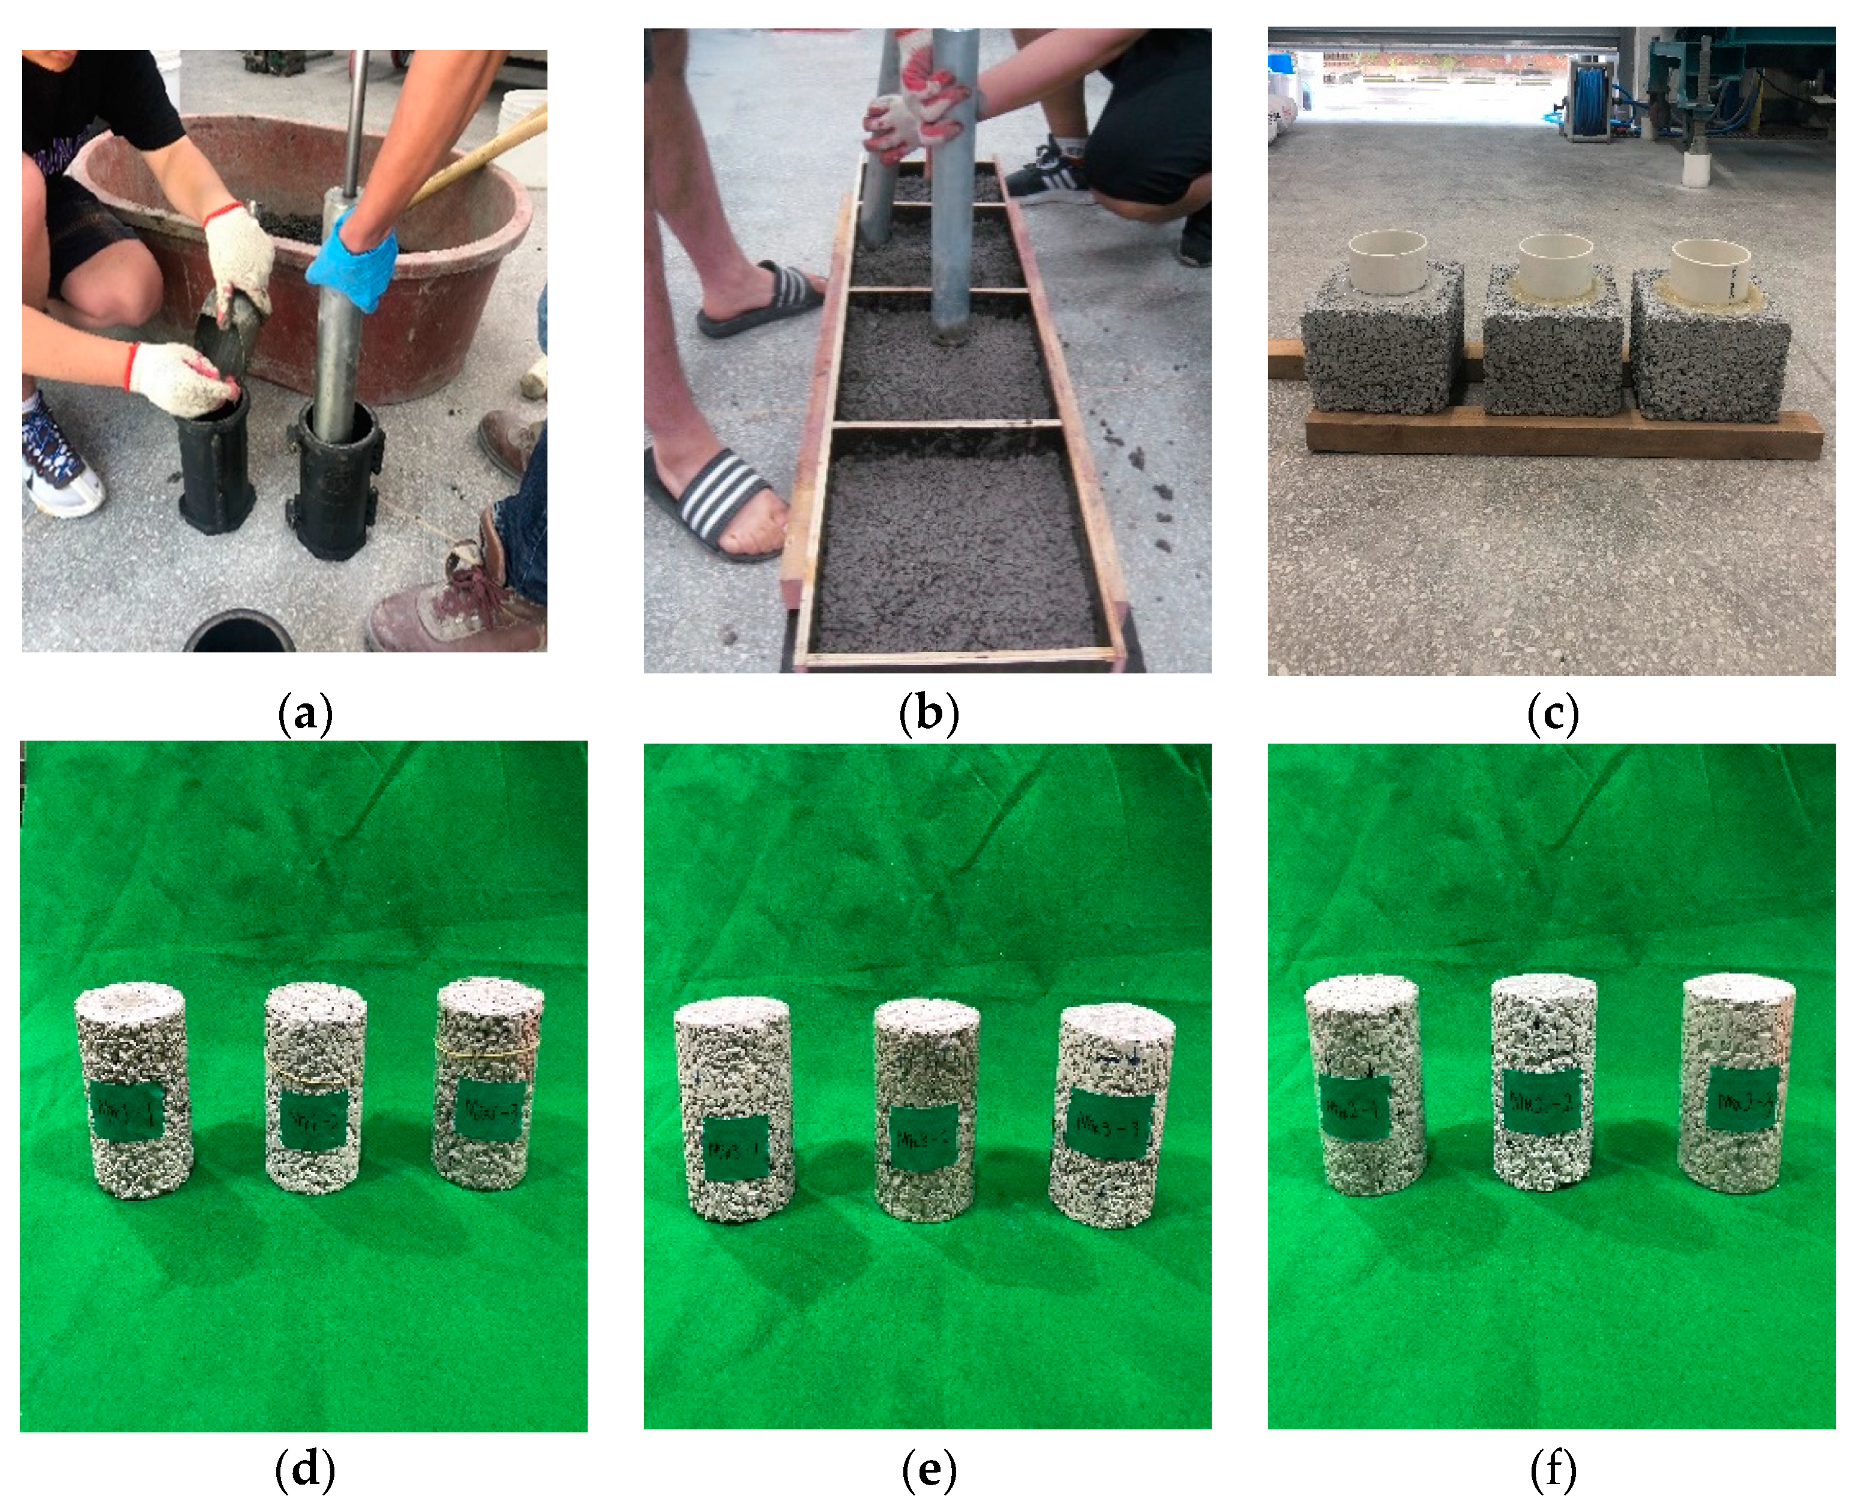
The pervious concrete was designed with a water-to-cement ratio (w/c) of 0.3, the Ordinary Portland cement was used as a binder and a poly-carboxylate high-range water-reducing admixture (AD) was applied in this research. The mix ratios of concrete considered in this study for finding the optimum pores and compressive strength using impact crush type aggregates are shown in Table 1. Three mix ratios were suggested by considering various aggregate sizes: 100% aggregate (D5–10) (Mix 1); 80% aggregate (D5–10) + 15% aggregate (D2–5) + 5% sand (Mix 2); and 50% aggregate (D5–10) + 45% aggregate (D2–5) + 5% sand (Mix 3). When manufacturing test specimens, the component materials were mixed in order of aggregate (D5–10), aggregate (D2–5), sand, AD, cement, and water. Three cylinder specimens with ϕ 100 mm × 200 mm were manufactured for each mixing ratio, and their permeability and compressive strength were measured. For Mix 1, one more cylinder was made for CT scanning and three block specimens with 200 mm × 200 mm × 150 mm for blockage testing. The specimen preparation procedures and their shapes are shown in Figure 1.
Immediately after the end of compaction and surface finishing process, the concrete cylinders were covered with a plastic layer to prevent moisture loss and cured in the room under a temperature of 20–25 °C and a relative humidity of 50–60% within 24 hours. Then, after removing the mold, the cylinders were cured in the water environment of 20–25 °C during 14 days and in air under experimental room conditions during the rest period as mentioned above.
2.2. Test for Measuring Void Content of Hardened Pervious Concrete
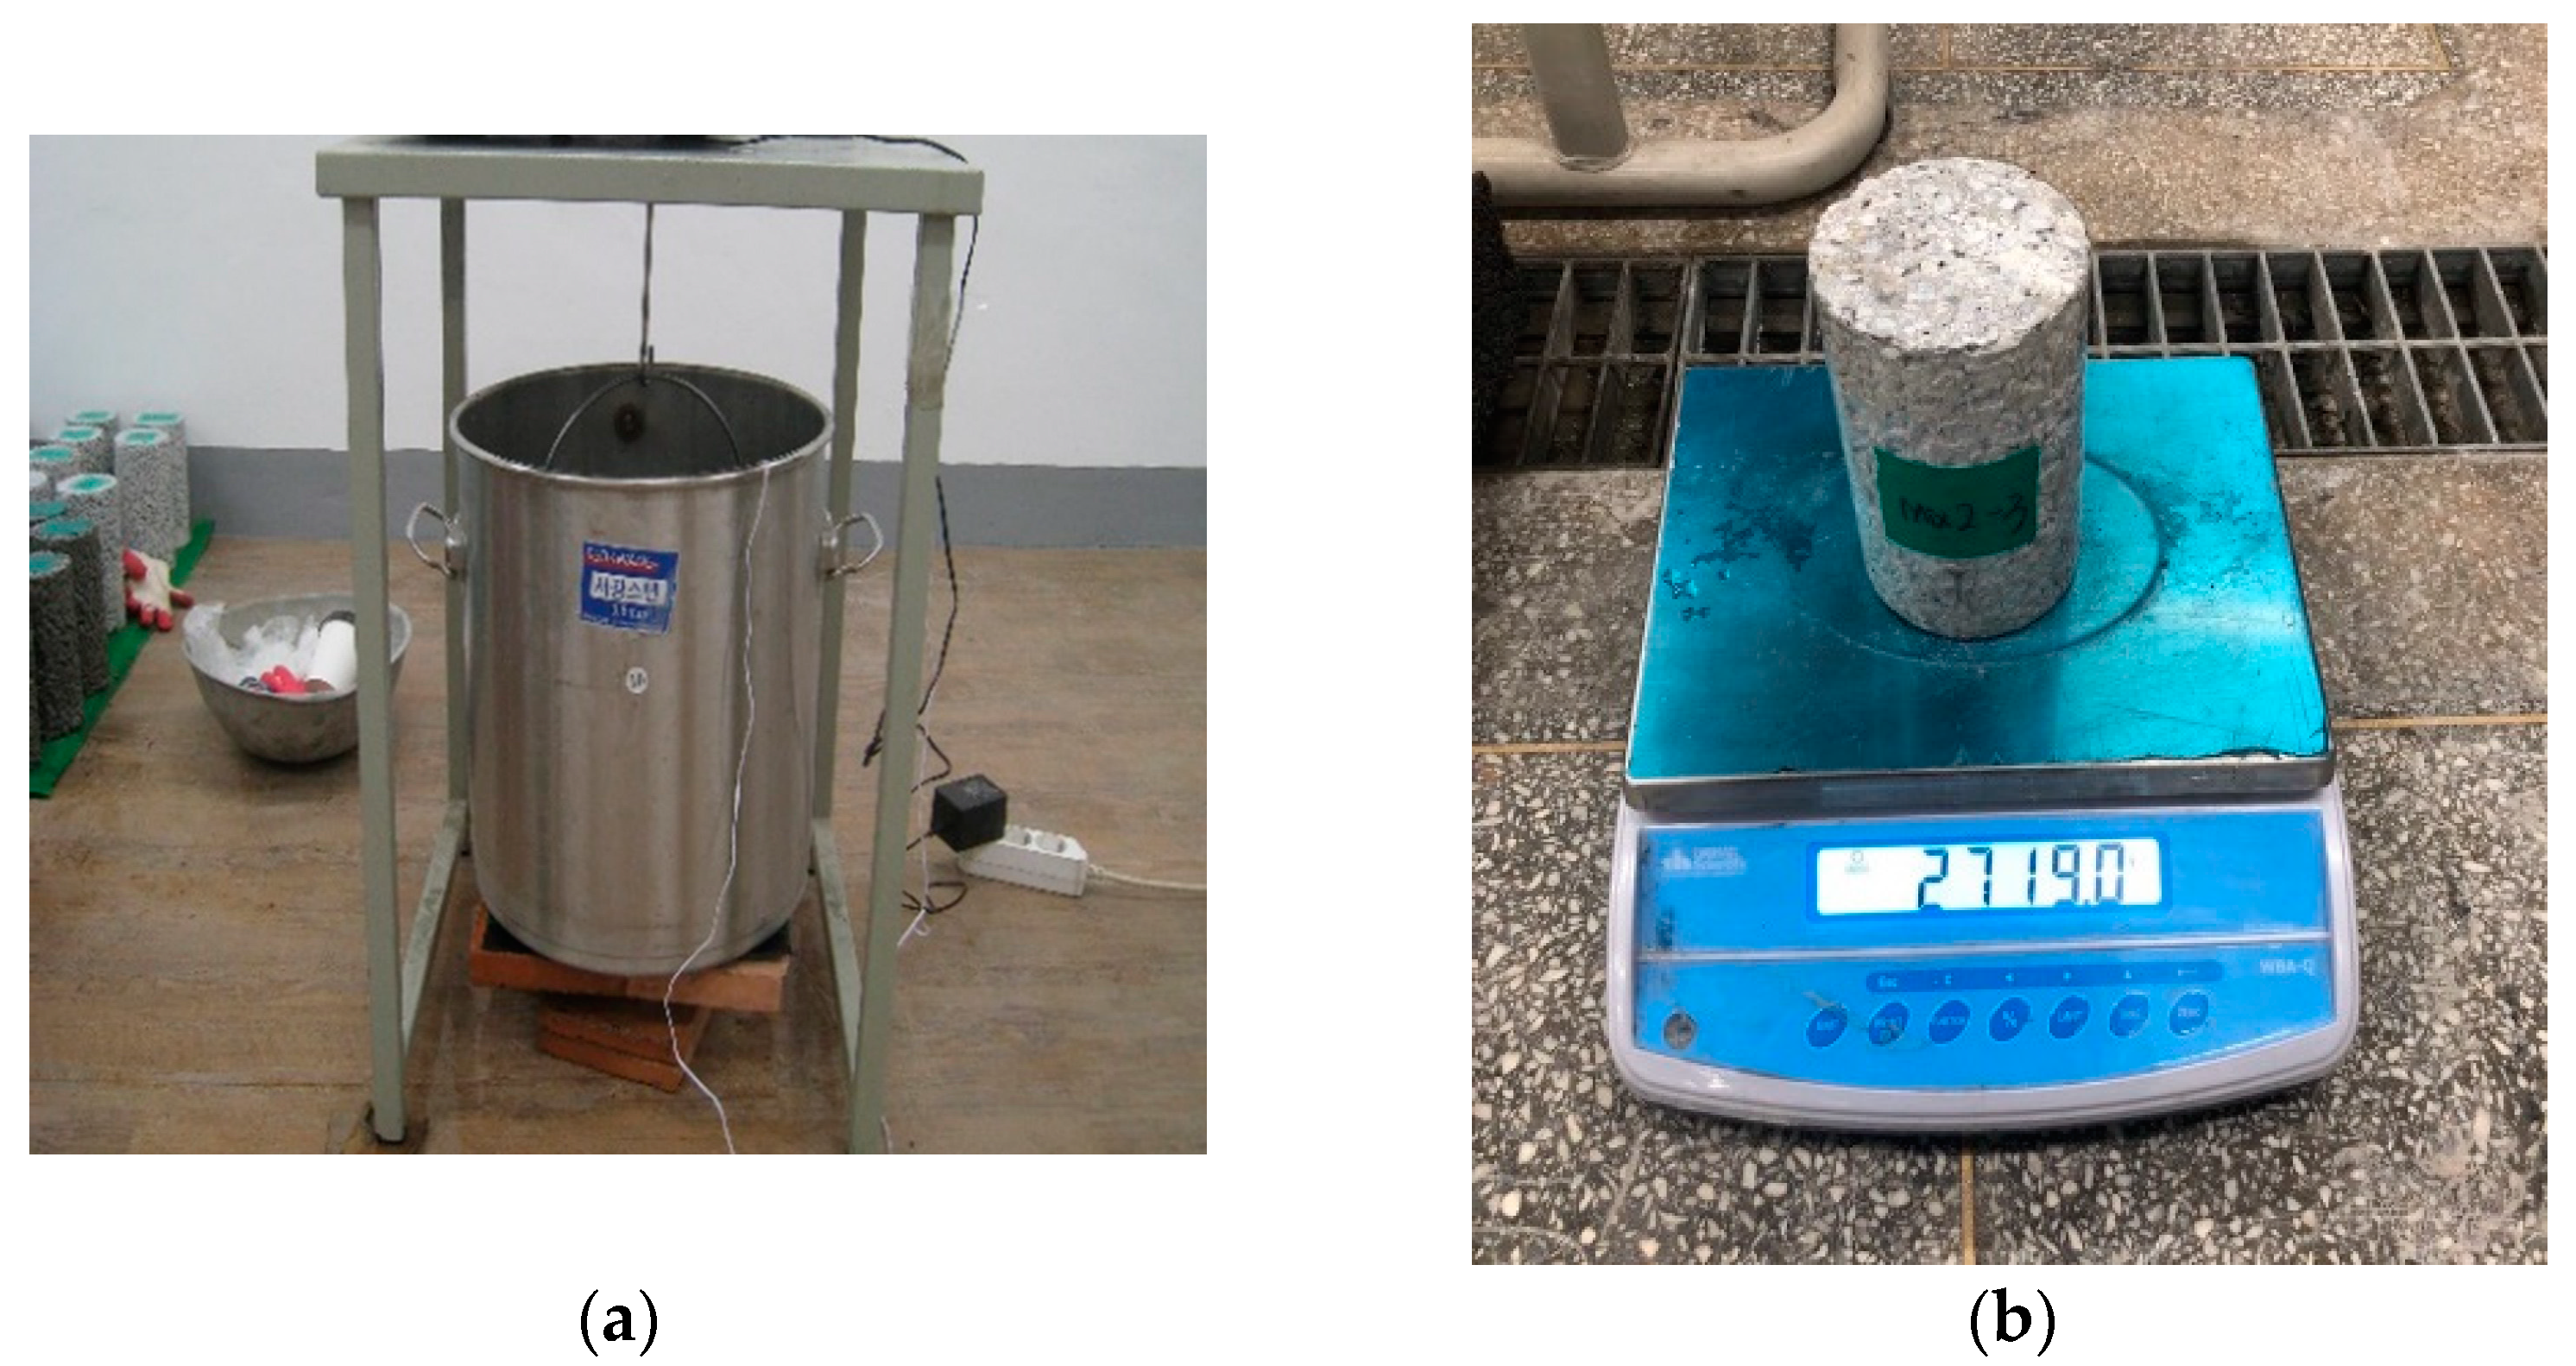
The void content for each cylinder specimen was measured at 21 days of age by using the volume displacement method: the underwater mass and the dry mass of concrete were measured in accordance with ASTM C1754/C1754M-12 [20] as shown in Figure 2, and the void ratio was calculated by using Equation (1):
where VCR is Void content ratio (%), K is 1,273,240 ((mm3·kg)/(m3·g)), A and B are dry mass and underwater mass of specimen (g), respectively, ρw is density of water (kg/m3), D and L are average diameter and length of specimen (mm), respectively.
2.3. Evaluation of Void Content of Hardened Concrete by CT Scan
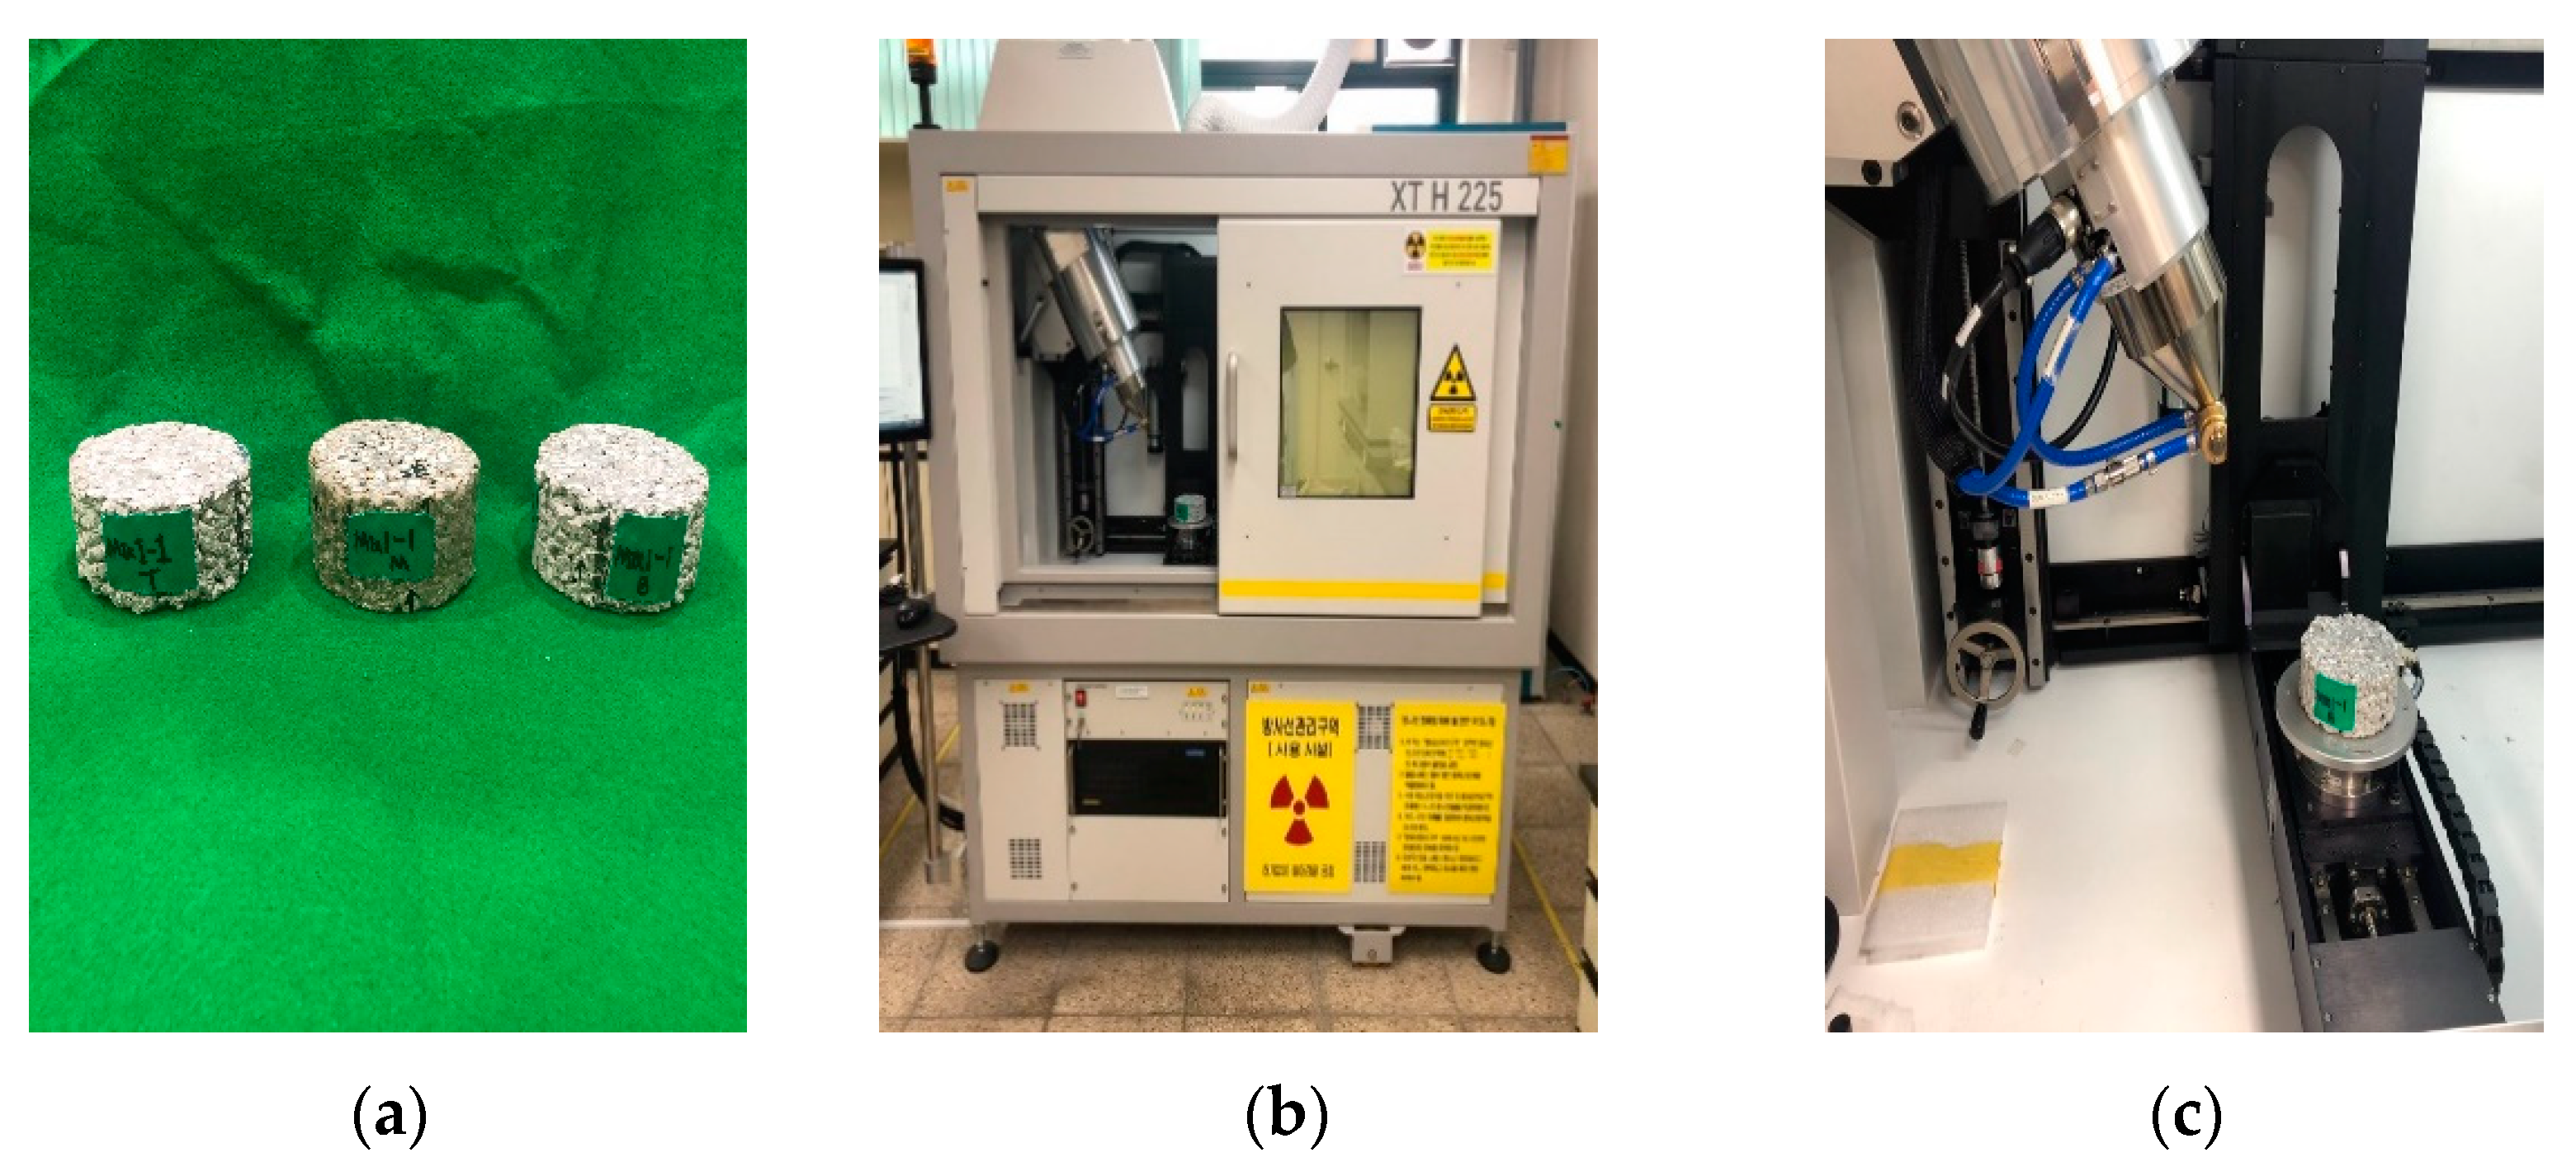
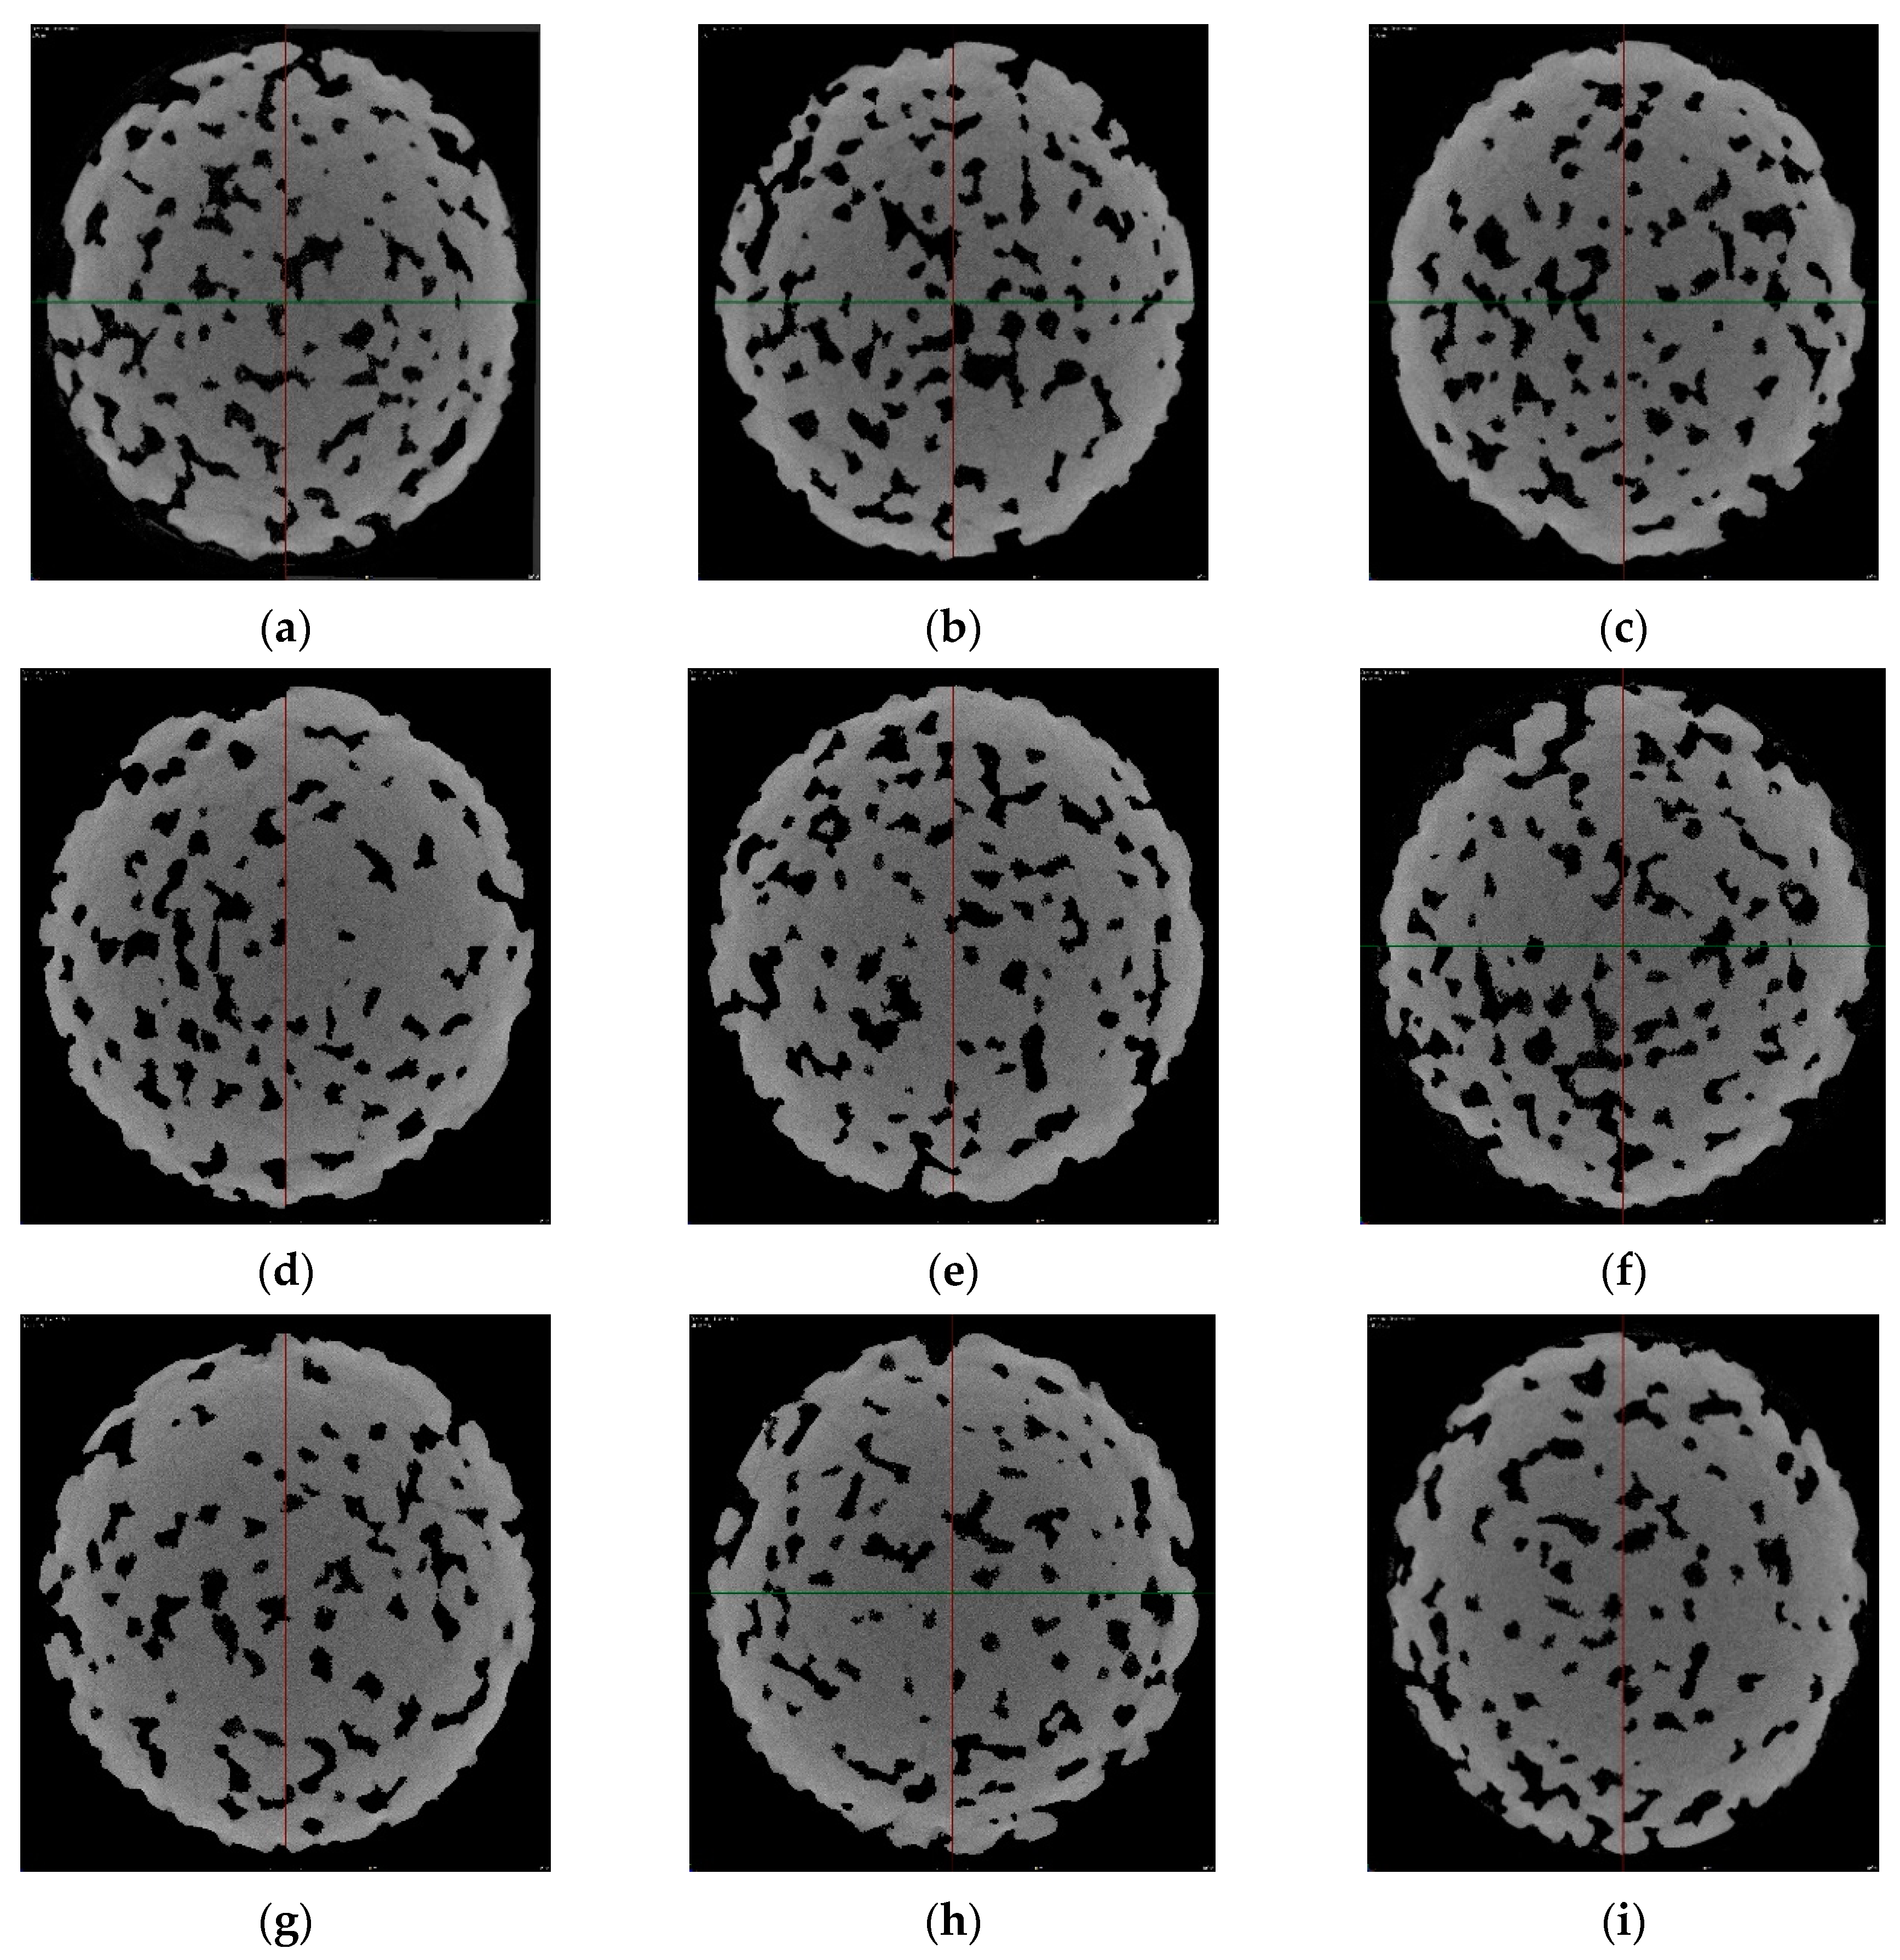
It is worth noting that detailed capture and measurement of internal component, such as porosity, is often vital for quality control, failure analysis, and material research. The measurement method of void ratio using underwater mass has the disadvantage of not being able to identify the void ratio isolated inside the test specimen. Therefore, CT scans were conducted to evaluate pores more accurately. Figure 3a shows the specimens for the CT scan after cutting the cylinder specimen to a height of 50 mm, making it into three specimens at the age of 21 days. Figure 3b,c represent the equipment for CT scan and CT imaging process, respectively. Figure 4 is a representation of the CT-taped image, with the center portion of the specimen cut to 50 mm designated as 0 mm and the position above +5 mm, +10 mm, +15 mm, +20 mm, +25 mm, −5 mm, −10 mm, −15 mm, −20 mm, and −25 mm below. To obtain the void content of each image, the pixel of the area where the void portion was deleted was calculated through Photoshop program and converted to the entire void. For the evaluation of CT scan results, a void content test was performed on the CT scan specimen at the age of 21 days by using the ASTM C1754/C1754M-12 [20] method, and the results were compared with CT results.
2.4. Water Permeability Test
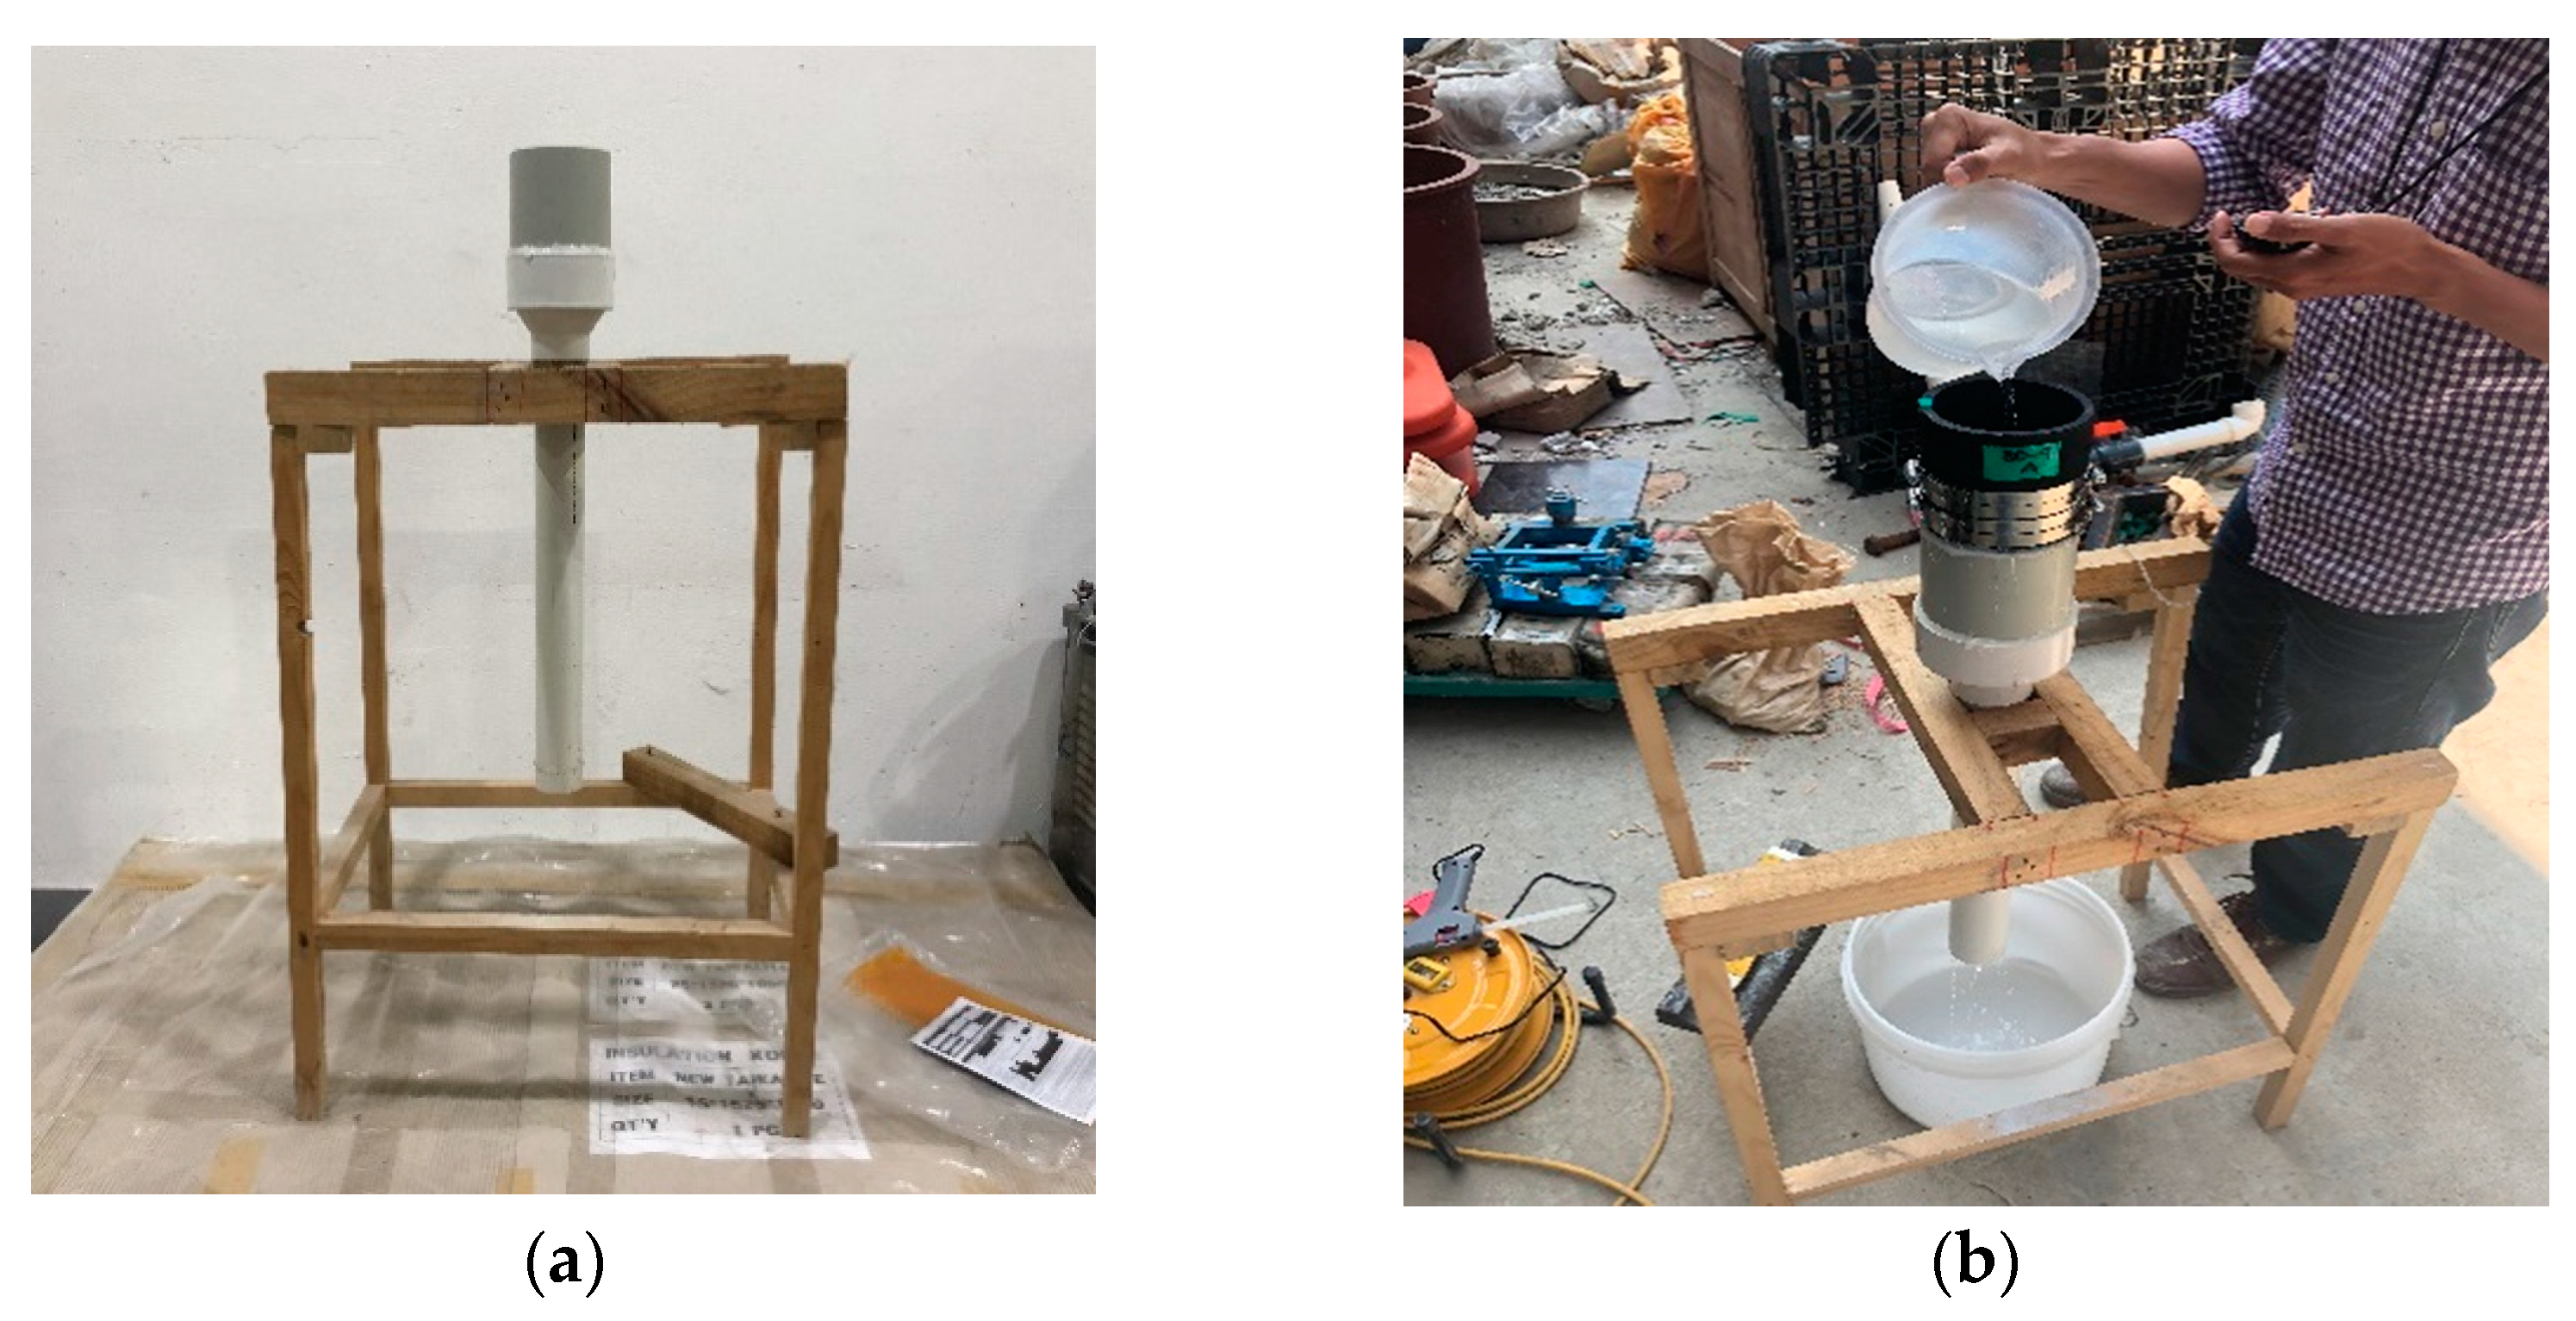
The water permeability test is an experiment to obtain the permeability coefficient of pervious concrete. In accordance with the ASTM C1701/1701M-17a [21] infiltration test for pervious concrete, the sides of the specimens were wrapped with tape and rubber packing to block the water flowing out of the specimens, and the specimens were fixed on the pipe top in Figure 5a. The experiment was carried out while keeping the water of 1.2 L constant at a height of 10–15 mm at the age of 28 days. In this process, the total time of 1.2 L water passing through the specimen was measured, and the permeability coefficient was calculated by substituting this in Equation (2).
where I is the infiltration ratio (mm/h), M is the mass of infiltrated water (kg), D is the inside diameter of infiltration ring (mm), t is time required for measured amount of water to infiltrate the concrete (s), K is 4,583,666,000 ((mm3·s)/(kg·h)).
2.5. Compressive Strength Test
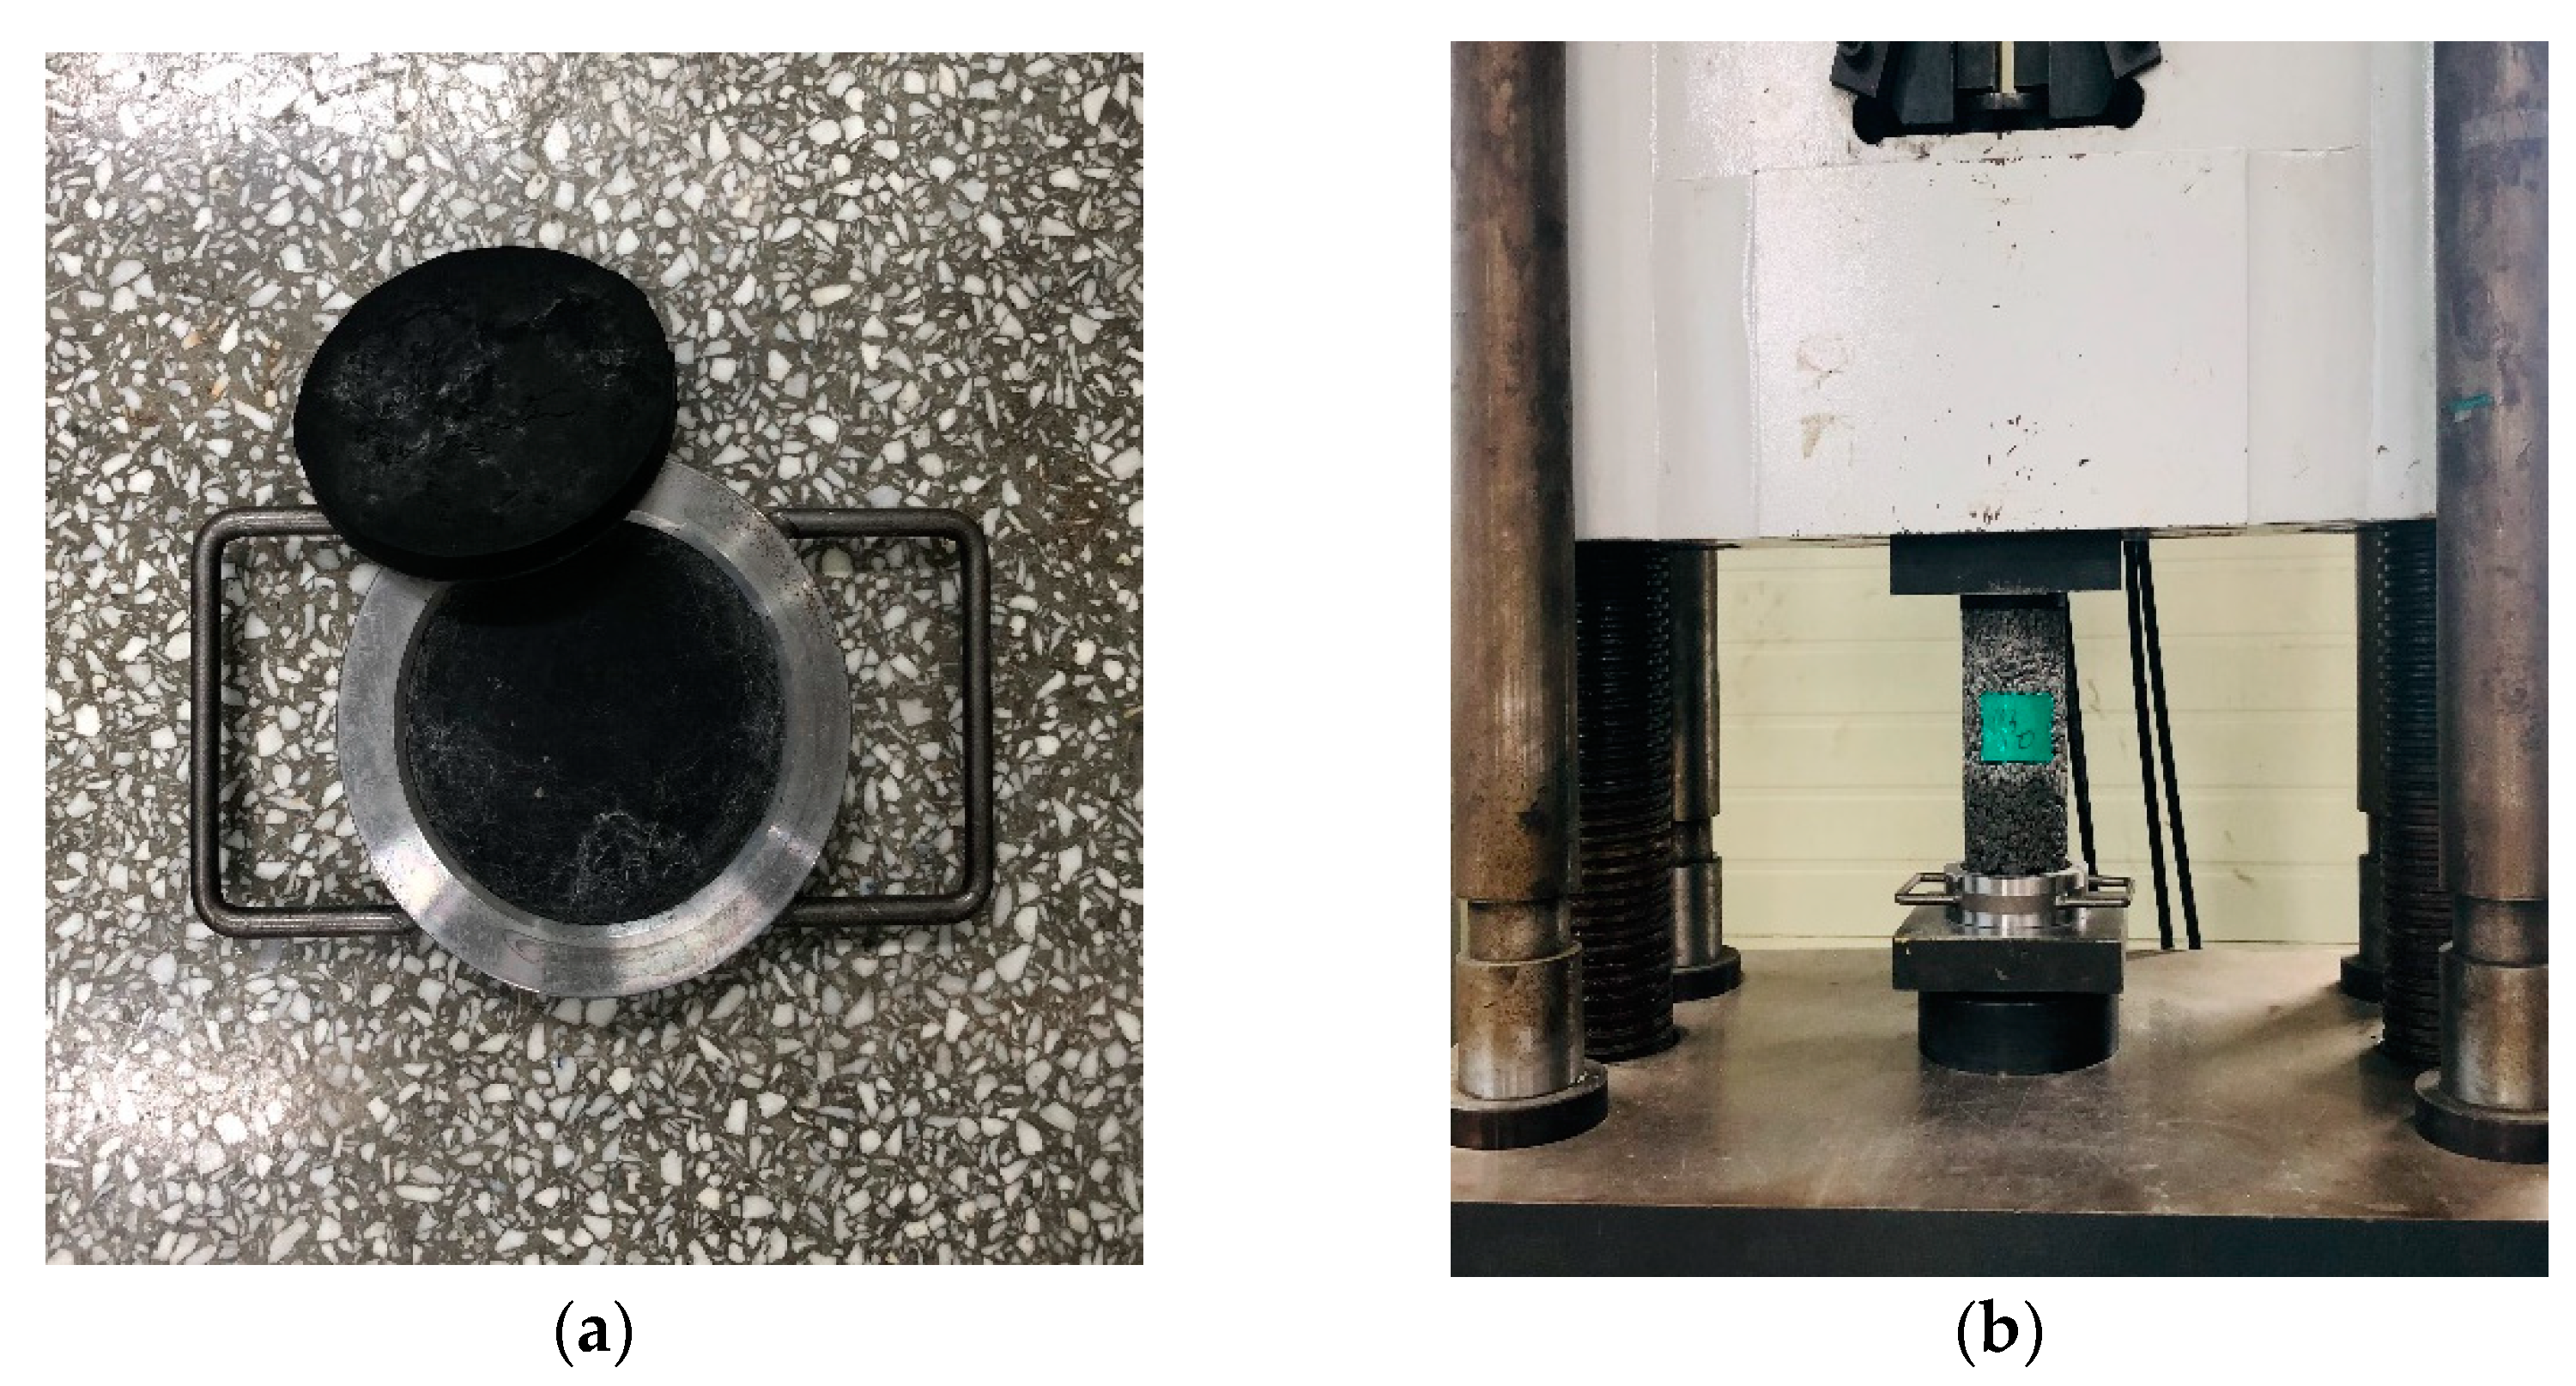
In order to know the compressive strength of the pervious concrete for each mix case, the cylinder specimens of ∅100 mm × 200 mm size were cured for 28 days and then tested according to the KS F 2405-2005 [22] test method for cylindrical concrete specimens. In the compression test, the surface of the specimen was polished to be the same load condition for each test specimen, and the test was carried out by padding rubber un-bonded caps on the top and bottom. Figure 6 shows the rubber pad used in the test and the compressive strength test.
2.6. Void Clogging Test
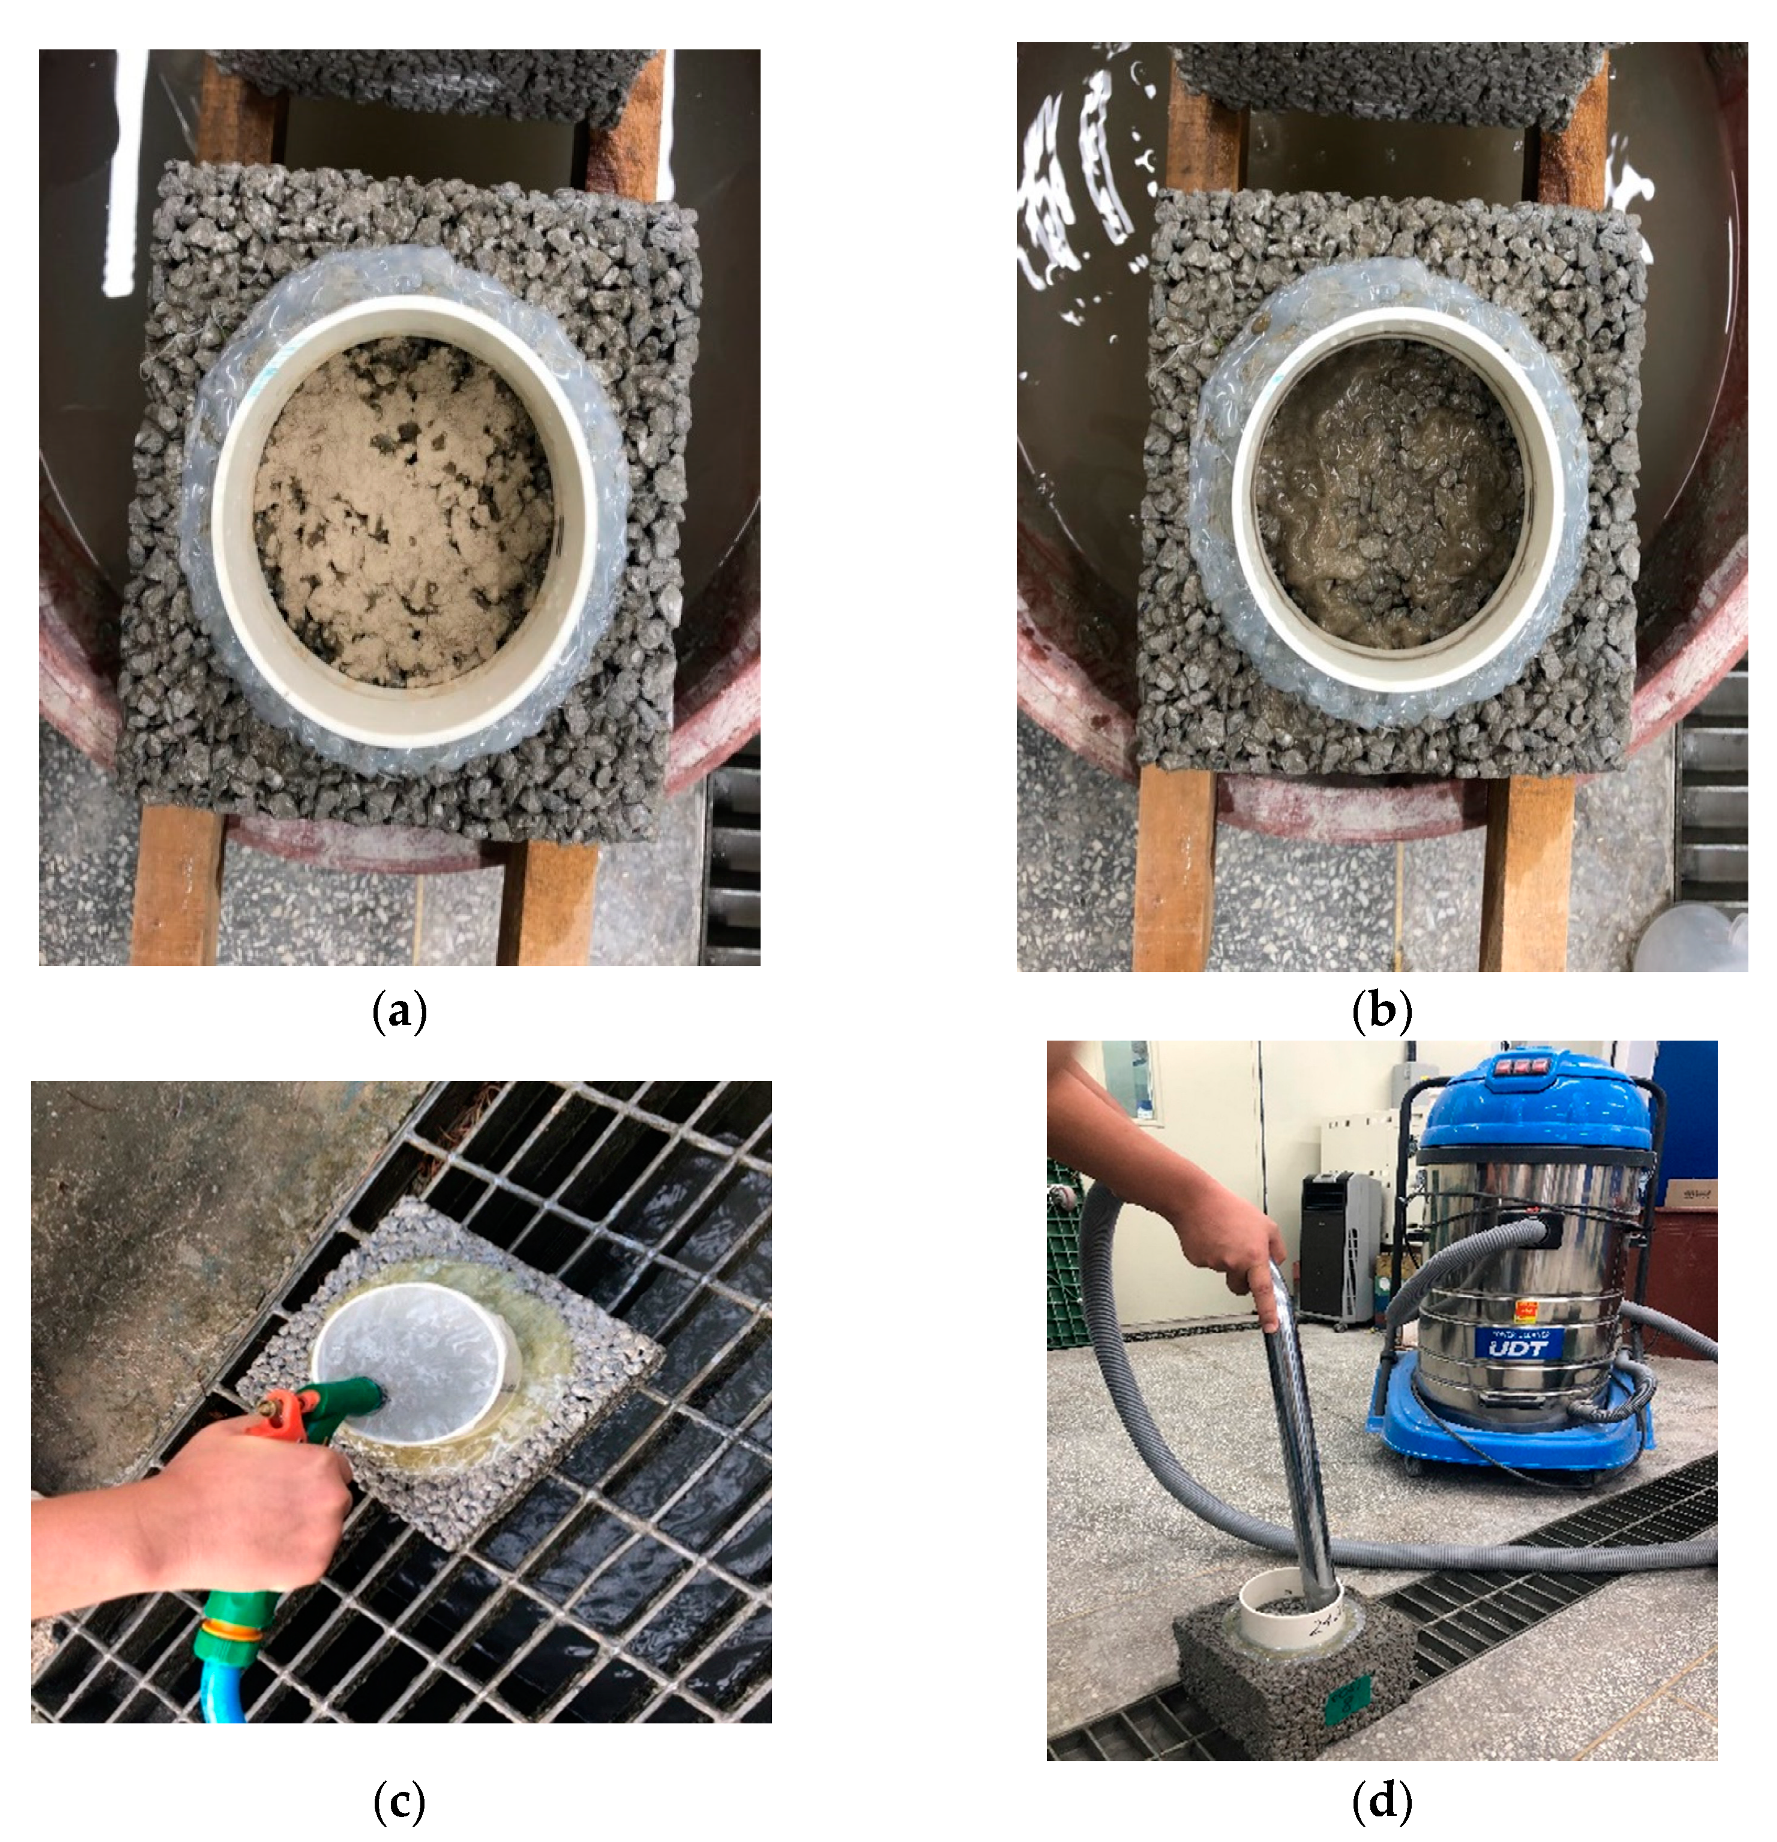
In pervious concrete, “pore blockages” occur in which pores are blocked by deposits such as leaves, sand, and dust on the road. In this study, to verify the effectiveness of the maintenance method of pervious concrete, permeability tests were carried out by accumulating 8.3 g/L of contaminant substance of 0.15 mm or less four times assuming the sandy soils at the age of 56 days as shown in (a) and (b) of Figure 7. After that, high pressure water and vacuum cleaning were performed as shown in (c) and (d) of Figure 7 to recover the permeability. This process was repeated three times to examine the permeability coefficient of the pervious concrete block.
3. Test Results
3.1. Porosity of Hardened Pervious Concrete
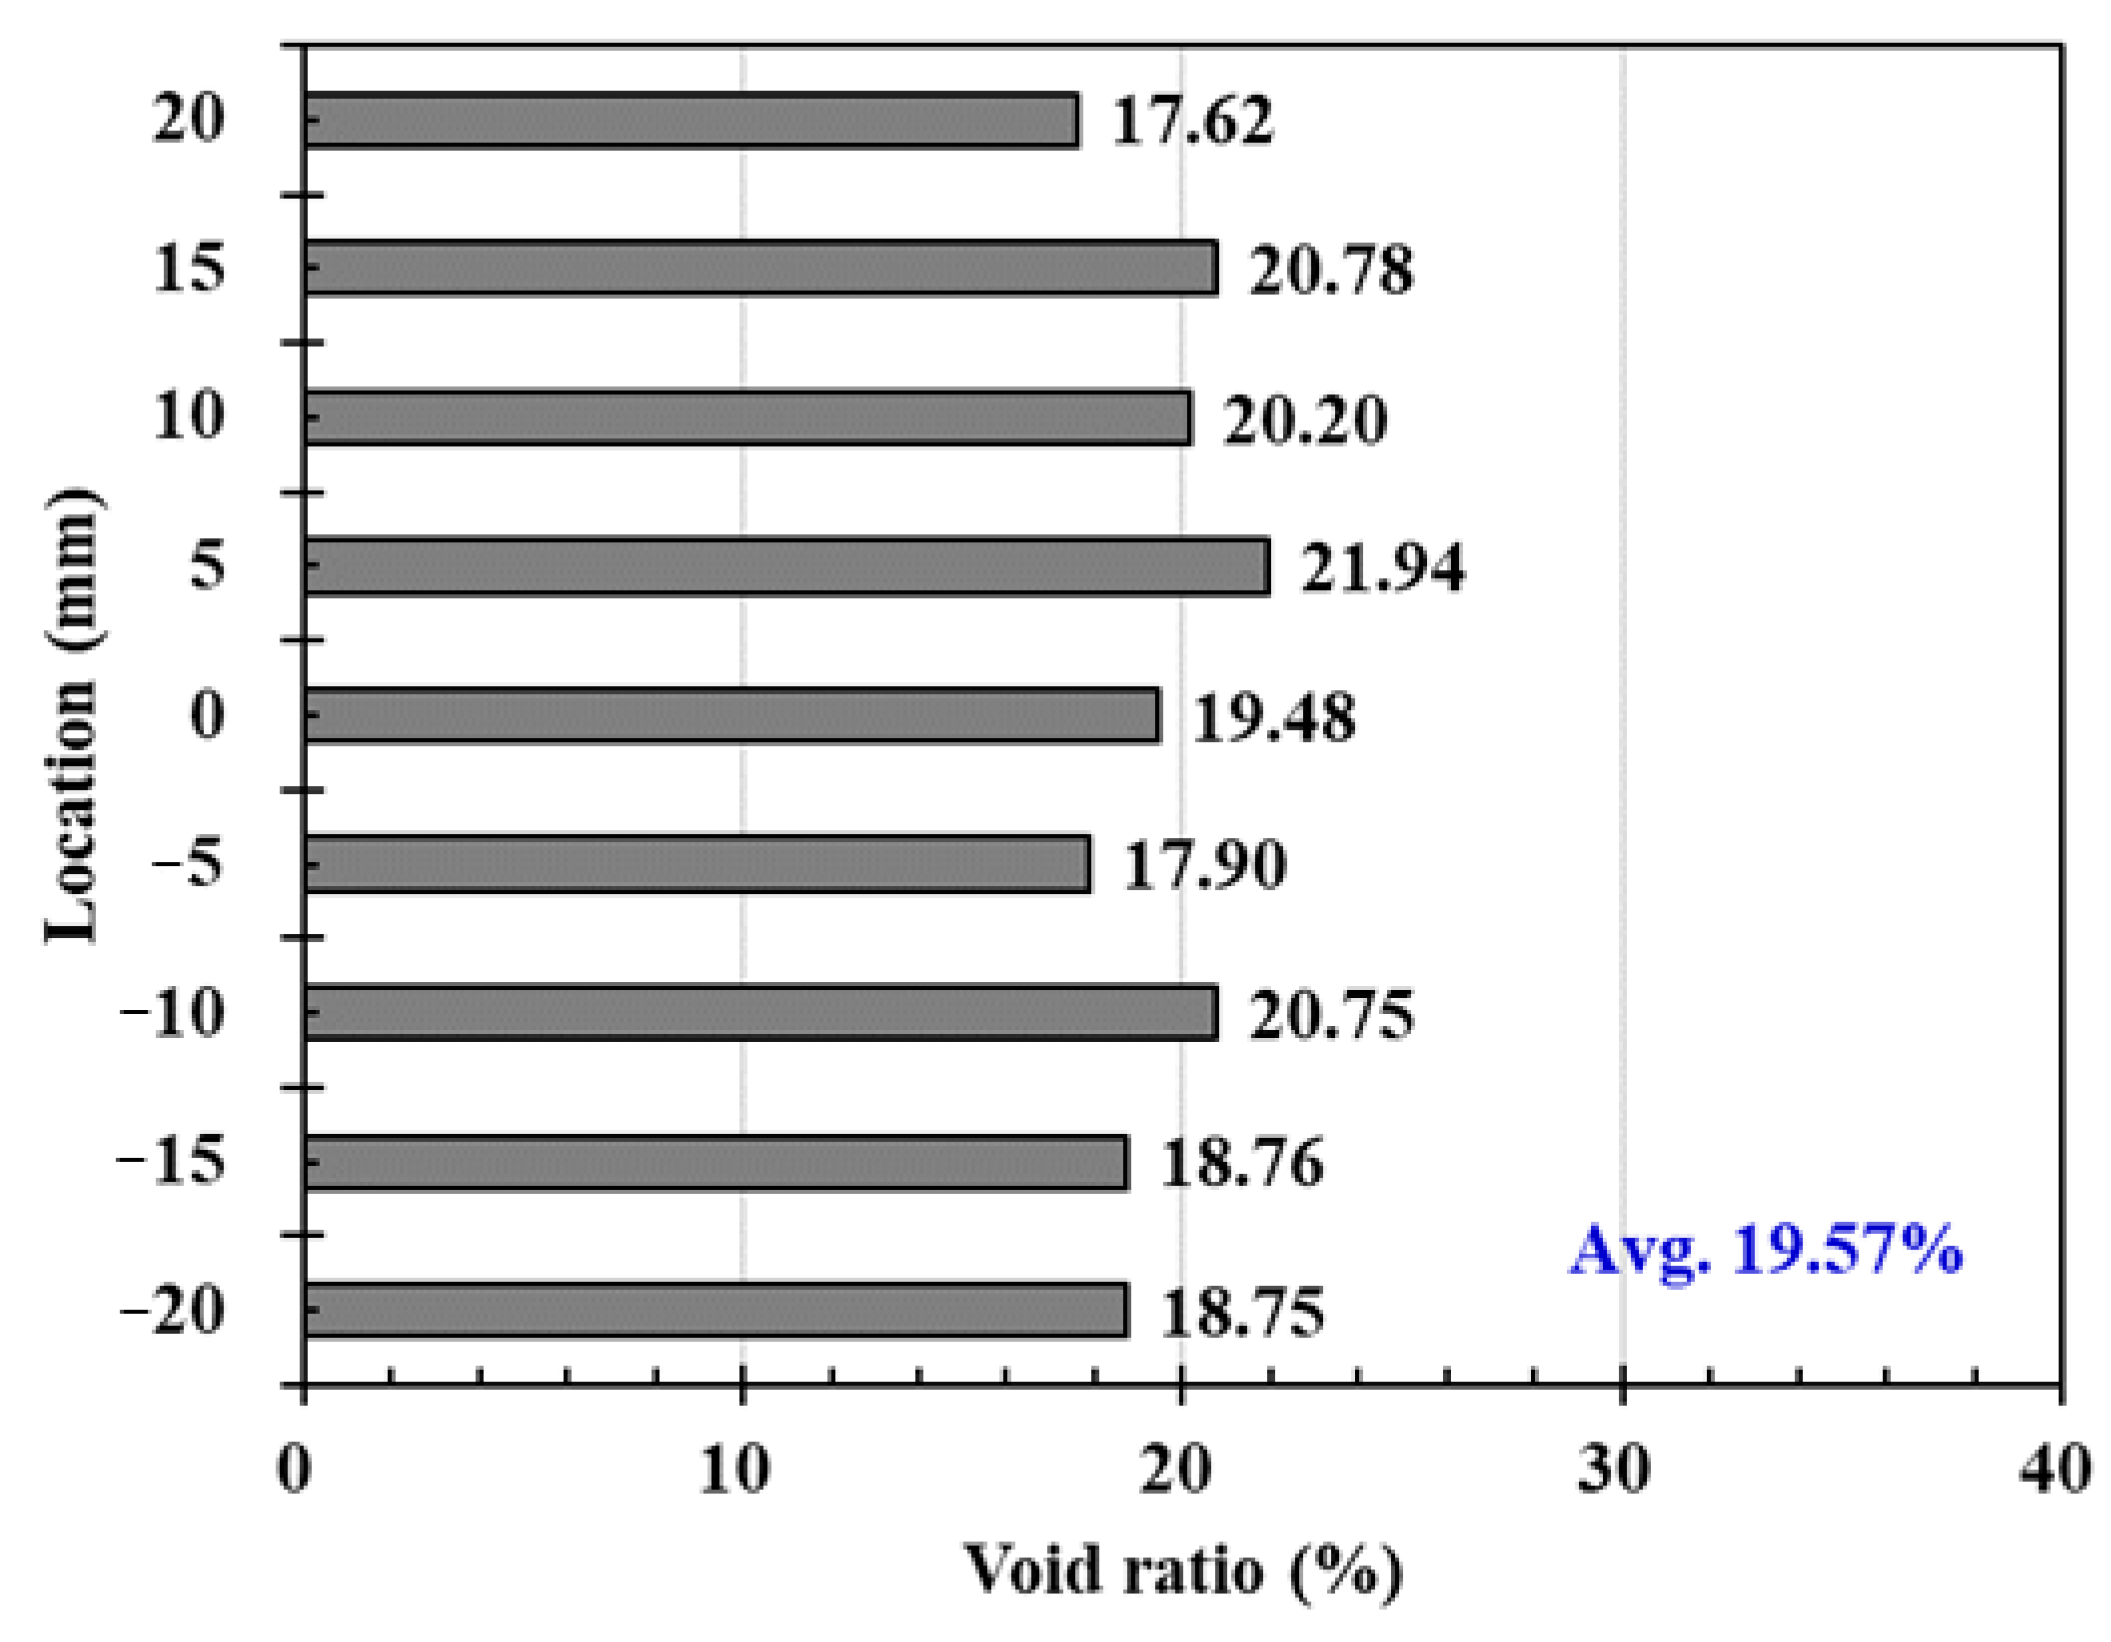
Table 2 shows the information and calculated results for each specimen measured to calculate the porosity. The average void content for Mixes 1, 2, and 3 was measured at approximately 22.2%, 13.7%, and 11.6%, respectively. As a result of measuring the porosity of specimens by mass in water, it was observed that the porosity decreased as the proportion of fine aggregates increased. The reason for this is that, when the amount of fine aggregate increases, the surface area in which the aggregates contact each other increases. Figure 8 shows the porosity graph for each position obtained by analyzing CT images of Mix 1 case. At locations +25 mm and −25 mm, the breaking of concrete was serious once cutting so the results were not included. As a result of analyzing, the porosity after photographing specimens, the porosity ranged from 17.62% to 21.94% and the average was 19.57%. Before the CT measurement as mentioned previously, the void content test for the specimen was also performed by [20]. The porosity obtained from the test was 17.1%, which is 87% of the CT scan result. The reason for this difference is that isolated pores inside the specimen, which could not be measured in the underwater mass, can be identified by CT scan.
3.2. Water Permeability Coefficient of Pervious Concrete
Table 3 shows the permeability coefficients obtained by substituting the results obtained from the water permeability tests of three specimens for each mixing ratio into Equation (2). The diameter of infiltration pipe and weight of infiltrated water for all specimens were 100 mm and 1.2 kg, respectively.
The average permeability coefficient for each mix case is 2.72 mm/s for Mix 1, 0.85 mm/s for Mix 2, and 0.16 mm/s for Mix 3, respectively. It can be seen that all the mix ratios satisfy the permeability coefficient of 0.1 mm/s or more according to Guide Specifications of Korea Land & Housing Corporation [23]. However, despite the same porosity, there was a difference in the permeability coefficient. This is because the permeability coefficient is affected when the voids in the specimens are not connected smoothly or are isolated by themselves. In other words, the infiltration rate of pervious concrete depends on pore connectivity rather than porosity [24]. In addition, as the proportion of fine aggregates increased, the porosity and permeability decreased. It can be explained that, when the blended aggregates of different sizes were used in pervious concrete mixture, the initial porosity between aggregates after compaction is smaller than that of single size due to the particle packing effect. As a result, the total void content for pervious concrete with an appropriate aggregate mix is to be lower. Therefore, the water permeability coefficient decreases.
3.3. Compressive Strength
Table 4 shows the results of 28-day compressive strength of specimens. The average compressive strengths of Mix 1, Mix 2, and Mix 3 were 11.0 MPa, 13.3 MPa, and 18.4 MPa, respectively. Among them, the average compressive strength of the specimens of Mix 3 satisfied 18 MPa that can be applied to sidewalks, bicycle roads, and other civil facilities without considering the traffic loads [23]. It can be seen that, when the porosity increases, the compressive strength of pervious concrete decreases. In this study, different aggregate mixing ratios significantly influence the void content and thus affect the strength of hardened pervious concrete. By substituting smaller and appropriate-sized aggregates in blended aggregate system, it is believed that the void content becomes lower due to further particle contacting effect, resulting in higher compressive strengths. Similar result was also observed and well-explained in another research [25].
3.4. Void Clogging Test Results
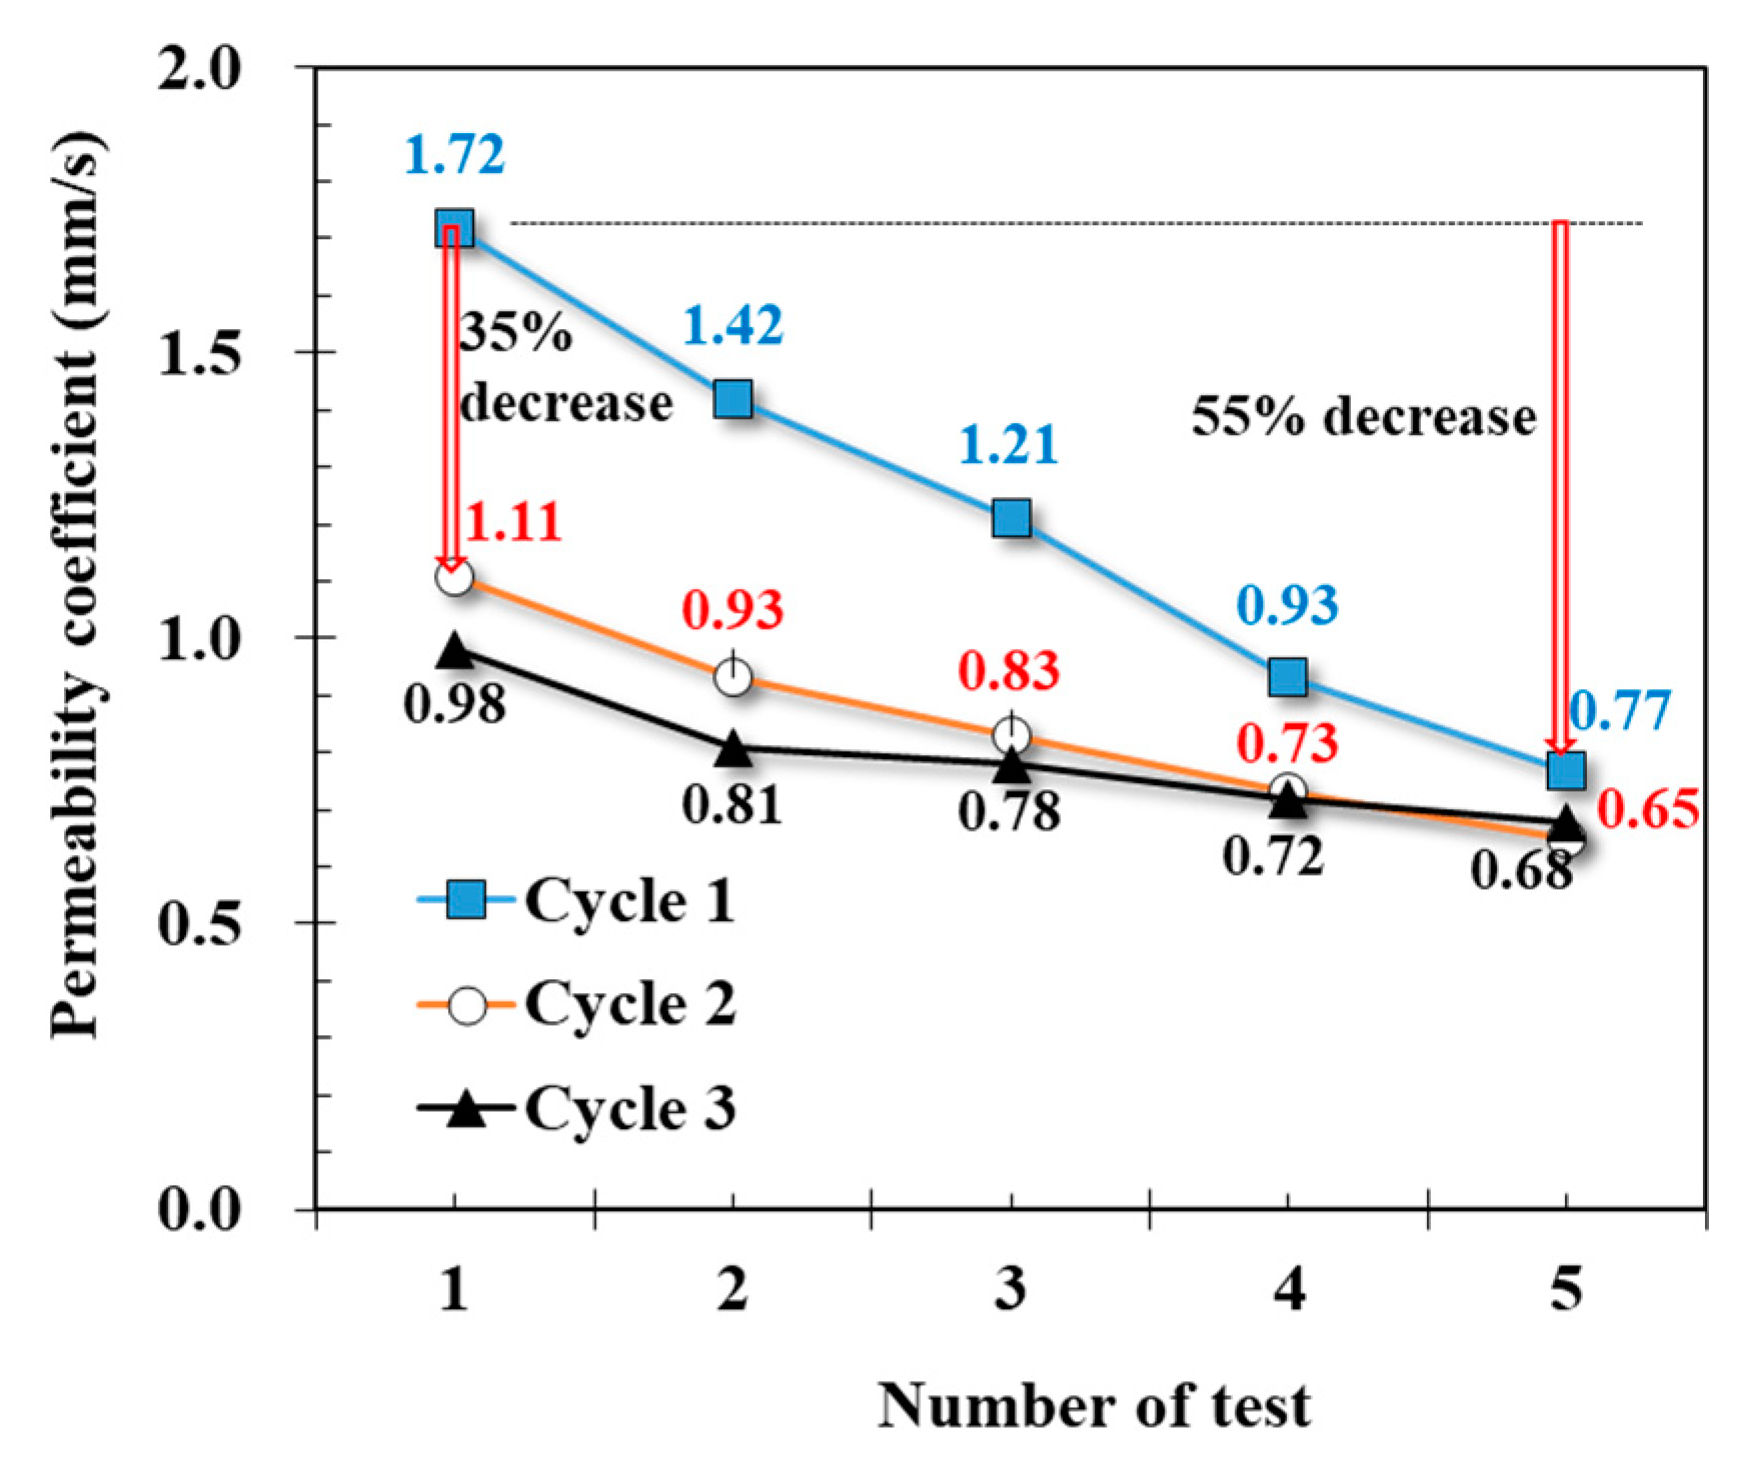
Table 5 and Figure 9 represent the void clogging test results. The average permeability coefficient, which was 1.72 mm/s before the test without blocking materials, decreased to 0.77 mm/s after one cycle, and recovered 1.11 mm/s after the internal cleaning; the coefficient is reduced by 55% compared to before the test in the first cycle. After completing the second and third cycles, the permeability coefficients were 0.65 and 0.68, respectively. These values represent 38% and 40%, respectively, as ratios of the permeability coefficient drawn from the permeability test without blocking materials. The experimental results show that the vacuum cleaning and high pressure watering methods are effective in the recovery of permeability. Similar results were also observed in [9,10]. However, further experiments will be needed to restore the exact limit life, maintenance cycle, and permeability of pervious concrete.
4. Conclusions
An experimental investigation is conducted to examine the influence of blended aggregate and blocking materials on the mechanical and permeability characteristics of pervious concrete in this study. The void ratio, density, compressive strength, water permeability coefficient, and the pore clogging phenomenon of pervious concrete are investigated. This contribution will support the introduction and popularization of permeable concrete technology to sustainable development, minimizing the adverse effects of heavy rainfall and urban heat island. Based on observed data in this study, the following conclusions have been drawn:
- The mixing ratio of pervious concrete Mix 3 (kg/m3), which contains 431 kg of cement, 129 kg of water, 764 kg of D5–10 mm aggregate (50%), 687 kg of D2–5 mm aggregate (45%), and 76 kg sand (5%), was considered as the most appropriate ratio that can satisfy the permeability coefficient of 0.1 mm/s, the porosity of 8%, and the strength of 18 MPa.
- Comparing the porosity through the experiment of mass underwater and the CT image analysis, it can be seen that the porosity by the CT image is to be 115% higher. This is because it is difficult to measure the voids isolated inside in the case of the test of underwater mass, but it is possible to measure all the voids inside in the case of CT imaging.
- From the permeability test results, it was shown that the permeability coefficient is about 2.72 mm/s for Mix 1 with an average porosity of 22.2%, 0.85 mm/s for Mix 2 with an average porosity of 13.7%, and 0.16 mm/s for Mix 3 with an average porosity of 11.6%. From the above results, it can be concluded that, by blending smaller and appropriate-sized aggregates into concrete mix, the porosity of hardened concrete decreases resulting in the reduction of the water permeability coefficient of pervious concrete.As a result of the compressive strength test, it was found that the compressive strength increased as the porosity decreased. This is because the specific surface and adhesion area between aggregates and cement paste increase as the aggregate size gets smaller, which is beneficial to the compressive strength of pervious concrete.
- Analyzing the results of laboratory research conducted within this study on the pore clogging experiment presented in Section 3.4 and in Table 5, it can be concluded that the water infiltration rate of pervious concrete was restored at a constant rate when the permeation performance was reduced and then cleaned by vacuum cleaning and high pressure spraying. However, it was not possible to restore the original permeability performance. Further experimentation and research are needed.
Author Contributions
V.V.H.: Conceptualization, Methodology, Investigation, Writing—original draft, Writing—review and editing. S.-Y.S.: Conceptualization, Methodology, Investigation, Writing—original draft, Writing—review and editing. H.-W.K.: Investigation, review and editing. G.-C.L.: Investigation, Writing. All authors have read and agreed to the published version of the manuscript.
Funding
This research was supported by Basic Science Research Program through the National Research Foundation of Korea (NRF) funded by the Ministry of Education (No. 2018R1A4A1025953) and 2018 NRF Postdoctoral Fellowship Program for Foreign Researchers from the National Research Foundation of Korea.
Informed Consent Statement
Not applicable.
Data Availability Statement
The data presented in this study are available on request from the corresponding author. The data are not publicly available due to the continuation of research and other manuscripts that are in process.
Conflicts of Interest
The authors declare no conflict of interest.
References
- National Disaster Safety Portal. Natural Disaster Statistics. Available online: http://www.safekorea.go.kr (accessed on 13 July 2018).
- Yang, J.; Jiang, G. Experimental study on properties of pervious concrete pavement materials. Cem. Concr. Res. 2003, 33, 381–386. [Google Scholar] [CrossRef]
- Chindaprasirt, P.; Hatanaka, S.; Chareerat, T. Cement Paste Characteristics and Porous Concrete Properties. Constr. Build. Mater. 2008, 22, 894–901. [Google Scholar] [CrossRef]
- Lin, W.; Park, D.-G.; Ryu, S.W.; Lee, B.-T.; Cho, Y.-H. Development of Permeability Test Method for Porous Concrete Block Pavement Materials Considering Clogging. Constr. Build. Mater. 2016, 118, 20–26. [Google Scholar] [CrossRef]
- Zhang, N. Experimental Investigation on Clogging Mechanism of Pervious Concrete; Shandong University: Jinan, China, 2014. [Google Scholar]
- Haselbach, L.M. Potential for Clay Clogging of Pervious Concrete under Extreme Conditions. J. Hydrol. Eng. 2010, 15, 67–69. [Google Scholar] [CrossRef]
- Yuan, J.; Chen, X.; Liu, S.; Li, S.; Shen, N. Effect of Water Head, Gradation of Clogging Agent, and Horizontal Flow Velocity on the Clogging Characteristics of Pervious Concrete. J. Mater. Civ. Eng. 2018, 30, 04018215. [Google Scholar] [CrossRef]
- Koo, Y. A Study on Runoff Analysis of Urban Watershed by Hydrologic Infiltration Experiment of Permeable Pavement. J. Korean Soc. Civ. Eng. 2013, 33, 559–571. [Google Scholar] [CrossRef] [Green Version]
- Hein, M.F.; Dougherty, M.; Hobbs, T. Cleaning Methods for Pervious Concrete Pavements. Int. J. Constr. Educ. Res. 2013, 9, 102–116. [Google Scholar] [CrossRef]
- Kia, A.; Wong, H.S.; Cheeseman, C.R. Clogging in Permeable Concrete: A review. J. Environ. Manag. 2017, 193, 221–233. [Google Scholar] [CrossRef] [PubMed]
- Haselbach, L.M.; Valavala, S.; Montes, F. Permeability Predictions for Sand-clogged Portland Cement Pervious Concrete Pavement Systems. J. Environ. Manag. 2006, 81, 42–49. [Google Scholar] [CrossRef]
- Kiran, V.K.; Anand, K.B. Study on Identically Voided Pervious Concrete Made with Different Sized Aggregates. IOP Conf. Ser. Mater. Sci. Eng. 2018, 310, 012064. [Google Scholar] [CrossRef]
- Haselbach, L.M.; Dutra, V.P.; Schwetz, P.F.; da Silva Filho, L.C.P. A Pervious Concrete Mix Design Based on Clogging Performance in Rio Grande do Sul. In Proceedings of the 3rd International Conference on Best Practices for Concrete Pavements, Rodovia, Brazil, 28–30 October 2015. [Google Scholar]
- Walsh, S.P.; Rowe, A.; Guo, Q. Laboratory Scale Study to Quantify the Effect of Sediment Accumulation on the Hydraulic Conductivity of Pervious Concrete. J. Irrig. Drain. Eng. 2014, 140, 04014014. [Google Scholar] [CrossRef]
- Kia, A.; Wong, H.S.; Cheeseman, C.R. Defining Clogging Potential for Permeable Concrete. J. Environ. Manag. 2018, 220, 44–53. [Google Scholar] [CrossRef] [PubMed]
- Zhou, H.; Li, H.; Abdelhady, A.; Liang, X.; Wang, H.; Yang, B. Experimental Investigation on the Effect of Pore Characteristics on Clogging Risk of Pervious Concrete Based on CT Scanning. Constr. Build. Mater. 2019, 212, 130–139. [Google Scholar] [CrossRef]
- Yu, F.; Sun, D.; Hu, M.; Wang, J. Study on the Pores Characteristics and Permeability Simulation of Pervious Concrete Based on 2D/3D CT Images. Constr. Build. Mater. 2019, 200, 687–702. [Google Scholar] [CrossRef]
- Sumanasooriya, M.S.; Bentz, D.P.; Neithalath, N. Planar Image-Based Reconstruction of Pervious Concrete Pore Structure and Permeability Prediction. ACI Mater. J. 2010, 107, 413–421. [Google Scholar]
- Deo, O.; Neithalath, N. Compressive Behavior of Pervious Concretes and a Quantification of the Influence of Random Pore Structure Features. Mater. Sci. Eng. A 2015, 528, 402–412. [Google Scholar] [CrossRef]
- Standard Test Method for Density and Void Content of Hardened Pervious Concrete; ASTM C1754; ASTM International: West Conshohocken, PA, USA, 2012.
- Standard Test Method for Infiltration Rate of in Place Pervious Concrete; ASTM C1701; ASTM International: West Conshohocken, PA, USA, 2017.
- Method of Test for Compressive Strength of Concrete; KS F 2405; Korean Standards Association: Seoul, Korea, 2005.
- Korea Land & Housing Corporation. 34023 Concrete Pavement with Permeable Cement in Guide Specifications; Korea Land & Housing Corporation: Jinju-si, Korea, 2012. [Google Scholar]
- Sonebi, M.; Bassuoni, M.; Yahia, A. Pervious Concrete: Mix Design, Properties and Applications. RILEM Tech. Lett. 2016, 1, 109–115. [Google Scholar] [CrossRef]
- Fu, T.C.; Yeih, W.; Chang, J.J.; Huang, R. The Influence of Aggregate Size and Binder Material on the Properties of Pervious Concrete. Adv. Mater. Sci. Eng. 2014, 2014, 963971. [Google Scholar] [CrossRef] [Green Version]
Figure 1.
Specimen preparation procedure and their shapes. (a) cylinder fabrication; (b) block specimen fabrication; (c) block specimens; (d) mix 1 specimens; (e) mix 2 specimens; (f) mix 3 specimens.
Figure 1.
Specimen preparation procedure and their shapes. (a) cylinder fabrication; (b) block specimen fabrication; (c) block specimens; (d) mix 1 specimens; (e) mix 2 specimens; (f) mix 3 specimens.

Figure 2.
Measurement of mass in underwater and dry conditions. (a) in underwater; (b) in dry condition.
Figure 2.
Measurement of mass in underwater and dry conditions. (a) in underwater; (b) in dry condition.

Figure 3.
Truncated specimens and CT imaging. (a) truncated specimen; (b) CT imaging equipment; (c) CT imaging process.
Figure 3.
Truncated specimens and CT imaging. (a) truncated specimen; (b) CT imaging equipment; (c) CT imaging process.

Figure 4.
Images with removed void from CT imaging. (a) Center; (b) +5 mm; (c) −5 mm; (d) + 10 mm; (e) –10 mm; (f) +15 mm; (g) −15 mm; (h) +20 mm; (i) −20 mm.
Figure 4.
Images with removed void from CT imaging. (a) Center; (b) +5 mm; (c) −5 mm; (d) + 10 mm; (e) –10 mm; (f) +15 mm; (g) −15 mm; (h) +20 mm; (i) −20 mm.

Figure 5.
Equipment and progress for the permeability test. (a) device for test; (b) test process.

Figure 6.
Compressive strength test. (a) rubber pad; (b) test setup.

Figure 7.
Void clogging test. (a) application of the blocking material; (b) after water penetration; (c) high pressure watering; (d) vacuum cleaning.
Figure 7.
Void clogging test. (a) application of the blocking material; (b) after water penetration; (c) high pressure watering; (d) vacuum cleaning.

Figure 8.
Void ratio at each truncated section from CT image.

Figure 9.
Permeability corresponding to accumulation of blocking material.


Table 1.
Mixing ratio of pervious concrete.
| Mix Case | Unit Weight (kg/m3) | ||||
|---|---|---|---|---|---|
| Cement | Water | Aggregate (D5–10) | Aggregate (D2–5) | Sand | |
| Mix 1 | 358 | 107 | 1595 | - | - |
| Mix 2 | 431 | 129 | 1222 | 229 | 76 |
| Mix 3 | 431 | 129 | 764 | 687 | 76 |
Table 2.
Measurement results of porosity.
| Mix Case | ρω (kg/m3) | A (g) | B (g) | Porosity Ratio (%) | |
|---|---|---|---|---|---|
| Mix 1 | 1 | 999.26 (14.2 °C) | 2555 | 1600 | 22.2 |
| 2 | 2493 | 1556 | 22.3 | ||
| 3 | 2515 | 1564 | 22.0 | ||
| Avg. | 2521 | 1573 | 22.2 | ||
| Mix 2 | 1 | 997.44 (23.4 °C) | 2589 | 1557 | 13.3 |
| 2 | 2683 | 1614 | 13.5 | ||
| 3 | 2609 | 1571 | 14.2 | ||
| Avg. | 2627 | 1581 | 13.7 | ||
| Mix 3 | 1 | 997.51 (23.1 °C) | 2716 | 1662 | 11.6 |
| 2 | 2724 | 1670 | 11.4 | ||
| 3 | 2724 | 1668 | 11.7 | ||
| Avg. | 2721 | 1667 | 11.6 | ||
Table 3.
Permeability coefficients calculated by Equation (2) using water permeability test results.
Table 3.
Permeability coefficients calculated by Equation (2) using water permeability test results.
| No. of Specimen | No. of Tests | Mix 1 | Mix 2 | Mix 3 | |||
|---|---|---|---|---|---|---|---|
| Time (s) | Permeability Coefficient (mm/s) | Time (s) | Permeability Coefficient (mm/s) | Time (s) | Permeability Coefficient (mm/s) | ||
| 1 | 1 | 94.5 | 1.62 | 183.7 | 0.83 | 183.7 | 0.15 |
| 2 | 88.8 | 1.72 | 172 | 0.89 | 172 | 0.18 | |
| 2 | 1 | 36 | 4.13 | 225.4 | 0.68 | 225.4 | 0.10 |
| 2 | 37 | 4.23 | 219.4 | 0.70 | 219.4 | 0.09 | |
| 3 | 1 | 63.3 | 2.41 | 147.5 | 1.04 | 147.5 | 0.22 |
| 2 | 61.4 | 2.19 | 155.5 | 0.98 | 155.5 | 0.23 | |
| Average permeability coefficient | 2.72 mm/s | 0.85 mm/s | 0.16 mm/s | ||||
Table 4.
Compressive strength results of specimens.
| Mix Case | No. | Porosity Ratio (%) | Density (kg/m3) | Load (N) | Compressive Strength (MPa) |
|---|---|---|---|---|---|
| Mix 1 | 1 | 22.2 | 2078 | 81,200 | 10.3 |
| 2 | 22.3 | 2065 | 84,000 | 10.7 | |
| 3 | 22.0 | 2060 | 93,200 | 11.9 | |
| Average | 22.2 | 2068 | 86,133 | 11.0 | |
| Mix 2 | 1 | 13.3 | 2170 | 102,400 | 13.0 |
| 2 | 13.5 | 2167 | 114,200 | 14.5 | |
| 3 | 14.2 | 2152 | 97,200 | 12.4 | |
| Average | 13.7 | 2163 | 104,600 | 13.3 | |
| Mix 3 | 1 | 11.6 | 2272 | 163,000 | 20.8 |
| 2 | 11.4 | 2284 | 138,000 | 17.6 | |
| 3 | 11.7 | 2271 | 132,800 | 16.9 | |
| Average | 11.6 | 2276 | 144,600 | 18.4 |
Table 5.
Variation of permeability coefficient corresponding to accumulation of blocking material.
| Test Cycle | No. of Test | |||||
|---|---|---|---|---|---|---|
| 1 | 2 | 3 | 4 | 5 | ||
| First cycle | Permeability coefficient (mm/s) | 1.72 * | 1.42 | 1.21 | 0.93 | 0.77 |
| Ratio (%) | 100 | 83 | 70 | 54 | 45 | |
| Second cycle | Permeability coefficient (mm/s) | 1.11 + | 0.93 | 0.83 | 0.73 | 0.65 |
| Ratio (%) | 65 | 54 | 48 | 42 | 38 | |
| Third cycle | Permeability coefficient (mm/s) | 0.98 + | 0.81 | 0.78 | 0.72 | 0.68 |
| Ratio (%) | 57 | 47 | 45 | 42 | 40 | |
* Before adding blocking material; + After cleaning the blocking materials of previous cycle.
Publisher’s Note: MDPI stays neutral with regard to jurisdictional claims in published maps and institutional affiliations. |
© 2021 by the authors. Licensee MDPI, Basel, Switzerland. This article is an open access article distributed under the terms and conditions of the Creative Commons Attribution (CC BY) license (http://creativecommons.org/licenses/by/4.0/).
Share and Cite
MDPI and ACS Style
Hung, V.V.; Seo, S.-Y.; Kim, H.-W.; Lee, G.-C. Permeability and Strength of Pervious Concrete According to Aggregate Size and Blocking Material. Sustainability 2021, 13, 426. https://0-doi-org.brum.beds.ac.uk/10.3390/su13010426
AMA Style
Hung VV, Seo S-Y, Kim H-W, Lee G-C. Permeability and Strength of Pervious Concrete According to Aggregate Size and Blocking Material. Sustainability. 2021; 13(1):426. https://0-doi-org.brum.beds.ac.uk/10.3390/su13010426
Chicago/Turabian StyleHung, Vu Viet, Soo-Yeon Seo, Hyun-Woo Kim, and Gun-Cheol Lee. 2021. "Permeability and Strength of Pervious Concrete According to Aggregate Size and Blocking Material" Sustainability 13, no. 1: 426. https://0-doi-org.brum.beds.ac.uk/10.3390/su13010426
Note that from the first issue of 2016, this journal uses article numbers instead of page numbers. See further details here.