Economic Analysis of a Transport Company in the Aspect of Car Vehicle Operation


1
Faculty of Security, Logistics and Management, Military University of Technology, 00-908 Warsaw, Poland
2
Faculty of Mechanical Engineering, Military University of Technology, 00-908 Warsaw, Poland
*
Author to whom correspondence should be addressed.
Sustainability 2021, 13(1), 427; https://0-doi-org.brum.beds.ac.uk/10.3390/su13010427
Submission received: 2 December 2020
/
Revised: 28 December 2020
/
Accepted: 2 January 2021
/
Published: 5 January 2021
(This article belongs to the Section Sustainable Transportation)
Abstract
:The article describes the issues of transport of bulk materials. The knowledge of this process has a key impact on the rational planning of transport tasks. It is necessary to have knowledge about the transport services market and the competition that exists in it. In order to achieve a competitive advantage on the market, enterprises should analyze data on the implementation of transport tasks on an ongoing basis. It is also important that the costs incurred from the conducted activity are minimized, while increasing the quality of services and taking into account the sustainable development of the enterprise. The study analyzes data from a few selected motor vehicles in the period of 3 years of operation, coming from an enterprise specializing in the transport of bulk materials. Moreover, a global sensitivity analysis was performed based on a neural model describing the impact of the analyzed factors on the company’s profit. The results show that the most important factors influencing the company’s profit are the fuel consumption of individual vehicles, the driver (driving style) and the month (average temperature, weather conditions).
1. Introduction
It is difficult to indicate one universal definition of bulk materials, as it differs depending on the applicable regulations in a given country. Bulk materials are treated as loads composed of small, dry particles that are not bound together in any way or that break down easily into small elements. Examples of this type of material are sand, gravel, gypsum, cement, road salt, slag, cereal grains, flour, plant seeds, dyes, filling materials, soil, chemical powders, dust, ashes, soot, but also sugar, coffee and rice. The materials discussed do not have a compact structure, which means that their storage, loading and transport require the use of special devices that facilitate work and improve its efficiency. In the case of some bulk materials, such as sand or gravel, tarpaulins, tippers, or in special cases railway wagons are used. The used means of transport depends on the properties of the material being transported (sensitivity to weather conditions, etc.). Work with bulk materials is most often undertaken by specialized companies that have the necessary machines at their disposal and transport cargo by road [1,2]. In addition, information on the transport of bulk materials can be found on the websites of individual transport companies [3,4,5,6]. These are companies with many years of experience that are reluctant to provide information about their know-how.
No article was found on the subject of transport of loose materials with the use of a car fleet in the bases of Web of Science, Scopus, Scholar. Only one article was found which analyzed the profitability of transporting the raw material, i.e., timber, in Finland [7].
The transport of loose materials can also be carried out by sea, but it requires access to the sea, which is impossible in the case of many European countries, i.e., the Czech Republic, Slovakia, Austria, and Hungary [8]. The most important factors in this mode of transport to be taken into account are the short life of the food and possible spoilage during transport. The solution to these problems is to use the so-called reefer vessels. In scientific databases numerous patents of devices for loading/unloading goods and the results of their experimental analyses can be found [9,10,11].
Enterprises providing transport services try to meet the growing requirements of the modern market. Thus, companies rationally plan each transport task to maximize profits while reducing the cost of each participant in the process. Quality in this context can be divided into two categories. The first one is quality in technical terms, which is a very narrow concept and focuses on the properties of manufactured products. The second, in turn, is the economic approach, which is a set of requirements for an object, which include not only the properties of the product or service, but also, among others, price, time availability, customer preferences and feelings etc. These approaches are often combined with each other. Operating measure vehicle quality have a crucial impact on the evaluation of the implementation of transport services [12,13]. In turn, quality is a key aspect that allows a satisfactory position to be maintained on the market [14]. In turn, the economic analysis of the work of enterprises is the subject of many scientific articles. For this purpose, in addition to statistical methods, artificial intelligence methods are also used [15,16,17]. In addition, modern transport companies try to fit into the concept of sustainable development which is a proposal of a form of conscious individual and social life, on the basis of development together with the environment—social and natural, taking into account ecological limitations and social expectations. In terms of economics, the concept concerns economic stability, risk management and profitability, while in the case of the environment, it concerns environmental protection, pollution prevention, CO2 emission, logistics, etc. [18,19].
The subject of further analysis is an enterprise specializing in the transport of bulk materials, in particular organic cereals and loose food products. The main premise for choosing the aforementioned subject is the complexity of the process of transporting bulk materials, and more precisely the problems that arise at every stage starting from contact with the customer, the issues of loading and unloading, the subject of maintaining cleanliness of the cargo space and the conditions that must be met in the case of transport of organic products.
The aim of the article is a comprehensive analysis of the functioning of a mentioned enterprise, starting from the presentation of the issues of transport of bulk materials, a detailed description of all stages of transport (loading, route planning, unloading) and solutions implemented in the enterprise. The information mentioned was obtained through an interview with the employees of the discussed company registered in Poland and operating in Europe. The process of transporting loose materials is complex, there are many problems in it due to the interdependence of its individual participants, which makes it difficult to indicate even the simplest improvements. The human factor and weather conditions play a very important role here. To ensure a high level of customer service, it is necessary to make a detailed analysis of each element of the bulk materials transport process. Any delay or incorrect realization of any stage of the process can lead to undesirable situations, i.e., delay in delivery, inability to load for infrastructural or technical reasons, affecting future cooperation with customers. In addition, customers are still guided by the lowest price when choosing service provider, which is why it is important to indicate which factors have a direct impact on the company’s financial result. Issues related to the realization of transport tasks are described well in [20,21,22,23,24].
The company decided to remain anonymous, therefore, the authors did not obtain permission to indicate its name and publish photos related to them in any way, but they gained access to operational and financial data of parts of the car fleet of the aforementioned. enterprises in the period 2015–2018. This underlines the uniqueness of the content presented in the article.
A comprehensive description of the subject matter and the exact functioning of the company is the basis of this article, while its main goal is the statistical analysis of the data presented in the article, which, together with the sensitivity analysis, enable qualitative and quantitative assessment of the impact of individual operational factors on the company’s profit.
The results show that the most important factors influencing the company’s profit are the fuel consumption of individual vehicles, the driver (driving style) and the month (season—average temperature, weather conditions). On the other hand, factors such as working time, distance traveled or average speed also have some influence and allow for rational planning of the transport process. The rest of the factors taken into account have a negligible impact on the profit of the analyzed company.
2. Problems of Bulk Material Transport
2.1. Identification of the Problems of Transport of Bulk Materials
Transportation of bulk materials is a complex issue requiring a multilateral approach in terms of practical knowledge regarding the realization of the entire process, i.e., loading, transport and unloading [25,26]. It allows problems to be isolated during the whole process, sources of their occurrence identified, and special attention to be paid to the type of transported cargo (in technical aspect and taking into account the problem of keeping the means of transport clean).
The subject of the analysis is an enterprise dealing with the transport of loose products, i.e., cereals, animal feeds, substances and feed additives, loose vegetables, loose foods, such as flour, milk powder, etc. It has a GMP + (Good Manufacturing Practice Plus) certificate and employs of workers after series of special dedicated trainings. The certificate is necessary for cooperation with the Dutch and German fodder industry. The company employs 14 professional drivers and 3 people involved in the organization of transport processes. The company has its own car fleet, which is entire Volvo 4 × 2 tractor units.
Figure 1 shows the procedure for the transport of bulk materials operating in the enterprise. Due to the specificity of the company specializing in the transport of organic cereals, the main problem is the place of loading. Therefore, most of the loading operations take place on farms. The problem lies in the lack of technical and infrastructure facilities. Larger farms have loaders, truck scales and silos from which it is possible to load directly onto the semi-trailer body, while smaller farms do not have such facilities. The first problem in the whole process of loading occurs when goods need to be weighed. Vehicles in the company are equipped with a computer weight system, while most farmers require weighing the vehicle on the weight indicated by the shipper. Often the weight is several kilometers away from the loading place. The contractor is in many cases uninformed about this fact, often not through the fault of the client, because the shipper always assures the client that he has all the technical facilities for loading on site. The problem of location of the scale also applies to the working time of the plants in which the scale is located. After a few hours of loading, which usually ends in the afternoon, the place where weighing takes place is often closed, and as a result the driver is forced to wait until the next day. The result of the whole problem is the inability to accurately plan the vehicle’s travel time to the destination, as well as the prolonged unnecessary journeys of the driver which results in increasing working time (limited by law). Another factor that extends the loading time is the lack of appropriate equipment at the loader. The problem of the lack of infrastructure on this type of farms results from many factors, e.g., these farms are mainly focused on organic cereals production with low scale of money investment. The problem is mainly intensified in the fall–winter period. Moving a vehicle with a total weight of 40 tons is difficult on this type of surface. In most cases, it is impossible to move independently on this type of surface and requires assistance of a heavyweight farm tractor. Each of the problems mentioned above automatically reduce the active driver’s working time during the day and enforce downtime. As the result planning further routes become difficult and unable to provide reliable information to the customer about the time of arrival at the place of unloading.
The cereal transport is also characterized by the fact that the load can change its weight during transport. The phenomenon of weight loss of transported goods may occur during transport. Loads such as grains may lose weight as a result of atmospheric conditions (e.g., high temperature or low humidity).
The quality of cereals is a very important in the transport process. Despite the fact that the carrier is not responsible for the quality of the grain, it is still burdened with all the negative consequences associated with it. The problem is the absence of the customer during loading at the shipper. The process of controlling based on sending samples of the goods to the client, which then undergo quality control, while in the next step the price of the goods is negotiated between the seller and the buyer. The sample is filled with grain by the shipper and sent to the client, where it is subjected to laboratory analysis.
The shipper, by sending such a sample, undertakes at the same time that the goods with the parameters that were given in the analysis will be loaded onto the load box of the vehicle. However, cases have been observed suggesting that in practice it looks completely different. In the event of non-compliance of the quality of the goods at the place of unloading, the carrier is the first link to be verified. The cleanliness of the loading space is then questioned, which the loader must verify before loading. In the case of the analyzed company, a list of previously transported loads and cleaning method is kept, also after verifying the cleanliness of the loading surface and loading the goods, the transport company is released from liability for the quality of the goods. The inability to unload the goods due to poor quality in the place designated in the order, causes a number of negative consequences. Determining the new place of sale and the new price of the goods between the customer and the owner of the goods (shipper) often takes several hours. The new place of unloading is often a few hundred kilometers away from the original one, as well as cases in which the goods returned to the shipper were also observed. There is a high number of consequences of such an operation. The first in row is the inability to take the next order and the further consequences related to that fact, then the working and driving time of the driver is not used at all due to downtime caused by waiting for further steps. The next effect is the hidden costs of lost opportunities, which, despite compensation for downtime and redirection, still outweigh the income from the entire operation.
The issue of unloading service by enterprises receiving the goods is addressed primarily due to the minimization of operating costs. The main problem not only for Western grain processing companies, but also in other industries, is the lack of social and parking facilities for the driver. Unloading often takes place in the evening, then the driver is obliged to leave the plant and look for a parking space by the highway, while the number of available spaces is limited especially in the evening. Grain unloading often takes place in difficult conditions in terms of cleanliness, which is why plants of this type should provide the driver with the opportunity to take a shower. The result of the lack of the aforementioned facilities is usually a penalty for exceeding the standard working time intended for traveling to a safe stopping place which may lack of social facilities enable driver comfortable rest.
Unloading activities, in particular the duration and time of unloading are the most difficult to specify and define by manufacturing companies as recipients, in particular regarding bulk goods. Recently, it is increasingly necessary to book in advance so-called time window enabling entry to the production plant and unloading. In practice, the implementation of this type of solutions primarily requires changing the internal organization of companies. It involves standardizing the work and responsibilities of employees. In transporting bulk materials, however, it is difficult to choose a system that eliminates or reduces unloading downtime to the minimum. Enterprises processing cereals, fodder production, etc. are struggling with the problem of planning the amount of inventory needed for current production, which is why unloading the vehicle out of turn is a common case due to the need for a plant for a given product. In addition, such a plant would have to employ an additional person responsible for organizing and planning unloading times and purchase the necessary program.
The disadvantage of using the so-called time windows are the forwarder’s helplessness in situations that cannot be predicted, such as congestion, accidents, vehicle failures and unplanned stoppages at loading. However, in the process of planning and organizing of transports, it is a very helpful and useful tool for transport companies that streamline unloading processes, mainly time as well as the planning and executing of subsequent orders.
2.2. Economic Analysis of a Transport Enterprise with Regard to the Operating Factors of Vehicles
The company, having a modern vehicles fleet, needs drivers who will be able to handle it, including economic driving. The shortage of qualified drivers means that those who are available on the labor market do not have adequate knowledge, which generates additional driving costs, which are fuel costs (the main cost generator in revenues of about 40–45%), which can be reduced by maintaining proper driving economics and repair costs, which are also lower when the vehicle is operated by a qualified employee. Driver training in additional skills requires time and money. Today’s driver is not only a driver, but he is a vehicle manager, because he manages the route, which he performs and makes a number of independent decisions. His role is now completely different than it was a few years ago. The second troublesome barrier constituting the lack of qualifications is the lack of knowledge of German and English at the communicative level, which would significantly improve the process of loading and unloading in foreign enterprises.
The company strives to maintain the required, high level quality of services as part of cyclical implementation of customer orders. To transport of bulk loose and dry products, the right equipment and qualified staff is needed. It is also important to have many years of experience to prepare transport properly and anticipate possible difficulties. Means of transport are of great importance in transport activities. They constitute the main executive instrument in the transport process, therefore, great importance is put on the technical condition of vehicles to minimize the occurrence of any technical defects during transport that would affect the time of delivery to the customer. All repairs in the analyzed company are carried out in a planned preventive cycle. The system of preventive maintenance services includes actions related to the maintenance, operation, supervision and repair of machines, carried out according to a specific repair cycle. The idea of this system is to plan all maintenance and repair tasks in advance, including deadlines and scopes of respective tasks. The basis of planning are repair cycles, based on the work resource defined as service life. In this service system, the company avoids unforeseen repairs of vehicles abroad, where the repair costs are very high. Another advantage of this method of service is continuous transport availability, which minimizes any delays in the delivery of goods to the customer. It is also one of the factors thanks to which the company has an established position on the bulk materials market. In practice, it looks like the company makes minor repairs in its workshop, and only serious damage requires a visit to an authorized service center.
The subject of the analysis is the process of execution of transport tasks by 6 selected vehicles over a period of 36 months (each driver is assigned to a specific tractor unit).
Table 1 presents all analyzed variables together with their basic descriptive statistics, i.e., arithmetic mean, maximum and minimum value, and standard deviation. Most variables are quantitative variables which have been assigned specific figures. The database also contains qualitative variables, i.e., variables that have been described in words, i.e., driver or month.
Figure 2 presents selected monthly operational data for respective vehicles. i.e., distance. fuel consumption and monthly amount of the load transported by vehicles. The average monthly traveled distance by drivers was 13,147 km with a simultaneous average fuel consumption of 3795.11. Based on the presented data. it can be observed that the driving style of the driver has a significant impact on the fuel consumption (variables a and c have a small influence on the fuel consumption).
Considering the number of kilometers traveled with the load in relation to the distance traveled by drivers (Figure 3), it can be observed that the V05 driver had the lowest percentage of the distance with the load compared to other drivers (35.93% of the distance is so-called empty runs). In turn, the V04 driver’s vehicle was the optimal means of transport in terms of the aforementioned traveled distance with load (80.9%).
Figure 4 shows selected average monthly economic parameters of vehicles in 2015–2018 (36 months in total). The lowest fuel consumption was recorded for the V05 driver, the average monthly cost is 12,410 PLN, while the highest V02 (15,081 PLN). The average monthly cost of repair and service in individual years of use was respectively: 625 PLN, 431 PLN, 1035 PLN and 2161 PLN. The aforementioned costs were influenced by the V05 vehicle service due to the damage to the vehicle as a result of a road accident (June 2015). It can be seen that over the years, the costs of repairs and servicing increase. The highest average monthly profit was recorded for the V04 driver (5320 PLN).
Based on the economic analysis of 6 selected drivers in the transport company, it was pointed out that the application of sensitivity analysis to identify key factors affecting the financial situation of the company would be important for the given issues.
3. Analysis of Sensitivity of Selected Operating Factors to the Financial Result of the Enterprise
The presented financial results can be used to assess the impact of the factors described on the company’s profit. In order to carry out the sensitivity analysis mentioned in the previous chapter, it is necessary to create a mathematical model describing the considered data set. Mathematical modeling of the impact of the aforementioned number of factors (24 variables) on the company’s profit (4 variables) is a very complex process. In connection with the above, universal approximating and generalizing properties of neural networks were used to build the aforementioned model, which was created in the Statistica software (Automatic Neural Networks module). Therefore, the analyzed variables were divided into input and output variables of the created neural network:
Input Variables:
- Driver [-],
- Month [-],
- Time [h],
- Distance [km],
- Fuel consumption [l],
- Average load [%],
- Average percentage of traveled distance with load—per 1 delivery [%],
- Sum of load [t],
- Distance with the load [km],
- Distance without the load [km],
- Percentage of traveled distance with load per month [%],
- Number of orders [-],
- Average load volume per order [t],
- Average load per order [t],
- Average speed [km/h],
- Average number of brakes [number/100 km],
- Average number of stops [number/100 km],
- Exceeding the speed limit for the vehicle [%],
- Time in automatic mode [%],
- Idle work time [%],
- Working time in economy mode [%],
- Time out of economy mode [%],
- Inertial movement time [%],
- Time with cruise control [%].
Output Variables:
- Fuel costs [PLN],
- Other taxes and fees [PLN],
- Repairs and service [PLN],
- Profit [PLN].
The next stage of building a neural network model is determining the number of random subsets of data. The training set contains input data and associated reference responses. Part of the training set is used to teach the network using the selected learning algorithm, while the remaining part is divided into validation and test sets. The validation set performs periodic validation during teaching to prevent overfitting, while the test set is intended to carry out the final network check after learning, checking that the network has not lost its ability to generalize. The sets are separated randomly, while their number was adopted as follows: training set 80%, validation set 10% and test set 10%. In this work, the construction of a MLP (Multilayer Perceptron) neural network with one hidden layer is considered [27,28,29].
We created 5000 different variants of neural networks in Statistica software, characterized by a variable number of neurons in the output layer and various activation functions. Of the aforementioned number of neural networks, 50 networks were selected with a quality (learning) parameter > 0.95. Table 2 summarizes the learning of selected networks.
The data presented in Table 2 indicate a large diversity of results both among the network quality values: 0.565–0.735 (testing), 0.586–0.805 (validation), as well as the number of neurons in the hidden layer: 25–100. The most common activation functions are the logistic function and hyperbolic tangent. The BFGS (Broyden–Fletcher–Goldfarb–Shanno) algorithm was used to teach neural networks, which is one of the gradient methods. In addition, it is one of the most effective learning methods among conjugate gradients and the fast gradient methods. As the error function, the SOS (Sum of Squares) function was chosen, in which the error is the sum of squares of differences between the set values and output values from the neural network [27,30,31].
Then the optimal neural network was selected due to the maximization of the network quality index w:
where wi—i-th neural network quality indicator (i = 1…50), ai—i-th neural network quality (learning) (i = 1…50), bi—i-th neural network quality (testing) (i = 1…50) and ci—i-th neural network quality (validation) (i = 1…50).
wi = ai + bi + ci
The optimal neural network is MLP 24-100-4 (network ID: 116), which learning results are marked in yellow in Table 2. In turn, the learning process of the aforementioned network is shown in Figure 5. The network has achieved a minimal error in the learning and testing process in cycle No. 104. The optimal neural network is MLP 24-100-4 (network ID: 116), the learning results of which are marked in yellow in Table 2.
Global sensitivity analysis in the Statistica software is a useful tool to describe the analyzed data. It allows determining the validity of individual input variables of a neural network. It involves studying the neural network prediction error when for each input variable its values are converted into their arithmetic average value (derived from the training set). This approach causes these variables to cease to provide new information to the neural network, final prediction error of which may consequently change. It results that the analyzed neural network is characterized by some sensitivity to a specific input variable. For each network, a coefficient describing the increase in error when removing a given input variable is calculated (quotient of network error without a given variable in relation to the error with a set of inputs). If the mentioned value is 1 or less then 1, then the analyzed input variable can be removed permanently without loss of quality of the neural network [27,32,33].
The method also has some limitations. However, global sensitivity analysis for an identical data set is not universal in the sense that it relates to an individual neural network. The collected variables can be correlated with each other in various ways, which with a variable network architecture, different learning algorithms and even a random way of initiating the values of neural network weights generates a variety of results of the aforementioned analysis. For this reason, only conducting a sensitivity analysis for a number of neural models and the repeatability of results obtained provide the basis for drawing conclusions about the importance of variables [27,32,33,34].
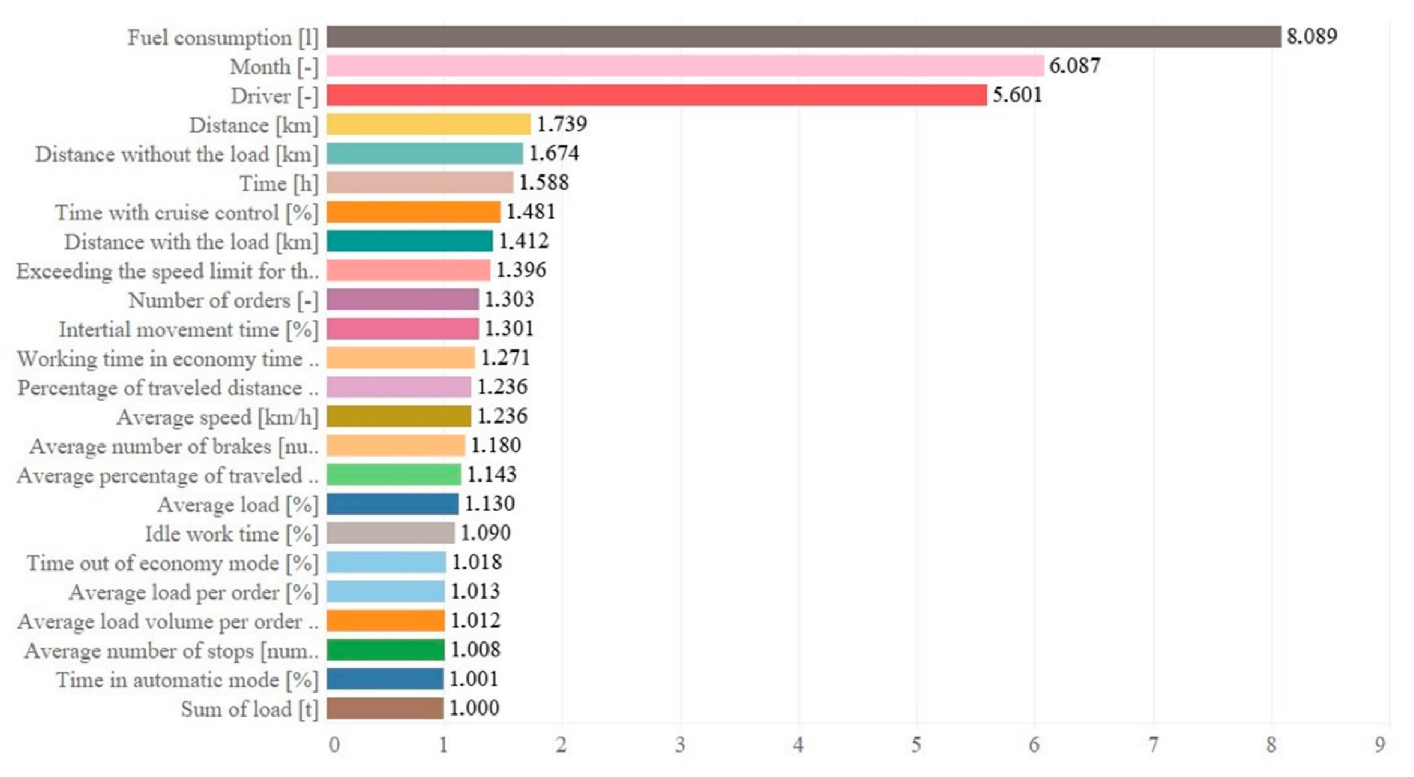
The sensitivity analysis shows that the variables that have the greatest impact on the economic situation of the company are total fuel consumption (8.089), month (6.097) and driver (5.601)—Figure 5. The rest of the variables have a much smaller impact, while the variables that achieved a value up to 1 have no significant effect on output variables and can be removed from the data set without losing network quality (the last 6 listed in the global sensitivity analysis).
In summary, it has been shown that 12.5% of the variables analyzed have the greatest impact on the company’s profit (3 factors: total fuel consumption, month and driver), 25% of the variables are completely redundant (the last 6 factors), while 62.5% have only partial impact (15 others) and may be a source of further business long-term savings.
4. Conclusions
Knowledge of bulk material transport issues allows proper planning of the execution of transport tasks, i.e., delivery time, or flexibility for changes during the process (e.g., adapting to changing the place of unloading). In the transport process, human and the means of transport are the main executive entities. To gain customer trust and acquire new orders, enterprises must equip themselves with the necessary means, i.e., appropriate fleet and qualified staff.
The statistical analysis performed shows that the fuel consumption and the driver influence the company’s financial result. These factors are related to each other because the driving style of the driver affects the average fuel consumption as well as the costs associated with the repair and servicing of vehicles. The results presented in the article can be used to select the so-called model driver, i.e., a driver who has the most balanced indicators of average fuel consumption, average number of stops and brakes, low repair and service costs, etc.
The global sensitivity analysis shows that some factors (6 in total), i.e., the sum of the load, time in automatic mode, etc. do not bring any relevant information to the neural model and can be removed without losing the quality of the network. In addition, the results of the analysis confirmed that companies should put special emphasis on driver training, as they have a huge impact on the company’s profit. Global sensitivity analysis has shown that the company’s profit mainly depends on the total fuel consumption and month, but the first of those variables is related to the driving style of the driver, while the second depends on external conditions, which the company has no major impact on.
Author Contributions
Conceptualization, M.R.; Methodology, M.R. and Ł.R.; Software, M.R. and Ł.R.; Validation, Ł.R.; Formal Analysis, Ł.R.; Investigation, M.R.; Resources, M.R.; Data Curation, M.R.; Writing–Original Draft Preparation, M.R. and Ł.R.; Writing–Review & Editing, M.R. and Ł.R.; Visualization, M.R. and Ł.R.; Supervision, Ł.R.; Project Administration, M.R.; Funding Acquisition, M.R. All authors have read and agreed to the published version of the manuscript.
Funding
This research received no external funding.
Institutional Review Board Statement
Not applicable.
Informed Consent Statement
Not applicable.
Data Availability Statement
The data presented in this study are available on request from the corresponding author. The data are not publicly available due to the decision of the transport company that the data pertain to.
Conflicts of Interest
The authors declare no conflict of interest.
References
- What Is Loose Cargo and Their Suitable Trailers? Available online: https://www.haulio.io/blog/what-is-loose-cargo-and-suitable-trailers/ (accessed on 27 December 2020).
- What Are Bulk Materials? Available online: https://tworzywa.org/artykuly/szczegoly/61624_czym-sa-materialy-sypkie (accessed on 27 December 2020). (In Polish).
- Transport of Loose Materials. Available online: http://www.locotranssped.pl/en/?transport-of-loose-materials (accessed on 27 December 2020).
- Fresh Cargo. Transport of Loose Materials. Available online: http://www.freshcargo.pl/en/oferta/transport-von-losem-material/ (accessed on 27 December 2020).
- Transport of Loose Materials. Transport with Silos Semi-trailers. Available online: http://procem.pl/transport-of-loose-materials.html (accessed on 27 December 2020).
- Transport and Storage of Loose Materials. Available online: http://stampa-ostrava.cz/en/products/transport-and-storage-of-loose-materials/ (accessed on 27 December 2020).
- Ranta, T.; Rinne, S. The profitability of transporting uncomminuted raw materials in Finland. Biomass Bioenergy 2006, 30, 231–237. [Google Scholar] [CrossRef]
- Cargo Transported Through the Shipping Industry. Available online: https://www.marineinsight.com/types-of-ships/8-major-types-of-cargo-transported-through-the-shipping-industry/ (accessed on 27 December 2020).
- Davydov, S.Y.; Kozhushko, G.G.; Sychev, S.N. Experimental study of unloading loose material from container pneumatic transport rotary container. Refract. Ind. Ceram. 2011, 52, 18–22. [Google Scholar] [CrossRef]
- Krambrock, W. Process and Equipment for Pneumatic and Hydraulic Transport of Bulk Materials through Pipes. U.S. Patent No. 4,715,748, 29 December 1987. [Google Scholar]
- Koskinen, T. Transport Container for the Transport of Bulk Material. U.S. Patent No. 4,909,556, 20 March 1990. [Google Scholar]
- Świderski, A. Eksploatacyjne aspekty oceny jakości technicznych środków transportu. Gospod. Mater. I Logistyka 2014, 5, 583–592. [Google Scholar]
- Ciastoń-Ciulkin, A. Jakość usług przewozowych i jej elementy składowe–ujęcie teoretyczne. Transp. Miej. Reg. 2015, 1, 24–30. [Google Scholar]
- Lezaun, M.; Pérez, G.; Sáinz de la Maza, E. Crew rostering problem in a public transport company. J. Oper. Res. Soc. 2006, 57, 1173–1179. [Google Scholar] [CrossRef]
- Turvey, R. Economic Analysis and Public Enterprises; Routledge: London, UK, 2019; pp. 1–140. [Google Scholar]
- Krulický, T. Using Kohonen networks in the analysis of transport companies in the Czech Republic. In SHS Web of Conferences; IES2018; EDP Sciences: Les Ulis, France, 2019; Volume 61, pp. 1–12. [Google Scholar]
- Vochozka, M.; Machová, V. Determination of value drivers for transport companies in the Czech Republic. NAŠE MORE Znan. Stručni Časopis Za More i POMOR 2018, 65, 197–201. [Google Scholar] [CrossRef] [Green Version]
- Płaczek, E. Zrównoważony rozwój–nowym wyzwaniem dla współczesnych operatorów logistycznych. Pr. Nauk. Politech. Warsz. Transport. 2012, 84, 79–92. [Google Scholar]
- Elliott, J. An Introduction to Sustainable Development; Routledge: London, UK, 2012; pp. 8–180. [Google Scholar]
- Jóźwiak, A.; Owczarek, P.; Prochowski, L.; Świderski, A. Analysis of the impact of the use time of N1 motor vehicles on the economic efficiency of their maintenance. Eksploat. I Niezawodn. Maint. Reliab. 2020, 22, 121–129. [Google Scholar] [CrossRef]
- Kijek, M.; Rykała, L.; Zelkowski, J.; Brzeziński, M. Neural Algorithm of Driver Selection for Transport Tasks. In Proceedings of the 22nd International Conference, Transport Means, Kaunas, Lithuania, 3–5 October 2018; pp. 489–494. [Google Scholar]
- Kijek, M.; Rykała, Ł.; Zelkowski, J. Rozmyta metoda wyboru kierowcy do realizacji zadań transportowych. Gospod. Mater. I Logistyka 2019, 5, 15–24. [Google Scholar] [CrossRef]
- Świderski, A.; Jóźwiak, A.; Jachimowski, R. Operational quality measures of vehicles applied for the transport services evaluation using artificial neural networks. Eksploat. I Niezawodn. Maint. Reliab. 2018, 20, 292–299. [Google Scholar] [CrossRef]
- Świderski, A. Neural modelling of process risk estimation in quality management. Pol. J. Commod. Sci. 2008, 4, 9–17. [Google Scholar]
- Decortis, F.; Noirfalise, S.; Saudelli, B. Activity theory, cognitive ergonomics and distributed cognition: Three views of a transport company. Int. J. Hum. Comput. Stud. 2000, 53, 5–33. [Google Scholar] [CrossRef]
- Verhoef, E. External effects and social costs of road transport. Transp. Res. Part A Policy Pract. 1994, 28, 273–287. [Google Scholar] [CrossRef]
- Rabiej, M. Statistical Analysis with Statistica and Excel; Helion: Warsaw, Poland, 2018; pp. 355–372. (In Polish) [Google Scholar]
- Tadeusiewicz, R.; Szaleniec, M. Lexicon of Neural Networks; Projekt Nauka; Fundacja na rzecz promocji nauki polskiej: Warsaw, Poland, 2015; pp. 17–133. (In Polish) [Google Scholar]
- Zhang, G.; Patuwo, B.E.; Hu, M.Y. Forecasting with artificial neural networks: The state of the art. Int. J. Forecast. 1998, 14, 35–62. [Google Scholar] [CrossRef]
- Hinton, G.E.; Salakhutdinov, R.R. Reducing the dimensionality of data with neural networks. Science 2006, 313, 504–507. [Google Scholar] [CrossRef] [PubMed] [Green Version]
- Homma, T.; Saltelli, A. Importance measures in global sensitivity analysis of nonlinear models. Reliab. Eng. Syst. Saf. 1996, 52, 1–17. [Google Scholar] [CrossRef]
- Campolongo, F.; Cariboni, J.; Saltelli, A. An effective screening design for sensitivity analysis of large models. Environ. Model. Softw. 2007, 22, 1509–1518. [Google Scholar] [CrossRef]
- Statsoft Electronic Statistics Textbook. Available online: https://www.statsoft.pl/textbook/stathome.html (accessed on 3 December 2020).
- Helton, J.C.; Johnson, J.D.; Sallaberry, C.J.; Storlie, C.B. Survey of sampling-based methods for uncertainty and sensitivity analysis. Reliab. Eng. Syst. Saf. 2006, 91, 1175–1209. [Google Scholar] [CrossRef] [Green Version]
Figure 1.
Algorithm of the implementation of the loose materials transport process.

Figure 2.
Selected data during 36 months of vehicle operation for individual drivers: V01. V02. V03. V04. V05. V06: (a) average monthly distance traveled by drivers; (b) average monthly fuel consumption and (c) average monthly mass of cargo transported.
Figure 2.
Selected data during 36 months of vehicle operation for individual drivers: V01. V02. V03. V04. V05. V06: (a) average monthly distance traveled by drivers; (b) average monthly fuel consumption and (c) average monthly mass of cargo transported.

Figure 3.
The average monthly distance traveled by individual drivers with a load together with the percentage of the distance.
Figure 3.
The average monthly distance traveled by individual drivers with a load together with the percentage of the distance.

Figure 4.
Economic aspects of vehicle operation during 4 years of operation: (a) V01 driver, (b) V02 driver, (c) V03 driver, (d) V04 driver, (e) V05 driver and (f) V06 driver, where: 1. Average monthly fuel costs, 2 Repair and service costs, 3. Other taxes and fees (road tax, vignettes, environmental fee, parking fees) and 4. Financial result.


Figure 5.
Results of global sensitivity analysis.


Table 1.
Basic descriptive statistics of the data set.
| Variable | Arithmetic Mean | Minimum | Maximum | Standard Deviation |
|---|---|---|---|---|
| Driver [-] | - | V01 | V06 | - |
| Month [-] | - | January | December | - |
| Time [h] | 204.08 | 129.35 | 239.47 | 20.737 |
| Distance [km] | 13,417.84 | 8491.82 | 16,027.11 | 1347.904 |
| Fuel consumption [l] | 3887.29 | 2503.67 | 4683.75 | 370.253 |
| Average load [%] | 100.27 | 92.248 | 107.23 | 2.587 |
| Average percentage of traveled distance with load—per one delivery [%] | 74.27 | 51.518 | 89.55 | 7.433 |
| Sum of load [t] | 308.53 | 99.6 | 565.66 | 53.752 |
| Distance with the load [km] | 10,932.25 | 6281.78 | 13,637.08 | 1369.927 |
| Distance without the load [km] | 2484.47 | 1090.56 | 6400.16 | 861.57 |
| Percentage of traveled distance with load per month [%] | 81.48 | 53.39 | 92.01 | 6.063 |
| Number of orders [-] | 12.19 | 4 | 17 | 1.95 |
| Average load volume per order [t] | 25.31 | 22.71 | 47.14 | 1.92 |
| Average load per order [%] | 101.25 | 90.80 | 188.55 | 7.681 |
| Average speed [km/h] | 74 | 66.43 | 78.23 | 1.991 |
| Average number of brakes [number/100 km] | 38.39 | 18 | 74 | 10.351 |
| Average number of stops [number/100 km] | 9.35 | 5 | 132 | 8.586 |
| Exceeding the speed limit for the vehicle [%] | 32.81 | 4.00 | 64.70 | 15.989 |
| Time in automatic mode [%] | 99.32 | 82.40 | 100.00 | 1.496 |
| Idle work time [%] | 9 | 1.60 | 25.30 | 2.696 |
| Working time in economy mode [%] | 74.69 | 60.00 | 84.20 | 4.389 |
| Time out of economy mode [%] | 1.35 | 0.00 | 22.60 | 1.702 |
| Inertial movement time [%] | 9.78 | 3.70 | 18.90 | 2.967 |
| Time with cruise control [%] | 37.5 | 1.40 | 64.30 | 12.47 |
| Fuel costs [PLN] | 14,239.76 | 9614.93 | 17,546.35 | 1593.904 |
| Other taxes and fees (road tax. vignettes. environmental fee. parking fees) [PLN] | 4748.89 | 82.68 | 6405.69 | 758.45 |
| Repairs and service [PLN] | 6165.22 | 107.33 | 8316.16 | 984.659 |
| Profit [PLN] | 5998.59 | 104.43 | 8091.40 | 958.046 |
Table 2.
Summary of learning of selected neural networks.
| Netw. Id | Netw. Name | Quality (Learn.) | Quality (Test.) | Quality (Val.) | Error (Learn.) | Error (Test.) | Error (Val.) | Learn. Alg. | Error Fun. | Activ. (Hidden) | Activ. (Output) |
|---|---|---|---|---|---|---|---|---|---|---|---|
| 9 | MLP (Multilayer Perceptron) 24-30-4 | 0.981 | 0.593 | 0.656 | 77,280 | 1320.557 | 1837.470 | BFGS (Broyden–Fletcher–Goldfarb–Shanno) 76 | SOS (Sum of Squares) | Tanh. (Hyperbolic Tangent) | Logist. (Logistic) |
| 24 | MLP 24-50-4 | 0.969 | 0.573 | 0.738 | 118.122 | 1261.096 | 1725.523 | BFGS 77 | SOS | Logist. | Logist. |
| 116 | MLP 24-100-4 | 0.976 | 0.780 | 0.800 | 93,371 | 799.017 | 1615.015 | BFGS 104 | SOS | Tanh. | Tanh. |
| 128 | MLP 24-60-4 | 0.966 | 0.565 | 0.721 | 130.797 | 1283.108 | 1616.721 | BFGS 89 | SOS | Logist. | Tanh. |
| 151 | MLP 24-25-4 | 0.979 | 0.652 | 0.586 | 88,873 | 1227.042 | 2124.180 | BFGS 68 | SOS | Tanh. | Logist. |
| 167 | MLP 24-30-4 | 0.984 | 0.638 | 0.791 | 67,307 | 1042.167 | 1149.626 | BFGS 75 | SOS | Tanh. | Logist. |
| 172 | MLP 24-30-4 | 0.955 | 0.646 | 0.659 | 156.271 | 1191.538 | 1839.116 | BFGS 75 | SOS | Exp. (Exponential) | Exp. |
| 289 | MLP 24-25-4 | 0.968 | 0.699 | 0.682 | 140.052 | 1008.125 | 1707.705 | BFGS 67 | SOS | Logist. | Logist. |
| 291 | MLP 24-25-4 | 0.967 | 0.735 | 0.703 | 130.636 | 926.265 | 1642.825 | BFGS 78 | SOS | Tanh. | Tanh. |
| 292 | MLP 24-25-4 | 0.955 | 0.690 | 0.792 | 171.848 | 1032.580 | 2452.324 | BFGS 69 | SOS | Tanh. | Tanh. |
| 305 | MLP 24-25-4 | 0.962 | 0.724 | 0.621 | 139.626 | 731.569 | 1807.062 | BFGS 75 | SOS | Tanh. | Exp. |
| 309 | MLP 24-25-4 | 0.967 | 0.632 | 0.805 | 125.578 | 1,040,330 | 1,140,767 | BFGS 73 | SOS | Tanh. | Exp. |
Publisher’s Note: MDPI stays neutral with regard to jurisdictional claims in published maps and institutional affiliations. |
© 2021 by the authors. Licensee MDPI, Basel, Switzerland. This article is an open access article distributed under the terms and conditions of the Creative Commons Attribution (CC BY) license (http://creativecommons.org/licenses/by/4.0/).
Share and Cite
MDPI and ACS Style
Rykała, M.; Rykała, Ł. Economic Analysis of a Transport Company in the Aspect of Car Vehicle Operation. Sustainability 2021, 13, 427. https://0-doi-org.brum.beds.ac.uk/10.3390/su13010427
AMA Style
Rykała M, Rykała Ł. Economic Analysis of a Transport Company in the Aspect of Car Vehicle Operation. Sustainability. 2021; 13(1):427. https://0-doi-org.brum.beds.ac.uk/10.3390/su13010427
Chicago/Turabian StyleRykała, Magdalena, and Łukasz Rykała. 2021. "Economic Analysis of a Transport Company in the Aspect of Car Vehicle Operation" Sustainability 13, no. 1: 427. https://0-doi-org.brum.beds.ac.uk/10.3390/su13010427
Note that from the first issue of 2016, this journal uses article numbers instead of page numbers. See further details here.